We are working with Cambridge Assessment International Education towards endorsement of this title. Any references or material related to answers, grades, papers or examinations are based on the opinion of the author(s). 2 Programming constructs
Flowchart design A flowchart is often created in two stages. Stage 1
LE
Plan the logic and order of the system. The flowchart will show the intended sequence. It will include the inputs, outputs, decisions and processes required. At this stage, the process rectangle and decision diamonds are likely to include a text description of the processes or decision that must be made. There may be little, if any, detail provided about how the decisions or processes will be completed. This is known as high-level design and allows the programmer to check the logic of the system. Stage 2
The decisions and processes will be added to provide details about how they will be completed. As the design develops, you will be able to consider the factors involved in each process and include a greater level of detail about each process. At this stage, a programmer may discover that they need additional inputs to be able to complete the process effectively. Wherever possible the final flowchart should include well-defined processes. Effective flowcharts avoid ambiguity.
P
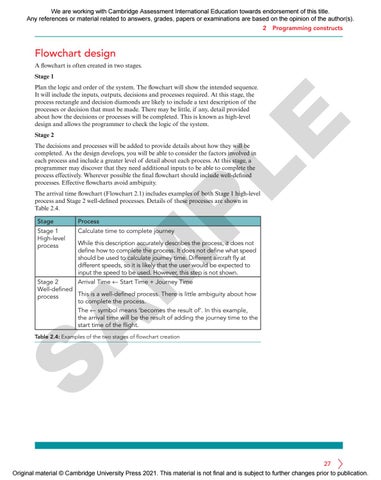
The arrival time flowchart (Flowchart 2.1) includes examples of both Stage 1 high-level process and Stage 2 well-defined processes. Details of these processes are shown in Table 2.4. Stage
Process
Stage 1 High-level process
Calculate time to complete journey
M
While this description accurately describes the process, it does not define how to complete the process. It does not define what speed should be used to calculate journey time. Different aircraft fly at different speeds, so it is likely that the user would be expected to input the speed to be used. However, this step is not shown.
A
Stage 2 Arrival Time ← Start Time + Journey Time Well-defined This is a well-defined process. There is little ambiguity about how process to complete the process. The ← symbol means ‘becomes the result of’. In this example, the arrival time will be the result of adding the journey time to the start time of the flight.
S
Table 2.4: Examples of the two stages of flowchart creation
27 Original material © Cambridge University Press 2021. This material is not final and is subject to further changes prior to publication.