Cambridge IGCSE Geography
Migration
Case Study An international migration – Qatar From pearl fishing to prosperity Life in Qatar before 1930 involved widespread poverty, malnutrition and disease. Most people worked in the pearl fishing industry but that collapsed when the Japanese began to make artificial pearls. In 1935 the arrival of oil prospectors signalled a new future for the state. The Second World War of 1939–45 delayed oil production for ten years but, once production began, the oil income changed this tiny, impoverished nation into one with the second highest per capita income in the world.
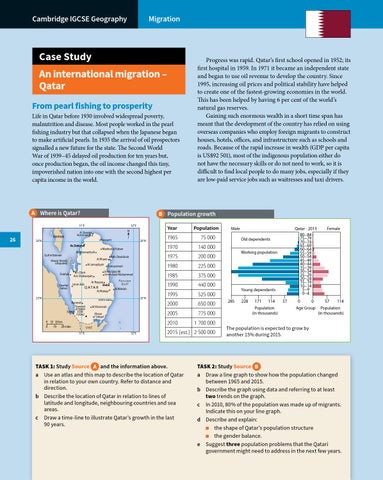
Where is Qatar?
Population growth
51°E
26
52°E
Year
N
Ar Ruways Ash Shamhi
BAHRAIN
Fuwayrit
26°N
26°N
Az Zubarah Madinat al Kaban Al Ghuwayriyah
Gulf of Bahrain
Dawhat Salwa
Adh Dhakhirah
Al Khawr
Hawar Islands (disputed)
Dukhäh
Al Jumayliyah
Sumaysimah Umm Salal Ali Umm Salal Muhammed
Bi’r Zikrit Ash Shahaniyah Umm Bab
Ar Rayyan Doha
Q ATA R
Al Wukayr
25°N Karanah Tuwayyir al Hamir Salwa 333ft. (103m)
Persian Gulf Al Wakrah 25°N
Umm Said Al Kharrarah Khwar al ’Udayd
0 10 20 km 0
10
Progress was rapid. Qatar’s first school opened in 1952; its first hospital in 1959. In 1971 it became an independent state and began to use oil revenue to develop the country. Since 1995, increasing oil prices and political stability have helped to create one of the fastest-growing economies in the world. This has been helped by having 6 per cent of the world’s natural gas reserves. Gaining such enormous wealth in a short time span has meant that the development of the country has relied on using overseas companies who employ foreign migrants to construct houses, hotels, offices, and infrastructure such as schools and roads. Because of the rapid increase in wealth (GDP per capita is US$92 501), most of the indigenous population either do not have the necessary skills or do not need to work, so it is difficult to find local people to do many jobs, especially if they are low-paid service jobs such as waitresses and taxi drivers.
20 miles
UAE 51°E
52°E
Population
1965
75 000
1970
140 000
1975
200 000
1980
225 000
1985
375 000
1990
440 000
1995
525 000
2000
650 000
2005
775 000
2010
1 700 000
2015 (est.) 2 500 000
TASK 1: Study Source and the information above. a Use an atlas and this map to describe the location of Qatar in relation to your own country. Refer to distance and direction. b Describe the location of Qatar in relation to lines of latitude and longitude, neighbouring countries and sea areas. c Draw a time-line to illustrate Qatar’s growth in the last 90 years.
Qatar - 2013 80−84 75−79 70−74 65−69 60−64 55−59 50−54 45−49 40−44 35−39 30−34 25−29 20−24 15−19 10−14 5−9 0−4
Male Old dependents Working population
Young dependents 285
228
171
114
Population (in thousands)
57
0
0
Age Group
Female
57
114
Population (in thousands)
The population is expected to grow by another 15% during 2015.
TASK 2: Study Source a Draw a line graph to show how the population changed between 1965 and 2015. b Describe the graph using data and referring to at least two trends on the graph. c In 2010, 80% of the population was made up of migrants. Indicate this on your line graph. d Describe and explain: ■ the shape of Qatar’s population structure ■ the gender balance. e Suggest three population problems that the Qatari government might need to address in the next few years.