Chapter 1: Representation of data
c What percentage of the companies have more than 30 employees? d Determine which of the three rows in the stem-and-leaf diagram contains the smallest number of: i companies
ii employees.
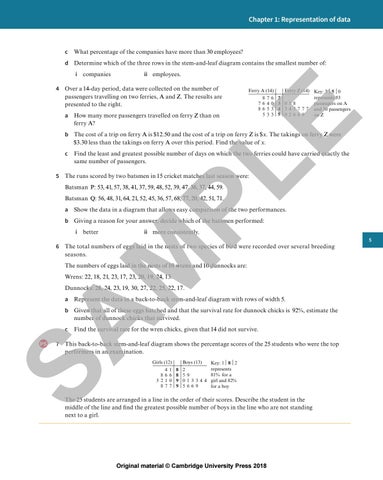
4 Over a 14-day period, data were collected on the number of passengers travelling on two ferries, A and Z. The results are presented to the right.
Ferry A (14) 7 4 5 3
6 0 3 3
Ferry Z (14) Key: 3 5 0 represents 53 passengers on A and 50 passengers on Z
2 3 058 4 345777 5 02669
E
a How many more passengers travelled on ferry Z than on ferry A?
8 76 86 5
b The cost of a trip on ferry A is $12.50 and the cost of a trip on ferry Z is $x. The takings on ferry Z were $3.30 less than the takings on ferry A over this period. Find the value of x.
PL
c Find the least and greatest possible number of days on which the two ferries could have carried exactly the same number of passengers. 5 The runs scored by two batsmen in 15 cricket matches last season were: Batsman P: 53, 41, 57, 38, 41, 37, 59, 48, 52, 39, 47, 36, 37, 44, 59.
Batsman Q: 56, 48, 31, 64, 21, 52, 45, 36, 57, 68, 77, 20, 42, 51, 71.
a Show the data in a diagram that allows easy comparison of the two performances. b Giving a reason for your answer, decide which of the batsmen performed: i better
ii more consistently.
SA M
6 The total numbers of eggs laid in the nests of two species of bird were recorded over several breeding seasons. The numbers of eggs laid in the nests of 10 wrens and 10 dunnocks are:
Wrens: 22, 18, 21, 23, 17, 23, 20, 19, 24, 13.
Dunnocks: 28, 24, 23, 19, 30, 27, 22, 25, 22, 17.
a Represent the data in a back-to-back stem-and-leaf diagram with rows of width 5. b Given that all of these eggs hatched and that the survival rate for dunnock chicks is 92%, estimate the number of dunnock chicks that survived. c Find the survival rate for the wren chicks, given that 14 did not survive.
PS
7 This back-to-back stem-and-leaf diagram shows the percentage scores of the 25 students who were the top performers in an examination. Girls (12) 4 86 321 87
1 6 0 7
Boys (13)
8 8 9 9
Key: 1 8 2 represents 2 81% for a 59 0 1 3 3 4 4 girl and 82% 5669 for a boy
The 25 students are arranged in a line in the order of their scores. Describe the student in the middle of the line and find the greatest possible number of boys in the line who are not standing next to a girl.
Original material Š Cambridge University Press 2018
5