Cambridge International AS & A Level Mathematics: Probability & Statistics 1
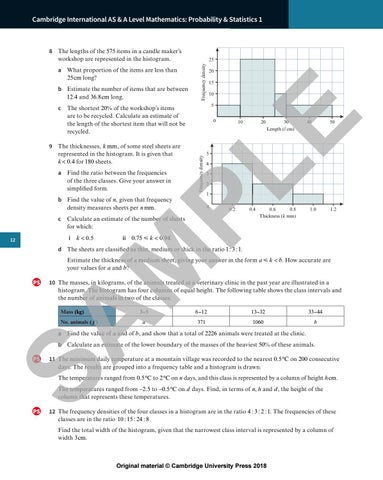
8 The lengths of the 575 items in a candle maker’s workshop are represented in the histogram.
20 15 10 5
c The shortest 20% of the workshop’s items are to be recycled. Calculate an estimate of the length of the shortest item that will not be recycled.
0
5 4
a Find the ratio between the frequencies of the three classes. Give your answer in simplified form.
b Find the value of n, given that frequency density measures sheets per n mm.
i k < 0.5
30 Length (l cm)
40
50
3 2 1
0
0.2
c Calculate an estimate of the number of sheets for which: 12
20
10
PL
Frequency density
9 The thicknesses, k mm, of some steel sheets are represented in the histogram. It is given that k < 0.4 for 180 sheets.
E
b Estimate the number of items that are between 12.4 and 36.8cm long.
Frequency density
a What proportion of the items are less than 25cm long?
25
0.4
0.6 0.8 Thickness (k mm)
1.0
1.2
ii 0.75 ø k < 0.94.
SA M
d The sheets are classified as thin, medium or thick in the ratio 1: 3 : 1.
Estimate the thickness of a medium sheet, giving your answer in the form a < k < b. How accurate are your values for a and b?
PS
10 The masses, in kilograms, of the animals treated at a veterinary clinic in the past year are illustrated in a histogram. The histogram has four columns of equal height. The following table shows the class intervals and the number of animals in two of the classes. Mass (kg)
No. animals ( f )
3–5
6–12
13–32
33–44
a
371
1060
b
a Find the value of a and of b, and show that a total of 2226 animals were treated at the clinic. b Calculate an estimate of the lower boundary of the masses of the heaviest 50% of these animals.
PS
11 The minimum daily temperature at a mountain village was recorded to the nearest 0.5 °C on 200 consecutive days. The results are grouped into a frequency table and a histogram is drawn. The temperatures ranged from 0.5 °C to 2 °C on n days, and this class is represented by a column of height h cm.
The temperatures ranged from –2.5 to –0.5 °C on d days. Find, in terms of n, h and d , the height of the column that represents these temperatures.
PS
12 The frequency densities of the four classes in a histogram are in the ratio 4 : 3 : 2 : 1. The frequencies of these classes are in the ratio 10 : 15 : 24 : 8. Find the total width of the histogram, given that the narrowest class interval is represented by a column of width 3cm.
Original material © Cambridge University Press 2018