Deducing velocity from a displacement–time graph
velocity v =
A toy car moves along a straight track. Its displacement at different times is shown in Table 1.3. This data can be used to draw a displacement–time graph from which we can deduce the car’s velocity. Displacement / m
1.0
3.0
5.0
7.0
7.0
7.0
Time / s
0.0
1.0
2.0
3.0
4.0
5.0
Table 1.3 Displacement (s) and time (t) data for a toy car.
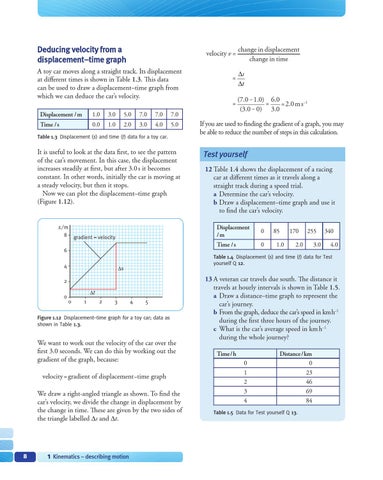
It is useful to look at the data first, to see the pattern of the car’s movement. In this case, the displacement increases steadily at first, but after 3.0 s it becomes constant. In other words, initially the car is moving at a steady velocity, but then it stops. Now we can plot the displacement–time graph (Figure 1.12).
s/m 8
gradient = velocity
6 4
∆s
∆t 0
1
2
3
4
5
Figure 1.12 Displacement–time graph for a toy car; data as shown in Table 1.3.
We want to work out the velocity of the car over the first 3.0 seconds. We can do this by working out the gradient of the graph, because: velocity = gradient of displacement−time graph We draw a right-angled triangle as shown. To find the car’s velocity, we divide the change in displacement by the change in time. These are given by the two sides of the triangle labelled ∆s and ∆t.
8
1 Kinematics – describing motion
=
∆s ∆t
=
(7.0 – 1.0) 6.0 = = 2.0 m s−1 (3.0 – 0) 3.0
If you are used to finding the gradient of a graph, you may be able to reduce the number of steps in this calculation.
Test yourself 12 Table 1.4 shows the displacement of a racing car at different times as it travels along a straight track during a speed trial. a Determine the car’s velocity. b Draw a displacement–time graph and use it to find the car’s velocity. Displacement /m
0
Time / s
0
85
170
1.0
255
2.0
3.0
340 4.0
Table 1.4 Displacement (s) and time (t) data for Test yourself Q 12.
2 0
change in displacement change in time
13 A veteran car travels due south. The distance it travels at hourly intervals is shown in Table 1.5. a Draw a distance–time graph to represent the car’s journey. b From the graph, deduce the car’s speed in km h−1 during the first three hours of the journey. c What is the car’s average speed in km h−1 during the whole journey? Time / h 0 1 2 3 4
Distance / km 0 23 46 69 84
Table 1.5 Data for Test yourself Q 13.