For example, how far does a spacecraft travelling at 40 000 km h−1 travel in one day? Since there are 24 hours in one day, we have: distance travelled = 40 000 km h−1 × 24 h = 960 000 km
Test yourself 8 A submarine uses sonar to measure the depth of water below it. Reflected sound waves are detected 0.40 s after they are transmitted. How deep is the water? (Speed of sound in water = 1500 m s−1.) 9 The Earth takes one year to orbit the Sun at a distance of 1.5 × 10¹¹ m. Calculate its speed. Explain why this is its average speed and not its velocity.
11 Sketch a displacement–time graph to show your motion for the following event. You are walking at a constant speed across a field after jumping off a gate. Suddenly you see a bull and stop. Your friend says there’s no danger, so you walk on at a reduced constant speed. The bull bellows, and you run back to the gate. Explain how each section of the walk relates to a section of your graph.
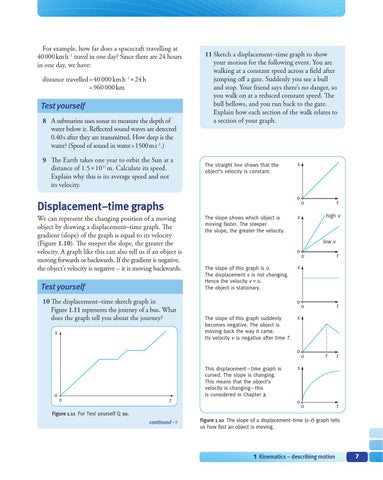
The straight line shows that the object’s velocity is constant.
s
0
Displacement–time graphs We can represent the changing position of a moving object by drawing a displacement–time graph. The gradient (slope) of the graph is equal to its velocity (Figure 1.10). The steeper the slope, the greater the velocity. A graph like this can also tell us if an object is moving forwards or backwards. If the gradient is negative, the object’s velocity is negative – it is moving backwards.
Test yourself 10 The displacement–time sketch graph in Figure 1.11 represents the journey of a bus. What does the graph tell you about the journey? s
The slope shows which object is moving faster. The steeper the slope, the greater the velocity.
0
t
t high v
s
low v 0 The slope of this graph is 0. The displacement s is not changing. Hence the velocity v = 0. The object is stationary.
0 The slope of this graph suddenly becomes negative. The object is moving back the way it came. Its velocity v is negative after time T.
This displacement – time graph is curved. The slope is changing. This means that the object’s velocity is changing – this is considered in Chapter 2.
0
t
0
t
s
s
0
0
0
0
T
t
s
0
0
t
Figure 1.11 For Test yourself Q 10. continued
Figure 1.10 The slope of a displacement–time (s–t) graph tells us how fast an object is moving.
1 Kinematics – describing motion
7