8 minute read
Recent Trends


Cumberland University
Founded in 1842, Cumberland University offers a variety of educational, athletic and social experiences to enhance the learning opportunities of the current student body. The university has an exceptional academic program steeped in the liberal arts, business, technology, nursing and many other fields. The University’s athletic teams regularly compete for conference and national championships. Cumberland University is located in Lebanon, Tennessee, 30 miles east of Nashville.
President . . . . . . . . . . . . . . . . . . . Dr. Paul Stumb Provost . . . . . . . . . . . . . . . Dr. C. William McKee Dean, Labry School . . . . . . . . . Dr. Chris Fuller Wilson County Trends Editor Dr. Steve Shao
Recent Trends
This section presents time series and cross sectional graphs depicting economic activity in Wilson County (WC), Tennessee, from year 2019 to the second business quarter of 2020. As the following data and graphs show, Wilson County is home to a thriving regional economy.
Population
As of July 1st, 2019, the total population of Wilson County (WC), Tennessee was 144,657, a 26.8% increase over the April 1st, 2010 federal census count of 113, 993. WC’s population growth in the last decade is unprecedented. In comparison, we note that the population growth rates of Tennessee and the nation overall were 7.6% and 6.3%, respectively.1
Number of Business Establishments
In 2019, Wilson County was home to 3,087 businesses, a 6.23% increase over the 2,906 residing in the county the year before. In the second quarter of 2020, the number of business establishments operating in Wilson County grew to 3,211.
WC today is primarily a service economy. The county’s 2019 business community consisted of 472 goods-producers (15.3% of the total private economy) and 2,615 service providers (84.7%), representing increases of 2% and 7% over the previous year. We note that the number of business establishments in WC increased in all major industry categories from 2018 to 2Q2020.
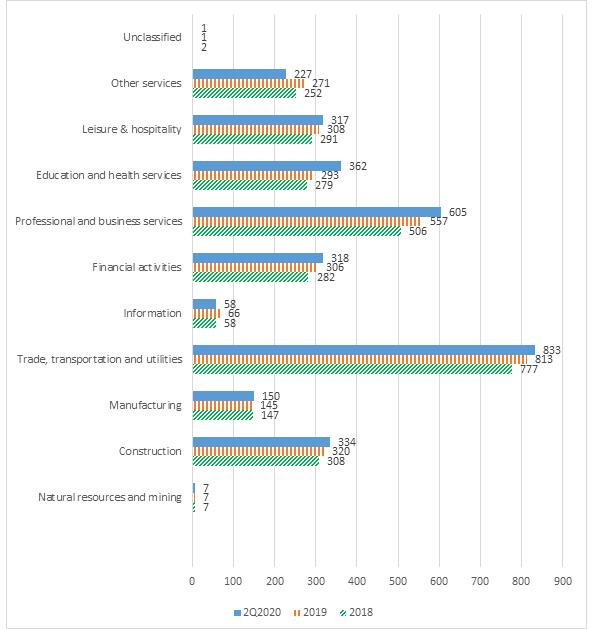
By number of establishments, WC’s top industry supersector in 2019 continues to be Trade, Transportation & Utilities2 (813 firms, or 26.3% of the private industry total) as the largest industry category. Professional & Business Services3 (557 firms, or 18%) are the next largest. A near three-way tie exists for third place among Construction (320 firms, or 10.3%), Leisure & Hospitality4 (308 firms, or 10%) and Financial Service Providers (306 firms, or 9.1%). Notably, Private Education and Health Service Providers was the seventh largest industry category (out of ten categories) with 293 firms, or 9.5% of the total. Interestingly, the WC industries with the two highest annual changes from the previous year (2018 vs. 2019) were the Information and Professional & Business Services categories, with annual growth rates of 13.8% and 10.1%, respectively. The 623 total WC firms in these two industry categories represent a significant 20% of the county’s total economy. See Fig. R1.
Wilson County’s local economy is particularly well
1 Source: U.S. Census Bureau 2 NAICS Supersector 40 (Trade, transportation, and utilities) consists of Sectors 42 (Wholesale Trade), 44-45 (Retail Trade), 48-49 (Transportation and Warehousing) and 22 (Utilities). 3 NAICS Supersector 60 (Professional and business services) consists of Sectors 54 (Professional, Scientific, and Technical Services), 55 (Management of Companies and Enterprises), and 56 (Administrative and Support and Waste Management and Remediation Services). 4 NAICS Supersector 70 (Leisure & hospitality) consists of Sectors 71 (Arts, entertainment, & recreation), and 72 (Accommodation & food services). 5 Source: U.S. Bureau of Labor Statistics. Location quotients are ratios that allow an area’s distribution of employment by industry, ownership, and size class to be compared to a reference area’s distribution. The U.S. is used as the reference area for all LQs noted in this report. The reference industry is always the all-industry, all-ownerships total for the local area, and for the nation.
Figure R1 Number of Business Establishments by Industry in Wilson County TN, 2018-2Q2020 Source: US Department of Labor
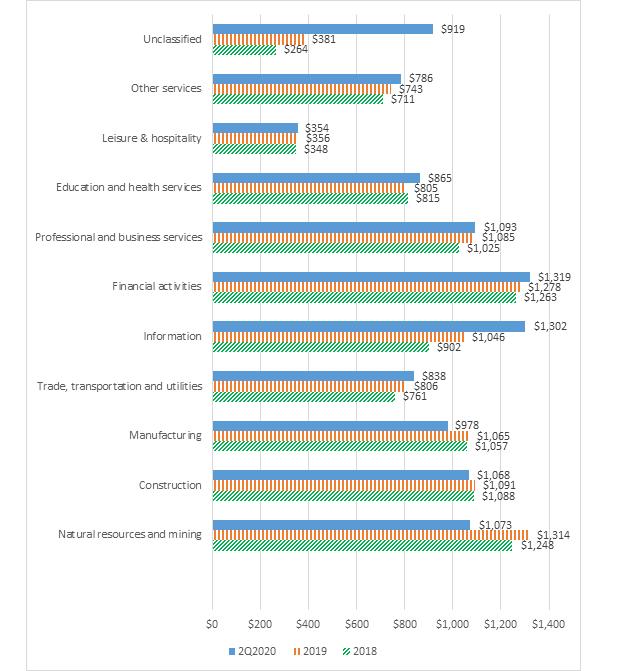
Figure R2 Average Weekly Wage by Industry in Wilson County TN, 2018-2Q2020 Source: US Department of Labor
represented in certain key industry sectors. The location quotient5 (LQ) of WC’s overall private service industry, for example, is estimated to be an above average 1.08 in second quarter 2020, ranking 7th among all of Tennessee’s 95 counties. In the same time period, WC’s LQ for the leisure and hospitality industry is a healthy 1.20 denoting a very conducive environment for both family living and tourism. One of Wilson County’s greatest economic strength’s, of course, continues to be in the supply chain industries of warehousing and trucking. WC’s advantage in this major expanding industrial area is confirmed by the estimated 2Q2020 LQ of WC’s trade, transportation and utilities sector to be an outstanding 2.10, highest of any Tennessee county and more than twice the national norm.6
It is not clear, however, how much of a ‘hit’ that WC’s supply chain sector will experience due to the national workforce shortages occurring in late 2021.
Average Weekly Wage Wilson County’s private wage data increased slightly from ✩808 in 2018 to ✩837 in 2019, a 3.6% gain. The average 2019 weekly wage of ✩792 for Serviceproviding firms was below that for all WC businesses though this represented a 4.35% increase over 2018 service wage levels. Pay was expectedly higher in WC’s Goods-producing category, which averaged ✩1075 per week, though this within a percentage point of wages for the previous year. For the average weekly wages across major WC industry groups, the highest wages in Wilson County in 2019 were paid in Natural resources and mining (✩1314 per week), Financial activities (✩1,278), Construction (✩1,091), Professional & business services (✩1,085), Manufacturing (✩1,065), and in the Information sector (✩1046). Lowest average weekly wages were paid in Leisure and Hospitality (✩356). See Fig. R2.
Number of Employees The number of persons working in Wilson County’s private industry has grown steadily in recent years, from 40,770 workers in 2018 to 43,002 in 2019, a 5.5% increase in the regional workforce. While the month to month workforce changes in 2019 were largely positive increases, from USDOL’s preliminary 2020 employment estimates, we note a significant drop in Wilson County’s private workforce size from 44,188 workers in March 2020 to 40,346 April 2020. If these government estimates are accurate, the sudden 8.7% decrease in WC workers may perhaps be due in part to the Covid-19 pandemic which began to grip the nation’s economy several months earlier. See Fig. R3.
Retail Sales
Tennessee Department of Revenue data shows the 2019 retail sales total for Wilson County TN to be ✩2,543,680,123, down slightly 1.5% from 2018 WC’s largest retail sales categories continue to be Automobiles, Boats & Aircraft at ✩678 million, representing 27% of the county’s 2019 retail sales total, followed by Food Stores (✩418 million, or 16.5%), General Merchandise (✩315 million, or 12.4%), Other (✩283 million, or 11%), Eating & Drinking (✩257 million, or 10%), and Building Materials (✩244 million, or 9.6%). See Figs. R4 and R6.
Monthly retail sales in Wilson County TN were relatively stable during 2019-2Q2020, save for a large sales spike in March 2020 and a smaller sales spike in December 2019. The March sales spike was mostly due to an unusual high of 42% in the total monthly sales of Autos, Boats & Aircraft, versus the industry category’s more typical average of 26%. The December sales spike was due to across the board holiday increases in almost all retail categories. See Fig. R5.
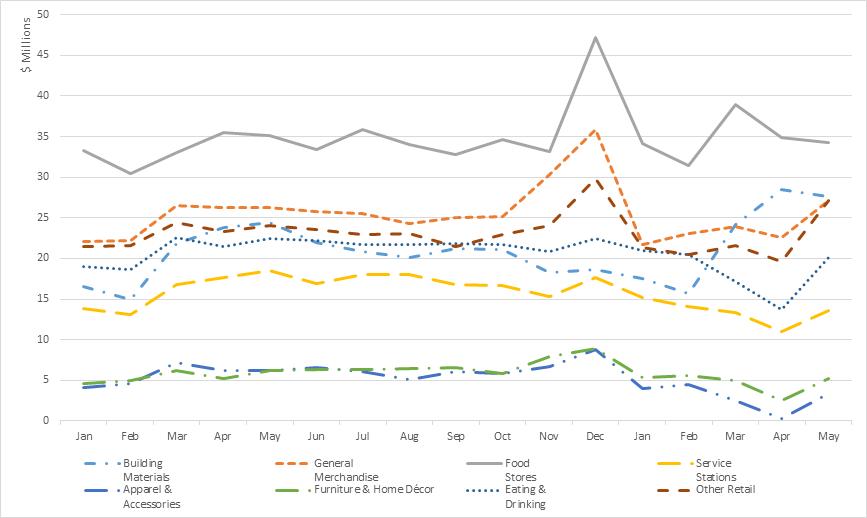
WC’s 2019 retail sales trends were largely positive in comparison with sales from the previous year. Significant 2019 sales increases over 2018 were recorded for General Merchandise (+7.4%), Service Stations (+5.9%), Furniture & Home D´ecor (+26%), and Eating & Drinking (+13.7%). Sales of Autos, Boats & Aircraft registered a 16% decrease from its 2018 sales level. Monthly retail sales in Wilson County for 2019-2Q2020 largely followed a typical retail pattern with sales highs occurring during the NovemberDecember holiday period. See Fig. R7.
If an LQ is equal to 1, then the industry has the same share of its area employment as it does in the nation. An LQ greater than 1 indicates an industry with a greater share of the local area employment than is the case nationwide. For example, Las Vegas will have an LQ greater than 1 in the Leisure and Hospitality industry because this industry makes up a larger share of the Las Vegas employment total than it does for the nation as a whole. 6 For detailed information, see the feature article “Wilson County’s Supply Chain Industry” in Wilson County Trends, Spring 2019 Issue.
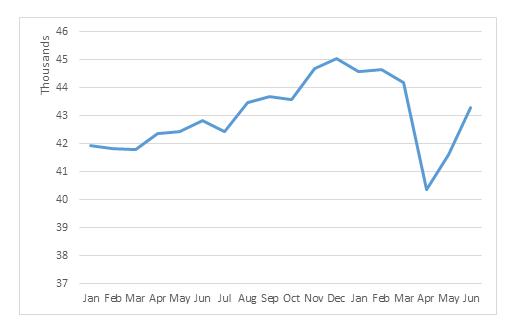
Figure R3
Total Persons Privately Employed in Wilson County, TN, 2019-2Q2020
Source: US Department of Labor (Note: 2Q2020 statistics are USDOL preliminary estimates)
Figure R4
Total Retail Sales by Category in Wilson County, TN
Source: TN Dept of Revenue
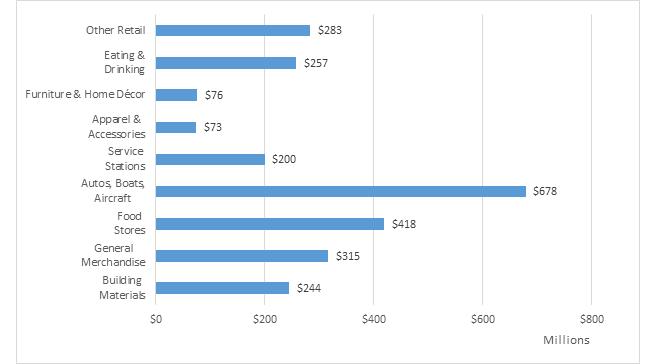
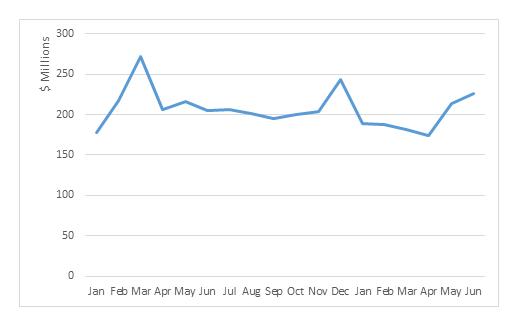
Figure R5
Monthly Total Retail Sales in Wilson County TN, 2019-2Q2020
Source: TN Dept of Revenue
Figure R6
Monthly Autos, Boats & Aircraft Sales in Wilson County, TN, 2019-2Q2020
Source: TN Dept of Revenue
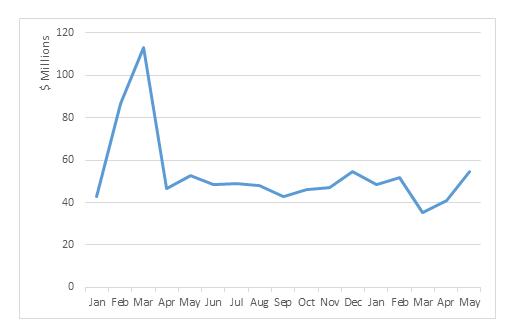
Figure R7 Monthly Retail Sales by Category in Wilson County, TN 2019-2Q2020 Source: TN Dept of Revenue
Music City Star passing through Lebanon, TN