Cycling UK’s Cycling Statistics
Introduction

Each year, Cycling UK rounds up the latest available statistics covering the topics that most often generate queries. We hope you find them useful and enjoy browsing through them.
Sources
The figures we use mainly come from official government sources, which we quote in brackets (for the key and further details, see ‘What are our main sources?’ below).
Travel statistics are not necessarily published at the same time of year or at the same frequency, and there’s inevitably a lag between when the data are collected and when the results are published. Obviously, annual reports covering one full year won’t appear until the year afterwards.
2020 & 2021
Data collection and travel were both affected by the pandemic, especially during lockdown. This means that the results for 2020 and 2021 ought not to be compared to previous years, so are given separately.
Comparing like-for-like
England, Wales, Scotland and Northern Ireland all produce data sets, but their approaches don’t always match.
Surveys, for example, don’t necessarily ask the same questions. Also, not every administration asks all its questions annually, questionnaires are sent out to potential respondents at different times and at different frequencies, some cover all ages, some just adults, and the results are published at different points in the calendar.
This means that we need to be careful when comparing figures, clear about what they cover and aware that certain data may not be collected by every government.
5
Q1. How much cycling is there compared to other transport, and is it increasing?
a. Proportion of traffic
Great Britain
• From 2015-19, cycling accounted for about 1.3% of mileage on non-motorway roads; 2.4% in 2020; and 1.7% in 2021.
• Cars and taxis account for most of the rest: 78% (2015-19); 74% (2020); and 75% (2021) (Cars are responsible for the bulk of this).
• Vans (c16%-18%), HGVs (c4%), buses & coaches (c1%) and motorcycles (c1%) make up the remainder
This table breaks down cycle traffic as a proportion of all non-motorway traffic (cycles, cars, taxis, motorcycles, buses, coaches, vans & HGVs) by nation. (TRA 0103 & 0403):
The table below only includes mileage via private car, taxi, motorcycle and cycle (i.e. it excludes most public and commercial road transport) (TRA 0104 & 0403):
*Thesourcecombinescarsandtaxis,butcarmileageisbyfarthelargestcomponent)
The following table gives the total mileage by cycles and all motor vehicles on all roads (inc. motorways), by nation. In 2020 (GB), cycle mileage went up by more than 50% compared to the annual average for 2015-19, and was 21% higher in 2021. In contrast, motor vehicle mileage in 2021 was still below average. (TRA 0103 & 0403):
Notes: these estimates include cycling on roads and cycle paths, but not offroad on towpaths or bridleways etc; the DfT has recently revised estimates since 2000 following a minor road review, which explains the slight difference between the latest estimates and those published last year; figures for 2020 & 2021 are affected by the Covid-19 pandemic, so please be cautious about comparing them with other time periods – see Q1d for more on the pandemic’s impact on travel.
6
2015-19 (annual average) 2020 2021 England 1.4% 2.5% 1.8% Wales 0.7% 1.6% 1.2% Scotland 0.8% 1.9% 1.2% Great Britain 1.3% 2.4% 1.7%
2015-19 (annual average) 2020 2021 Cars (& taxis*) 97.2% 95.6% 96.5% Motorcycles 1.2% 1.2% 1.3% Cycles 1.6% 3.1% 2.2%
Great Britain: cyclingas a proportion of allnon-motorway traffic, by nation (billion vehicle miles)
Great Britain: proportion of private, non-commercial mileage by mode (non-motorway)
2015-19 (annual average) 2020 2021 2015-19 (annual average) 2020 2021 England 3.2 4.7 3.8 282.8 228.2 254.4 Wales 0.1 0.2 0.2 18.6 14.6 16.5 Scotland 0.2 0.4 0.3 29.3 23.2 26.7 Great Britain 3.5 5.3 4.2 330.7 265.9 297.6
Cycle (all roads)
Motor (all roads, inc. motorways)
Great Britain: cycle andallmotortraffic, allroads, billionvehicle miles
Northern Ireland
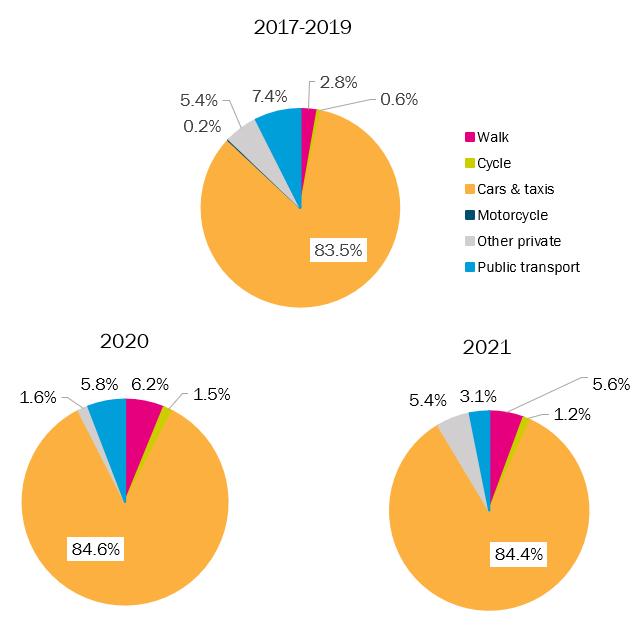
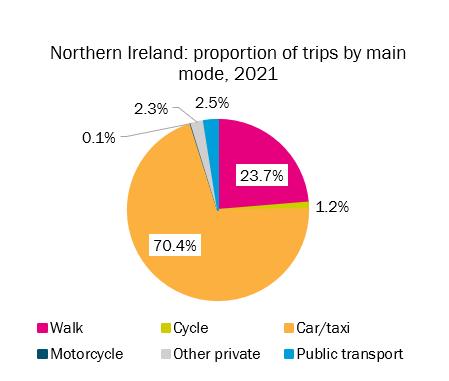
• No comparable traffic figures for Northern Ireland are readily available, but judging by the number of miles respondents to the Travel Survey for Northern Ireland (TSNI) say they each travel a year by each mode, it looks as if cycling accounted for about 0.6% of distance travelled from 2017-19; 1.5% in 2020; and 1.2% in 2021. (TSNI, Table 1, Headline report)
Northern Ireland: estimated proportion of overall mileage by mode
Notes: unlike the tables for GB above, which are based mostly on vehicle count data, these charts are based on people’s self-reported personal travel habits, so included walking but not freight; in 2020 & 2021, the results for motorcycles were not available or the sample was too small; 2020 & 2021 results are not directly comparable to those from previous years.
7
b. Longer-term trends for cycle mileage
Great Britain
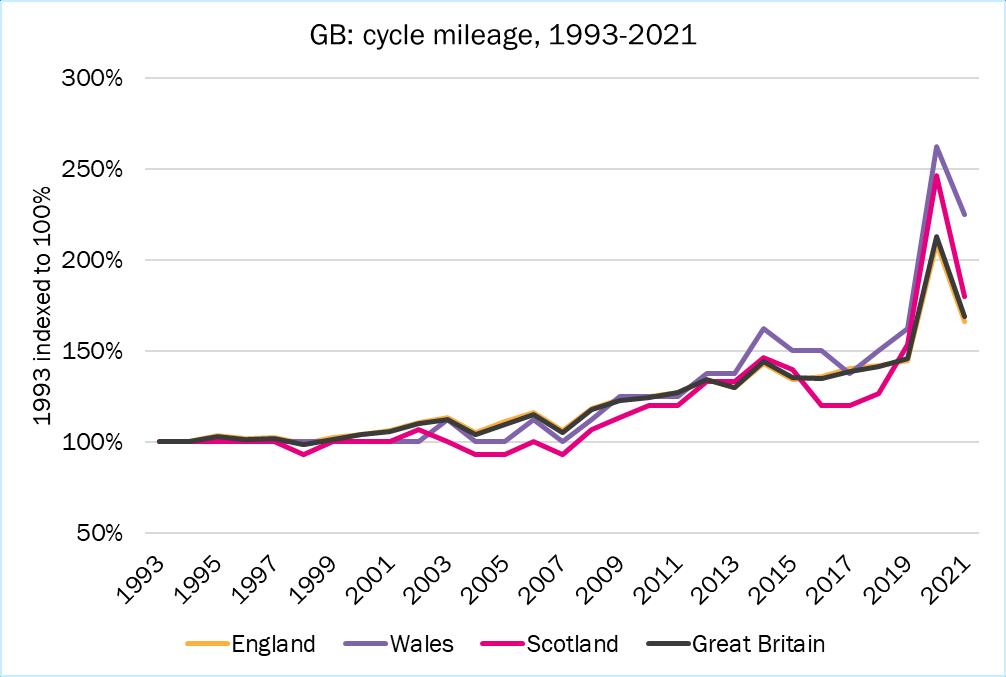
• Generally speaking, cycle mileage has been trending upwards since 1993, with lockdown in 2020 seeing a marked spike (TRA 0403):
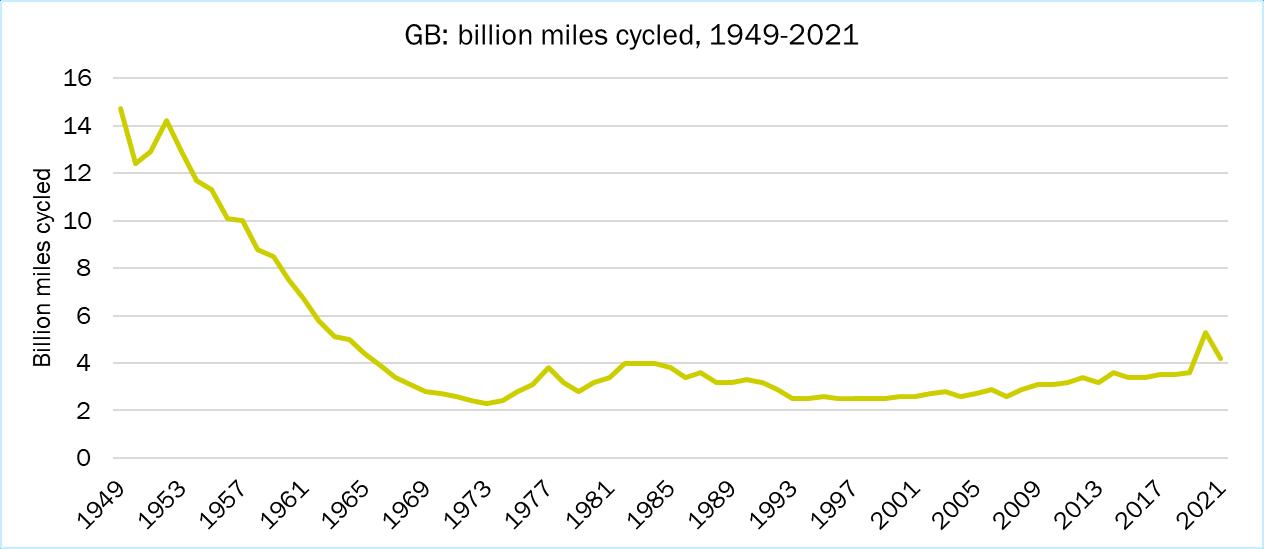
• But there’s still a long way to go until we reach the 14.7 billion miles cycled in 1949, when the population was about three-quarters of the size it is now (TRA 0401):
Note: data for 1993 onwards are not compatible with figures for 1992 and earlier.
8
England
In April 2023, the DfT published a more frequent, standalone ‘rolling annual index’ of cycling levels in England. The Index “smooths out impacts from seasonality and weather”, and can be used to assess longer-term trends.
The figures, to be published quarterly rather than annually, also give a more recent picture for cycling in England than the annual estimates given above (the graph below goes up to the end of 2022).
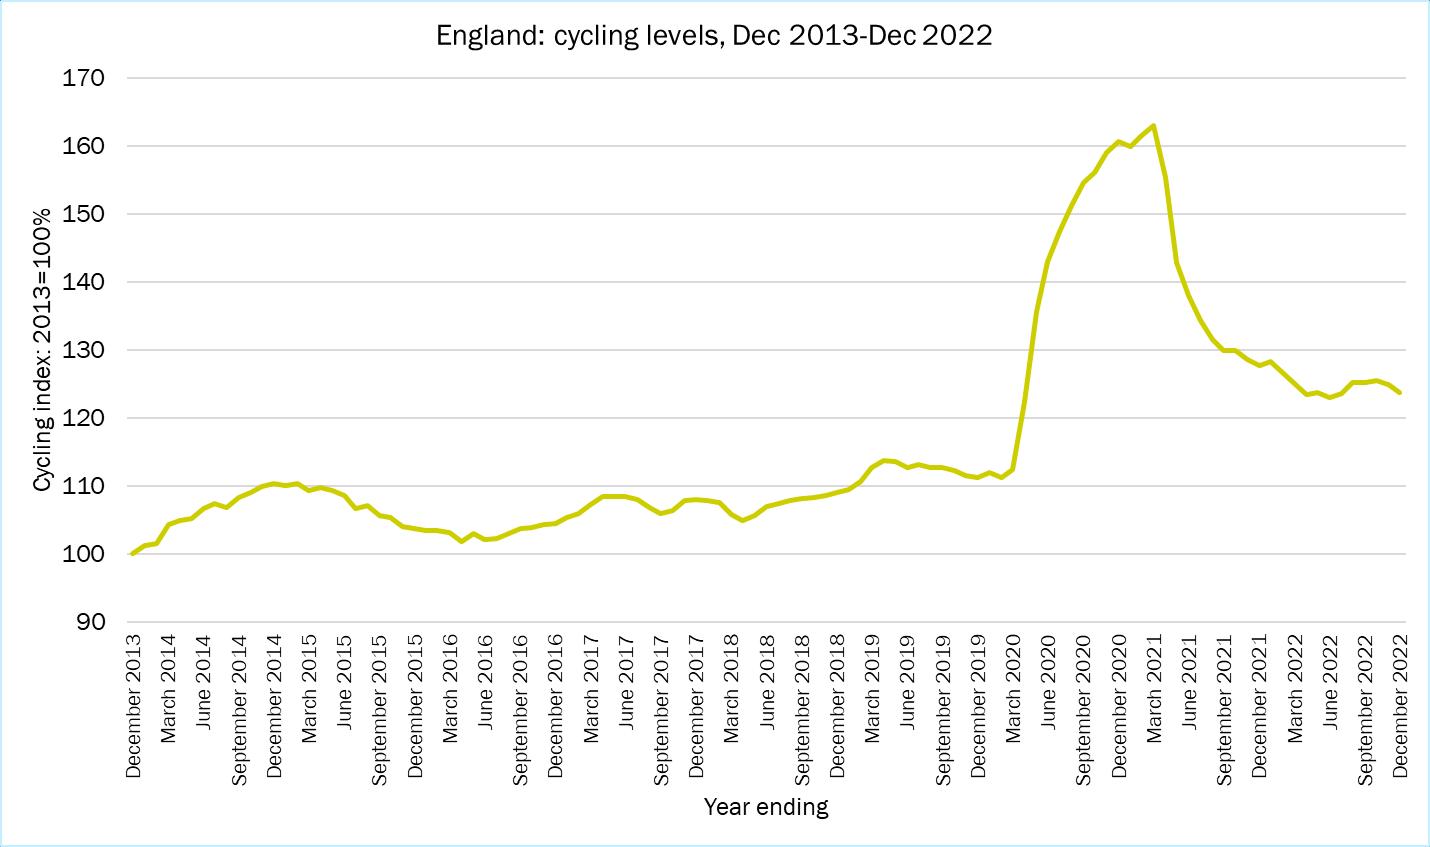
The estimates are mainly from automatic traffic counters and the baseline is 2013
Note: the DfT says that these estimates cannot be: used to estimate the number of people cycling; compared with other data on active travel; used to compare England with other countries; or to understand fluctuations over certain time periods, except for Covid19. Please refer to the DfT’s FAQs for further details
Bearing in mind that these data can’t be compared to any other data (including that cited in the sections above), the index released in April 2023 suggests that cycling levels have increased by 23.7% since December 2013. The spike in cycling during the pandemic is obvious.
9
London
In London, cycle flows across the central cordon more than tripled between 2001 and 2020 (TfL Travel in London Report 14 data tables, Fig 5.8). The growth coincides with higher levels of investment in dedicated cycling infrastructure (e.g. physically segregated cycle lanes and improved junctions).
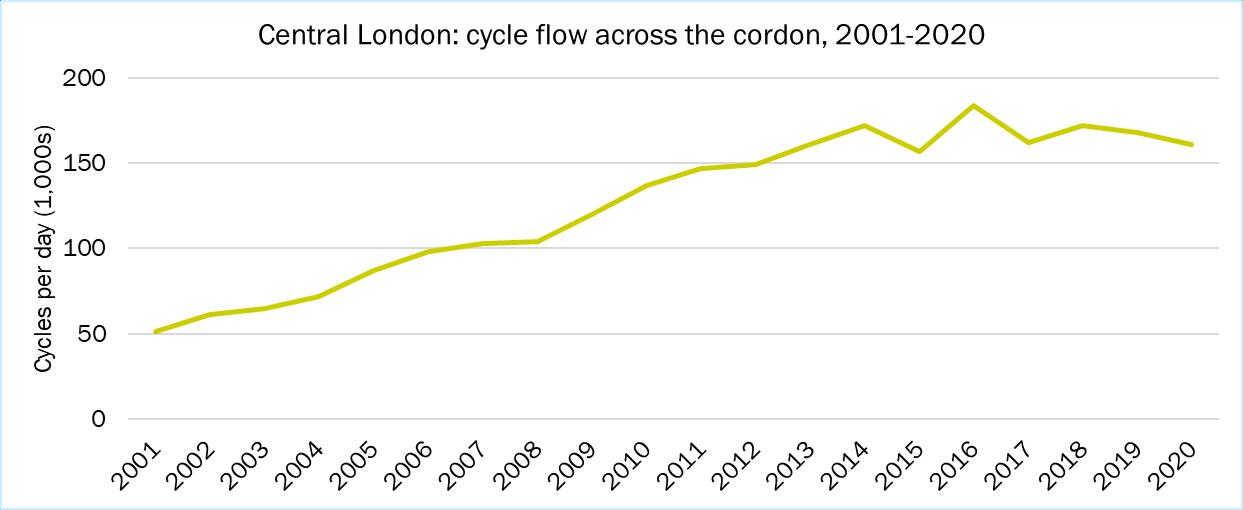
Cycle commuting in London is particularly strong but the pandemic and lockdown inevitably led to a dramatic reduction. Nevertheless, Transport for London says in its travel report (15): “Cycling proved to be remarkably resilient during the pandemic, offering many advantages for local, contact-free travel.”
The report also says:
“…. what is clear from the 2022 counts (undertaken in spring following the removal of most pandemic restrictions) is that the pandemic was associated with a net step increase in cycling, with 18 per cent more kilometres cycled on weekdays across London than in 2019 before the pandemic (equivalent to up to 27 per cent more in central London, 18 per cent in inner and 16 per cent in outer).”
10
Northern Ireland
• Calculations based on population statistics and survey data on the average number of miles cycled per person per year from TSNI (see above) suggest that overall cycle mileage for 2017-19 was double that of 1999-2001 (up from about 32 million miles to around 64 million miles).
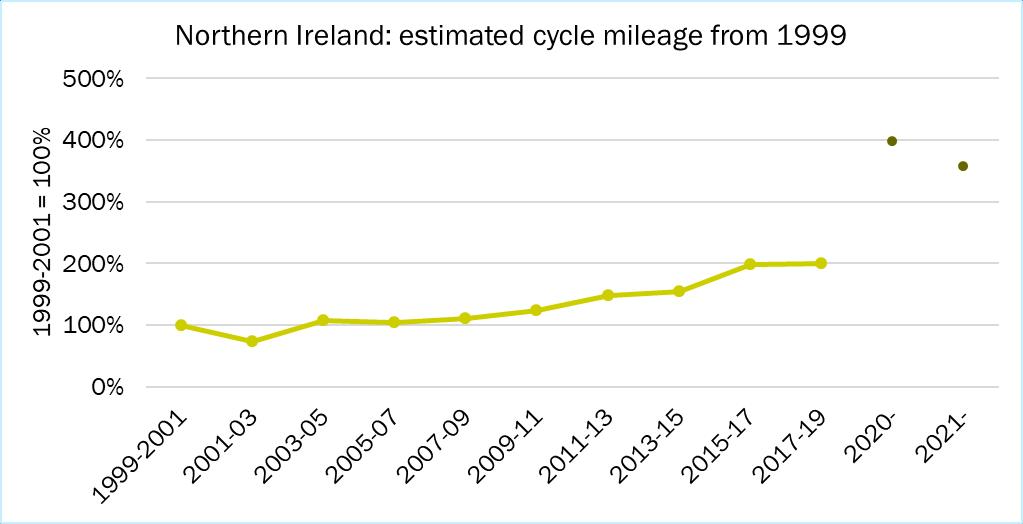
• Similar calculations suggest that people cycled 127 million miles altogether in 2020, and 114 million in 2021. Although these figures are considerably higher than they were in 1999, cycling only accounts for about 1%-1.5% of overall distance travelled by personal or public transport (see Q1a).
• It’s important to note, however, that TSNI’s methodology for 2020 & 2021 changed in response to the Covid-19 pandemic, meaning that the results are not directly comparable to those for previous years.
Note: The TSNI generally excludes travel off the public highway (e.g. on private land) but includes travel in public parks and on greenways.
11
c. Proportion of trips
England, 2002-2021
• In 2002, 1.7% of trips were cycled, a figure that hardly changed until 2020, when it rose to 2.8% The figure for 2021 was lower (2%), but still a little better than usual (NTS 0409a):
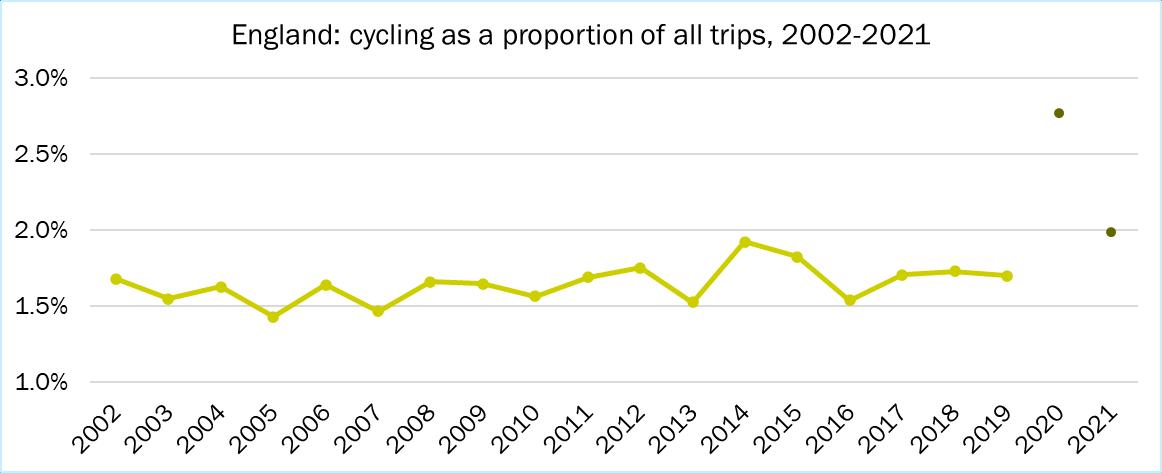
! Please note DfT’s disclaimer for 2020 & 2021: “Due to changes in the methodology of data collection, changes in travel behaviour and a reduction of data collected during 2020 and 2021, as a result of the coronavirus (COVID19) pandemic, care should be taken when interpreting this data and comparing to other years, due to the small sample sizes.”
Scotland, 1999-2021
• Between 1999 and 2019, the proportion of journeys made by cycle per year didn’t rise above 1.5%, but the overall trend crept upwards. (Year-on-year fluctuations may seem marked in the graph below, but annual percentages only ranged between 0.7% and 1.5% during this time-span)
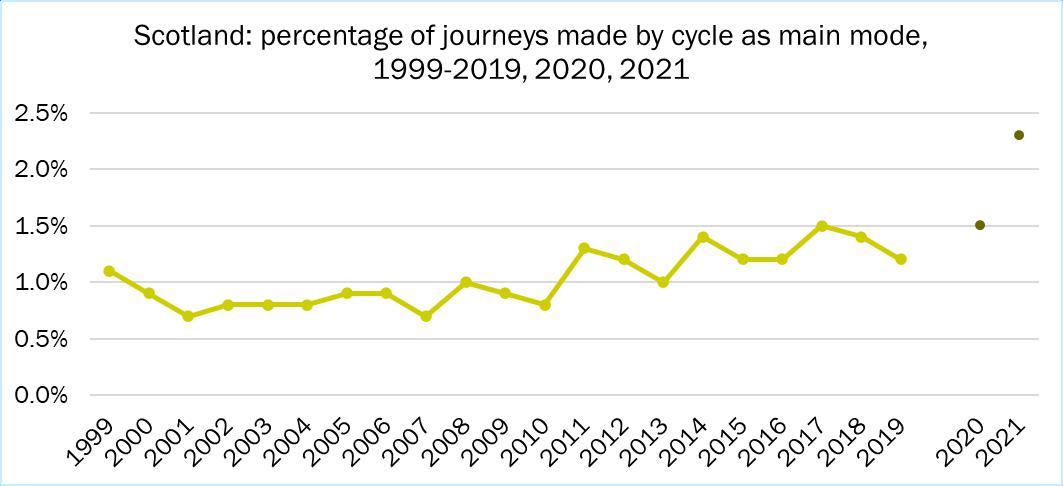
• The data gathered for 2020 suggest that 1.5% of journeys were cycled as a main mode, while the figure for 2021 is 2.3%. This is highest it’s been for 23 years, but it is important to remember that data for these two latter years are not comparable with previous years, because of Covid-related changes to the survey (hence the break in the time series).
(TATIS 2021, Travel Diary Table TD2)
12
Northern Ireland
• On average for 2017-19, about 0.8% of trips were cycled. This figure has barely changed, year-on-year
• In 2021, cycling accounted for 1.2% of trips but, as mentioned, changes in the survey methodology means that this figure isn’t comparable to those from earlier years.
(TSNI, Headline report 2021, Table 2)
Notes: trip figures come from surveys of people’s travel habits, so don’t include driving commercial vehicles (e.g. HGVs etc.), but do include walking and travelling by public transport.
Wales
The figures for the proportion of trips made by cycle per person in England, Scotland and Northern Ireland are based on answers given to survey questions that are not asked in Wales at the moment.
13
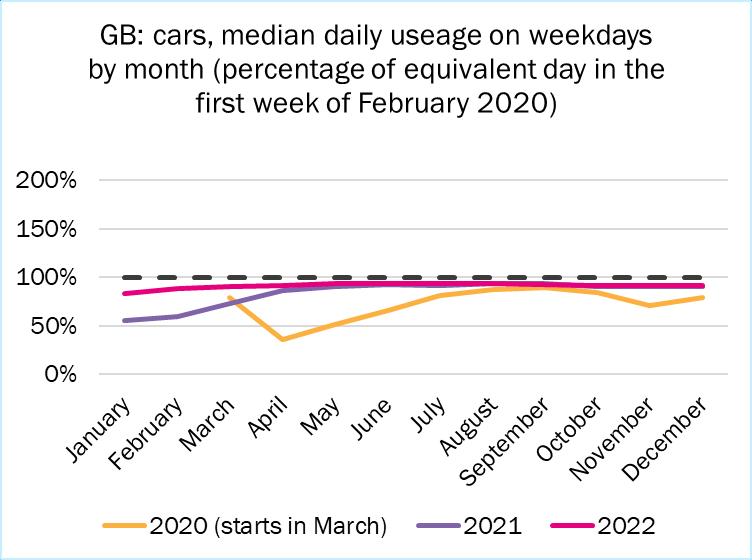
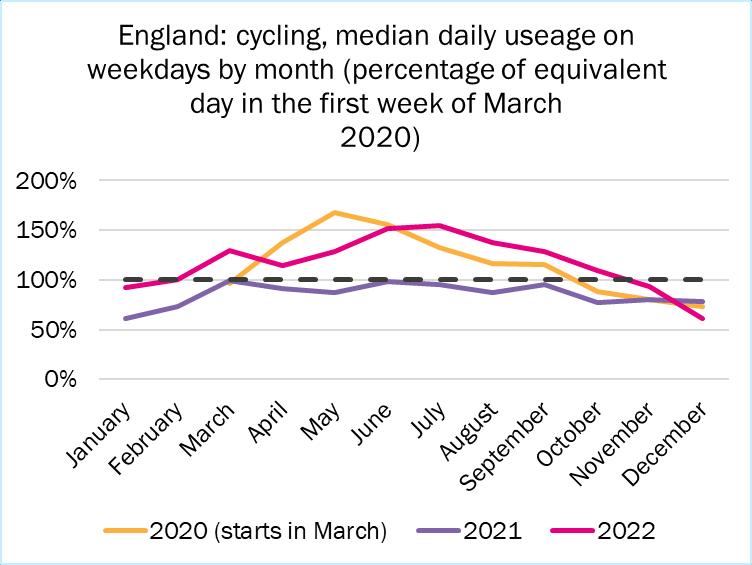
d. GB/England: impact of coronavirus
At the start of the Covid-19 pandemic, the Department for Transport began to publish daily estimates for domestic transport usage each day, comparing them to baseline figures in an equivalent day or week before the pandemic struck.
These included data for motor traffic (public and private, GB) and cycling (England). According to these estimates, cycle usage shot up in 2020 compared to the baseline, tailing off as usual in the colder months. It dropped again in 2021, but 2022 saw a resurgence. Car use, in contrast, is still, at the time of writing, somewhat below the baseline figure.
14
Q2. How many people cycle and how often?
Please note: it is important not to compare the following figures nation against nation. This is because they come from the results of surveys with differently framed questions asked at different times of the year and about different periods of time. Also, the sample sizes vary (and may be small), and the definitions of ‘cycling’ aren’t necessarily the same. Apart from the National Travel Survey (England, NTS), however, the respondents were all aged 16 or over.
Note also that figures are rounded, and some sources give ‘cumulative’ percentages, while others do not. Please see original sources for more.
England
The two sources we use for data on cycling frequency differ:
-Active Lives Survey (ALS) – covers cycling in the last four weeks for ‘travel’ or ‘leisure’ (in this context, ‘leisure’ means cycling for health, recreation, training or competition, not to get from place to place), people aged 16 and over.
-National Travel Survey (NTS) – covers cycling over the last year or so for any purpose, “on the public highway (any public road, street or path available to the public by a public right of way)”, ages 5 and over
Active Lives Survey (ALS)
• The ALS suggests that, in most years, about 11%-12% of people aged 16 and over cycle at least once a week If this is the case for the entire population of this age, it equates to just over five million people. The proportion dropped to 9% in 2021.
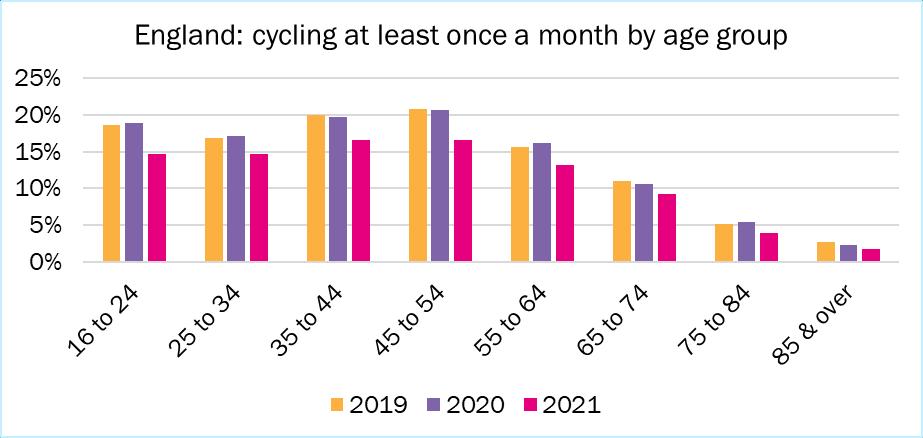
• In most years, about 16%-17% of people aged 16 and over cycle at least once a month, equating to seven to eight million people. This dropped to 13% in 2021.
• Relatively few people cycle on multiple days during the week. (CW0302).
15
How often in the past 4 weeks? 2016 2017 2018 2019 2020 2021 2016 2017 2018 2019 2020 2021 At least 5timesper week 3% 3% 3% 3% 3% 2% 1.5 1.5 1.5 1.4 1.4 1.0 At least 3timesper week 6% 6% 6% 5% 5% 4% 2.5 2.6 2.5 2.4 2.4 1.8 At least once per week 12% 12% 11% 11% 12% 9% 5.3 5.3 5.2 5.1 5.3 4.2 At least once per month 17% 17% 16% 16% 16% 13% 7.7 7.6 7.3 7.3 7.4 6.1 How often in the last 4 weeks? 2016 2017 2018 2019 2020 2021 2016 2017 2018 2019 2020 2021 At least 5timesper week 2% 2% 2% 2% 1% 1% 0.9 0.9 0.9 0.9 0.6 0.5 At least 3timesper week 3% 3% 3% 3% 2% 2% 1.5 1.5 1.5 1.4 1.1 0.9 At least once per week 6% 6% 6% 6% 5% 5% 2.8 2.8 2.8 2.7 2.3 2.1 At least once per month 8% 8% 8% 8% 7% 6% 3.7 3.6 3.5 3.4 3.1 3.0 How often in the last 4 weeks? 2016 2017 2018 2019 2020 2021 2016 2017 2018 2019 2020 2021 At least 5timesper week 1% 1% 1% 1% 1% 1% 0.5 0.5 0.5 0.5 0.6 0.4 At least 3timesper week 2% 2% 2% 2% 3% 2% 1.0 1.0 1.0 1.0 1.3 0.8 At least once per week 8% 8% 8% 8% 9% 6% 3.6 3.6 3.5 3.4 3.9 2.8 At least once per month 14% 14% 13% 13% 13% 10% 6.2 6.1 5.9 5.9 6.1 4.6 Estimated population who cycle (millions) England: proportion & estimated number of people aged 16 and over who cycle for leisure by frequency % people cycling England: proportion & estimated number of people aged 16 and over who do any cycling (for travel or leisure) by frequency % people cycling Estimated population who cycle (millions) England: proportion & estimated number of people aged 16 and over who cycle for travel by frequency % people cycling Estimated population who cycle (millions)
National Travel Survey (NTS)
• NTS results for 2015-19 – which include children aged five and over – suggest that about 14%-15% (c.8 million people) cycle at least once a week. In 2020, a fifth (20%) said the same. Figures for 2021 reverted to more ‘normal’ levels, although still somewhat higher than they were in 2015-19, broadly speaking.*
• The NTS suggests that, usually, about 25% of people aged five and over cycle more than once or twice a month (about 13 million people), but in 2020 & 2021 this increased to 31% & 28% respectively (about 15 - 16 million people) *
England: proportion & number of people aged five and over who cycle by frequency
How % of people cycling (over 5s) Estimated population who cycle (millions)
over the last year or so?
(NTS 0313) *Please note the DfT’s disclaimer for 2020 & 2021 (see Q1c above).
Wales
• Respondents aged 16+ in Wales are asked if they’d cycled in the last three months as a “means of transport” , defined as cycling to get to a particular destination such as work, shops or to visit friends, but not cycling purely for pleasure or exercise
How often in the last three months?
Note: there are no published results for 2020/21. (NSW results viewer (full year), active travel topic)
16
% Thousands of people % Thousands of people Every day 1.2% 31k 0.9% 24k Several times a week 1.8% 48k 1.7% 44k Once or twice a week 2.4% 61k 2.8% 72k Once or twice a month 3.6% 92k 3.7% 95k 2016/17 to 2019/20 2021/22 Population of Wales, aged 16+ (estimate) = 2.6 million
often
Wales: estimated proportion of people (16+) who cycle as a means of transport by frequency 2015-19 av 2020 2021 2015-19 av 2020 2021 3 or more times a week 7% 10% 7% 3.7 5.3 3.9 Once or twice a week 7% 10% 8% 3.7 5.4 4.5 Less than once a week, more than once or twice a month 4% 5% 5% 2.2 2.8 2.6 Once or twice a month 6% 5% 8% 3.0 2.8 4.0 Less than once a month, more than once or twice a year 6% 4% 6% 3.0 2.4 3.5 Once or twice a year 4% 4% 4% 2.2 2.4 2.2 52 53 54 Population of England, aged 5 & over (estimate)
Scotland
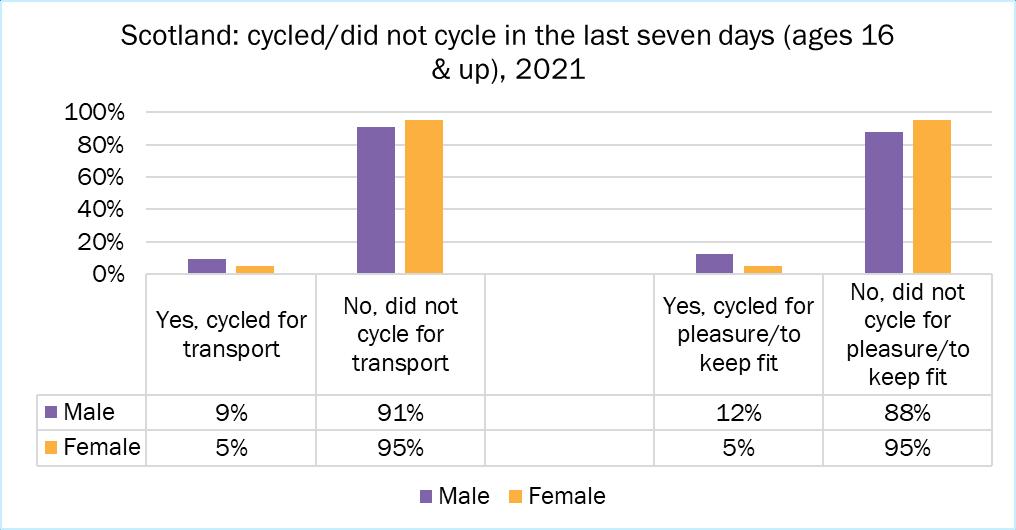
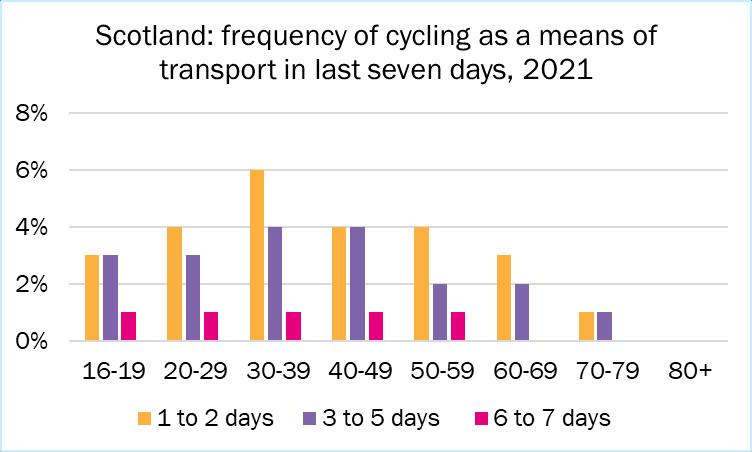
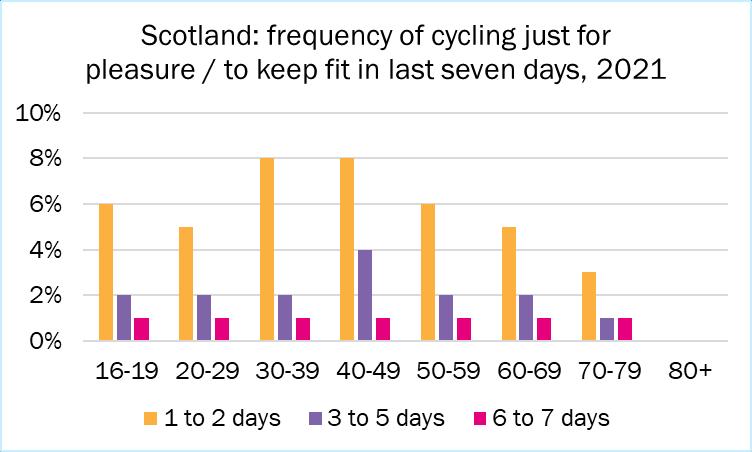
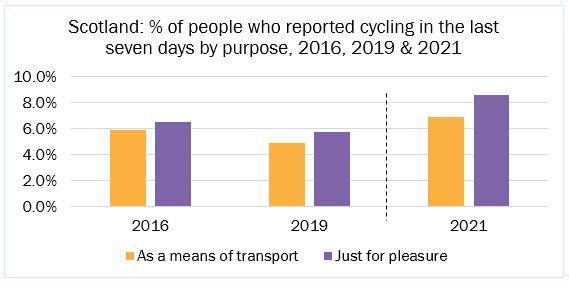
• When people aged 16 and over were asked by the 2021 Scottish Household Survey (SHS) how often they’d cycled in the previous seven days, 5.7% said they’d cycled for pleasure/to keep fit on 1-2 days, making it the most popular response. (If extrapolated to the population of this age, this equates to c260k people).
• The next most popular response was cycling “as a means of transport” on 1-2 days (3.5% of respondents/c160k people, if extrapolated).
• In 2019, 3.3% said they’d cycled just for pleasure/to keep fit on 1-2 days; 1.8% said they’d cycled for transport on 1-2 days.
Note: 2021 data is not directly comparable with previous years due to changes to the SHS in response to coronavirus. The question about cycling frequency is asked every other year.
(TATIS 2021, SHS Table 25a).
Northern Ireland
• Respondents (any age) to the Travel Survey in Northern Ireland are asked how often they’ve cycled in the last twelve months for leisure or for a purpose:
Northern Ireland: frequency of cycling in the last 12 months
(TSNI, 2020 in-depth report, estimated from Figure 5.4).
17
Frequency 2017-19 2020 Every day (includes people who cycle every working/school day but not weekends, plus those who cycle every day) 2.9% 3.2% At least once a week 6.7% 9.7% At least once every 2-3 weeks 3.1% 3.2% At least once a month 3.4% 3.2% Once every 2-3 months 3.6% 2.7% Once every 6 months 2.4% 1.9% Once a year 1.4% 0.8% Varies according to time of year+ 0.5% 2.1%
How often in the previous 7 days? % Thousands of people % Thousands of people 6-7 days 0.7% 32k 0.7% 32k 3-5 days 2.7% 123k 2.2% 101k 1-2 days 3.5% 160k 5.7% 260k Scotland: estimated proportion of people (16+) who cycle for transport or pleasure by frequency, 2021 Cycling as a means of transport Cycling just for pleasure/to keep fit
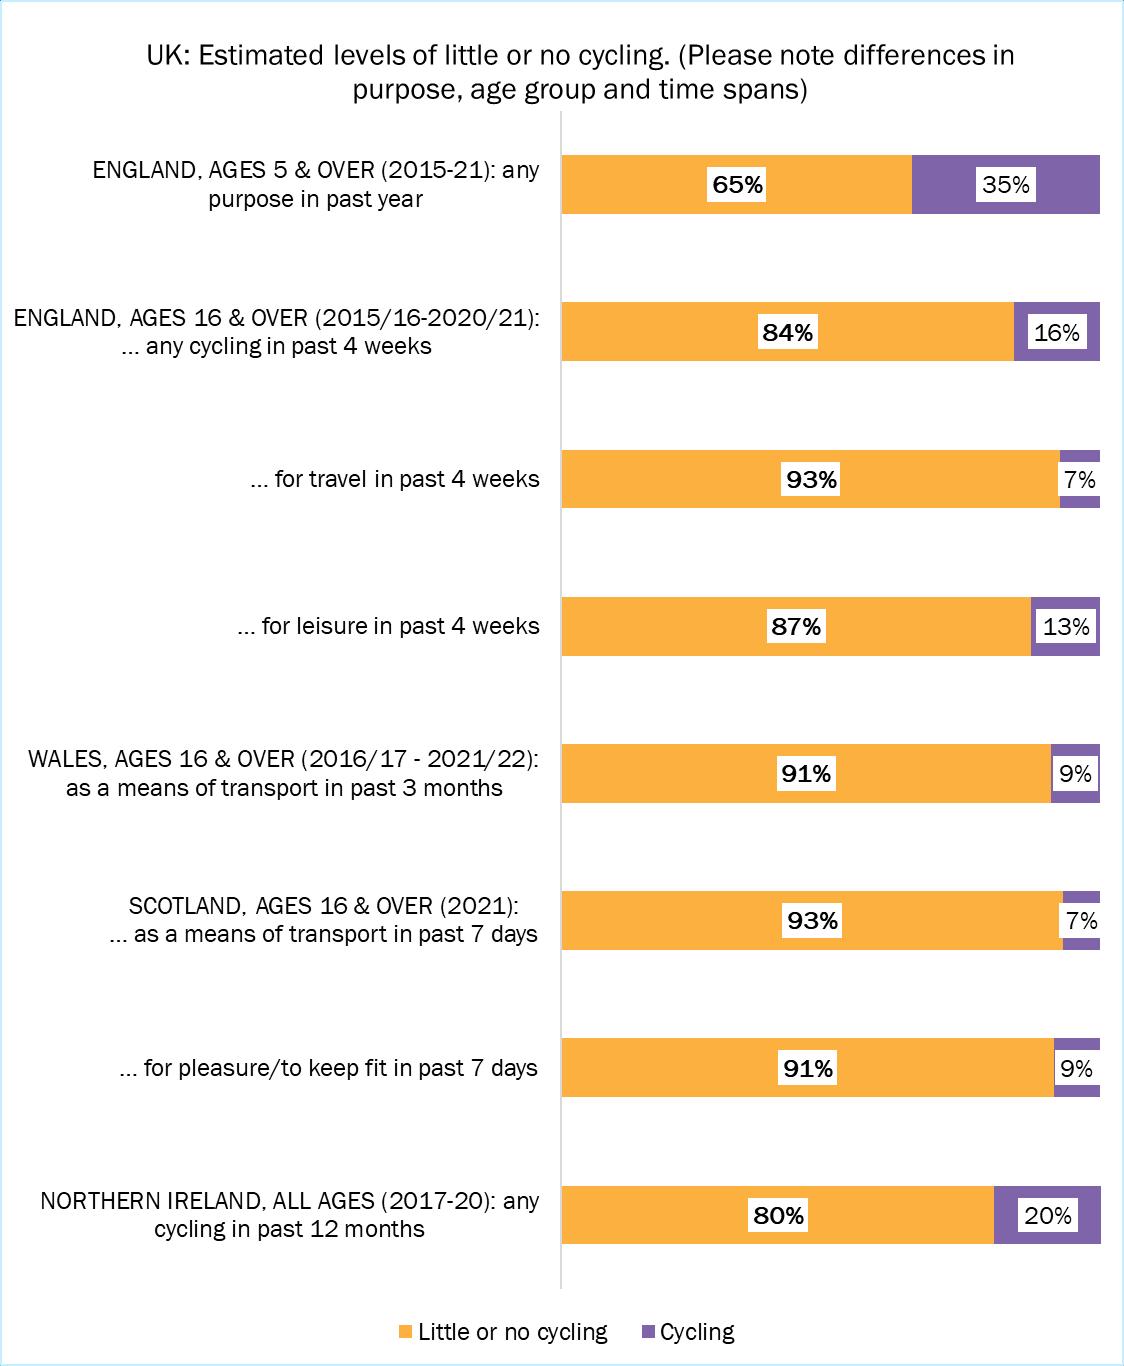
Q3. How many people don’t cycle much, if ever?
The following chart gives estimates of the proportion of people who very rarely, or never cycle
Please note: The figures for each nation below are not like-for-like, so be aware of the differences. Also, the definition of ‘not cycling’, or not cycling very much, isn’t quite the same for each nation. Obviously, the ‘past’ means something different in each survey, and depends on when respondents were surveyed. For the sources, please see Q2.
18
Q4. How many trips do people make, what’s their mileage and how far do they go each time?
England
• On average a year from 2015-19, people made 960 trips by ‘all modes’ (i.e. car, cycle, public transport, foot etc.). This dropped to 739 in 2020 (-23%), and 757 in 2021 (-21%)
• The number of cycle trips increased in 2020 per person compared to the annual average for 2015-19, up from 16 to 20 (+25%). They fell to 15, though, in 2021.
• The average ‘all modes’ mileage per person per year from 2015-19 is estimated to be around 6,553 miles. This dropped to 4,334 in 2020 (-34%) and 4,329 in 2021.
• Car/van drivers clocked up 3,248 miles each on average a year from 2015-19. Their mileage fell in 2020 to 2,324 (-28%), and to 2,229 in 2021 (-31%) *
• In contrast, the cycling mileage per person rose from 54 on average a year from 2015-19, to 84 in 2020 (+57%). It fell back to 54, though, in 2021.
(All the above figures come from NTS 0409, cover any age and including walking, cycling, driving or being driven, taxi, bus and rail)
*Personal mileage in cars isn’t the same as the mileage of cars (i.e. their vehicles): 7,700 miles (2015-19 on average); 6,800 (2020); 5,300 (2021). (NTS 0901).
• The average length of a cycle trip rose from 3.3 miles in 2015-19, to 4.1 miles in 2020, dropping in 2021 to 3.6. In contrast, the average length of a car/van trip as a driver dropped from 8.4 miles to 7.9 in 2020, and to 7.4 in 2021. (NTS 0303)
• The table above covers all NTS respondents, whether they cycle (or drive) or not. The NTS, however, also specifically asks respondents who cycle about their cycling habits over the year. Not surprisingly, these people – defined as those who made at least one cycle trip in the week that they were asked to record their travel – make many more cycle trips and their mileage is much higher than the general average. (NTS 0314).
• Less commuting (see Q8) and higher levels of working from home may have contributed to the slight decline in trips in the latter two years
Note: the sample size is relatively small, so DfT advises that these findings should be interpreted with caution). Also note DfT’s disclaimer for 2020 & 21 (quoted in Q1c above).
19
2015-19 av 2020 2021 201519 av 2020 2021 2015-19 av 2020 2021 Average number of trips 387 295 300 16 20 15 960 739 757 Average mileage 3,248 2,324 2,229 54 84 54 6,553 4,334 4,329 Average trip length (miles) 8.4 7.9 7.4 3.3 4.1 3.6 6.8 5.9 5.7 Car/van driver Cycle All modes England: car, cycle & 'all modes' use, average per person 2015-19 av 2020 2021 Average number of trips 329 301 298 Average mileage 1,088 1,273 1,087 England: trips and mileage of cycle riders
Scotland
• These are the median and mean trip distances in Scotland in 2021. (TATIS 2021, tables TD5 & TD5a):
Scotland: median & mean distance of trips by adults (miles), 2021
Note:
Distances are calculated using the road network distance. Data for the average number of trips and annual mileage for different modes are not readily available.
Northern Ireland
These are the average number of trips, mileage and trip length in Northern Ireland (TSNI, Headline report 2021, Tables 1 & 2):
Northern Ireland: car, cycle and 'all modes' use per person per year
Note: the survey methodology changed in 2020 & 2021 in response to the pandemic, so the results are not directly comparable with those from earlier years.
A note on Wales
Similar data for Wales are not readily available.
20
2017-19 2020 2021 2017-19 2020 2021 2017-19 2020 2021 Average number of trips 453 406 412 7 16 10 906 826 838 Average mileage 3,641 2,845 2,939 34 67 60 6,130 4,550 4,940 Average trip length (miles) 8.0 7.0 7.2 4.8 4.1 6.2 6.8 5.5 5.9
Car driver Cycle All modes Driver car or van Cycle All modes Median 4.1 1.9 2.4 Mean 10.4 4.9 7.1
Q5. How many people own or have access to a cycle?
England
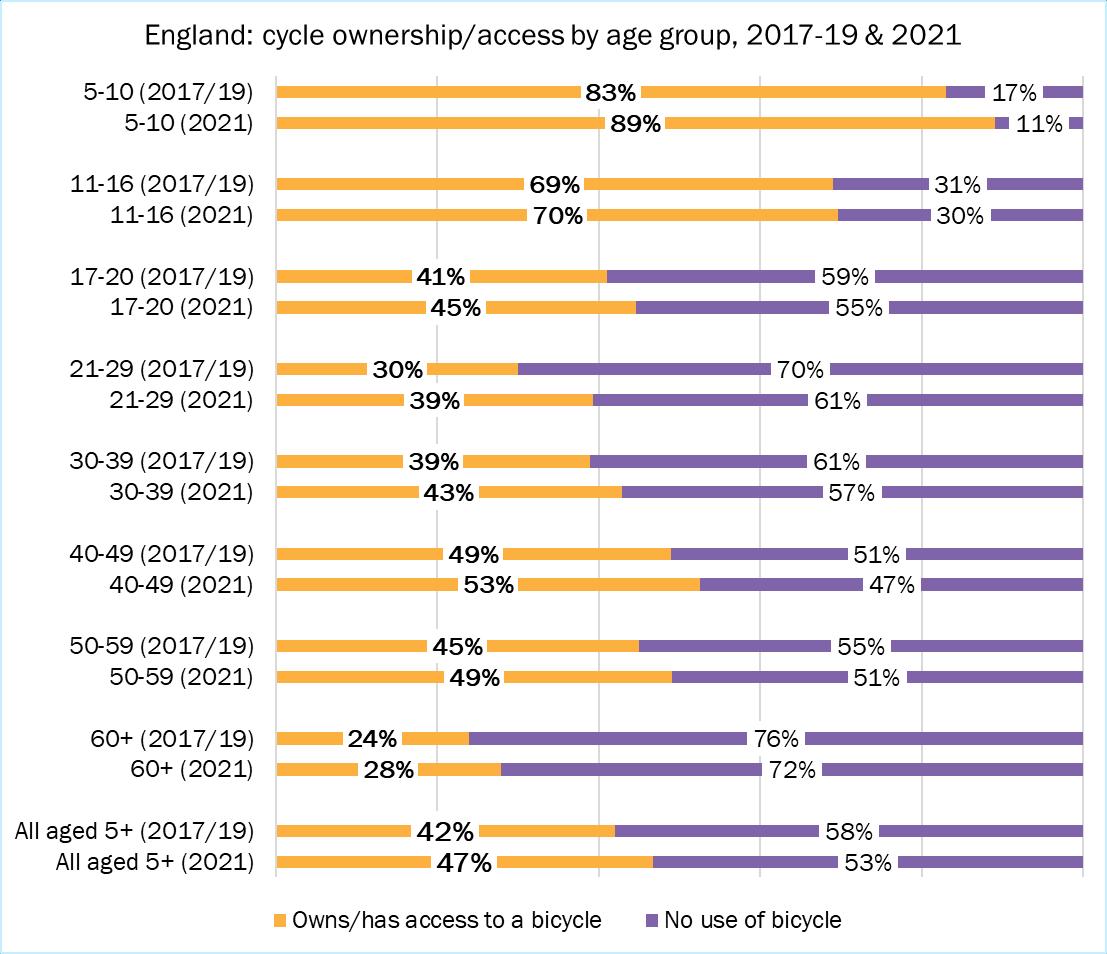
• Surveys from 2017-19 suggest that about 42% of people aged five or over owned or had access to a bicycle This figure rose to 47% in 2021
• Younger age groups, particularly 5-10 year-olds, are more likely to own or have access to a cycle than older people.
• Ownership in all age groups appears to be higher in 2021 than it was for 2017-19. (NTS 0608)
Please note the DfT’s disclaimer for 2020 & 2021 (quoted in Q1c above).
E-bikes
• In early 2021, the National Travel Attitudes Survey found that, at the time, very few people owned or had access to an e-bike. (NTAS 5c).
England: proportion of people (16+) owning or with regular use of an electric bicycle (e-bike), (Jan-Feb 2021)
21
Own Regular use Don't own/have regular use 2.6% 0.6% 96.8%
Wales
In 2013/14, when this question was last asked, the proportion of people who own or have access to a bike was:
• 63% among 16-24 year-olds
• 63% among 25-44 year-olds
• 58% among 45-64 year-olds
• 44% among 65-74 year-olds
• 30% among 75+ year-olds.
(NSW results viewer)
Scotland
• In 2021, 45.1% of households reported owning one or more bicycles for private use. (TATIS 2021,Scottish Household Survey, Table 18a).
Northern Ireland
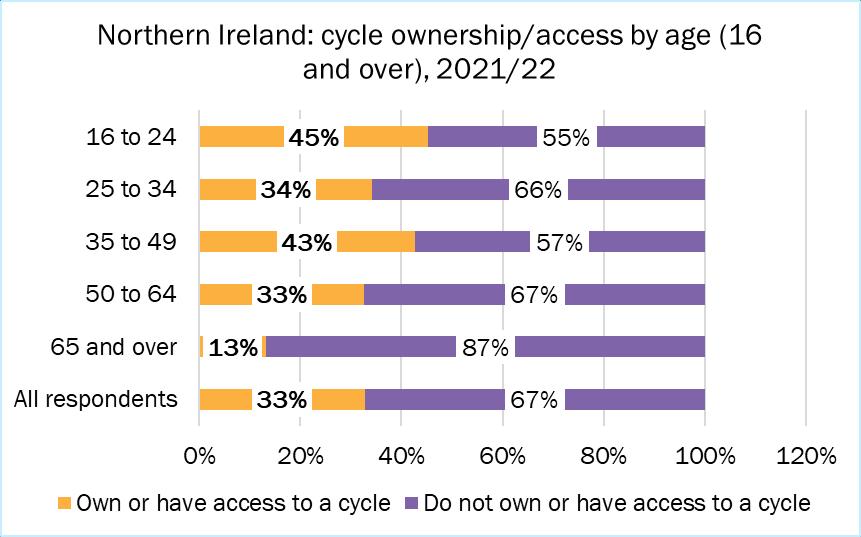
• In 2021/22, a third of respondents (aged 16 and over) to the Continuous Household Survey said they owned or had access to a cycle.
(WCPTNI Worksheet 2.1)
22
Q6. Who cycles most by gender?
Males cycle more than females.
England Trips
• On average a year from 2015-19, males of all ages made almost three times as many trips by cycle as females (24 trips to 9).
• In 2020, people cycled for more trips, but especially females whose trips increased by around 50% to 13 Trips among males rose by less (+16%) to 28, meaning that they made just over twice the number of trips that females made, instead of the usual 3x as many
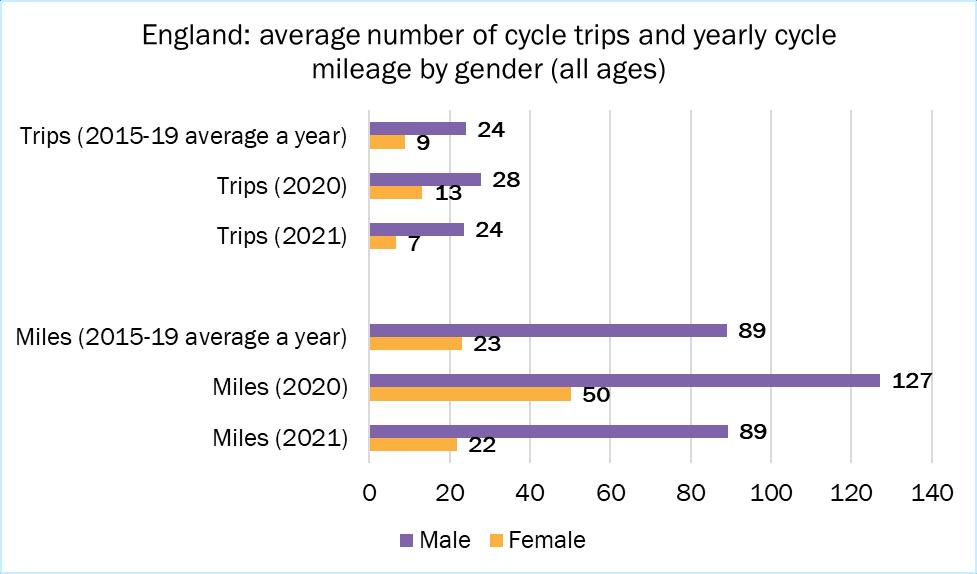
• In 2021, females made seven trips on average, fewer than in pre-pandemic years, while males reverted to ‘normal’ (24). This means that males made 3.6 x as many trips as females.
• In contrast, females are more likely than males to make trips as car passengers, use buses and taxis, or walk. Overall, in fact, they tend to make more trips by ‘all modes’ on average over the year.
Mileage
• Cycle mileage among males in 2015-19 was nearly four times as much as it was among females
• This dropped to about two-and-a-half in 2020, with females more than doubling their typical average annual distance (50 miles instead of 23)
• The differential between males and females returned to just about normal in 2021 when, once again, males rode 89 miles on average.
Please note: the source, DfT’s National Travel Survey (NTS 0601), uses the terms ‘females’ and ‘males’. The chart below covers all age groups, from 0 to 70+ (for a breakdown by age, please refer to source).
23
Wales
In Wales (2021-22), females cycle less often than males at all frequencies (NSW, data obtained by special request).
Scotland
Wales: how often used a bike to get somewhere by gender, 2021-22
• In 2021, males were about twice as likely as females to have cycled in the last seven days. (TATIS 2021, SHS Table 25a).
Northern Ireland
• The Continuous Household Survey for 2021/2022, which asked respondents (aged 16 and over) who owned or had access to a cycle whether they’d cycled in the last four weeks, revealed a significant difference between responses for males and females (WCPTNI Worksheet 2.2):
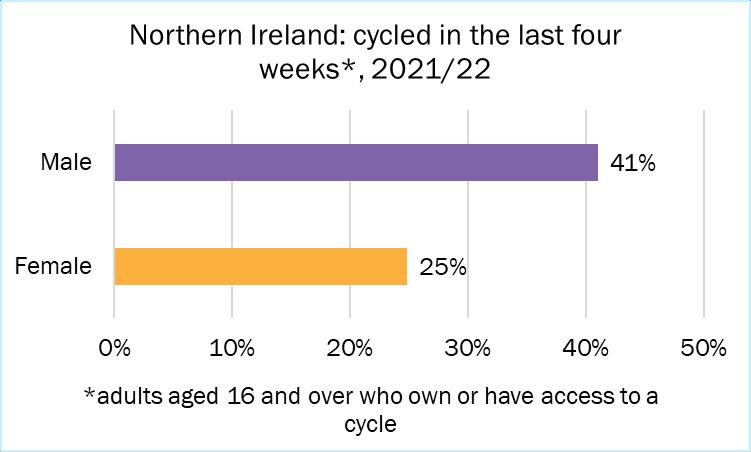
24
Male Female Every day or several times a week 4% 2% Once or twice a week 4% 1% Once or twice a month 5% 3% Less often / never 87% 94%
Q7. Which age group cycles most? England
• Usually, people aged 40-49 make the most cycle trips (any purpose) during the year (although they were overtaken by 50-59 year-olds in 2021). People aged 70+ make the fewest trips. (NTS 0601).
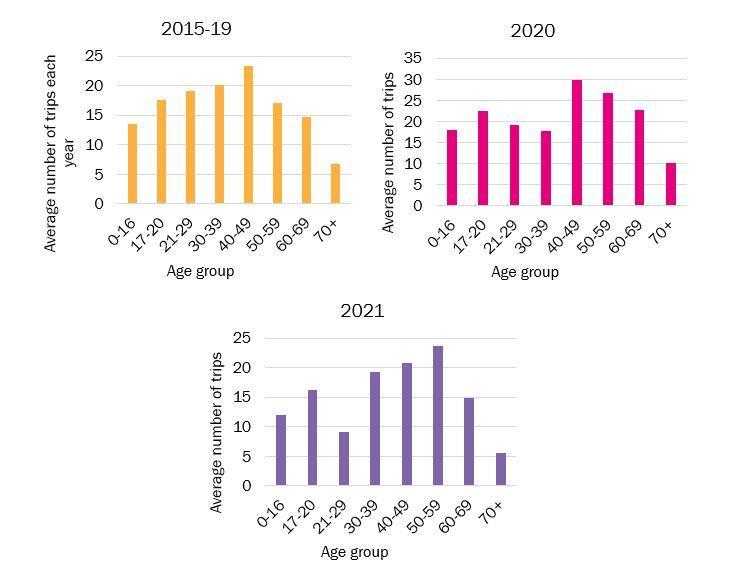
England: cycle trips per person per year by age
• Sport England’s Active Lives Survey also suggests that cycling is particularly popular among people in the middle age groups, tailing off in later life (CW 0305).
Note: The pandemic affected cycling and data collection in 2020 & 2021.
25
Wales
• In 2018/19, about 14% of 16-24 year-olds and 35-44 year-olds cycled at least once a month for transport, compared to 4% of older people (60+) The two other age groups (25-34 and 45-59) came in at just under to just over 10% respectively. (ATWCWales, release 2018-19, Chart 4).
For 2019/20, the smaller sample size for responses to the survey’s questions around cycling means no comparisons should be made to previous years
Scotland
• Data derived from surveying people about how often they cycle lead to different results each year, but they tend to suggest that older people (70+), are less likely than younger age groups to cycle at any frequency. (TATIS 2021, Table 25a).
26
Northern Ireland
• Young people under 16 are more likely to say they’ve cycled in the last 12 months than other age groups.
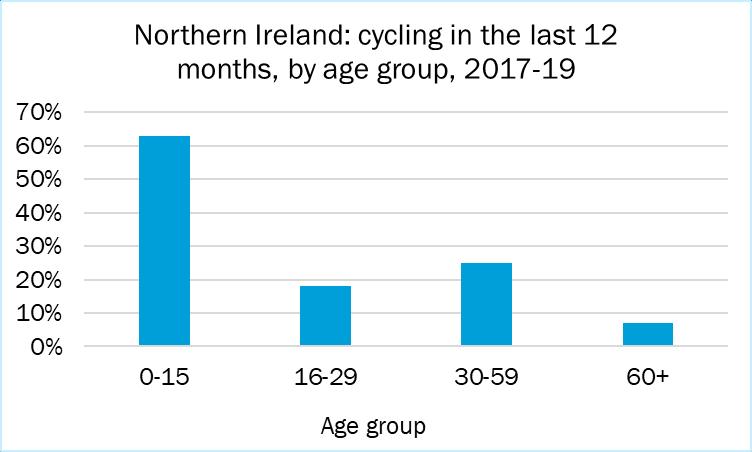
(TSNI, In-depth report 2017-19, Table 5.4).
Note: in 2020, the sample size was too small to break down into age groups.
27
Q8. What’s the purpose of most cycle trips?
England
• Usually, commuting and leisure* are the most common purposes of cycle trips, at just over a third each.
• In 2020, however, leisure surged to 55% and commuting fell to 20%, almost undoubtedly due to working from home rules and the population being encouraged to cycle for exercise.
• In 2021, leisure still exceeded commuting, but the gap narrowed somewhat. (NTS 0409):
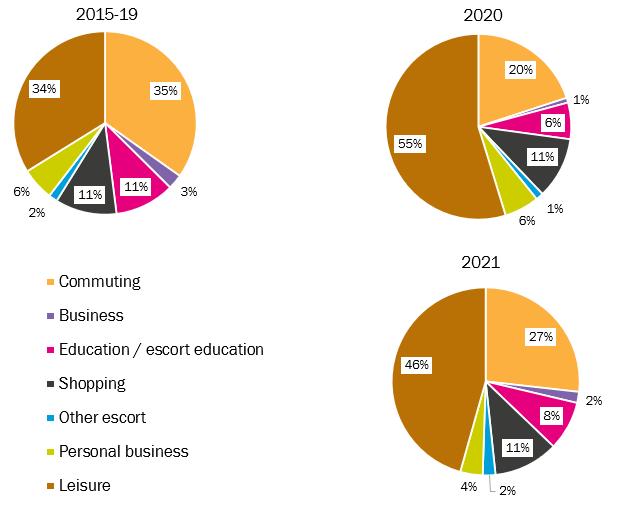
England: purpose of cycle trips
* Leisure is here defined as: “Visit friends at home and elsewhere, entertainment, sport, holiday and day trip.”
Note: The Active Lives Survey asks adults how often they’ve cycled for travel or for leisure (which refers to cycling “for the purpose of health, recreation, training or competition, not to get from place to place”) – please see Q2 above for more on this.
28
Wales
• In Wales (2014-15, the last time National Survey Wales respondents were asked this question), ‘getting to or from work/business’ (30%) was the most common purpose for their most recent active travel journey by bicycle.
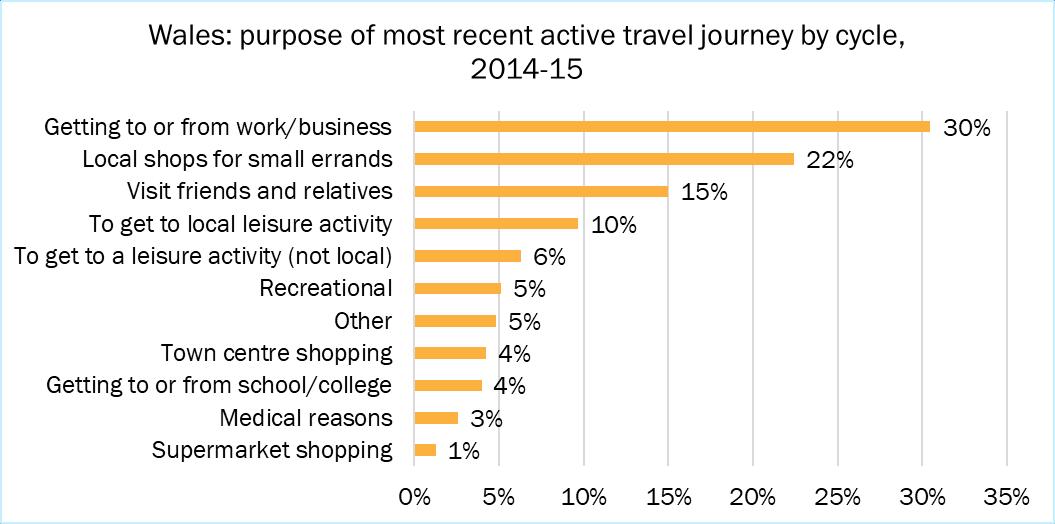
• Just over a fifth of respondents said their purpose was going to the local shops for small errands (22%); while another fifth or so (21%) cited local or non-local leisure activities or recreation (NSW, results viewer):
Scotland
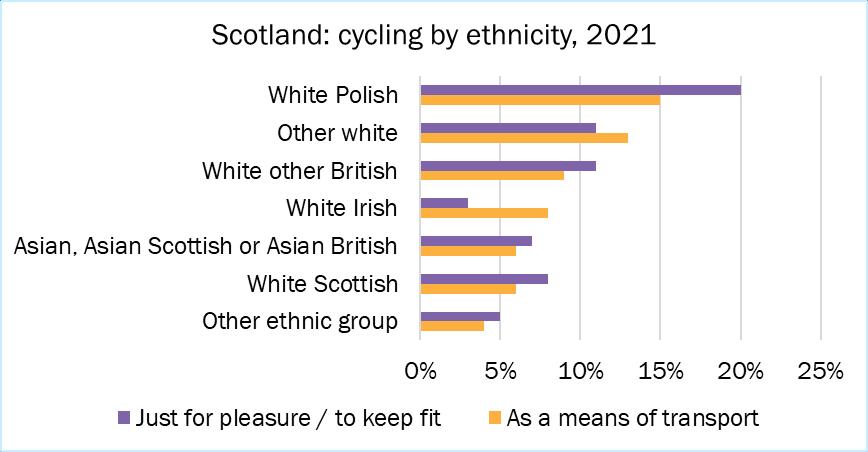
• In Scotland, cycling ‘just for pleasure’ seems to rather more popular than cycling as a means of transport. Note: figures for 2021 are not directly comparable with previous years. The question is not asked every year. (TATIS 2021, SHS Table 3a).
Northern Ireland
Data on the purpose of cycling journeys are not readily available.
29
Q9. What proportion of children cycle to & from school and how far do they travel?
England
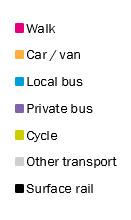
• On average (2015-19), only about 2.2% of children aged 5-16 travelled to school by cycle. In both 2020 and 2021, this figure was slightly higher at 2.5%.
• Walking is the most popular way of travelling to and from school – usually more than two-fifths of trips (almost half in 2020). This is followed by driving at around 35%-37% of trips
England: trips to and from school
• For every year since 1995/97, 11-16 year-olds were more likely to cycle to school than 5-10 year-olds, but the gap was particularly pronounced in 2021 at 4.9% compared to 0.6%

England: cycle trips to & from school by age group
30
2015-19 2020 2021 5-10 years 1.4% 1.3% 0.6% 11-16 years 3.1% 3.6% 4.9%
• As so few children cycle to school, year-on-year survey findings should be treated with some caution, but the proportion appears to have risen to over 2% more often in the last ten years (2012-21) than it did in the ten years before that (2002-11).
• Being driven shows a marked upward trend, rising from 30% in 1995/97 to 37% in 2021.
• The average distance travelled to school in England was about 2.4 miles from 201519, and very slightly less in 2020 & 2021 (2.2 miles).
(All the figures above come from NTS 0613).
• Usually, travel for education contributes significantly to peak-time traffic (all modes of transport), being responsible for about 29% of trips between 8 and 9 am. Escorting others to education accounts for an additional 22%-26%. (NTS 0502).
Note: the pandemic affected data collection and travel in 2020 & 2021. Please note the DfT’s disclaimer, quoted in Q1c.
Wales
• In both 2018/19 and 2021/22, the National Survey for Wales questioned parents about how their children travel to school on an “average (a typical)” day, but the results for cycle were omitted due to small sample sizes. 2014/15 was the last time a figure was estimated and published, and this was only for primary school children (1.7%).
• Results for the 2018/19 and 2021/22 surveys suggest that over half of primary pupils go by car; and about 45%+ walk
• Results also suggest that around a third of secondary children are driven to school, and about the same walk
Note: The survey invited parents to tick more than one option. (NSW, results viewer / ATWCWales 2021/22).
31
Scotland
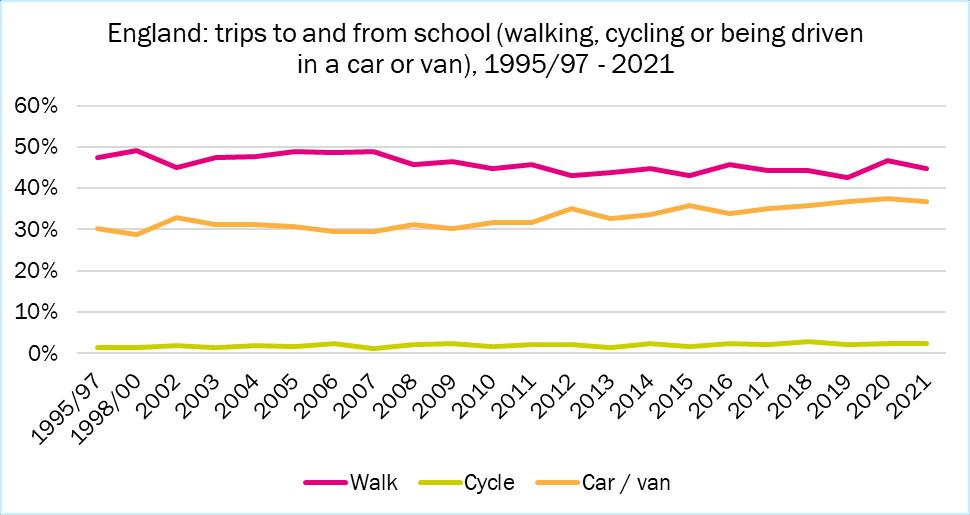
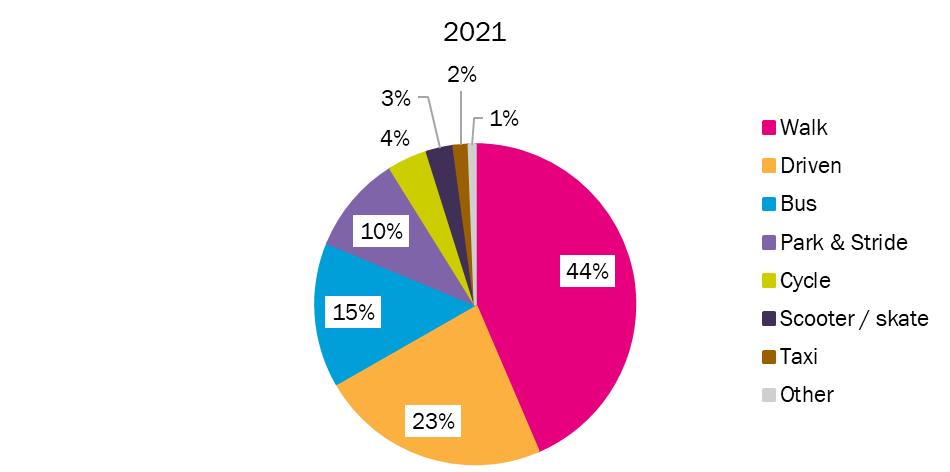
• Scotland’s ‘Hands Up’ survey, carried out by Sustrans, suggests that about 4% of children say they normally cycle to school (all schools, excluding nurseries).
• Another 44% walk; 10% or so ‘park & stride’; 3% scoot or skate; 23% are driven; 15% go by bus; and 2% take taxis.
Scotland: how pupils ‘normally travel to school’ (‘Hands Up’ survey)
All schools, excluding nurseries
• Since 2008, when the ‘Hands Up’ survey began, the proportion of children walking shows a downward trend, although it picked up somewhat in 2020 and 2021.
• The Scottish Household Survey suggests a lower figure for cycling to school: about 1.9% for 2018 & 2019; 2.1%, for 2020; and back to 1.9% for 2021 (figures for the latter two years are not directly comparable with previous years because of Covidrelated changes to the survey). (TATIS 2021, Table Sum1).
32
Northern Ireland
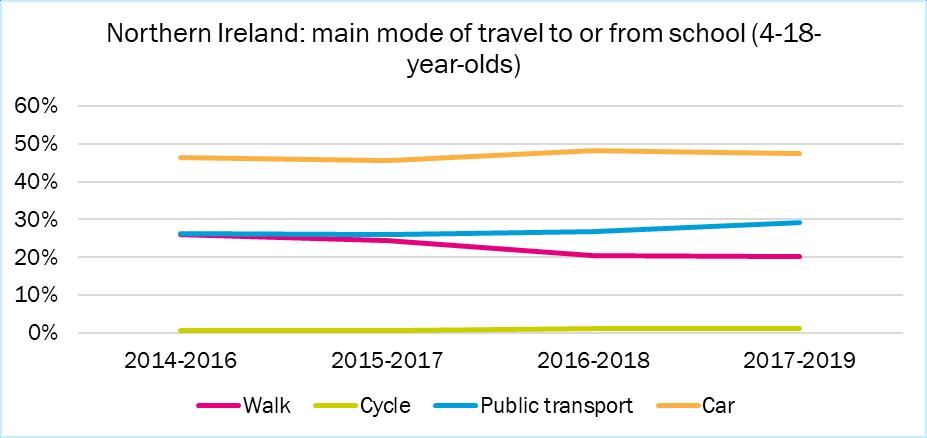
• In 2017-19, only about 2% of 4-11 year-olds cycled to school. Almost two-thirds went by car (61%), and about a fifth walked (21%)
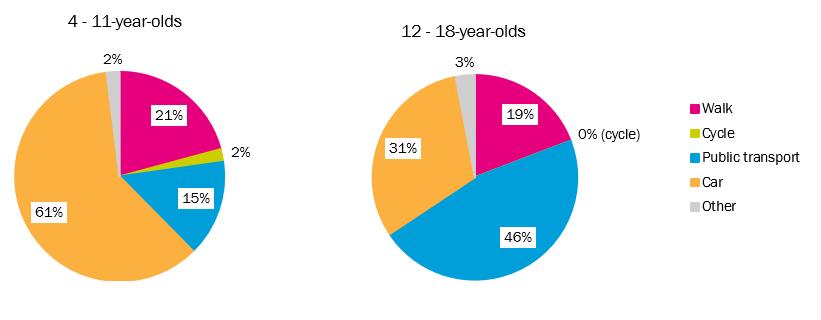
• In 2017-19, the cycling figure for 12-18 year-olds seems to be so negligible that it’s presented as 0%. Nearly half took public transport (46%), just under a third were driven (31%), and about a fifth walked (19%).
Northern Ireland: main mode of travel to or from school, 2017-19
• Broadly speaking, school-run patterns have changed little since 2014-16, although walking has dropped among younger children (from 34% to 21% in 2017-19), leading to an overall downturn for all ages (walking among older pupils rose slightly from 16% to 19% over the same period). (TSNI Headline report 2017-19, Table 5 – the sample size was too small for robust analysis in both 2020 & 2021)
33
Q10. What about cycling to work?
England
• Usually, around 4% of commuting trips among all employed people (full-time, parttime or self-employed) are cycled
• The majority of commuting trips are driven.
England: commuter trips by main mode
• On average from 2015-19, employed/self-employed people made 285 commuting trips a year. In 2020, this figure dropped to 184, rising a little to 201 in 2021. (NTS 0412). !Please note the DfT’s disclaimer for 2020 & 2021 (see Q1c above).
England & Wales (Census 2021)
The Census, which the Office of National Statistics (ONS) conducts every ten years and surveys the entire population, asks people about their ‘method of travel to work’.
• In 2021, 2% of people said they used a bicycle. Ten years earlier, 2.8% said the same
The 2021 Census, however, took place during the pandemic so, as the ONS says: “the national lockdown, associated guidance and furlough measures will have affected the travel to work topic.” See Cycling UK’s blog for more on the 2021 results.
34
Wales
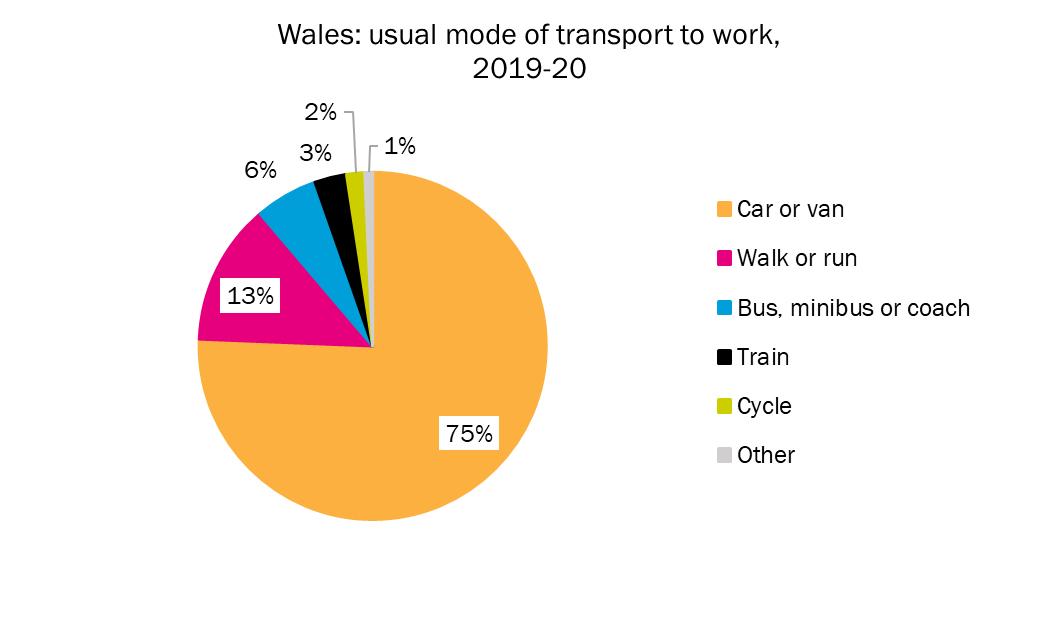
• In 2019/20, around 2% of respondents to the National Survey Wales said they usually travelled to their workplace by cycle (figures/sample sizes for motorcycling and taxi were too small to publish). This was the first time the question was asked since 2014/15, when 4% said they usually cycled to work. In both periods, threequarters commuted by car or van. (NSW, results viewer, ‘Active travel’ & ‘Transport’ questions).
Scotland
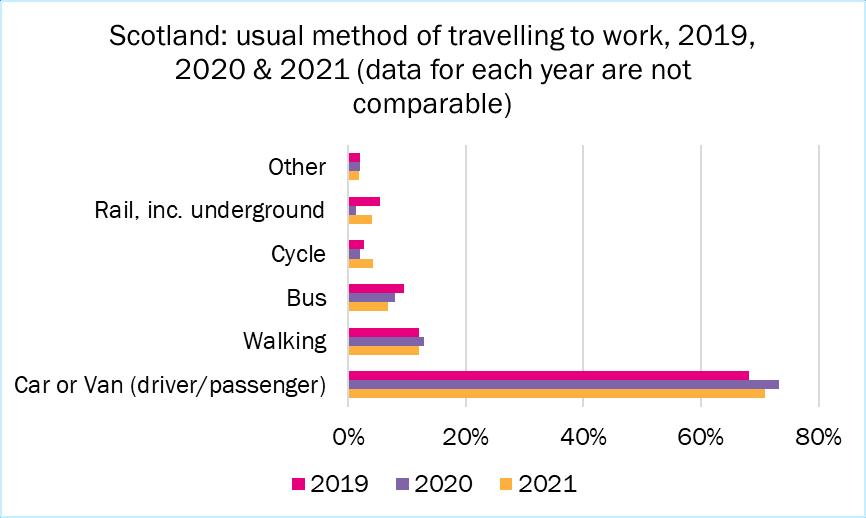
• In 2019, about 3% of employed adults said they usually cycled to work, as opposed to 68% who said they drove or were driven. (16% said they worked from home).
• In 2020, these figures were 2% and 73% respectively (52.5% worked from home).
• In 2021, 4% cycled, and 71% drove/were driven (40% worked from home).
Note: Changes to the survey methodology mean that these three years should not be compared).
35
(TATIS 2021, Table Sum 1).
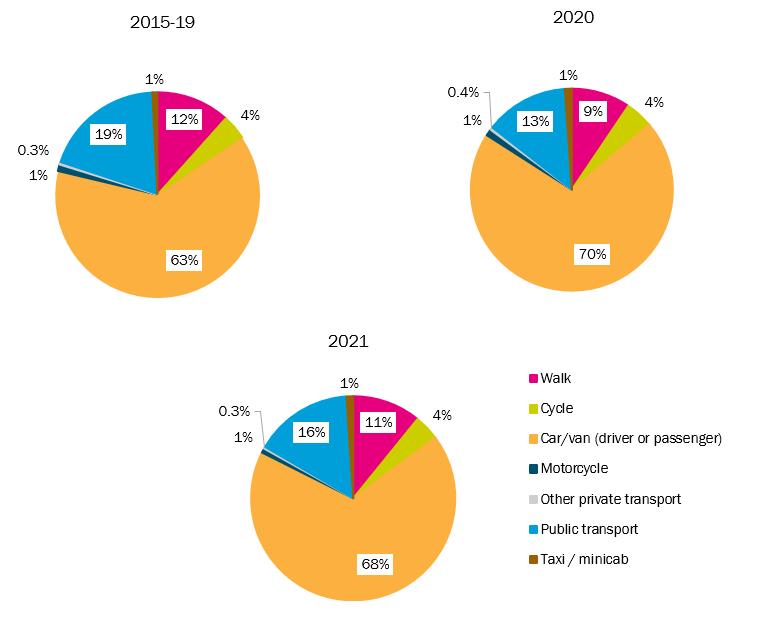
Northern Ireland
• Figures for 2017/19 suggest that 1% of workers cycle-commuted. In 2020, the proportion rose to 4% (but changes in the survey methodology means that the results are not comparable to earlier years).
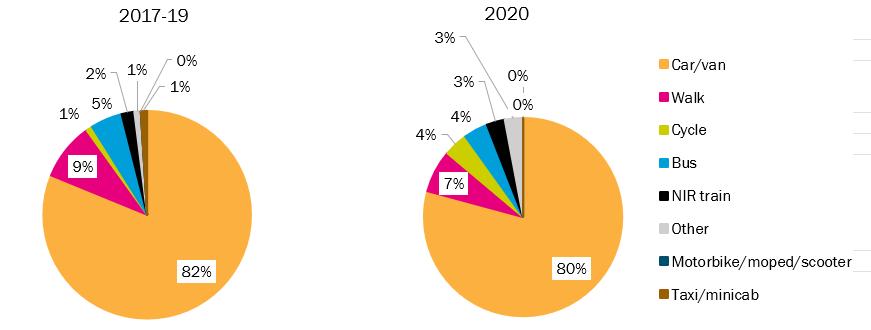
• About four-fifths of commuters drive.
Northern Ireland: method of travel to work
(TSNI, In-depth report 2020, Table 4.3).
36
Q11. Occupation, income, ethnicity and disability
England Occupation
• In ‘normal’ years (2015-19), people who fall into the ‘not classified’ category – mostly full-time students – are more likely to cycle than others, closely followed by those in ‘managerial & professional occupations’.
• The picture is rather more mixed for 2020 & 2021, probably due to the pandemic’s impact on travel and working habits. All groups cycled more in 2020 than usual.
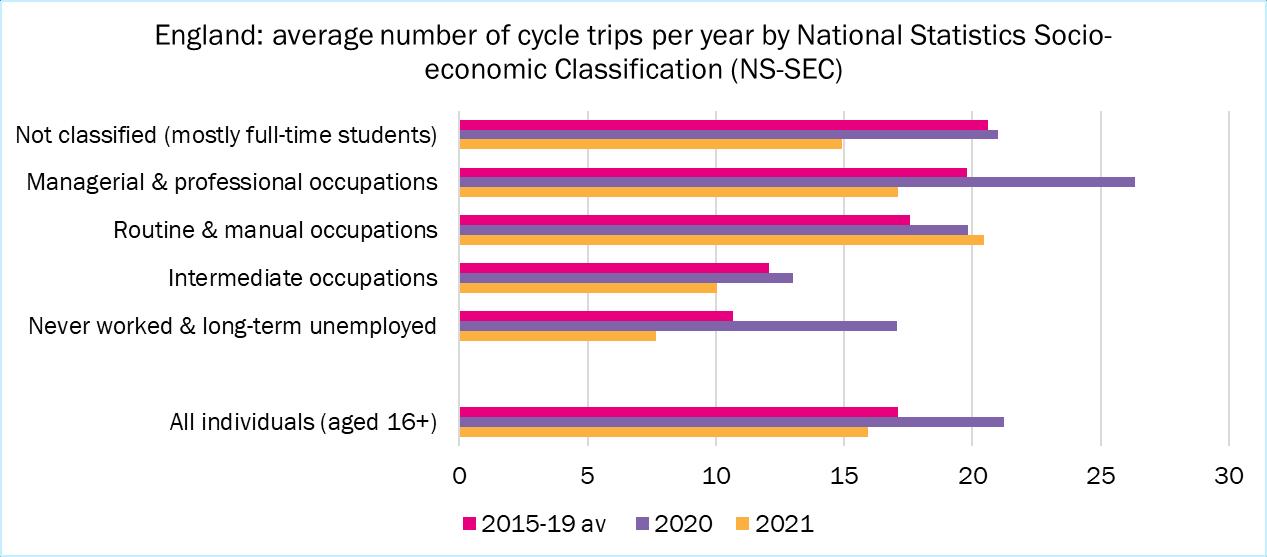
• People in ‘intermediate’ occupations, and those who have never worked or are unemployed long-term seem least likely to cycle.
• In 2021, people in the ‘routine & manual’ category outdid all other groups.
(NTS 0708). Income
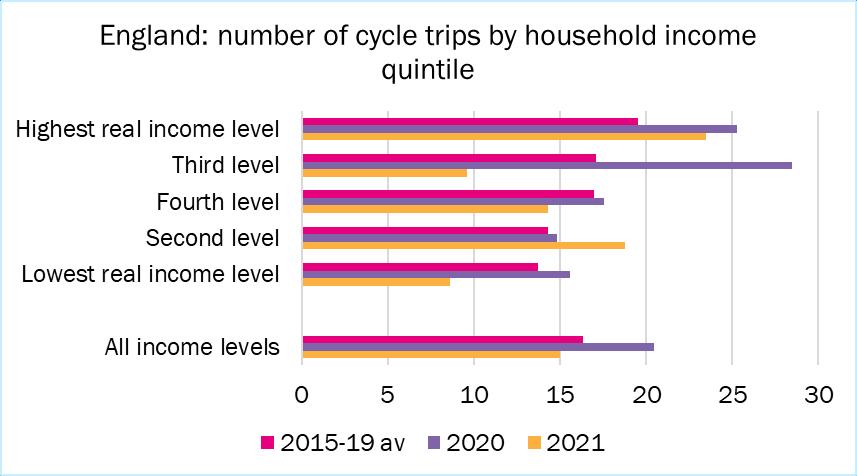
• Generally speaking (excepting 2020), people at the ‘highest real income level’ tend to take more cycle trips per year than those in other income groups, while people at the ‘lowest real income level’ tend to make the least. (NTS 0705).
!Please note the DfT’s disclaimer for 2020 & 2021 data, quoted in Q1c above.
37
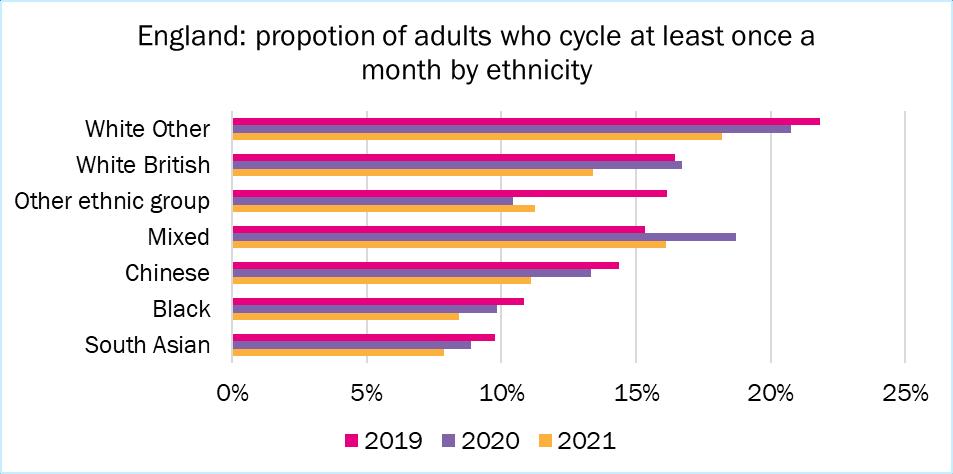
Ethnicity
• Generally speaking, adults (aged 16 and over) who describe themselves as ‘White Other’ are more likely to cycle once a month than other ethnic groups, while those who describe themselves as either ‘Black’ or ‘South Asian’ are least likely. (CW 0305).
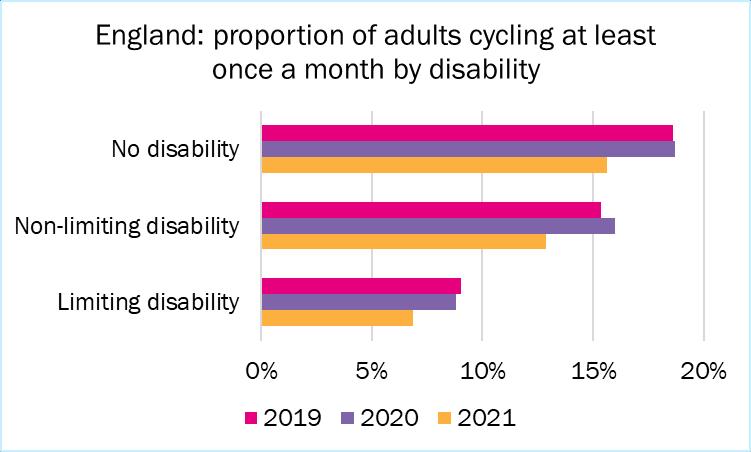
Disability
• Adults with a limiting disability are less likely to cycle at least once a month than adults with either no disability or a non-limiting disability. (CW 0305).
38
Wales
The National Survey asks people aged 16 and over about long-term health conditions and disability (termed ‘long-term illnesses’). The list is quite wide-ranging (including, for example, mobility problems, sensory deficits, diabetes, heart conditions, learning impairment etc.). People reporting such conditions cycle less often than those who don’t.
Wales: how often used a bike to get somewhere, 2021-22
Has a limiting long-standing illness
Frequency of cycling
Source: NSW, data obtained by special request.
Scotland
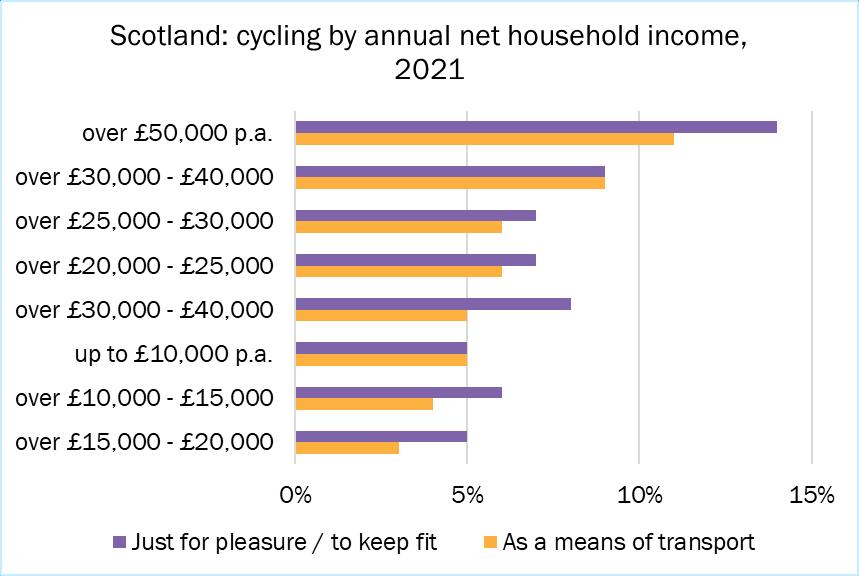
Income
• In 2021 (as in 2019), people in households with higher net incomes were more likely to say they’d cycled in the last seven days that those with lower incomes.
39
Yes No Every day or several times a week 2% 3% Once or twice a week 1% 3% Once or twice a month 2% 4% Less often / never 95% 89%
Ethnicity
• In 2021, those who identified themselves as ‘White Polish’ were most likely to say they’d cycled in the last seven days than those in other ethnic groups. (In 2019, ‘Other white’ were most likely to say this).
Disability
• In 2021, people who said they were ‘not disabled’ were far more likely to say they’d cycled in the last seven days than those who said they were disabled.
Note: All the charts for Scotland in this section are based on TATIS 2021, Table 25a.

40
Northern Ireland
Note: published demographic data related to cycling is limited in Northern Ireland.
• In 2017/2018, of the people who said that they have use of a bicycle (CNI 2b), the “economically active” were as likely to cycle as those “economically inactive” (27%). (CNI 2b)
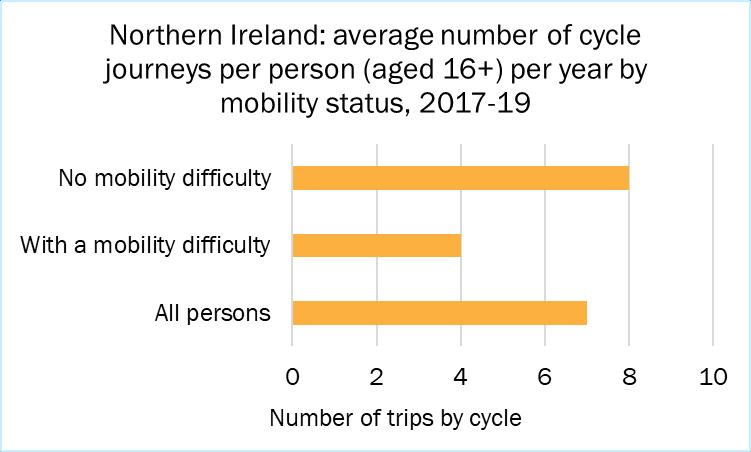
• According to Northern Ireland Transport Statistics, Table T3.6, in 2017-19 adults with no mobility difficulty made twice as many cycle trips a year than people with a mobility difficulty (i.e. those who say have difficulties travelling on foot, by bus/coach, by train or any combination of these)
41
Q12. How many cyclists drive? And how many drivers cycle?
• According to the answer to a question Cycling UK asked the Department for Transport (England), almost everyone who cycles at some point during the year not only holds a driving licence but also uses it.
In 2021:
• 100% of people who cycle and hold a driving licence also drive
• 87% of people aged 18 years+ who cycle hold a driving licence
• 87% of people aged 18 years+ who cycle also drive
• 36% of people who hold a driving licence also cycle
Note: this data comes originally from the National Travel Survey (NTS), which covers households in England only. ‘People who cycle’ include all those who reported that they cycled more often than “less than once a year”.
* ! Please also note DfT’s disclaimer for 2021: “Due to changes in the methodology of data collection, changes in travel behaviour and a reduction of data collected during 2021, as a result of the coronavirus (COVID-19) pandemic, care should be taken when interpreting this data and comparing to other years, due to the small sample sizes.”
42
Q13. What kinds of roads are people most likely to cycle on?
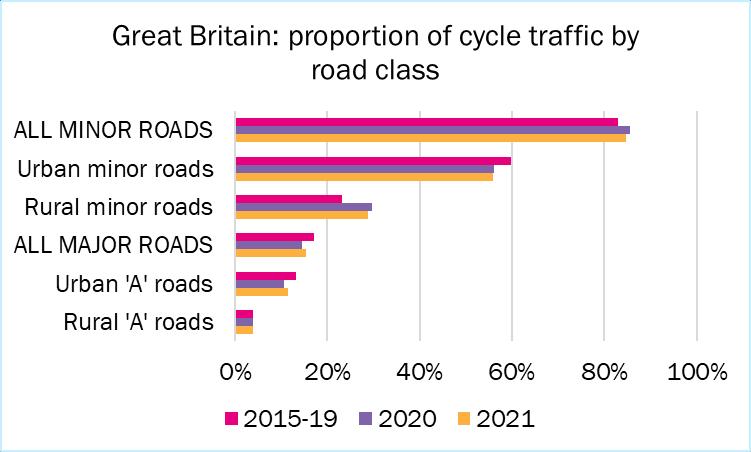
• Over four-fifths of cycling takes place on minor roads, mostly minor urban roads (TRA 0402 – covers roads only, not off-road on bridleways or byways etc.).
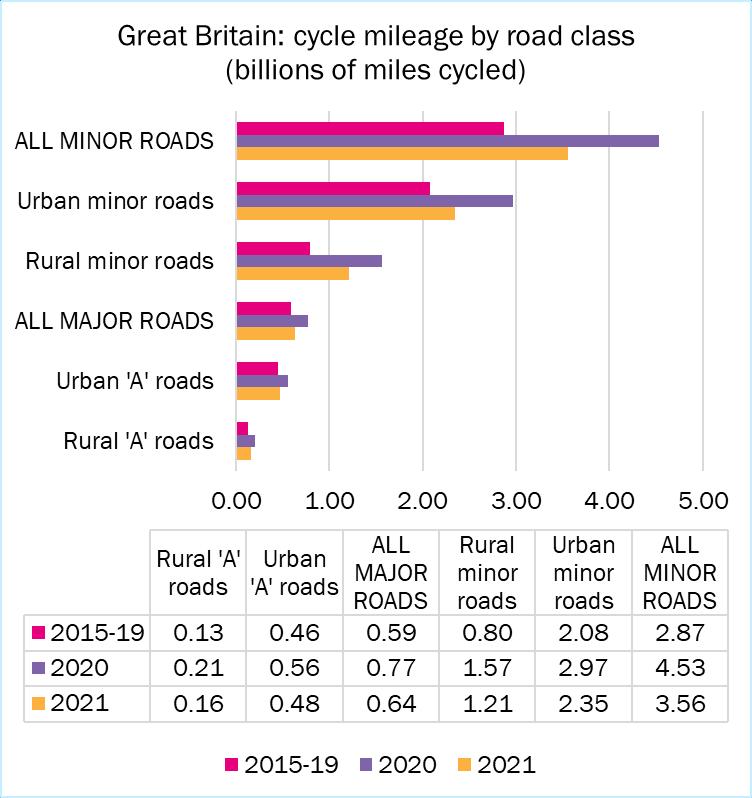
Note: The DfT has revised estimates since 2000 following a minor road review. This explains the slight difference between the above figures and those published last year.
Note: Comparable figures for Northern Ireland are not readily available.
43
Q14. Which local areas see the most cycling?
Note: each of the tables in this section uses a different measurement. Also, figures for individual authorities fluctuate quite a bit from year to year (this could be, for example, because of small sample sizes in some areas and/or few people cycling – i.e. adding a handful of extra cyclists one year to the handful of cyclists found cycling the year before would double the percentage).
This means that the following data aren't a perfect reflection of cycle use, or progress on it, in any given area, but they do provide some indication. Topography, the density of settlements, population, demographics and urban/rural split are factors to consider too, when comparing authorities.
England
• In 2021, more people cycled at least once a week in Cambridge (nearly 43%) than in any other local authority area. Cambridge has topped the list every year from 2016, when these data were first published. Oxford always does very well too.
• The average for England was 9.1%.
• The table below shows the top twenty-five authorities in 2021.
England: proportion of adults cycling at least once a week, top 25 local authorities, 2021
ENGLAND (average)
*Sample sizes for Isles of Scilly are very small, so interpret these results with caution
(CW 0302)
Note: this chart is rather unfair on authorities who clocked up 14.7%, or not far off. So, do have a look at DfT's walking and cycling statistics for more. These cover all local authorities in England, so you can check the list to find out how they rank. The list also breaks cycling down into leisure and travel (the table above gives figures for ‘any cycling’), and other frequencies.
44
1 Cambridge 42.6% 14 Camden 17.5% 2 Oxford 33.5% 15 Norwich 17.4% 3 Isles of Scilly* 24.1% 16 Inner London 17.4% 4 Islington 23.8% 17 Oxfordshire 16.9% 5 Hackney 23.4% 18 Westminster 16.2% 6 Hammersmith & Fulham 22.5% 19 Hart 16.0% 7 South Cambridgeshire 22.3% 20 York 16.0% 8 Wandsworth 20.7% 21 Bristol, City of 16.0% 9 Cambridgeshire 19.7% 22 Epsom and Ewell 15.3% 10 Southwark 19.5% 23 Exeter 15.1% 11 Lambeth 18.8% 24 Chichester 14.8% 12 Kensington & Chelsea 18.7% 25 Elmbridge 14.8% 13 Richmond upon Thames 18.4% 9.1%
Wales
According to the statistical bulletin on walking and cycling in Wales for 2018/2019: “Due to the small numbers of people who cycle as a means of transport, it is not possible to produce reliable statistics for frequency of cycling at the local authority level. We can however look at those who used a bicycle as a means of transport in the previous three months more frequently than once a month, though sample sizes are still low so these estimates should be interpreted with caution.”
With that in mind, around:
• 16% of respondents in Cardiff said they’d cycled more often than once a month in 2018/19, putting it at the top of the chart. The city came a good second to Flintshire in 2017/18, both scoring around 17%.
• Ceredigion and Swansea appeared in the top five in each of these surveys, although Flintshire came 7th in 2018/19 at about 12%.
(ATWCWales: releases April 2017 to March 2018, and April 2018 to March 2019, Chart 9)
Note: no figures for subsequent years are available.
Scotland
• Edinburgh and Highland usually top the charts for the proportion of people cycling regularly to work. The chart below includes all the local authorities in Scotland:
Scotland: proportion of people cycling regularly to work, 2021
45
(CSCD) 1 Edinburgh, City of 13.2% 17 East Lothian 3.7% 2 Highland 13.1% 18 South Lanarkshire 3.3% 3 Scottish Borders 8.2% 19 Clackmannanshire 3.2% 4 Glasgow City 7.6% 20 West Dunbartonshire 3.2% 5 Angus 7.0% 21 West Lothian 3.1% 6 Stirling 7.0% 22 North Ayrshire 2.7% 7 Dumfries & Galloway 6.7% 23 Renfrewshire 2.7% 8 Orkney Islands 6.5% 24 Aberdeenshire 2.5% 9 Midlothian 5.6% 25 East Renfrewshire 2.5% 10 Moray 5.5% 26 North Lanarkshire 2.4% 11 Fife 4.9% 27 Argyll & Bute 2.3% 12 Aberdeen City 4.8% 28 East Ayrshire 2.2% 13 Perth & Kinross 4.8% 29 Shetland Islands 2.0% 14 Dundee City 4.3% 30 Na h-Eileanan Siar 1.6% 15 Falkirk 3.9% 31 Inverclyde 1.5% 16 East Dunbartonshire 3.8% 32 South Ayrshire 1.2%
Northern Ireland
• In 2017-19, Belfast saw a higher proportion of journeys by cycle than anywhere else (2%). (TSNI in-depth report, table 3.5):
Nothern Ireland: journeys per person per year by cycle, 2017-19
Note: the sample size was too small to be broken down by Local Government District in 2020.
46
Belfast 2% Antrim and Newtownabbey 1% Lisburn and Castlereagh 1% Mid and East Antrim 1% Mid Ulster 1% Newry, Mourne and Down 1% Armagh City, Banbridge and Craigavon 0% Causeway Coast and Glens 0% Derry City and Strabane 0% Fermanagh and Omagh 0% Ards and North Down 0% All Northern Ireland 1%
Q15. How do UK levels of cycling compare to those in other European countries?
Not well.
• According to data on ‘cycling modal share’, collected by the European Cyclists’ Federation (ECF), the UK comes towards the bottom of the list of 28 countries in Europe
European countries: cycling modal share
Source: https://ecf.com/cycling-data
Note: individual countries do not necessarily collect the same kind of data or report on them in the same way. The above table, which covers recent (or fairly recent) years – but not always the same ones – is therefore indicative of the share that cycling enjoys (or does not enjoy), compared to other ways of travelling. It’s fair to say, though, that the Netherlands always rises to the top, and the UK is never anywhere near it.
The ECF has also published a report, The State of national cycling strategies in Europe (2021) This covers 47 European countries, including the UK, England, Wales, Scotland and Northern Ireland.
47
Country Cycling modal share Country Cycling modal share The Netherlands 27% Italy 5% Hungary 22% Poland 5% Sweden 17% Estonia 5% Denmark 16% France 4% Finland 13% Luxembourg 4% Germany 12% Bulgaria 3% Belgium 10% Latvia 2% Slovakia 8% UK 2% Austria 7% Spain 1% Ireland 7% Greece 1% Lithuania 7% Republic of Cyprus 1% Czech Republic 6% Malta 1% Slovenia 6% Portugal 1% Romania 6% Croatia n/a
• A survey of 27,565 people across Europe, which asked about their main mode of transport on a typical day in 2019, puts The Netherlands top again by a long way, and the UK even further down the chart. The top seven countries are the same as in the chart above from the ECF.
Note: this survey lumped privately owned bikes/e-bikes in with scooters/e-scooters
Source: Mobility and Transport, Special Eurobarometer 495, European Commission (July 2020)
The Netherlands
Looking at The Netherlands in particular, in 2019:
• 4.8 billion trips were made by bicycle, covering 17.6 billion km. This equates to 3km of cycling per day per person
• More than one-quarter (28%) of all trips were primarily by bicycle
• 8% of the total distance travelled was cycled
• Trips for leisure purposes accounted for one-third of the total distance cycled, followed by bicycle trips for shopping purposes and home-work commutes
• More than half (52%) of all education-related trips were cycled
• Working people used cycles for approximately 27% of their home-work commutes This percentage is higher for those who travelled relatively short distances: 55% of those residing within 5 km of their workplaces commute to work by bicycle
For more facts on levels of cycling in the Netherlands, see Cycling facts: new insights, from KiM Netherlands Institute for Transport Policy Analysis, Nov 2020.
48
The Netherlands 41% Estonia 4% Sweden 21% Italy 4% Germany 15% Romania 4% Hungary 14% Slovenia 4% Finland 13% France 3% Belgium 12% Bulgaria 2% Denmark 12% Greece 2% Latvia 8% Spain 2% Austria 8% Luxembourg 2% Poland 7% Malta 2% Czechia 6% UK 2% Croatia 6% Ireland 1% Slovakia 6% Republic of Cyprus 0% Lithuania 5% Portugal 0%
Proportion of people using a privately owned bike or scooter (including electric ones) as their mode of transport on a typical day, 2019
Q16. How safe is cycling?
Of course, every road crash victim is a victim too many. Cycling is safer than many people think it is, though
In ‘normal years’ (2015-2019, GB), over a distance equivalent to 1,000 times round the earth at its widest point:
• One cyclist was killed (0.72, in fact)
• 32 were seriously injured
• 97 were slightly injured
• The figures for 2020, when motor traffic dropped significantly (see Q1d) and cycling levels rose, are: 0.66 (killed); 20 (seriously injured); 56 (slightly injured).
• The figures for 2021 are: 0.66 (killed); 26 (seriously injured); 71 (slightly injured).
Source: calculated from RAS 0201 (adjusted figures) & TRA 0401
Notes:
These figures are derived from police records and cover public roads, so don’t include people who are hurt in incidents that are not reported to the police, or those that happen off-road. See also note on under-reporting below.
The DfT has revised pedal cycle traffic figures for the last few years, hence the slight difference between the above results and those published previously.
On Britain’s public roads:
• There are around 9 to 10 million cycle trips for every cyclist fatality.
• For every 1,000 hours of cycling, there were: 0.045 injuries (all severities combined) reported to the police from 2015-19; 0.025 in 2020; and 0.040 in 2021). About three-quarters of these injuries were slight.
(Source: calculated from RAS 0201 & NTS 0303 NTS trips figures, which cover England only, are used here as a proxy for GB).
Also, the health benefits of cycling outweigh the injury risks by between 13:1 and 415:1, according to various studies (and depending on the benefits/disbenefits considered).
Despite this, many people are put off cycling because they think it's unduly risky:
• Around two-thirds of the population aged 16+ agree/strongly agree that it is too dangerous to cycle on the roads (National Travel Attitudes Survey, 0101a).
Cycling UK believes that, unfortunately, the behaviour and attitudes of some road users, speed, lorries, the sheer volume of motor traffic and substandard road layout all conspire to make cycling feel and look more dangerous than it actually is.
It is equally important to stress that, compared to those in charge of motor vehicles, cycle users cause negligible harm to other road users. See, for example, What kills most on the roads, a report from the Parliamentary Advisory Council for Transport Safety (PACTS), 2021.
49
Risk per billion miles: is it going up or down?
We think it’s important not to measure the risk of cycling by the number of cyclist casualties alone (‘absolute numbers’).
This is because a rise in the number of cyclist casualties may not mean that cycling is becoming riskier, but that more people are out on their bikes. Similarly, a drop in cycling could explain a drop in casualties.
To find out whether the risk of cycling is going up, staying the same or going down, therefore, we need to look at casualty numbers in terms of cycling levels (the rate).
For example, if we find that cycle mileage or the number of trips by bike are rising more steeply than casualties, it suggests that cycling /cycling conditions have grown safer because that works out at fewer casualties per mile or trip
Looking at rates, therefore:
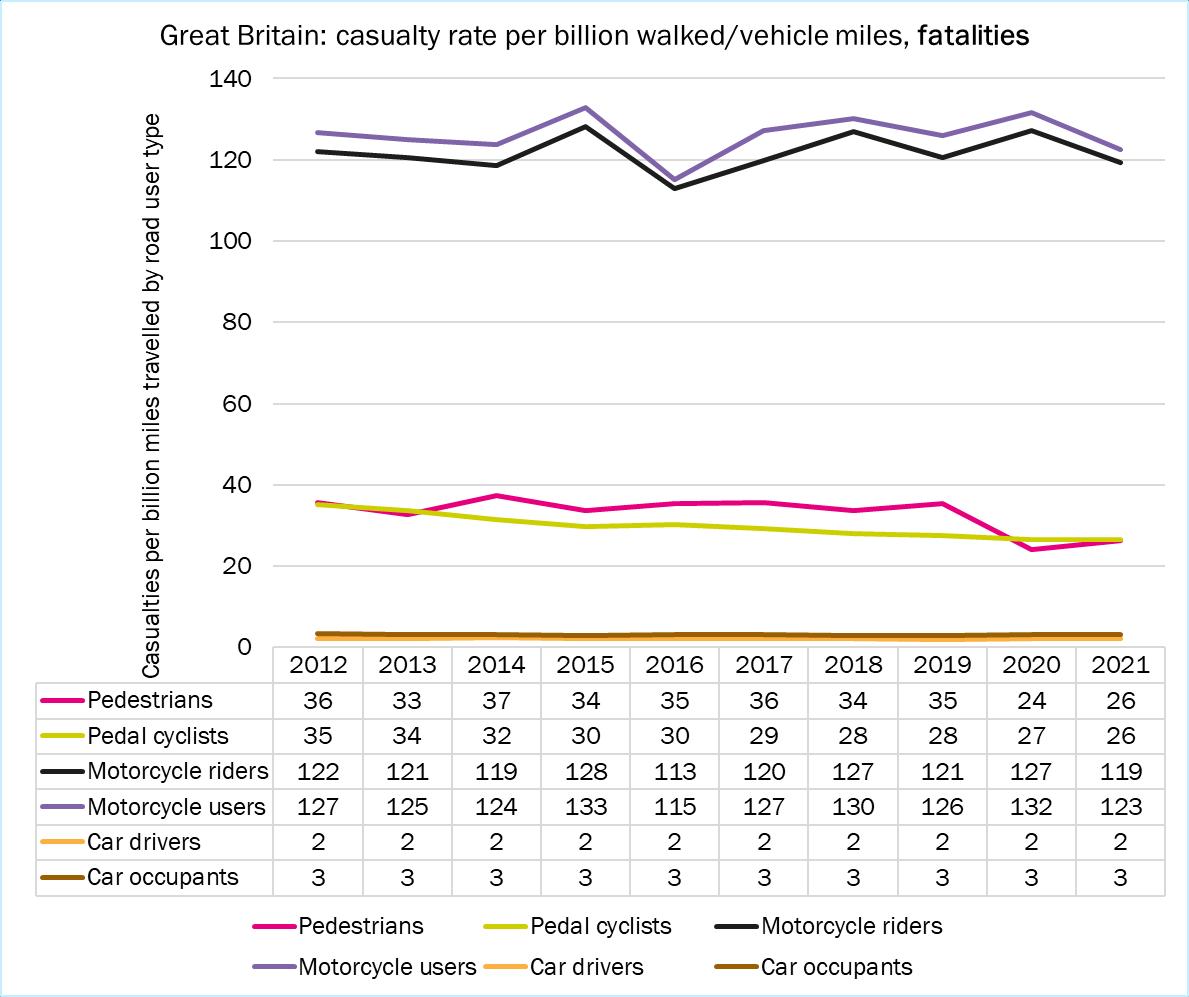
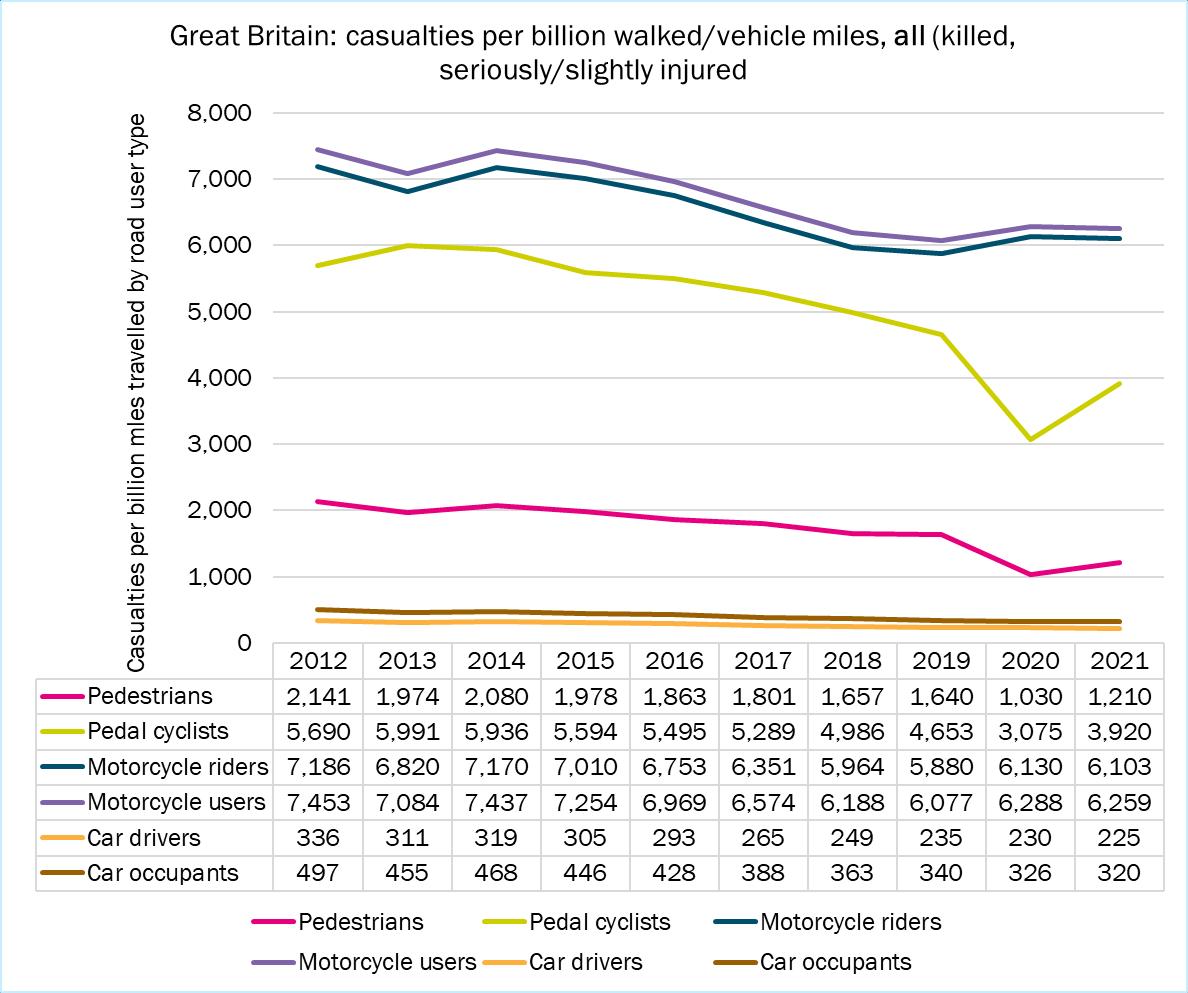
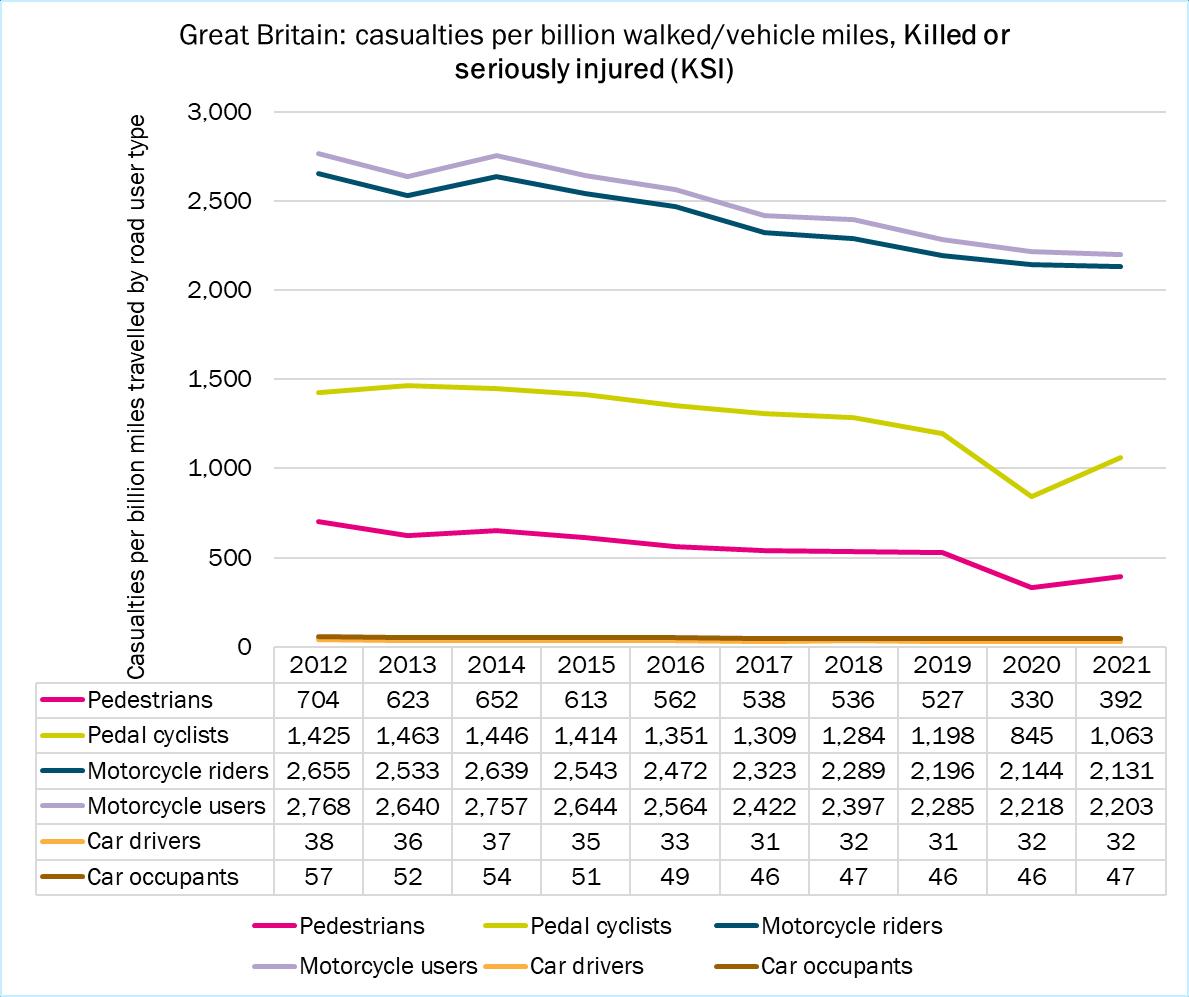
• Calculations based on traffic counts from 2012 to 2021 suggest that the risk of being killed whilst cycling per billion miles cycled has been trending downwards, as has the risk of being seriously or slightly injured.
• Compared to the rate for pedestrians, cyclists are about as likely to be killed, but more likely to be seriously or slightly injured. The casualty rate for car drivers is considerably lower than both, while for fatalities and serious injuries, motorcycle riders are at far higher risk.
50
Source for the charts above: RAS 0201
51
This table shows the number of cyclist casualties in each nation. (RAS 0402):
Cyclist casualties by nation (numbers)
* Figures for England, Wales & Scotland are adjusted to account for changes in police reporting; Northern Ireland's figures are unadjusted.
Please note that the figures above originate from police reports (STATS19).
Under-reporting
While most, if not all, road fatalities are reported to the police, a proportion of non-fatal casualties are not, even if someone goes to hospital for treatment and/or a compensation claim ensues. The Department for Transport (DfT) estimates that this is, in fact, a ‘considerable’ proportion.
Academic analysis of National Travel Survey (NTS, England) data on self-reported road traffic injuries suggests that, in particular, a large number of injuries to cyclists are not reported to the police but that these are probably minor (e.g. cuts and bruises not requiring medical attention).
That said, the DfT has also compared STATS19 data to alternative sources, such as the NTS, Hospital Episode Statistics (HES), Compensation Recovery Unit data and Motor Insurance Claims Statistics, and concludes that STATS19 capture trends robustly, despite quantitative differences between them and the other sources considered.
52
20152019 average 2020 2021 20152019 average 2020 2021 Killed 90 124 94 4 6 7 KSI* 4,100 4,087 4,124 155 134 135 All casualties 16,867 15,322 15583 445 372 363 20152019 average 2020 2021 20152019 average 2020 2021 Killed 6 11 10 2 4 0 KSI* 286 255 205 52 49 64 All casualties 703 600 512 301 256 282 Scotland Northern Ireland
England Wales
Q17. How many cycles are sold in the UK?
The Bicycle Association is a good source of figures for cycle sales in the UK. Note: generally speaking, organisations who collate and publish data on the cycle market make a charge for it.
Q18. What’s the average weekly spend on bikes?
The Office for National Statistics (ONS) publishes detailed data on how much households spend on transport each week (Family spending workbook 1: detailed expenditure and trends, table A1, section 7).
These results, however, are not specific enough to capture the average outlay of people who spend money on cycling and their cycles. Instead, they average out the expenditure of all households surveyed, whether they report expenditure on the item in question or not.
Also, as we know from answers to the questions above, adult household members are much more likely to drive than cycle so are more likely to spend money on cars than cycles.
Bearing that in mind, these are the results for 2021:
The ONS also surveys households on their expenditure on vehicle insurance, but does not break it down into different kinds of vehicles (section 12 of table A1). On average in 2021, the average household spent £11.10 on vehicle insurance each week (probably most of this goes on insuring cars).
53
Cars/van Bicycles* Public transport All transport costs** Purchase (new/second hand; outright or loan/hire) 28.40 0.90 Spares/accessories/repairs/servicing 7.90 0.50 Fuel (petrol, diesel and other motor oils) 11.30 0.00 Other motoring costs (subscriptions, garage rent, washing, fines, permits, tolls, fees, lessons, anti-freeze, battery water, cleaning materials) 1.70 0.00 Fares (rail, tube, bus, coach, taxis/hired cars with drivers) 0.00 0.00 1.70 TOTAL 49.30 1.40 1.70 60.80
UK: weekly household expenditure on transport, financial year ending 2021 (£)
** Includes all spending on cars, vans, motorcycles, car leasing (£5.80) public transport, air fares, ferries, taxis, vehicle hire, school travel, etc.
* 'Bicycles' includes 'other vehicles'
Q19. How many cycles are stolen in the UK?
Bike security is a serious concern for people who already cycle, and for anyone who's thinking of taking it up.
England & Wales
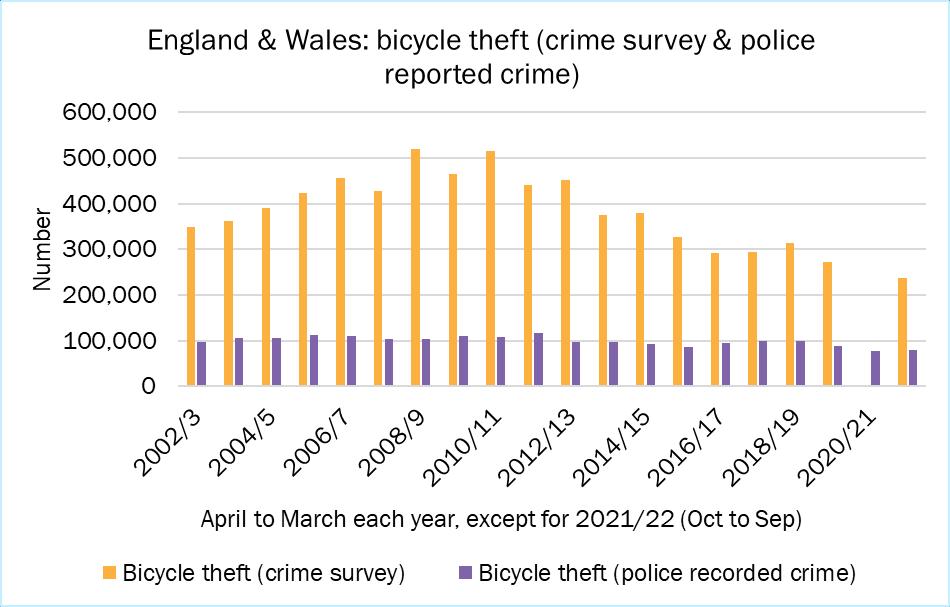
• Figures gathered via a household survey suggested that there were around 236,900 incidents of bicycle theft from October 2021 to the end of September 2022 (adults aged 16 and over/households).
• Clearly, by no means all of these incidents reported to the police, who recorded roughly 78,600 bicycle theft offences for the same period.
• Broadly speaking, it looks as if incidents of bicycle thefts at least have been trending down for the last decade or so
Source: Crime in England and Wales, tables A1a and A4. (Please note that both of these sources use the term ‘bicycle’).
Scotland
• Best estimates suggest that about 19,000 bicycle theft crimes were committed in 2019/20, affecting approximately 0.7% of households. (Note: this comes from a crime survey, not police records).
Source: Scottish Crime and Justice Survey: main findings. (Tables A1.1 & A1.5).
54
Northern Ireland
• Best estimates for 2019/20 suggest that: around 0.6% of households and 1.6% of bicycle owners (adults) fell victim to bicycle theft; and there were around 5,000 incidents of the crime.
• In 2021/22, the police recorded 700 bicycle thefts (731 in the year before).
Sources: The Northern Ireland Safe Community Survey (Experience of crime tables 2 & 7) & Police Recorded Crime Statistics (Annual trends Table 2.2).
55
Q20. What are our main sources?
Key
• ACMRScot = Annual Cycling Monitoring Report (Scotland)
• ATWCWales = Active Travel Walking and Cycling (Wales)
• CNI = Cycling in Northern Ireland
• CSCD = Cycling Scotland Cycle Open Data
• CW = Walking and cycling statistics (England)
• NSW = National Survey for Wales
• NTAS = National Travel Attitudes Survey (England)
• NTS = National Travel Survey (England)
• RAS = Reported Road Casualties Great Britain
• TATIS = Transport and Travel in Scotland
• TRA = Road Traffic Statistics (GB)
• TSNI = Travel Survey for Northern Ireland
• WCPTNI = Walking, Cycling and Public Transport in Northern Ireland
More about our main sources
!Please bear in mind that the pandemic caused problems for data gathering for both 2020 and 2021 (see introduction above, and refer to the source itself for more detail).
a. Great Britain
Road Traffic Statistics, Department for Transport (TRA)
These are estimates of the vehicle miles travelled each year in Great Britain by vehicle type, road category and region. They are compiled using data from around 8,000 roadside 12-hour manual counts, continuous data from automatic traffic counters, and data on road lengths.
Reported Road Casualties Great Britain, Department for Transport (RAS)
These are annual road casualty statistics released twice each year (the main results usually appear in June, followed later in September by much more detailed data and analyses). They are mostly based on forms (STATS19) filled in by the police when collisions are reported to them, and provide figures for personal injury road accidents, vehicles and casualties involved. Although most tables relate to GB, some offer figures relating specifically to England, Wales, Scotland and (very occasionally) to Northern Ireland.
The devolved nations also publish casualty figures separately:
• Wales
• Scotland
• Northern Ireland
Note on underreporting: not all incidents are reported to the police, so some do not make their way into official statistics
56
b. England
National Travel Survey (NTS) & National Travel Attitudes Survey (NTAS), Department for Transport
The NTS is a household survey that monitors long-term trends in personal travel. It collects data via interviews and a seven-day travel diary, recording how, why, when and where people of all ages travel as well as factors affecting travel. It’s part of a continuous survey that began in 1988, following ad hoc surveys from the 1960s. Until 2013, it covered the whole of Britain, but England alone thereafter.
In 2021, 4,429 households participated fully (a smaller sample than normal because of the pandemic). For each table, the DfT gives the sample size on which its results are based.
From 2019, the DfT has been conducting a National Travel Attitudes Survey (NTAS). This is based on questions asked of NTS respondents who consent to being contacted for further studies. Multiple survey waves are conducted each year.
The NTAS has replaced the questions formerly included in the British Social Attitudes Survey.
Walking and Cycling Statistics, Department for Transport (CW)
These statistics are derived from the NTS (see above) and the Active Lives Survey (ALS).
The ALS is much bigger than the NTS, with around 175,000 adults (aged 16+) taking part. The first ALS was conducted between November 2015 and November 2016.
The relatively large sample size for the ALS makes it a particularly useful source of data on cycling and walking frequencies at local authority level (for most local authorities, the target number of completed questionnaires is 500).
The finer differences between the NTS and ALS are set out here. For example, the definitions of ‘cycling’ are not quite the same.
c. Wales National Survey for Wales, Welsh Government (NSW)
The NSW is a large-scale monthly/quarterly survey involving around 1,000 respondents a month (12,000 a year). It asks people across Wales about several aspects of their lives, including their travel habits (but it does not ask respondents to keep a travel diary, unlike the NTS). Results are published throughout the year, rather than annually.
Wales has committed to introducing a more detailed national travel survey in future.
Active Travel Walking and Cycling Wales, Welsh Government (ATWCWales)
This is a statistical bulletin that presents and analyses the responses to the active travel questions asked in the NSW (see above). Annual reports vary in detail.
57
d. Scotland
Transport and Travel in Scotland, Scottish Government (TATIS)
This bulletin provides the results of the transport and travel questions asked in the Scottish Household Survey (SHS) and uses data from a range of sources for context.
The SHS is a continuous survey, conducted annually since 1999. It includes a travel diary (TD) that asks people to recount details of all the journeys they made the previous day.
TATIS also presents the responses to questions asked in the general social survey. Usually, about 10,000 households are surveyed.
Annual cycling Monitoring Report Scotland, Cycling Scotland (ACMRScot)
This is an annual publication that reports on the national indicators used to monitor progress towards the goals set by the Cycling Action Plan for Scotland (CAPS). It uses several sources, including TATIS, SHS (see above) and road casualty figures. It offers detailed reports on local areas.
Cycling Scotland Cycle Open Data (CSCD)
Maintained and managed by Cycling Scotland, this is an open data portal for active travel across Scotland. It includes a map, and data on local trends, workplace cycling, schools and budgets.
e. Northern Ireland
Travel Survey Northern Ireland, Department for Infrastructure (DfI), (TSNI)
TSNI, which started in 1999, collects information on how and why people travel via a seven-day travel diary and a computer interview.
The NSNI currently surveys about 160 addresses each month, with the total number of ‘useable households’ for 2020 being 415.
Everyone in a household (including children) are eligible, and the results are published annually in three reports: in-depth, headline and technical. Usually, the results from three years are combined, but estimates for 2020 & 2021 are reported as a single years as they are not directly comparable to those from previous years.
Walking, Cycling and Public Transport (WCPTNI) / Cycling in Northern Ireland (CNI)
These two sources are based on questions asked in Northern Ireland’s Continuous Household Survey.
WCPTNI covers public attitudes.
58


