
Evaluating the High-Rise Vegetation of the Bosco Verticale, Milan
Evaluating the High-Rise Vegetation of the Bosco Verticale, Milan
Elena Giacomello & Massimo Valagussa
Research
Funded by: Research Undertaken by:
Bibliographic Reference:
Giacomello, E. and Valagussa, M. (2015) Vertical Greenery: Evaluating the High-Rise Vegetation of the Bosco Verticale, Milan Council on Tall Buildings and Urban Habitat: Chicago.
Authors: Elena Giacomello & Massimo Valagussa
Expert Advisors: Massimiliano Scarpa & Francesco Chianucci
Editorial Assistance: Daniel Safarik & Antony Wood
Layout: Kristen Dobbins
Published in conjunction with the Council on Tall Buildings and Urban Habitat (CTBUH), Arup, and Università Iuav di Venezia.
© 2015 Council on Tall Buildings and Urban Habitat
Printed and bound in the USA by The Mail House
The right of the Council on Tall Buildings and Urban Habitat to be identified as author of this work has been asserted by them in accordance with sections 77 and 78 of the Copyright, Designs and Patents Act 1988.
All rights reserved. Apart from any fair dealing for the purposes of private study, research, criticism or review as permitted under the Copyright Act, no part of this publication may be reproduced, stored in a retrieval system or transmitted in any form by any means, electronic, mechanical, photocopying, recording or otherwise, without the written permission of the publisher.
Trademark notice: Product or corporate names may be trademarks or registered trademarks, and are used only for identification and explanation without intent to infringe.
Library of Congress Cataloging-in-Publication Data
A catalog record has been requested for this book
ISBN: 978-0-939493-42-5
Council on Tall Buildings and Urban Habitat
S.R. Crown Hall Illinois Institute of Technology
3360 South State Street Chicago, IL 60616
Phone: +1 (312) 567-3487 Fax: +1 (312) 567-3820
Email: info@ctbuh.org http://www.ctbuh.org www.skyscrapercenter.com
CTBUH Asia Headquarters Office Room 103, Wenyuan Building College of Architecture and Urban Planning, Tongji University 1239 Si Ping Rd, Yangpu District, Shanghai, China 200092
Phone: +86 21 65982972
Email: china@ctbuh.org
CTBUH Research Office
Iuav University of Venice
Dorsoduro 2006, 30123 Venice, Italy
Phone: +39 041 257 1276
Email: research@ctbuh.org
Unless otherwise credited, all photography is copyright Elena Giacomello
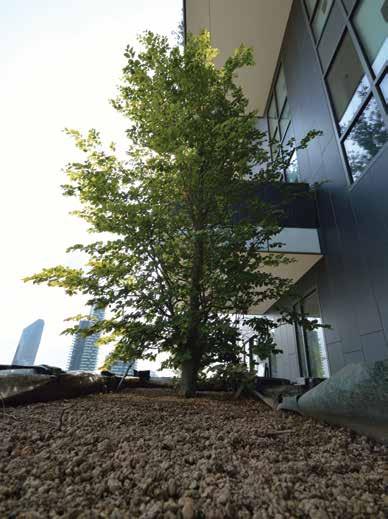
Front Cover: Multiple vantage points of the Bosco Verticale, Milan, Italy
Elena Giacomello and Massimo Valagussa would like to extend their heartfelt gratitude to Hines Italia SGR and Stefano Boeri for their support and to Daniel Safarik and Antony Wood of CTBUH for their editorial assistance. They would also like to thank Luca Buzzoni, Giorgio Ceruti, Paolo Pessina, and Cesare Peverelli for providing important technical information.
Chapter 4 of this report was written by Elena Giacomello and expert advisor Massimiliano Scarpa, with support from expert advisor Francesco Chianucci, who authored the final section of the chapter, entitled: “Use of Digital Photography in Determining Vegetal Cover in Urban Settings.”
Contents About CTBUH
About the Annual CTBUH International
Research Seed Funding Program
About the Authors
Preface
1.0 An Overview of the Bosco Verticale
Introduction & Overview
Local Climate
Benefits of Green Walls
Project Site: Porta Nuova District, Milan
Design Intent
Construction Site During Monitoring
Overall Green Coverage Calculations
2.0 Technology Overview
Building Structural Systems
Planting Restraint Safety System
Building Envelope & Vegetation Layers
Irrigation System
3.0 Monitoring Bosco Verticale’s Trees: Methodology and Results
Monitoring Objectives
Selection of Testing Areas and Trees
Determining the Success of Plantings
and Laboratory
Considerations
4.0 Shading Capacity of Vegetation: Evaluation of the Envelope’s Energy Performance
Greenery in the Context of Tall Buildings
Green Wall Definitions and Typologies
Energy Performance Calculations
Assessment of the Virtual Solar Transmission
Coefficient of Plants and Trees
Input Data
Output Data
Final Considerations
Use of Digital Photography in Determining
Vegetal Cover in Urban Settings
5.0 Assessment of Tree Maintenance at Bosco Verticale
Maintenance of Tall Buildings at Height
Estimating Pruning Costs
Watering and Fertilization Requirements
Final Considerations on Water Needs
6.0 Overall Conclusion
7.0 Appendix
Detailed Data on Individual Trees Studied
The Council on Tall Buildings and Urban Habitat is the world’s leading resource for professionals focused on the inception, design, construction, and operation of tall buildings and future cities. A not-for-profit organization, founded in 1969 and based at the Illinois Institute of Technology, Chicago, CTBUH has an Asia office at Tongji University, Shanghai, and a research office at Iuav University, Venice, Italy. CTBUH facilitates the exchange of the latest knowledge available on tall buildings around the world through publications, research, events, working groups, web resources, and its extensive network of international representatives. The Council’s research department is spearheading the investigation of the next generation of tall buildings by aiding original research on sustainability and key development issues. The free database on tall buildings, The Skyscraper Center, is updated daily with detailed information, images, data, and news. The CTBUH also developed the international standards for measuring tall building height and is recognized as the arbiter for bestowing such designations as “The World’s Tallest Building.”
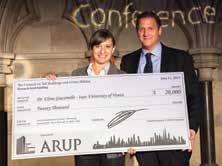
The Council on Tall Buildings and Urban Habitat’s International Research Seed Funding initiative was created to assist researchers in developing projects and ideas to a level to secure additional, more significant, funding. The program makes an annual award of US$20,000, facilitated by a generous donation from a CTBUH organizational member. The award is usually recognized at the CTBUH Annual Conference. The winner is chosen by the CTBUH Expert Peer Review Panel.
The 2013 CTBUH International Research Seed Funding Program was sponsored by Arup and awarded to Elena Giacomello of Iuav University, Venice, Italy for this study on the Bosco Verticale. The study was conducted from June 2013 to June 2014, followed by summation, analysis, and editing of this report.

Elena Giacomello
Adjunct Professor of Building Technology
Università Iuav di Venezia
Venice, Italy
Elena Giacomello is an architect with a PhD in building technology. Her experimental thesis entitled “Artificial Soil: the Role of Water in Green Roof Design,” was named the “best PhD thesis in building technology” of that year from IUSS-Ferrara 1391 (Istituto Universitario di Studi Superiori IUSS-Ferrara 1391).
Since 2011, Giacomello has been an adjunct professor of building technology and a temporary research fellow at the Università Iuav di Venezia. Her research activities are primarily focused on living green technologies for building envelope and restoration of natural resources in urban environments, in particular for what concerns compatibility and integration between vegetation and construction elements, adaptability of living systems to different climates, maintenance and costs, energy behavior and performance, and environmental benefits.

Massimo Valagussa
Director of Laboratory MAC Analysis
Minoprio Foundation
Milan, Italy
Dr. Massimo Valagussa is an agronomist with expertise in soil science, growing media, soil improvers, fertilizers for arboriculture, horticulture and landscaping. He is a scientific and technical consultant manager of the Minoprio Analisi e Certificazioni S.r.l. Milano, an agricultural laboratory for analysis (soil, growing media, irrigation water, leaves, and manure).
At the Minoprio Foundation he is responsible for agriculture and horticulture, landscape design, sports, green roofs, international research and experimental projects, recovery management of green area, especially for soil, substrates and vegetation.
“The tree, standing, makes a trunk: a deposit of lignin, which is considered a plant’s inert waste, once organized in a column, then in a work of architecture. The living part, essential to its survival, is a thin layer protected by its bark,” (Clément, 2012).
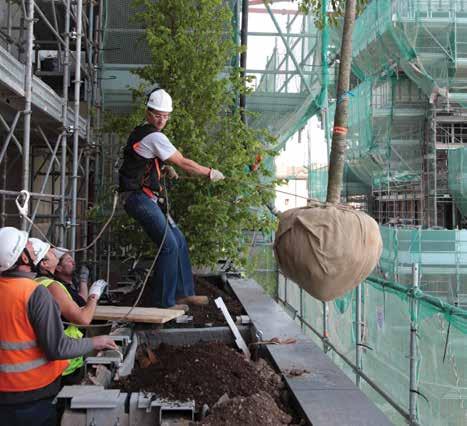
When I saw the lifting of a single big tree onto the Bosco Verticale building in Milan, the words of Gilles Clément, which I’d read numerous times before, came into my mind. I thought: “How do they lift up a tree, one hundred meters from the ground, without affecting that “living part”, the cambium, under the bark…?”
I was very much impressed by that “transport operation”: the tree was ascending upright, somewhat rapidly, and was then brought close to the tower with a rope, to be gently set down inside the container on the terrace. It was emotionally stirring to see a tree, a vulnerable creature, out of the ground, out of context, flying to a new “home”… and what a home: a skyscraper! I was incredulous to imagine that many trees, hundreds of trees, would be placed on the two towers, and I realized that the Bosco Verticale was not only an outstanding feat, and important project for Milan and for Italy, but for the world. An extremely important experiment in the history of tall building design was actually being realized.
Many questions came to my mind. How could trees adapt there; how much would they grow? What is the supporting layer inside the container? How is wind resisted? How will they be cared for? What are the selection criteria of the species and specimens, and the exclusion criteria? What impact would they have on the energy performance of the envelope and the internal spaces?
From that moment, the desire to study Bosco Verticale became an idea, and later a possibility, thanks to the 2013 CTBUH International Research Seed Funding program, sponsored by Arup, which awarded my proposal with Massimo Valagussa to monitor the visionary project.
The research, presented in this report, does not answer all those initial questions, but several important aspects of the Bosco Verticale’s living green technologies have been observed and analyzed during the earliest stage of the towers’ life, i.e. in the intervals of June-October 2013 and April-June 2014, when the Bosco Verticale was completing construction. In this given time window, we did our best to understand this extraordinary project.
The main question, posed in our research proposal, was: “How does a vertical forest work?” To answer it, we first planned a monitoring program of the taller trees installed on Tower E (the higher of the two) up to the 18th floor. The monitoring was intended to check, through instrumental tests and laboratory analyses (commonly applied in agronomics) the overall health conditions of the selected trees. We wanted to verify if the position in height or the orientation to the sun somehow affected the growth and health of the 27 chosen specimens (Chapter 3 and Appendix).
Next we explored the maintenance issues more deeply, since the maintenance regime is crucial for living green technologies in general, and in particular for the Bosco Verticale. With the acquired information regarding the project, the climatic data of the site and the evapotranspiration data from scientific literature, we applied two different methods for calculating the irrigation needs of the trees. Since the trees were in their earliest stage of implementation, the effects of pruning activities and fertilization were hypothesized (Chapter 5).
In addition, we addressed the expected energy needs of the living green envelope by modeling the sixth floor of the building with energy simulation software. Different façade configurations were modeled, each highlighting the specific contribution to shading supplied by the vegetation. Moreover, a calculation method for assessing the shadows cast by vegetation was applied, with the Leaf Area Indexes of standard trees and plants introduced into the assessment (Chapter 4).
Lastly, we provided a description of the technologies in use at Bosco Verticale, according to our direct observations, supplemented with information supplied by the architect Stefano Boeri and other professionals involved in the project (Chapter 2).
This book collects all the results achieved from working on the Bosco Verticale site, in the laboratory and at the desktop during the 12-month project. The results reflect a wide range of methods, but, as much as possible, are consistent with scientific methods. We believe that the limitations of our research project (namely, the assessment occurring before the building’s occupation) were much less significant than the value of the opportunities. It is hoped that, as a result of this initial study, we can continue to conduct a more significant post-occupancy study of the Bosco Verticale, and other relevant projects, in the near future.
It is important to underline that the results of the research provide data and information regarding not only Bosco Verticale, but also methods and approaches for evaluating other types of living green façade technologies, whether applied to tall or smaller buildings. As a final note, the chapters of this book do not need to be read in sequence; each introduces and concludes one specific topic.
Elena Giacomello Venice, Italy, December 2014
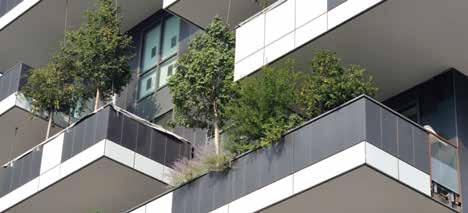
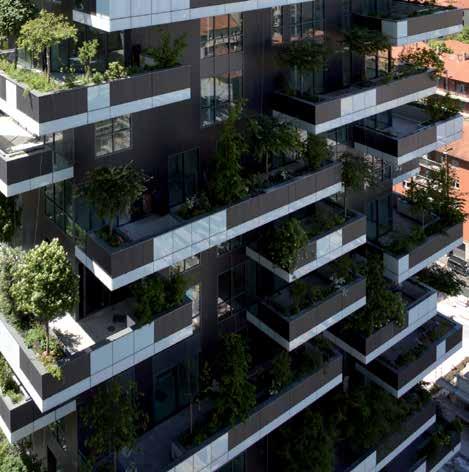
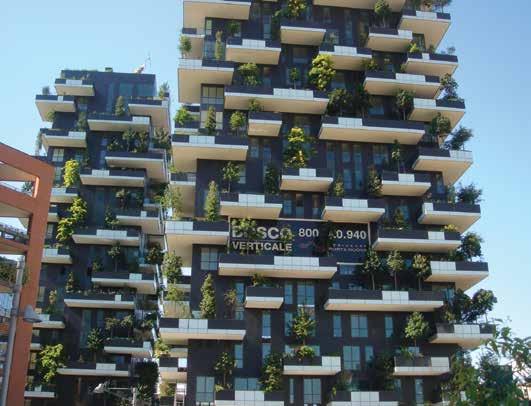
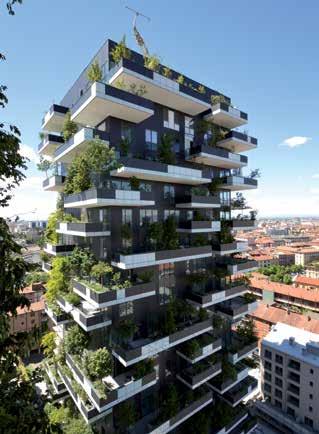
The Bosco Verticale in Milan, Italy, supports one of the most intensive living green façades ever realized (Figure 1.1). The combination of its sophisticated plant selection, the deployment of greenery in all orientations, the structural design to accommodate the plants, and the maintenance, safety, and irrigation systems, represents one of the most innovative tall building projects in recent memory.
The project consists of two residential towers, 27 and 18 floors high respectively, characterized by the presence of dense vegetation along their outer envelopes. There are about 20,000 specimens, including about 700 trees up to six meters high, installed on both towers. All the plants take root in containers located on the external side of deep cantilevered terraces, which are directly accessible from
Owner: Fondo Porta Nuova Isola
Developer: Hines Italia
Architect: Boeri Studio
Structural Engineer: Arup Italia
MEP Engineer: Deerns
Main Contractor: ZH Construction Company
S.p.A.
Other Consultants: Emanuela Borio and Laura Gatti (landscape design)
Year of Completion: 2014
Height: Tower D: 85 meters; Tower E: 117 meters
Stories: Tower D: 18; Tower E: 27
Building Gross Floor Area: 18,717 square meters
Building Function: Residential
Structural Material: Concrete
Green Wall Type: Tree planters on cantilevering balconies
Location on Building: All orientations of façade, at all levels
Surface Area of Green Coverage: 10,142 square meters (approx.)
• A project for metropolitan reforestation and a model of the vertical densification of nature. The objective was to reproduce the equivalent of 1 hectare of forest vertically, with the attendant benefits of noise and pollution reduction, shading for cooling, and aesthetic enhancement
• Projecting balconies on each floor and on each face are enhanced by trees and bushes placed in concrete planters, which act as parapets
each residential apartment. Acting as an extension of the exterior envelope of the towers, the plants represent a filter between the interiors of the towers and the urban environment. From inside, the plantings offer inhabitants a special experience of their terraces, which are pleasantly shaded by luxuriant tree crowns, and a “green-filtered view” to the city, in addition to an enhanced feeling of privacy. The envelope of the project is an active interface to the environment, with a special architectural quality. The dynamism of plant life is also expressed in the combination of forms and colors that derives from the carefully selected distribution of different species and specimens, which changes over the seasons and the years. The greenery of the plantings is emphasized and underscored by the gray color of the exterior walls, making the plants the protagonists of an architectural story of great visual, environmental, and ultimately societal, impact.
Milan has a humid, subtropical climate that is characterized by hot and humid summers with cold and damp winters. It experiences four seasons and a wide range of temperatures, typically varying from -1 oC to 31 oC. There is often measurable snowfall from December through February (an average 300 to 400 millimeters). The remainder of the year consists of rain in springtime and temperatures ranging from 20 oC to 30 oC during the summer and -1 oC to 10 oC during the winter. The most common forms of precipitation are light and moderate rain, occasionally augmented by thunderstorms. In recent years, Milan has seen a reduction in the industrial sector within the city, which has reduced the heat island effect as well as the haze that had become synonymous with Milan’s skyline.
Location: Milan, Italy
Geographic Position: Latitude 45° 37' N; Longitude 8° 143' E
Elevation: 211 meters above sea level
Climate Classification: Warm Temperate with fully humid, hot summer
Mean Annual Temperature: 11.8 °C
Average Daytime Temperature during the Hottest Months (June, July, August): 21.7 °C
Average Daytime Temperature during the Coldest Months (December, January, February): 1.6 °C
Annual Average Relative Humidity: 71% (hottest months); 76% (coldest months)
Average Monthly Precipitation: 85 millimeters
Prevailing Wind Direction: North
Average Wind Speed: 0.9 meters per second
Solar Radiation: Maximum: 784 Wh/m2 (July 21); Minimum: 660 Wh/m2 (October 21)
Annual Average Daily Sunshine: 5.1 hours
1 The climatic data listed was derived from the World Meteorological Organization (WMO), British Broadcasting Corporation (BBC) and the National Oceanic and Atmospheric Administration (NOAA).
Designing with green walls, or façadeintegrated vegetation, offers multiple benefits. The benefits of green walls vary depending on many factors, such as geographic location and climate, building geometry, orientation, plant species, and green wall components and systems. According to the 2014 CTBUH Technical Guide, Green Walls in High-Rise Buildings (Wood, Bahrami, Safarik, 2014), these benefits can be categorized as being on the “urban scale” (benefits for the urban community beyond the building itself) and “building scale” (addressing green wall benefits for a building’s users and owners).
Benefits: Urban Scale
• Reduction of the Urban Heat Island Effect / Air Temperature Mitigation
• Improvement of Air Quality / Dust
• Absorption
• Sequestering of Carbon
• Aesthetic Appeal
• Providing Biodiversity and Creating
• Natural Animal Habitats
Benefits: Building Scale
• Health Benefits
• Improvement of Building Energy
• Efficiency
• Internal Air Quality, Air Filtration and Oxygenation
• Envelope Protection
• Noise Reduction
• Agricultural Benefits
• BVOC (Biogenic Volatile Organic
• Compounds) production
• Increasing Property Value
• Sustainability Rating System Credits
º Sustainable Sites Development
º Water Efficiency
º Energy and Atmosphere
º Materials and Resources
º Indoor Environmental Quality
º Innovation in Operation and Design
Green Wall Urban-Scale Benefits
1. Reduction of the Urban Heat Island Effect
The Urban Heat Island (UHI) effect, caused by the temperature difference between urban centers and
countryside, has become a serious problem in many modern cities. Cities are significantly hotter because they have many sources of heat, mainly vehicles, industrial production, mechanical equipment, and building materials with hard and reflective surfaces, which re-radiate heat to the city environment, where it is then trapped in narrow urban canyons. Temperatures in the countryside are usually much lower because of the availability of vegetation to absorb heat. According to the US Environmental Protection Agency (EPA), the annual mean air temperature of a city with one million people or more, can be 1°C-3 °C warmer than its surroundings. In the evening, the difference can be as high as 12 °C. Amongst other consequences, the UHI effect increases the use of mechanical air conditioning to cool buildings,
adding to energy consumption, air pollution and greenhouse gas emissions to the atmosphere.
The UHI effect can be mitigated by introducing more vegetation into cities, through strategies such as urban parks, green roofs, and green walls. Plants help create a milder microclimate by absorbing heat to reduce outdoor air temperatures, increasing humidity levels, and sheltering buildings and sites from direct sun and wind (Figure 1.2).
2. Improvement of Air Quality
During the processes of photosynthesis, plants transform carbon dioxide, water, and solar radiation into oxygen and glucose. Plants thus generate oxygen, and are therefore essential for life on this planet. In cities where valuable horizontal space is taken by buildings, plants are scarce, which results in less oxygen production. In addition, numerous urban sources emit carbon dioxide and other greenhouse gases into the atmosphere. In this situation, more greenhouse gases are produced than can be treated by plants, leading to a lower overall quality of urban air. It has been reported that the yearly oxygen requirement for one person can be produced by a tree with a 5-meter diameter canopy or by 40 square meters of a vegetated wall covered with dense planting (Minke & Witter, 1985). Hence, it is important to bring vegetation into the oxygen-deprived areas of cities to improve air quality.
All living plants have the capability to store, or “sequester” carbon that would otherwise be released into the atmosphere as carbon dioxide,
a greenhouse gas that contributes to climate change. Many cities have embarked upon tree-planting programs to support carbon-sequestration initiatives. However, in many urban areas there is a limited supply of land that can support trees and their root systems. Here, vine-based green walls provide an excellent, space- and water-saving alternative. Not only can vines grow on the walls of existing buildings and require less planting media – they are also more efficient engines for carbon sequestration. Most of the energy of a tree goes toward growing its trunk, which provides nutrients and altitude to the leaves, but does not itself process CO2 or create oxygen. Vines are nearly entirely composed of leaves, and thus can sequester 60 to 100 times more than a tree of equivalent mass (Vaingsbo, 2014).
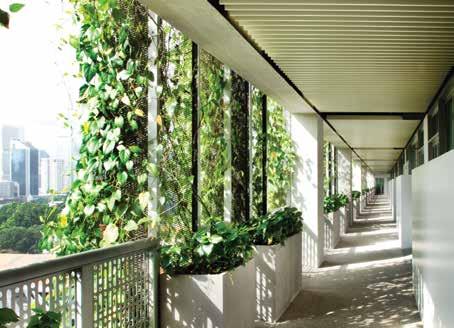
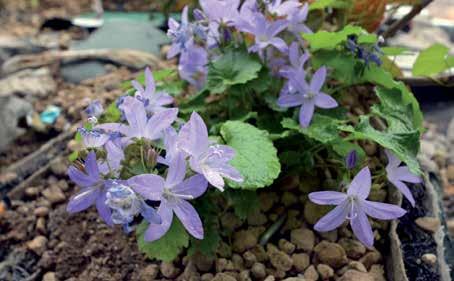
4. Aesthetic Appeal
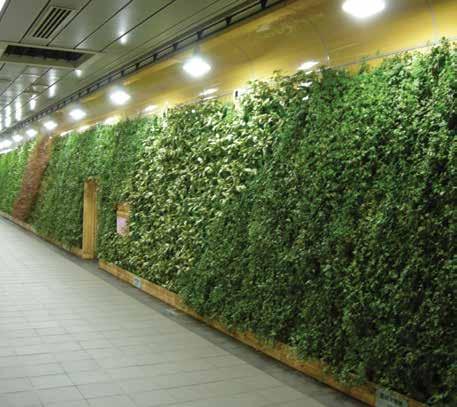
The most visible benefit of green-wall systems is their aesthetic appeal (Figure 1.3). Building designers often use green walls as traditional two-dimensional art objects to embellish structures. Various plants, with their unique colors and textures, can be skillfully used as a live art medium that changes its shade according to the season. Green walls can decorate a building façade by hiding unsightly surfaces (such as car parks) or by complementing existing building features. Such green walls can be purely ornamental, or can provide other benefits. For instance, when placed near the ground, green walls can create mini-parks or streetscapes for recreational use. Generally, the visual effect of green walls is more noticeable than that of green roofs, as they are easily seen from the street level.
“It has been reported that the yearly oxygen requirement for one person can be produced by a tree with a 5-meter diameter canopy or by 40 square meters of a vegetated wall covered with dense planting.”
Green walls improve the quality of human life in the built environment by providing relief from what can be a relentless and visually impoverished urban landscape. In many parts of the world, urban areas are particularly unpleasant for pedestrians, with hard surfaces and auto-centric engineering predominating. Green walls provide not only aesthetic relief from the monotony of concrete and steel; they also provide tangible relief from the heat that radiates from the surfaces of buildings and streets and have a calming effect on harried urbanites.
A British study that analyzed the biodiversity of vertical urban surfaces found that building walls and façades provide favorable conditions for certain species of plants and animals (Darlington, 1981). According to this study, the most common organisms found on exterior vertical walls are algae and lichens, which can grow in miniscule crevices and holes. Other characteristic façade dwellers are mosses, ferns, liverworts, sedums, herbaceous plants, vines, grasses, and even some coniferous plants. These plant types adapt well to vertical life because of their ability to dwell in crevices and cracks, use building surfaces for support, and sustain themselves on small amounts of nutrients and water. A thick layer of vegetation on building façades also creates an attractive habitat for insects, birds, and small animals.
In many urban centers, street noise approaches levels that can impede concentration and peace of mind. Hard surfaces cause sounds to be bounced, amplified and redirected. The noise of traffic, sirens, horns, and construction is synonymous with urban life, but it is not beyond attenuation. Thickly vegetated green walls can have a deadening effect on urban noises, while providing both a visual and auditory reminder of nature in otherwise intense and frantic environments.
Façade plants have multiple positive effects on building thermal performance, which include increased wall insulation (especially in the case of living walls in colder climates), façade shading (especially in hotter climates), air cooling through evapotranspiration, and reduction of wind near the façade. Shading with plants leads to a reduction in the temperature gradient of a building’s exterior walls and in heat conduction through the opaque building envelope. Evapotranspiration cools and humidifies the air around the plant layer while the porous structure of the plant layer, formed by foliage and branches, lowers air movement near the façade. Reduced façade surface temperatures and microclimate outdoor air temperatures near the façade allow for lower heat conduction through opaque envelopes and for lower air infiltration into buildings, which implies better building energy performance and reduced energy use.
Many modern cities suffer from air pollution that can lead to numerous human diseases and have the potential to accelerate the deterioration of building materials. It has been proven that atmospheric air quality can be improved through the introduction of vegetation. Plants are known to trap airborne particles in their foliage and absorb gaseous pollutants from the atmosphere. Plant leaves also have the ability to absorb particles of heavy metals from the atmosphere, including cadmium, copper, lead, and zinc. A German study demonstrated that the air pollution count in a street without trees was 10,000-20,000 dirt particles per liter, as opposed to 3,000 dirt particles per liter in a tree-lined street (Minke & Witter, 1985).
Air pollutants are present not only in the atmosphere, but also inside buildings where various building materials (adhesives, carpets, electronic equipment, and cleaning fluids) emit volatile organic compounds (VOCs), chemical compounds that can negatively affect human health. Recently, some building designers have started using the air filtering ability of plants in green walls for better interior air quality. Green walls are a natural alternative to energyconsuming artificial filtration, since they can serve as interior biofilters to remove pollutants from the air. One such biofilter is the NEDLAW Living Wall, a proprietary biofilter living wall consisting of pollutant-degrading plants (NEDLAW Living Walls, 2008). A single pass of the air through the 5-cm-thick living wall can remove up to 80% of the formaldehyde,
50% of the toluene, and 10% of the trichloroethylene. For every 100 square meters of floor space, 1 square meter of living wall should be used to filter the air effectively.
10. Health Benefits
Plants are known to have positive effects on the psychological and physiological health of individuals. Results of multiple studies demonstrated that when inside buildings, people prefer to have a visual connection with the exterior vegetation, which creates positive emotions (White & Gatersleben, 2011), (Beatley, 2010), (Peck, Callaghan, Kuhn, & Bass, 1999). Additionally, the air filtering and oxygenating abilities of plants can greatly benefit people
suffering from breathing diseases caused by urban pollution, such as asthma or allergies (Peck, Callaghan, Kuhn, & Bass, 1999). Green walls’ ability to filter light, register changes in season, and in some cases, grow food for occupants, fosters a level of engagement with surroundings and with nature that are typically not available in heavily-engineered buildings with inoperable windows.
11. Envelope Protection
Façade vegetation protects wall construction behind the plant layer from ultraviolet radiation that can cause material deterioration. By reducing daily temperature fluctuations, plants help reduce internal stresses in building materials, which can lead
to material cracking and premature aging. On extreme days, the exposed façade temperature can vary between -10°C and 60°C while the temperature of a plant-covered façade fluctuates only between 5°C and 30°C (Minke & Witter, 1985) (Osler, Wood, Bahrami, & Stephens, B, 2011).
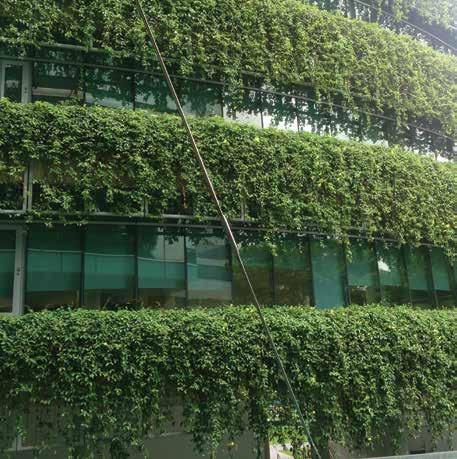
An external plant layer on buildings serves as an envelope “outer layer,” also protecting wall materials from physical damage and shedding driving rain away from the wall construction (Figure 1.4). Additionally, wall construction materials that are protected from external factors do not require as much maintenance, have increased life span, and as a result, have lower life-cycle costs and increased thermal insulation.
12. Interior Noise Reduction
Greenery has strong sound attenuation qualities that can be utilized by providing a layer of vegetation in green walls to help reduce noise transmitted to indoor spaces. (Renterghem, Hornikx, Forssen, & Botteldooren, 2013).
13. Agricultural Benefits
Green walls can be used for growing agricultural plants, such as tomatoes, eggplants, zucchinis, squash, cucumbers, beans, and grape vines (Figure 1.5). Therefore, in some climates, vertical surfaces in cities have the potential to become urban micro-farms, where neighborhood residents have the opportunity to grow fresh produce for their own use. Local produce grown in urban farms is fresh, seasonal, and readily available at the point of need to city residents. Such farms can also become a center
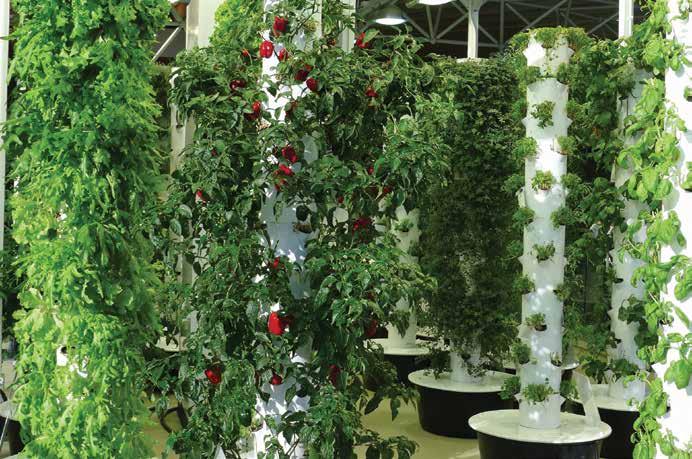
of local community life. Currently, some manufacturers are developing commercial living wall products which can be used for growing food vertically, for example, the Green Living wall system by Green Living Technologies LLC (Green Living Technologies) and the Reviwall system by Reviplant (Reviplant, 2008). A prototype of such an edible wall was installed in Gladys Park, a poor neighborhood in Los Angeles, by Green Living Technologies LLC (Irwin, 2008).
14. Increasing Property Value
Several studies have demonstrated that vegetated features in buildings, such as green roofs or green walls, can increase the property value by up to 20% (Pitts & Jackson, 2008), (Fuerst & McAllister, 2009), (Miller, 2008), (Eichholtz, Kok, & Quiqley, 2010).
Independent research conducted by the UK-based Royal Institute of Chartered Surveyors (RICS) investigated
green buildings in Canada, the United States, and the United Kingdom.
According to the research, which was based on the combination of different case studies, it was concluded that “the sustainable features of green buildings can add value to real estate”. The author concluded that buildings with substantial green elements not only have a positive impact on the environment and health, but also provide productive places to live and work, secure higher rents and prices, attract tenants more quickly, reduce tenant turnover, and cost less to operate and maintain (Corp, 2005).
15. Sustainability Rating System Credits
Buildings utilizing vertical greenery can often receive credits in Sustainability Programs such as the Leadership in Energy and Environmental Design (LEED) program, the voluntary green building rating system by the US
Green Building Council (LEED v4 Reference Guide for Building Design and Construction, 2013). Green walls can contribute directly or with other sustainability building elements to a building’s LEED certification in all categories including Sustainable Sites, Water Efficiency, Energy and Atmosphere, Materials and Resources, Indoor Environmental Quality, and Innovation in Operation as outlined below:
1) Sustainable Sites Development
Green walls can achieve credits in Storm Water Design and Heat Island Effect categories by preventing excessive storm water discharge and by removing suspended particles and other pollutants from the storm water. The dark foliage of green walls helps reduce solar reflectance from buildings, thus reducing the urban heat island effect.
2) Water Efficiency
Buildings can use a stormwater collection system, including harvested rainwater, airconditioning condensate, and foundation drain water for irrigation of green walls and other landscape features and reduce waste water generation. The potential credits include the Water-Efficient Landscaping and Innovative Wastewater Technologies.
3) Energy and Atmosphere
Green walls provide an additional layer of insulation and natural cooling through evapotranspiration. These effects can offer substantial energy and cost savings, which vary depending on a location’s climate zone (Figure 1.6). The potential credit includes the category: Optimize Energy Efficiency Performance.
4) Materials and Resources
Green walls can be considered in two categories, i) Recycled Content, ii) Regional Materials.
5) Indoor Environmental Quality
The potential credits include Best Management Practice: Reduce Particulates in Air Distribution; Occupant Comfort: Occupant Use; and Green Cleaning: Indoor Integrated Pest Management
6) Innovation in Operation and Design
Green wall design can contribute to the mental and physical health benefits of individuals. The potential credits include Innovative Wastewater or Ventilation systems.
“In some climates, vertical surfaces in cities have the potential to become urban micro-farms, where neighborhood residents have the opportunity to grow fresh produce for their own use.”
“More than 94% of tall buildings are clad with glass, so we started thinking about these skins, metal, ceramics, and other materials that ‘mineralize’ the urban surfaces.”
– Stefano Boeri, Architect, Bosco Verticale
In addition to LEED, other building energy efficiency and sustainability rating systems in the world have considered credits for building greenery strategies. In Australia and New Zealand, buildings with green walls can receive Green Star Credits, which is the first comprehensive rating system for the evaluation of the environmental design and performance of Australian buildings. This is similar in other countries, such as: the United Kingdom’s BRE Environmental Assessment Method (BREEAM) building rating system; Germany, the Green Building Certification for Sustainability (DGNB); Italy, Green Building Council Italia (GBC Italia); Singapore, BCA Green Mark Scheme and Japan, Comprehensive Assessment System for Built Environment Efficiency (CASBEE) (Reed, Bilos, Wilkinson, & Schulte, 2009).
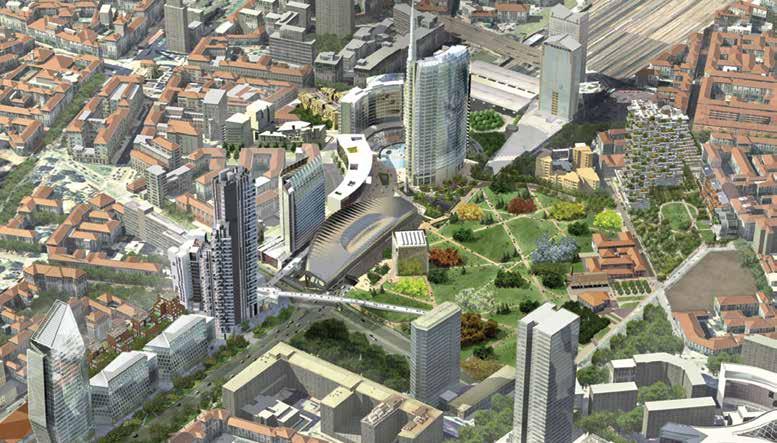
The Porta Nuova area, comprising 34 hectares, was one of the last unbuilt sites in Milan. The area was meant to be turned into an office district, according to the city plan of 1953, with the objective of decongesting the city center by relieving growing car traffic. Instead, the area played host to an increasing number of tertiary activities: part of it was occupied by an amusement park; the rest was uncultivated land. Years of economic difficulty prevented the public administration from realizing the entire office district and its associated planned infrastructure. Finally, in 2004, a large urban project was approved and the land was acquired by a single developer, Hines Italia SGR, which arranged a
radical transformation through an investment of more than 2 billion euro.
The new Porta Nuova is divided into three neighborhoods: Porta Garibaldi, Varesine, and Isola (where the Bosco Verticale is located). It takes advantage of the proximity to the city center and of transportation accessibility. The project is near two railway stations, two underground metro lines and a third under construction, a new road tunnel under the Unicredit Tower, and several tram and bus lines. It introduces a diversity of uses to the area, including offices, retail and residential buildings, interconnected by a large park with pedestrian paths.
Among the projects completed and under construction, there are more than 20 new buildings, including several towers. In May 2013, a Qatari investment fund bought a 40% stake in the development.
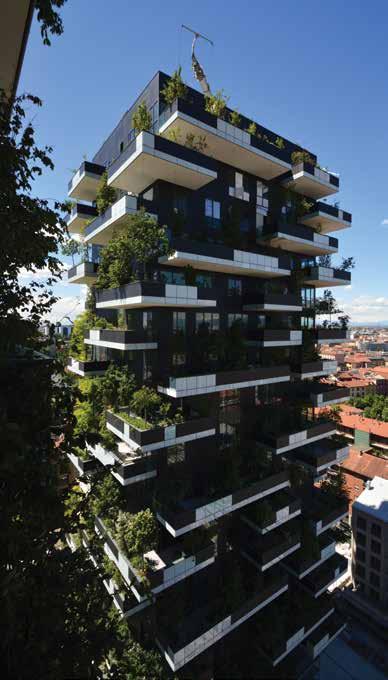
The Bosco Verticale project consists of two residential towers located in Porta Nuova district in Milan, northeast of the historic city center (Figures 1.7 & 1.8). The site of the project is along the north side of the Unicredit Tower, bordering a park called the “Library of Trees,” which comprises 9 hectares (Figure 1.9).
The two project towers are of different heights, but are characterized by the
presence of vegetation distributed throughout deep cantilevered terraces, on all orientations and along all façades of both towers. Tower D is 85 meters high and consists of 18 floors, while Tower E is 117 meters high and consists of 27 floors. The façades are oriented precisely in the four cardinal directions. The floor plans of the two towers are different: the floor plates of Tower D have a surface area of approximately 500 square meters, while the floor plates of Tower E have a larger surface area of 660 square meters. The sizes of the apartments vary; in Tower D there are two to three apartments per floor, while in Tower E, there are two to four apartments per floor.
The architect Stefano Boeri’s concept of the project was intended to introduce “a different typology of tall building, and also a different idea of sustainability. More than 94% of tall buildings are clad with glass, so we started thinking about these skins, metal, ceramics, and other materials that ‘mineralize‘ the urban surfaces.” While these buildings can be designed to collect renewable energy (solar, wind, geothermal), these designs exclude one of the major challenges to sustainability: biodiversity.”
“Sustainability without biodiversity is a ‘mechanical sustainability,’” Boeri said. “Here the idea of the project comes. I started to think about this visionary project to see if a tall building could become a ‘medium’ for
IL BOSCO VERTICALE:
PROTEGGE DALL’IRRAGGIAMENTO protects from the direct radiation
LASCIA PASSARE LA LUCE lets light in
RIPARA DAL VENTO protects from the wind
RILASCIA UMIDITA release humidity
CATTURA LE POLVERI SOTTILI captures small dust particles
PRODUCE OSSIGENO produces oxygen
MITIGA L’INQUINAMENTO ACUSTICO reduces acoustic pollution
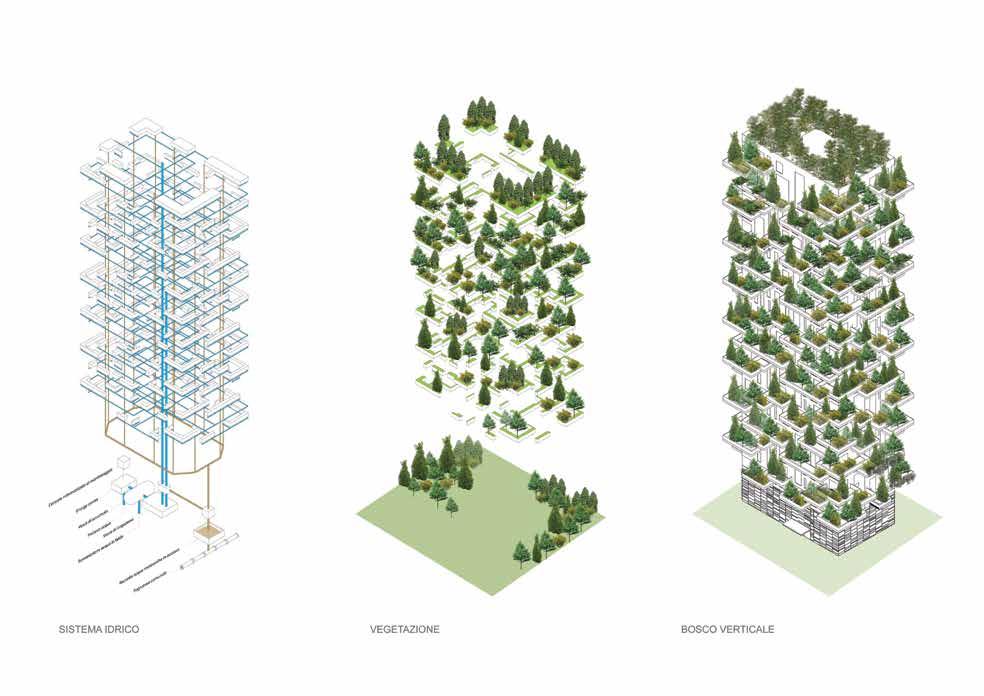
IIl BOSCO VERTICALE 01 prevede la costruzione perimetrale ad ogni piano di una sequenza di vasche di dimensione proporzionata all’esigenza delle piante; la selezione delle specie e la definizione dei sistemi distributivi e di riuso delle acque rispetto alle differenti zone microclimatiche sono improntati alla ottimizzazione delle risorse idriche.
BOSCO VERTICALE 01 foresees the perimetral construction on each floor of a sequence of containers of different sizes according to the needs ofaech plant; the selection of the plants and the definition of distribution and reuse of water with respect to the different microclimatic zones are based
ecosystems. I realized that there had been no experimentation, no concrete examples realized in the history of architecture, and we started to think about how to do this”.
With this guiding principle, the project aims to increase biodiversity and to help establish an urban ecosystem (Figure 1.10), in which different kinds of vegetation create a vertical environment that can be populated by small animals such as birds and insects, becoming both a magnet for, and a symbol of, the spontaneous re-colonization of the city by vegetation and animal life. The complex is to serve as a landmark in the city, offering a variable landscape that changes its form and color in each season, depending on the species of plants in bloom.
The project contains extensive plant biodiversity, as it holds a large number of species and varieties: there are 23 species of trees and large shrubs, 35 species of smaller shrubs of various sizes, and more than 90 species of ground cover plants and herbs. More than 20,000 plants live on the two towers, 700 of which are trees.
The plants comprise the main element of the façade’s character, since they are densely distributed on the two towers, both on the lower floors and the upper floors, on all orientations. The variety of green foliage and the vibrant colors of flowers and fruits coexist and stand out from the gray background of the external walls and the white of the terraces’ undersides.
Working in concert with the terraces, defined by “sliding profiles” from floor to floor, the plants confer a three-dimensional appearance to the envelope, emphasized by the light reflection of rich foliage, and by the projected shadows of trees and terraces on the exterior wall. The entire
envelope is alive, and moves and changes with the seasons.
For a better understanding of the setting of the research activities presented in this report, it is useful to describe the state of construction work at Bosco Verticale at the time of the study. This sets the limits of the investigation and, as consequence, governed its results, during the two research intervals; June–October 2013 and April–June 2014.
During the first monitoring period, trees had been installed up to the 18th
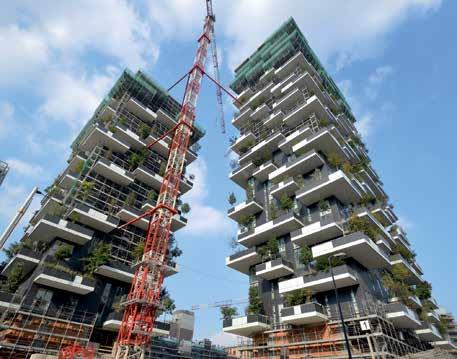
floor of the 27-floor Tower E and up to the 14th floor of the 18-floor Tower D. These trees were planted between late 2012 and spring 2013 (Figures 1.11 & 1.12), and had thus been “bedded in” for periods between one and eight months. Part of the planting restraint safety system of the trees was erected, but not operating. The water distribution network in the terraces was widely installed, but not working. At the time of observation, the plants were irrigated manually by maintenance staff.
The external walls of Tower E were largely completed, though some higher floors lacked windows and the interior finishes. Interior partitions had been built only in the lower floors.
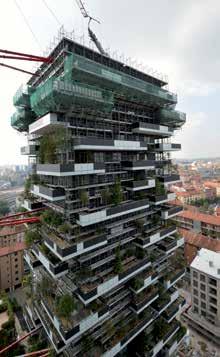
The plant containers of the top eight floors of Tower E had not been filled with soil or substrate.
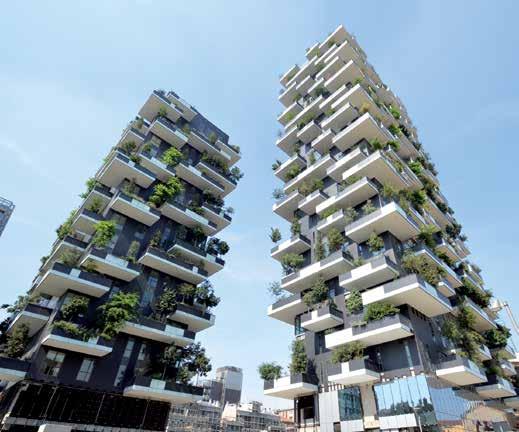
At the beginning of the second monitoring period, the installation of the trees on the top floors was complete (Figures 1.13 & 1.14). At the same time, the completion of works on the façades and interiors proceeded from the bottom to the top.
At the end of June 2014, some apartments of the lower and central floors of Tower E were completed and reserved for showing to prospective tenants.
In the case of Bosco Verticale, the living green envelope is uniquely dense and highly vegetated (including trees up to 6 meters high); it is installed within plant containers located on the outer side of cantilevered terraces. Thus, in plan, the vegetation is about 2.3 to 3.1 meters from the external wall and covers more than 50% of the floor perimeter. In elevation, the coverage
is about 40%, based on a calculation method derived in the Green Walls in High-Rise Buildings Technical Guide (Wood, Bahrami, Safarik, 2014) and detailed below.
The project consists of two rectilinear towers, named Tower D and Tower E to indicate their position in the overall Porta Nuova project. All vertical, elevation-based greenery area assumptions for this project were based on the fully grown extent of foliage as designed, as opposed to the canopy sizes at installation or as measured directly elsewhere in this report.
Tower D is 85 m high, 32 m long, and 26 m wide, including the vertical zone contained by the 3 meter projection of balconies beyond the façade proper. The total vertical surface area of Tower D is thus: (2 x (85 x 26) + (2 x (85 x 32)) = 9,860 m2 (Table 1.1).
Tower D’s north and south balconies each support 20 bush/shrub areas of approximately 1 meters’ height and of varying widths, for a total area of 194 m2. That area has then
been discounted by 50% to account for variations in shrub density and coverage, for a final area of 97 m2 per façade. There are also 27 trees of approximately 24 m2 coverage area and 20 trees of approximately 12 m2 coverage area on each façade. Thus the total of green coverage on Tower D’s north and south walls is (97 + (27 x 24) + (20 x 12)) = 985 m2 each.
The east and west walls of Tower D each support 28 bush/shrub areas of approximately 1 meters’ height along varying widths, for a total area of 232 m2. That area has then been discounted 50% to account for variations in shrub density and coverage, for a final area of 116 m2 per façade. There are also 33 trees of approximately 24 m2 coverage area and 19 trees of 12 m2 coverage area on each façade. Thus, the east and west walls cover (116 + (33 x 24) + (19 x 12)) = 1,136 m2 each.
Thus, overall green coverage of Tower D is (2 x 985) + (2 x 1,136) = 4,242 m2 or about 43% of the vertical surface area of the tower.
Tower E is similarly configured, but taller. It is 117 m high, 41 m long and 26 m wide, including the 3-meter zone created by the projection of the balconies. The total vertical surface area of Tower E overall is (2 x (117 x 41) + (2 x (117 x 26)) = 15,678 m2
Tower E’s north and south balconies each support 52 bush/shrub areas of approximately 1 meters’ height and of varying widths, for a total area of 470 m2. That area was then discounted 50% to account for variations in shrub density and coverage, for a final area of 235 m2. There are also 34 trees of approximately 24 m2 coverage area and 57 trees of approximately 12 m2 coverage area on each façade. Thus the total of green coverage on Tower D’s north and south walls is (235 + (34 x 24) + (57 x 12)) = 1,735 m2 each.
The east and west balconies each support 38 bush/shrub areas of approximately 1 meters’ height along varying widths, for a total area of 269 m2. That area was then discounted 50% to account for variations in shrub density and coverage, for a final area of 135 m2. There are also 26 trees of approximately 24 m2 coverage area and 38 trees of 12 m2 coverage area on each façade. Thus, the east and west walls are covered in about (135 + (26 x 24) + (38 x 12)) = 1,215 m2 of greenery each. The total green coverage of Tower E is therefore (2 x 1,735) + (2 x 1,215) = 5,900 m2, or about 38% of the vertical surface area.
The overall green coverage of both towers in the Bosco Verticale complex is (4,242 + 5,900) = 10,142 m2, or about 40% of the entire vertical surface area.
“In plan, the vegetation is about 2.3 to 3.1 meters from the external wall and covers more than 50% of the floor perimeter. In elevation, the coverage is about 40%.”
In this chapter, some of the elements and technologies of the Bosco Verticale that are directly influenced by the presence of trees are summarized. The sections, as well as the descriptions, are not meant to be comprehensive; rather, they provide technical information regarding several topical aspects of the design and intend to display the unity of the architectural project with the vegetation and structural schemes.
The structure of the project’s towers consists entirely of reinforced concrete. The vertical load-bearing structure of tower E is formed by 13 pillars, placed on the perimeter of the floor plan –with unsupported corners – and by the service core, which contains two
staircases, three elevators and five ducts for mechanical, electrical and plumbing systems (Figure 2.1). The pillars are rectangular and measure approximately 80 x 120 centimeters.
The service core is centered on the north façade of Tower E and has a floor area of about 160 square meters, comprising about 24% of each floor plate, excluding the terraces. The load-bearing structure of the floors and the cantilevered terraces is made of 28-centimeter-thick post-tensioned reinforced concrete.
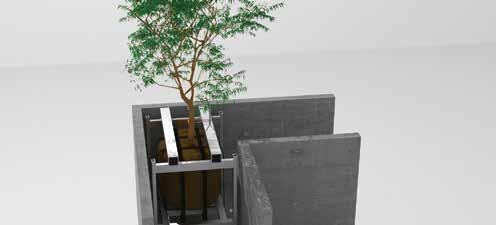
The depth of the cantilevered terraces is about 3.3 meters in plan, and in some cases, the width is up to 14 meters. The terraces are accessed directly from the apartments. The plant containers on the terraces are placed
on the outside edge of the balconies opposite the exterior wall (Figure 2.2).
The profiles of the terraces repeat every six floors, while the containers have variable layouts.
The required load support calculated for the terraces was determined by the weight of the deepest container, with large trees installed every 3 meters, and medium trees installed in the remaining space between the large trees.
The trees generate the significant portion of the loads, not so much in terms of weight, but in terms of wind force that they transfer to the structure. Defining the dynamic loads was a fundamental part of the structural design process. It was assessed through scale-model tests and full-scale tests on real trees in the field.
After the botanical classification of the selected trees, aimed at defining the maximum area of the canopy, the next task was to identify the center of gravity and the air permeability. An experiment at 1:100 scale was performed in the wind tunnel of the Politecnico di Milano, with the objective of defining local wind phenomena around the façades. Additional full-scale tests were performed in the “Wall of Wind” tunnel at Florida International University. These tests determined the aerodynamic coefficient of the trees’ real dimensions, confirming the design values applied to the project and the stresses that would be placed on the tree-restraining devices. The test wind speed was 67 m/s, which is considered extreme for Milan.1
1The information regarding the structure and the binds has been provided by Luca Buzzoni in 2014.
The trees classified as “large” and “medium” are secured to the structure of the terraces, by way of three different devices:
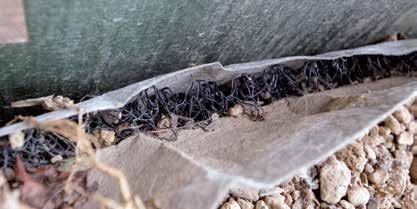
This system consists of textile belts that anchor the root ball of the tree. In the bottom of the plant container, a steel welded net is positioned, through which three textile belts pass to fix the root ball (Figure 2.3).
This system is considered “temporary,” since the belts (which are made of textile material) lose their tension over time. The textile belts are primarily important in the early life of the
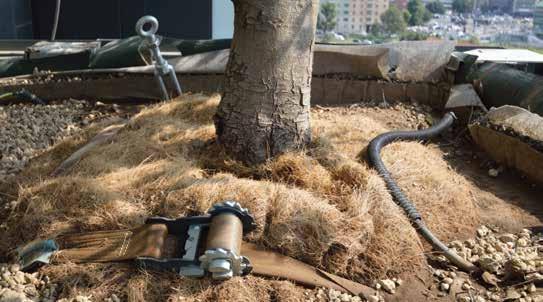
building, when the roots of the trees are not sufficiently developed.
Basic Bind
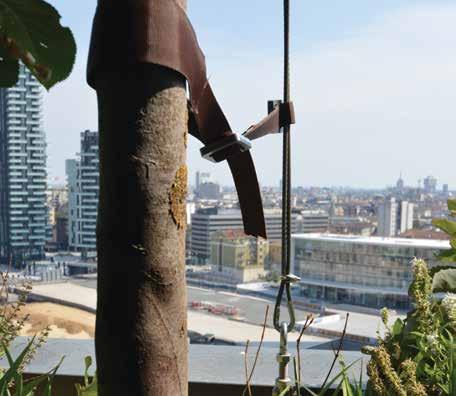
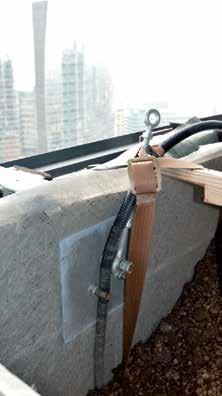
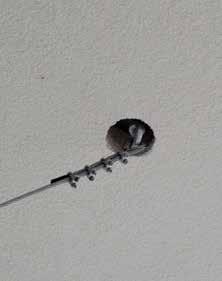
This is the fall-arrest system for dislodged and broken branches. The fall-arrest system consists of a steel cable anchored to the structure of the plant container (where the tree is placed) and to the bottom of the terrace above. Three additional elastic belts wrap the main trunk with the cable (Figure 2.4), retain the damaged parts of the tree in case of breakage, and allow the recovery of the broken branches.
The cable is secured to one side of the plant container through a turnbuckle connected to a steel plate bolted to the side of the container. The steel cable
is linked to the turnbuckle through a redance, a looped and grooved device for securing cables. The cable is then secured to the structure of the upper terrace through a simple hook and another redance (Figures 2.5 & 2.6).
The three elastic belts allow the tree to oscillate without becoming dislodged.
This system consists of a steel cage fixed to the structure of the plant container. It encloses the root ball, preventing the overturning of the tree (Figures 2.7-2.9).
This device has been used for the trees on the highest floors, where affixing a basic bind is not practical; and for trees installed in the windiest positions
(usually the corners), according to the tests performed on the wind-tunnel model of the buildings.
The envelope of the project is a combination of constructed (walls, floors, structural systems) and natural elements (plants, substrate, water). The elements that compose this envelope are essentially:
• The external walls (which separate the internal spaces from the external environment)
• The cantilevered terraces
• The vegetation
The terraces and the vegetation have such a wide distribution on the façades that the analysis of the envelope must consider all these elements together. All of the terraces of the project are characterized by a remarkable depth, a distribution along more than 50% of the floor perimeter, and the presence of dense and high vegetation. A large part of the external walls is shielded by both the cantilevered terraces and the foliage of the plants. For this reason, the terraces represent extensions of the apartments to the outside, presenting an element of architectural character and quality as well as shade elements for the horizontal and vertical constructed surfaces.
Studying the interaction of these three elements (the external walls, the terraces and the vegetation) requires a precise understanding of each of them. The next paragraphs describe each of these elements.
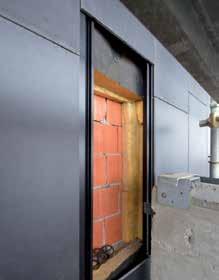
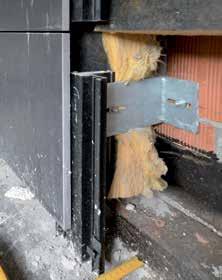
The composition of the external walls of the project is quite simple. The infill wall is made of honeycomb bricks. Both these infill walls and the structural reinforced concrete are coated with panels of mineral thermoacoustic insulation.
The exterior finish consists of charcoalgray stone cladding, ventilated and supported by a metal frame anchored to the infill wall of honeycomb bricks beyond (Figures 2.10 & 2.11). All the external walls, regardless of orientation, have the same composition.
The metal windows are also of a charcoal-gray color. Terrace doors and windows of each apartment extend from floor to ceiling. This characteristic extends the illuminated surface area of the exterior walls to the interior, and emphasizes the protective role of the trees in shielding sunlight from, and moderating views to and from, the external environment. In fact, external views are framed by foliage of trees located not only on one’s own terrace, but also on other terraces, one or two
floors below; the obtained effect is particularly spectacular and unusual.
The Cantilevered Terraces and Planters
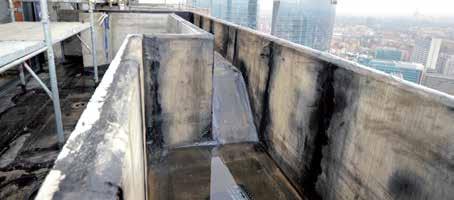
All the cantilevered terraces are constructed of post-tensioned reinforced concrete with differing widths. They are characterized by the presence of plant containers on the outer edge.
The floors of the terraces are covered on the top by a thin layer of thermal insulation, a waterproofing membrane and a lightweight concrete layer with cladding in light gray stone. A thin layer of thermal insulation and a double layer of white plasterboard are applied on the underside.
The sides of the plant containers are concrete, 1.1 meters high from the floor of the terrace and 12 centimeters thick. The sides are fixed to each other by a heavy steel tie-beam, secured by two plates bolted to the sides.
The internal volume of the containers vary depending on the provided plants’ dimensions. In the case of a tree installation, the container is 1.1 meters high and 1.1 meters deep (1.47 meters including the construction layers), while in the case of shrubs and herbs, the container is a minimum 0.50 meters high and 0.50 meters deep (0.87 meters including the construction layers) (Figure 2.12).
The internal stratigraphy of the plant containers is as follows:
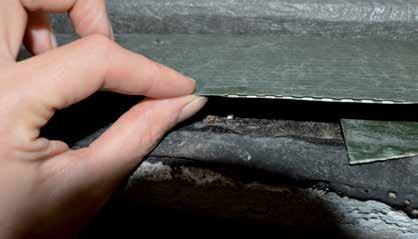
The inner surface in concrete is entirely covered with a bituminous waterproofing membrane, with protective sheeting against root penetration (Figure 2.13).
The next layer consists of a single layer of separation and drainage, made of two synthetic non-woven filters with a three-dimensional filament core in polyamide, 2 centimeters thick (Figure 2.14). This layer has a drain structure with high flow rate, to ensure optimal drainage of any possible water outflows to the ground.
“A large part of the external walls are shielded by both the cantilevered terraces and the foliage of the plants. The terraces represent extensions of the apartments to the outside and shade elements.”
The layer of separation and drainage also protects the permeability of the filters, the drainage pipe, the waterproofing membrane, the sheeting against root penetration and, above all, the air circulation along the sides of the containers. To accomplish this, the layer turns up vertically along the edge of the container. While providing the same drainage capacity and compression resistance, this geo-polymer is efficient, and is much thinner and lighter than traditional granular drainage materials.
Above this, another separation layer lies below a welded-steel net, which forms the anchor for the tree root balls.
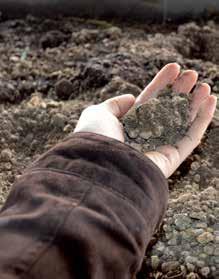
Above the layer of separation and the welded-steel net lies the vegetation support course, i.e. the substrate, which fills the container to a depth of approximately 1 meter. This growing medium layer is the key element of every green living technology. It is composed of soil with volcanic lapilli (an inorganic material) that has been selected for variance in grain sizes
and mixed with green compost and topsoil (the organic materials) (Figure 2.15). The growing-medium layer must ensure sufficient aeration in the lower volume of the containers, as well as optimal functions of water retention, permeability, structural stability and density.
Its implementation is governed by many parameters and requirements identified in international standards for green roofs.2
The real revolutionary element of the project – its plants – has influenced every part of the design. The vegetation is the outermost exterior element of the envelope and represents a filter between the interiors of the towers and the urban environment.
First of all, the plants offer protection against sun and wind to the terraces, which are thus extended green, private spaces at high altitude, with commanding views of the city of Milan.
Furthermore, plants filter the view of the city from the inside of each apartment. Both the vegetation placed on its terrace and the tree crown placed on the lower floors represent the external element in the foreground, framing the view.
The vegetation is also the primary element defining the façade. The strong effect of the project is driven by many factors besides the full vegetation, including a wide chromatic combination (charcoal gray on the external walls, white cladding panels, and many hues of green), the harmonic rhythm of the terraces, and a balanced succession of transparent and opaque surfaces.
The vegetation itself is part of the tower’s architecture. The plants have a variable geometry, they move with the breeze, they reflect the light and produce irregular shadows. They gradually change color, shape and appearance with the change of seasons.3
2 a) UNI 11235: Istruzioni per la progettazione, l’esecuzione, il controllo e la manutenzione di coperture a verde. [Guidelines for the design, execution, monitoring and maintenance of green roofs]. Ente nazionale italiano di unificazione. Milano: UNI, 2007 (revised in 2008); b) Green roofing guidelines. Guidelines for the planning, construction and maintenace of green roofing. Forschungsgesellschaft Landschaftsentwicklung Landschaftsbau. Bonn: The German Landscape Research, Development and Construction Society (FLL), 2008.
3 In the field of neurosciences, the effects of vegetation on human health in urban settings have been investigated (Roger S.Ulrich’s studies). The topic of the sense-stimulation by plants located in urban environments (which affects the green living technologies) is neither simple nor commonplace. There is a direct cause-effect relationship between the visual perception of the plants and the psycho-physical well-being of the person. The well-being that comes from the view and the proximity of greenery is not a cultural issue. It is not linked, for instance, to one’s level of education about environmental preservation, the desire to take on a “sustainable lifestyle”, the identification of the respect of nature with one’s values … and so on – nor is it a question related to voluntary thought. When observing vegetation, the person undergoes an enhancement of several physiological parameters of his/her own body (such as the conductance of the skin, heart period and heart rate, muscle tension, etc.). For this reason, the “visual attraction” of plants, even when glimpsed distractedly, is unavoidable and unconscious, driven by an instinctive impulse. So, from a sensory point of view, the façades of the Bosco Verticale have a unique attractive force, even if the vertical green living technologies are not recognizable as “common” by the average person.
From an ecological point of view, the exceptional variety of the selected species is a dominant characteristic. More than 90 different species and around 20,000 individual plants are installed in the following categories:
• Trees and large shrubs
• Shrubs and bushes
• Ground-cover plants and herbaceous perennials
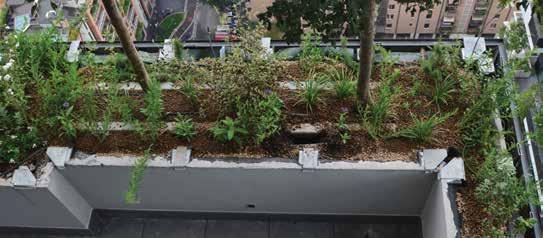
The plant biodiversity represents the natural support to both the plants themselves, as well as to small animals (such as birds and insects) that are already colonizing the towers, finding refuge among the herbs, branches, seeds, buds and flowers (Figure 2.16).
Not all of the selection criteria or locating decisions for the vegetation are known, but the following rules were generally applied:
The species are:
• resistant to wind, due to the flexibility of the tree trunks to bend
• tolerant of pruning
• resistance to parasitic attacks
Moreover, the species:
• do not stimulate allergies
• tolerate “urban conditions,” such as the high rate of pollution
• do not produce large fruit or seeds (to avoid the risk of injury
Botanic Name [Latin]
Big trees (Height: 5.5 - 6 meters)
Corylus colurna *
Fagus sylvatica *
Gleditsia triacanthos “Sunburst”
Common Name [English]
Turkish hazel N, E, S
European beech N, E
Thorny locust N, S
Quercus ilex * Holly oak S, W
Medium trees (Height: 3 - 5 meters)
Acer campestre
Maple N-E
Amelanchier Shadbush N, W
Cladrastis lutea
Fraxinus ornus
Laburnum alpinum
Malus “Golden Hornet”
Malus “Red Jewel”
Olea europaea sylvestris
Parrotia persica *
Prunus subhirtella (*)
Prunus subhirtella “Autumnalis” (*)
Kentucky yellowwood S
South European flowering ash W, S
Laburnum N-W
Apple tree W, N-W
Apple tree S
Olive tree E, S, W
Persian ironwood E
Spring cherry N, E
Spring cherry E
Small trees and large shrubs (Height: 1.75 - 2 meters)
Arbutus unedo
Cotinus coggygria
Lagerstroemia indica
Magnolia stellata
Olea fragrans
Punica granatum
Prunus progressiflora
Stewartia pseudocamellia
* species analyzed in the research (*) species partly analyzed in the research
Table 2.1
The tree species used in Bosco Verticale
Cane apple S, W
Eurasian smoketree N, W
Deciduous camellia N
Star magnolia N
Sweet osmanthus S
Pomegranate S, W
≈ Cherry tree re-flourishing
Crape myrtle W
from objects dropping from high above street level)
• are, for the most part, deciduous
• support relatively simple maintenance
The orientation of the tree plantings is determined by a given species’ adaptive capabilities in direct sunlight. For example, heat-tolerant evergreen species from Mediterranean climates, such as olive trees or holly oaks, are located to the south and west faces of the buildings for greater sunshine. Conversely, species more adapted to shade and cooler temperatures are installed to the east and north. These species tend to have a natural habitat in Central Europe or in mountainous
areas of Italy. Of course, these sample considerations are simplifications, since each individual species is different and has specific characteristics and behavior with respect to the climate of Milan.
The taller and higher-growth plants have been thinned out on, or excluded from, higher floors. For example, the European beech, a beautiful and tall deciduous tree, is installed up to about half the height of Tower E. On the upper floors, a species with very similar foliage, the Persian ironwood, is installed; it has a more bushy habit, and is characterized by much slower growth than the European beech.
All the tree species are listed in Table 2.1.
It is important to underline that Bosco Verticale does not imitate a natural forest. The plant species that coexist here would not spontaneously develop near each other in a natural setting. The project is a masterly designed combination of plants placed under highly artificial conditions, selected to resist unfavorable microclimates around the tower, assisted by professional maintenance. Despite this, the floral diversity of the project is high and will likely have a positive effect on animal biodiversity. Many plants, in fact, produce small fruits, berries, and flowers; and the vegetated wall system provides shelter and water.
Pre-Cultivation: Trees
The trees were selected based on a consideration of the most advanced principles of pre-cultivation in nurseries. The trees, which are at least 15 years old, have precisely calibrated sizes (obtained thanks to a professional pruning) and are free of any “defects of shape,” which means that they have a single trunk, the lateral branches do not compete with each other and are radial, well-spaced, symmetrical and lightly webbed.
The preparation of the root ball is very important for the success of the planting and the health of the trees. The root balls were processed to yield a size of 90 centimeters’ diameter for big trees and 70-75 centimeters for medium-sized trees.
After having obtained the root balls, all the trees were grown with a specific technique to avoid the development of spiraling roots. The root balls, placed above the ground, were wrapped with a cylindrical
panel in high-density polyethylene, corrugated and perforated with small holes. This technique enables an optimal distribution of the roots and prevents the formation of spiraling roots, by pruning the external apical roots in contact with the air. The response of the plant to the pruning is to send out more fibrous roots with a radial configuration.4
This description is not a complete technical overview, but provides sufficient information to understand how the irrigation system functions.
The Water Distribution Network for Irrigation
The water distribution network for irrigation is composed of three main elements: the principal network, which brings water from underground to the terraces; the control group in the plant containers, which regulates the water supply; and the drip line, which provides widespread distribution throughout the plant containers.5
The building is irrigated by groundwater. In the basement of each tower there is a water storage tank, which is continuously fed by groundwater. If a problem occurs, it is possible to fill the water storage tank with water from the city water system.
From the water storage tank to all floors of each tower, the water is distributed through different groups of water-lifting pumps. Every group of water-lifting pumps supplies one sector of the towers. In Tower D there
are two sectors, one of low and one of high hydraulic pressure. In Tower E, there are three sectors (low, medium and high hydraulic pressure). Every group has a maximum flow capacity of 6 m3/hour.
Between the water storage tank and the groups of water-lifting pumps is the fertilizing/irrigation device (fertigator). The circulating solution is drawn from the tanks and fed into the network. Fertilization can be achieved through a simple balance of nitrogen, phosphorus and potassium, each in a 10% concentration. The remainder of the solution (70%) is water.
The main irrigation tubes are located on the façades. Since these tubes are not materially protected from frost, an automatic operation empties the system when the temperature reaches 0 °C, and recharges it when the temperature returns to between 5 and 6 °C.
Each plant container has one “control group” of irrigation. The control group receives water from the main distribution network and regulates the water flow inside the container. Each control group is comprised of three elements, enclosed inside a box, partially buried in the substrate of the plant container:
1. one solenoid valve
2. one filtration unit
3. one pressure regulator
4 The information regarding the pre-cultivation has been provided by Cesare Peverelli in 2013.
5 The information regarding the irrigation system has been provided by Paolo Pessina in 2014.
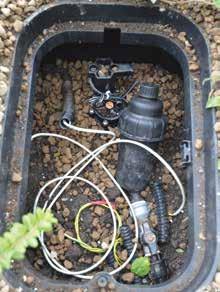
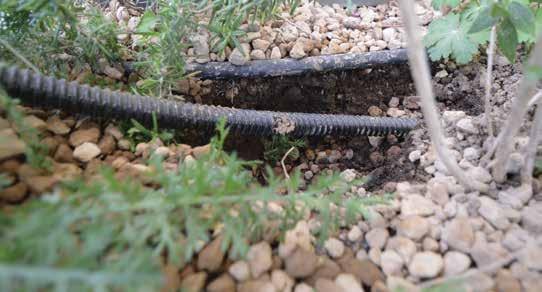
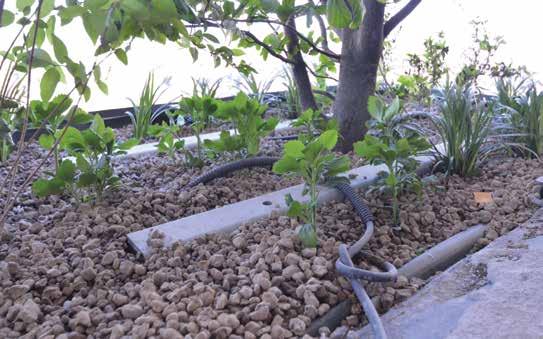
Each plant container, therefore, has one solenoid valve that is independent from all the others; separate commands for each container will open and close this single valve (Figure 2.17).
Downstream of the control group, in each plant container the drip-line distributes the water on the surface of the substrate (Figure 2.18). The drip-line is shielded against root penetrations and siphoning. The emitters are located every 20 to 35 centimeters along the drip-line.
The irrigation is electrically operated, and every solenoid valve can work independently. This feature allows different flow rates to be programmed for each container, according to the water demand of the plants.
All 280 valves in the project control system have their own unique open/ close commands, controlled by an industrial computer (the “control room”) that will regulate nearly all the facilities and systems of the building when it is in full operation.
Inside each plant container there are two humidity sensors that register the humidity level of the substrate. One sensor checks the humidity of the
substrate near the distribution point (the valve); the other sensor checks the humidity of the substrate on the other side of the distribution point.
The recorded data is used to control the efficiency of the irrigation schedule and for verifying any failure of water supply in the plant containers (such as obstructions or leaks). The humidity sensors are connected to the control room.
The flows of each valve and the activation times are set according to the experience of the operators. After a trial period, the schedules are analyzed alongside the recorded humidity data in order to calibrate the irrigation flows, the humidity of the substrate, and the general well-being of the plants. After the initial phase, the schedules are corrected so as to avoid excess or insufficient irrigation.
“The main irrigation tubes located on the façades are not materially protected from frost. An automatic operation empties the system when the temperature reaches 0 °C, and recharges it when the temperature returns to between 5 and 6 °C.”
The aim of the tree-monitoring program is “describing by measuring” the state of health of the trees installed on Bosco Verticale.
The monitoring data provides useful information to determine if plants are in good health, or if they suffer from some deficit that can negatively affect their physiology. Such a deficit could have dramatic consequences in this particular building, because intervening with corrective maintenance can be difficult and expensive. Replacing diseased trees by lifting new trees of similar dimensions into position is not practical, with the exception of the lower floors.
Therefore, through this data, it is possible to assess the effectiveness of the adopted agro-technical solutions and their respective requirements for ordinary or focused maintenance.
Lastly, the collected data represents a “historic archive” that can potentially be useful for future checks of Bosco Verticale’s trees. The assumption of the monitoring is that the more intense climatic and environmental conditions on the terraces of the tower at height could be “aggressive stressors” for plants that take root inside the containers.
In order to assess the health of the trees, the monitoring program is based on the following activities:
• Selecting testing areas and trees
• Checking the success rate of planting and measuring growth activity
• Assessing nutrition
• Determining the effects of possible environmental stressors
• Data collection and results discussion
All tests described here were conducted on the plants of Tower E.
Considering the state of the planting site at the beginning of monitoring, Tower E has been divided into three different classes of height:
• Class 1: the “low” class, up to the 7th floor
• Class 2: the “middle” class, from the 8th to the 12th floor
• Class 3: the “high” class, from the 13th to the 18th floor
At the beginning of the first monitoring period in July 2013, the trees of the last eight floors of Tower E had not yet been installed. The trees and the shrubs of these highest floors were planted on site after the beginning of the monitoring, so the research team decided to repeat in 2014 testing on the same trees tested in 2013, in order to obtain comparative data.
For each class, the tested trees are oriented to the four cardinal points, except for class 2, in which no trees were tested on the north façade. Twenty-seven trees were selected in all: 10 trees in class 1; seven trees in class 2; and 10 trees in class 3 (Figure 3.1).
The chosen trees were classified according to the maximum height that
the species can reach in nature. “First magnitude” species of trees naturally grow higher than 25 meters; “second magnitude” species range in height from 15 to 25 meters). The decision to analyze the taller species is based on the reasoning that the taller species may be assumed to require higher levels of maintenance. They may have more difficulties, when compared to smaller trees, growing in such artificial conditions. Further, they are not commonly applied in general living green technologies, so the opportunity to test their application here was seen as fortuitous.
In Figure 3.1 and Table 3.1, the trees selected for the monitoring are listed and schematically represented.
The tree numbering system works as follows:
QI.02.V01
The first two characters represent the scientific name of the tree species, e.g., Quercus ilex = QI.
The second two characters indicate the floor number where the tree is located.
The third set of characters indicates the number assigned to the terrace during research.
All the specimens of the species listed below (installed on Tower E) were analyzed:
• Fagus sylvatica, European beech = FG
• Parrotia persica, Persian ironwood = PP
• Quercus ilex, Holly oak = QI
Legend tree with an allowed growth of about 6 meters tree with an allowed growth of about 5 meters n°x = number of the tree according to the ID assigned and listed in Table 3.1. For more detailed data, see Appendix.
Figure 3.1
CC = Corylus colurna, Turkish hazel
FG = Fagus sylvatica, European beech
PP = Parrotia persica, Persian ironwood
The four façades of the Tower E with the trees selected for the first monitoring program, June - October 2013
PR = Prunus subhirtella, Higan cherry
PSA = Prunus subhirtella atumnalis Higan cherry
QI = Quercus ilex, Holly oak
Only some of the specimens of the species listed below (installed on Tower E) were analyzed:
• Corylus columa, Turkish hazel = CC
• Prunus subhirtella, Higan cherry = PR
• Prunus subhirtella autumnalis, Higan cherry = PR
The only species of first-magnitude trees not analyzed, although it was present on both towers, was the Gleditsia triacanthos “Sunburst” (Thorny locust), because the crown of this tree is high on the trunk and thus difficult (and forbidden) to reach without a fall-arresting safety system. Only some
“The assumption of the monitoring is that the more intense climatic and environmental conditions on the terraces of the tower at height could be ‘aggressive stressors’ for plants that take root inside the containers.”
1 QI.02.V01
(Quercus ilex)
) 02
3 FG.02.V02 European Beech (Fagus sylvatica) 02 North
4 PR.02.V03 Higan Cheery (Prunus subhirtella) 02 North
5 FG.02.V04
(Fagus sylvatica)
(Quercus ilex)
7 PSA.03.V05 Higan Cheery (Prunus subhirtella autumnalis) 03 East
8 PR.04.V03-removed Higan Cheery (Prunus subhirtella) 04 North
9 PSA.04.V04 Higan Cheery (Prunus subhirtella autumnalis) 04 East/south-east 10 QI.04.V05
12 FG.08.V05
Oak (Quercus ilex) 04
Quercus ilex)
Beech (Fagus sylvatica)
13 QI.08.V08 Holly Oak (Quercus ilex) 08 South
14 QI.08.V10 Holly Oak (Quercus ilex) 08 South
15 PSA.10.V04-north Higan Cheery (Prunus subhirtella autumnalis) 10 East/south-east
16 PSA.10.V04-south Higan Cheery (Prunus subhirtella autumnalis) 10 South/east
17 QI.10.V05 Holly Oak (Quercus ilex) 10 South
18 PP.13.V02 Persian Ironwood (Parrotia persica) 13 North
19 QI.13.V06 Holly Oak (Quercus ilex) 13 South
20 PP.14.V01 Persian Ironwood (Parrotia persica) 14 North
21 CC.14.V02 Turkish Hazel (Corylus colurna) 14 North
22 PP.14.V04 Persian Ironwood (Parrotia persica) 14 East
23 QI.14.V07 Holly Oak (Quercus ilex) 14 South
24 QI.14.V09 Holly Oak (Quercus ilex) 14 South
25 CC.15.V01 Turkish Hazel (Corylus colurna) 15 North
26 PSA.16.V03 Higan Cheery (Prunus subhirtella autumnalis) 16 East/south-east
27 QI.18.V08 Holly Oak (Quercus ilex) 18
Table 3.1
The trees selected for monitoring and their location on the building (for more detailed data, see Appendix)
of the tests could be applied to the Prunus for the same reason.
The orientation of the selected species is as follows:
Corylus columa, Turkish hazel (2 trees)
• two in class 3: both north
Fagus sylvatica, European beech (4 trees):
• three in class 1: two north and one east
• one in class 2: east
Prunus subhirtella (+autumnalis), Higan cherry (7 trees)
• four in class 1: two north, two east
• two in class 2: one east, one southeast
• one in class 3: east
Parrotia persica, Persian ironwood (3 trees)
• three in class 3: two north, one east
Quercus ilex, Holly oak (11 trees)
• two in class 1: two south, one west
• four in class 2: three south, one west
• five in class 3: four south, one west
The monitoring of the success rate of planting was done simply through observing the general conditions of the trees after installation, with respect to the parameters outlined below.
The first tree monitoring was conducted on July 17th, 2013. On this date, all the planted trees were alive and vegetated.
The second monitoring was conducted on September 26th, 2013. Also on this occasion all trees were vegetated and showed good growth condition.
The selected trees species and measured height, on the first monitoring period, September 2013
The third and final tree monitoring was conducted on May 14th, 2014. On this occasion, one tree, the Quercus ilex (tree number 23, class 3, south) appeared partly desiccated, and lacked new branches and leaves. All the other trees showed good vegetation conditions.
The Research: Checking Tree Health Through Field and Laboratory Tests
The monitoring through field tests focused on the following parameters:
• tree size
• leaf chlorophyll content (SPAD) and leaf nutrient content (for assessing nutrition)
*Note, “crown graft height” is the height on the trunk where the scion of one plant is inserted into the trunk of another
• chlorophyll fluorescence and leaf heavy-metal content (For assessing the effects of environmental stressors)
Each of the tests is detailed below.
Size
The height of selected trees was determined by a clinometer, an instrument for measuring slope angles and the elevation or depression of an object with respect to gravity. Clinometers measure both inclines (positive slopes) and declines (negative slopes).
The clinometer is normally used in forestry and operates through rules of
basic trigonometry. First, the observer measures the straight-line distance (D) from the observation point (O) to the object. Then, using the clinometer, the observer measures the angle (a) between the point (O) and the top of the object. Then the observer does the same for the angle (b) between the point (O) and the bottom of the object. Multiplying the straight-line distance (D) with the tangent of (a) gives the height of the object above the observer. Multiplying the straightline distance (D) with the tangent of (b) gives the depth of the object below the observer. Summing these two last measures, the total height of the object is obtained (Table 3.2). Note, “crown graft height” is the height on the trunk where the scion of one plant is
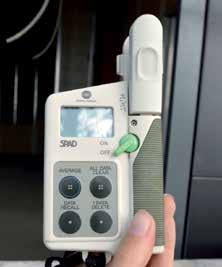
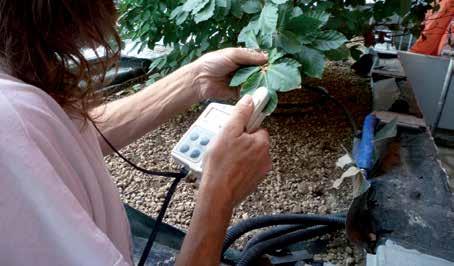
inserted into the trunk of another, i.e., where two plants are lashed together so as to grow together as one. Only the cherry trees (Prunus subhirtella) in this survey had crown grafts.
For a more accurate measurement it is better to use a straight-line distance from the base of the tree not less than the height of the tree being measured; however, the location of trees on the higher balconies did not allow work at this distance. The obtained values are believed to be reliable, considering the declared height classes.
The trees’ sizes were taken on September 26th, 2013.
Nitrogen is the most important nutrient for plants, as it is essential for protein formation, the nucleic acids and other cellular constituents. The SPAD (Soil and Plant Analyzer Development) measures the chlorophyll content in the leaves, as there is a close correlation between the SPAD measures the nitrogen content within the leaf. The determination of the chlorophyll content was made by using a Minolta SPAD 502 Plus Chlorophyll Meter (Figures 3.2 & 3.3).
The SPAD values describe subtle changes or trends in plant health long before they are visible to the human eye; consequently they can inform decisions on whether to fertilize the plant or to conduct further analysis. The SPAD measurements are fast and non-invasive. The SPAD values are expressed as an “Index of relative chlorophyll content” (Chlorophyll Content Index-CCI) or “SPAD units.”
The range of SPAD units is between 0.0 and 99.9. Annual variations of CCI readings generally show a tendency to increase during the vegetative period. In standard conditions, a normal range of CCI is a value between 40 and 60, although the values may be different from species to species (Table 3.3 & Figure 3.4).
For each tree, the SPAD value was obtained through five to seven individual measures on different leaves. The leaf chlorophyll content was measured on July 17th and September 26th, 2013 and on June 19th, 2014. It is possible to assert that the measured values were in accordance with data recorded on similar trees living in “normal conditions” (Figure 3.4); no significant differences were observed between the three different classes and orientations, but some differences occurred between monitoring periods.
For Turkish hazel, good values were found in all three seasons of monitoring. For European beech, the monitoring showed generally low-tointermediate values, especially during the last spring (2014), when compared to other trees in class 1 (Figure 3.5). For
Figure 3.4
Leaf chlorophyll content (SPAD) of all the monitored trees
The normal range of leaf chlorophyll content is between 40 and 60 SPAD units, although the values may be different across tree species. It is important to underline that the annual variation of Chlorophyll Content Index (CCI) generally indicates an annual tendency to increase during the vegetative (growth) period.
“The SPAD values describe subtle changes or trends in plant health long before they are visible to the human eye; consequently they can inform decisions on whether to fertilize the plant or to conduct further analysis.”
Persian ironwood, normal values were found in autumn; and there were some insignificant differences between the two springtime sessions.
For Cherry trees, it was not possible to register some data in September 2013 and May 2014, due to building security issues; however, in class 2 some lower values were detected in Spring 2014.
Holly oaks are characterized by good values in 2013, which were generally higher (and better) in the summertime; some of the Holly oaks had lower values in spring 2014 compared to late spring 2013. The Holly oaks with low values in 2014 showed some suffering (less vegetation activity) (Figures 3.5-3.7).
Nutrition Assessment Action 2: Leaf Nutrient Content
The leaf nutrient content indicates the well-being of plants and, at the same time, the soil fertility. The main three macronutrients (N-Nitrogen, P-Phosphorous, K-Potassium) and one important micronutrient (FeIron) were measured in mature leaves of Fagus sylvatica (European beech), Quercus ilex (Holly oak), Prunus subhirtella (Higan cherry) and Parrotia persica (Persian ironwood), for a total of 11 specimens. The specimens are as follows (Table 3.4 & Figures 3.8-3.11):
European Beech (2 specimens):
• 2 trees in class 1: oriented north
• 1 tree in class 2: oriented east
Holly oak (6 specimens):
• 2 trees in class 1: one oriented south, one west
• 3 trees in class 2: two oriented south, one west
• 3 trees in class 3: two oriented south, one west
Higan cherry (1 specimen):
• 2 trees in class 1: oriented east
Persian ironwood (2 specimens):
• 2 trees in class 3: oriented north
• 1 tree in class 3: oriented east
The leaf nutrient content was measured on September 26th, 2013 and May 30th, 2014. Analyses were carried out in a laboratory using
standard agronomic methods. Samples are acquired using rapid drying at 105 °C. After drying, particles are reduced in size by either cutting or powdering in order to obtain a suitable laboratory sample. For total Nitrogen, determination is done using the Dumas method (Nitrogen analyzers). For other elements, a wet acid digestion procedure (Nitric acid + Hydrogen peroxide) is used (microwave digestion). Afterwards, wet acid digestion elements are determined in atomic absorption spectrometry (cations) or colorimetry (P) techniques. The aim of the tests was to verify a correlation between
the leaf nutrient content of the trees, class and orientation.
A “survey range” is provided when data are within the survey range, trees have a normal tissue nutrient concentration (Mills & Jones, 1996). However, lower and upper limits of nutrient concentration are not clearly defined. Lower values do not necessarily indicate deficiencies, and higher values do not mean toxicity. This means that moderate value fluctuations can be considered “normal” in this analysis.
Generally all values lie in a normal range, although iron content is very
high in all samples, especially those resulting from the 2013 monitoring (Figure 3.11). High iron concentrations may cause antagonism with other elements (such as phosphorous, manganese, and copper), but in the monitored trees no abnormal symptoms were seen. Moreover, the lower values found in the final monitoring indicate that the element concentration is normalizing and that the first data may have been influenced by nursery fertilization before planting.
Nitrogen, phosphorous and potassium are generally higher in the 2014 monitoring results compared to those from 2013; this aspect is most likely related to a greater root activity in the springtime, and to the mineralization of organic matter in the growing media.
Furthermore, these differences are related to the different sampling seasons (autumn 2013 and spring 2014): normally higher values correspond to a greater vegetative activity. No differences were found between species and classes.
In conclusion, the nutrient condition of the Bosco Verticale trees is good, although no fertilization was carried out during the monitoring time (i.e. from the plants’ installation until June 2014). This information was provided by the landscape maintenance manager of the building.
Chlorophyll fluorescence is a very useful parameter for studying the effects of environmental stressors on the plants,
since the photosynthesis process is often reduced when subjected to adverse conditions, such as water deficit, high temperatures, nutrient deficiencies, pollutants, and pathogens.
The chlorophyll fluorescence is the light re-emitted after being absorbed by the chlorophyll molecules of the leaves. Part of the light absorbed by the leaf is converted by photochemistry to enable photosynthesis. If this photochemistry process is not efficient, the excess of energy can damage the leaf. Since the light is not only absorbed but also re-emitted in the form of heat (non-photochemical quenching) and chlorophyll fluorescence, by measuring the yield of the chlorophyll fluorescence it is possible to assess the efficiency of the photochemistry and the nonphotochemical quenching.
In brief, by measuring the chlorophyll fluorescence, the photosynthetic chlorophyll efficiency is detected, through the maximum quantum efficiency of the primary photochemical of the photosystem II (PSII), which is an important indicator of the well-being of a plant.
This value is given by the ratio Fv/ Fm, which is the most frequently used measure of chlorophyll fluorescence. “Fm” is defined as “maximum
fluorescence” and “Fv” is defined as “variable fluorescence”. Chlorophyll fluorescence can relieve most types of plant stress and can be used for evaluating the environmental stressors. Chlorophyll fluorescence was measured on leaves by using a HandyPEA portable fluorescence spectrometer (Hansatech Instruments Ltd., King’s Lynn, UK). Fluorescence values were obtained after adapting leaves to darkness for 40 minutes by attaching light exclusion clips to the leaf surfaces (Figures 3.12 & 3.13).
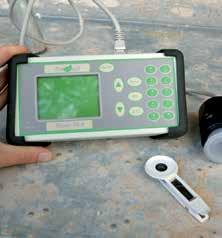
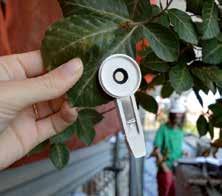
“Chlorophyll fluorescence is a very useful parameter for studying the effects of environmental stressors on the plants, since the photosynthesis process is often reduced when subjected to adverse conditions.”
(n*): data on 1 year old leaves
Table 3.5
fluorescence
Fo = value of fluorescence in the ground state of the electron: minimal fluorescence
Fm = maximum value of fluorescence after excitation of the electron
Fv = Fm — Fo
Fv/Fm = maximum quantum efficiency of the primary photochemistry of photosystem II: in leaves under normal physiological conditions this value is close to 0.8; lower values indicate damage to the photosystem
Upon the application of a saturating flash of actinic light (3.000 µmol m-2 s-1 for 1 second), fluorescence raises from the ground state value (Fo) to its maximum value (Fm). This allows the determination of the maximal quantum yield of PSII (Fv/Fm = (FmFo)/Fm). Measurements were done on one leaf for each tree.
The leaf chlorophyll content was measured on July 17th and September 26th, 2013 and May 14th, 2014. In Table 3.5, the chlorophyll fluorescence levels of the trees are listed. Generally, the leaves are in normal physiological
Chlorophyll uorescence
European beech + Persian ironwood
Values according to di erent classes
Figure 3.14
Chlorophyll fluorescence of European beech and Persian ironwood, according to different classes
3.15
fluorescence of European beech and Persian ironwood, according to different exposures
Chlorophyll fluorescence
3.16
conditions when the ratio Fv/Fm is near to 0.8 (regardless of the species). The results show a normal condition for all the monitored trees.
There are no significant differences in values obtained in the three different seasons of monitoring. Class factor and orientation did not affect the results. For some Holly oaks, monitoring was done both on new and old leaves: no differences were found (Figures 3.14-3.17).
The leaf heavy-metal content was measured on September 26th, 2013 and on May 30th, 2014 (Table 3.6).
Analyses were carried out in a laboratory by using the official methods of the Environmental Protection Agency (EPA 3051A:2007 and EPA 7000B:2007). The intent was to verify the concentration of metals on the leaves in relation to floor height and orientation.
On the same specimens used for the leaf nutrient content, the presence of some heavy metals was detected: lead (Pb), cadmium (Cd), copper (Cu), and zinc (Zn) (Figures 3.19 - 3.22).
As reference values, a normal range is provided that indicates the best values for good conditions; however, toxicity levels are sometimes higher than the upper limit of the provided normal range. For copper and zinc, toxicity is found when the concentration is over 200 ppm (parts per million), while for cadmium, toxicity is achieved at concentrations of over 2 ppm.
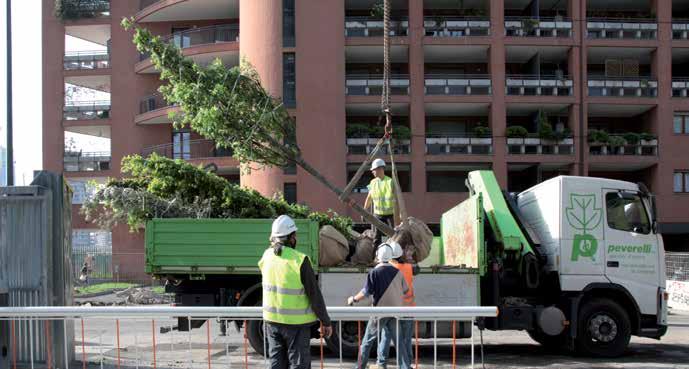
In 2013, normal values of lead and cadmium were found, while there were higher values of zinc and, in the same case, of copper, possibly due to pesticide treatments in the nursery.
In 2014, lead and cadmium values were in a normal range; copper data were not different, while zinc values were lower, and better, compared to 2013.
The results of monitoring show that, after less than two years since planting, the general condition of the trees was good (Table 3.7).
The survival rate of the plantings was 100% after the first growing season, and during the second year, only one tree, a Holly oak, showed poor health conditions. Certainly, the good results of the first monitoring year bear the influence of nursery management (fertilization and pesticide treatments), while the monitoring during the second year is more correlated to the condition of the vertical site.
These results have most likely been facilitated by favorable climatic conditions. In 2013 the spring was very rainy, and summer heat was not a critical factor – there were just two months with warm days and high air humidity. The winter was mild. During spring and early summer of 2014 (until the 10th of July) the weather was cool and rainy, so trees did not suffer any thermal stress. The wind, particularly during spring 2014, was strong for many days. During the monitoring in May, the wind was notably stronger at higher floors.
DIFFERENCES BETWEEN
Classes
(tower height)
[1; 2; 3]
Orientations
[N; E; S; W]
Seasons
[S; S; A; W]
Note
Table 3.7
The data of chlorophyll fluorescence show that during the first two seasons there were no significant effects of environmental stressors on the tower’s trees, regardless of class or orientation. Results were always calibrated to the reference standard value (Fv/Fm=0.8), which indicates good physiological condition.
With respect to chlorophyll content, results were different from species to species, and between different
ACTION 1
Nutrition assessment ACTION 2
chlorophyll content (SPAD)
European beech lower values in spring 2014 Class 1 Higan cherry lower values in Class 2
Persian Ironwood lower values to North
Holly oaks lower values in spring 2014
Turkish hazel higher values in spring 2014 (in normal range)
Higan cherry lower values in spring 2014
Differences linked to the species’ adaptability to the conditions of a tower
Holly oak, Turkish hazel species better adapted
nutrient content
influences
No influences
All species higher values of Nitrogen, Phosphorous, Potassium in 2014.
All species very high concentration of Iron in 2013 => probably, as effect of fertilization in nursery
Root activity is increasing and minerals in the substrate are produced from the transformation of the organic matter
Adaptation of trees to different heights and orientations: synthesis of the results
Effects of environmental stressor
fluorescence
heavy metal content
All species higher values of Zinc in 2013.
No influences
All species very high concentration of Iron in 2013, probably, as effect of pesticide treatments in nursery
No effects of environmental stressors of the monitored trees
monitoring periods it was possible to note some differences. Considering an average reference range between 40 and 60 Chlorophyll Content Index, some European beeches showed low results, not correlated to height or exposure.
The better results were obtained during the end of the summer of 2013. This is normal, considering this index, because readings generally show an increasing trend during the vegetative period. For Persian ironwood, low results were found in the last spring monitoring, especially for trees with northern exposure. Holly oaks provided good results, in accordance with data recorded on similar trees living in “normal conditions.” Just a few specimens showed marginal values in the last springtime monitoring.
Turkish hazels provided good values in all monitoring, while the few data for Higan cherry showed generally standard values (lower in spring 2014 for trees in class 2).
Considering the good results obtained from the chlorophyll fluorescence and leaf nutrient content tests, it is possible to state that Chlorophyll Content Index values may be considered good, even when lower than the adopted reference range. Furthermore, each value is an average of multiple readings of individual leaves, and some of these leaves were inside the crown and not exposed to direct sunlight. The lower values may have been influenced by this.
The data of leaf nutrient content and heavy-metal content show very good results. No deficiencies were
found and the nutrient condition of the plants were good. Heavy-metal content was generally within a normal range, while for copper and zinc the higher values (possibly related to pesticide treatments in the nursery) were never at toxicity level.
As to growing media, its initial properties showed high total porosity (almost 70%), good water retention, a total weight at maximum saturation level less than 1,300 kg/m3 (about 750 kg/m2 for a depth of 50 cm), with an air volume of about 20% in such conditions. For chemical properties, the substrate had a neutral pH, low salinity, no lime, about 10% dry organic matter, good cation (charged ion) exchange capacity, and a high level of exchangeable potassium and available phosphorus.
No fertilizations were performed during these first two years, so trees have used what the substrate has produced (exchangeable nutrients and organic matter mineralization). The absence of natural runoff prevents loss of nutrients, so that the reserves present in the substrate can be fully used by roots. A monitoring of nutrient content in the growing media would be recommended before the next new growing season.
“The good results of the first monitoring year bear the influence of nursery management (fertilization and pesticide treatments), while the monitoring during the second year is more correlated to the condition of the vertical site.”
Façades covered with plants are generally considered positive for sustainability because of the benefits that vegetation brings to the external environment, such as air temperature mitigation, air humidity increase as an effect of evapotranspiration, dust absorption, pollution reduction, BVOC (Biogenic Volatile Organic Compounds) production, carbon sequestration, and so on (for more on this, see Chapter 1.0).
Those benefits are variable, depending on the positioning of the vegetation. Their magnitude is influenced by the size and thickness of the crop, and by the leaf characteristics specific to each species.
As to the benefits to the internal environment of a building, the vegetation on the façade reduces the cooling load during the warm season, due to reducing solar gain through the envelope. This advantage is one of the most significant and depends essentially on three main factors and their interaction:
1. Plants acting as a sunscreen: The shielding capacity of the leaves (which is particularly efficient due to phototropism) reduces the absorption of solar radiation of the shaded layers, and therefore the heat transfer to the indoors
2. Plants acting as a windscreen: Although leaves are characterized by certain levels of wind permeability, they help to reduce convective heat transfer
3. Plants using solar energy for their transpiration and photosynthesis: These two processes are responsible for air temperature reduction, since the sensible heat is converted into latent heat, and lower external air temperatures imply less consumption of cooling energy in interiors.
In recent years, numerous vertical greenery systems have been implemented, with increasing success.
As per CTBUH Technical Guide, Green Walls in High-Rise Buildings (Wood, Bahrami, Safarik, 2014)
The “green wall” or “vegetated façade” is defined as a system in which plants grow on a vertical surface, such as a building façade, in a controlled fashion and with regular maintenance. Climbing plants grow naturally on building façades by attaching themselves directly to vertical surfaces by means of various mechanisms. Selfclinging climbers and self-supporting woody plants can attach themselves directly to the façade surface or grow along the façade without any added support. Other plant species, including climbers with aerial roots, suckers or tendrils, twining climbers, and lax shrubs (ramblers), require additional support, such as trellises, netting, or wires attached to the façade surface, to promote or sustain vertical growth.
The main elements of green walls are thus:
• plants
• planting media
• structures that support and attach plants to the façade
• the irrigation system
Depending on the plant species, planting media, and support structures used, one can distinguish multiple types of green walls, which are broadly grouped into two categories:
“Façade-Supported Green Walls” and “Façade-Integrated Living Walls” (Figure 4.1). Further categories include “Stepped Terraces” and “Cantilevering Tree Balconies,” the latter of which is the type of system used at Project.
Façade-Supported Green Walls
A façade-supported green wall is a green wall system supported off a façade, in which the planting medium is not integral to the façade. Usually it is carried in horizontal planters, which may be supported directly from the façade.
A façade-supported green wall structural system is usually comprised of steel, wood, or plastic trellises externally attached to a building façade, where plants are supported by horizontal, vertical, or diagonal trellis members. Climbing plants and vines used in green façades grow from planters located on the ground or at multiple intervals along the height of the façade. Green façades can be twodimensional, formed by cables, ropes, and meshes, or three-dimensional, formed by rigid frames and cages.
Sub-categories of façade-supported green walls are recognized according to their structural support system, as outlined below.


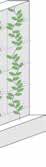
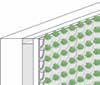


Metal Mesh Green Wall
A metal mesh green wall uses a tightly intertwined grid of aluminum or lightweight steel attached to the façade via brackets. Plants typically grow from planters or troughs at the base of the wall.
Cable-Supported Green Wall
This type of green façade uses flexible cables that are used to support plants in irregularly-shaped and wide-span installations.
Rigid Green Wall
This system can utilize two and three-dimensional trellises that can be attached to a wall substrate, built around columns, or can be freestanding.
A living wall is a system in which vegetation is not only attached to a building façade, but is fully integrated into the façade construction, in which plants and planting media are both placed on the vertical surface of the exterior wall. Typically, living walls are separated from the
façade surface by a waterproof membrane layer intended to protect the rest of the façade construction from unwanted moisture. Irrigation systems can be accompanied with rain sensors to make the living wall’s needed irrigation more efficient and sustainable. There are multiple variations of living walls, as highlighted below:
This type of living wall consists of a fabric layer attached to a rigid substrate. Pre-grown plants are inserted into
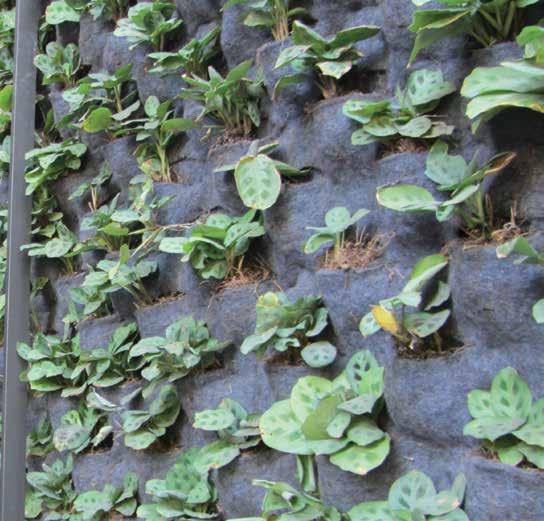
holes cut in the fabric layer, where they establish their root system between the layers that serve as the planting medium. Vegetated mats usually operate like water-based hydroponic systems, because no planting medium is used and nutrients are delivered to plant roots through water from irrigation pipes behind fabric layers.
Similar to vegetated mats, this green wall type consists of pocket-like fabric containers attached to a rigid substrate layer. Plants are rooted in these felt or plastic containers filled with planting medium (Figure 4.2).
Modular living walls, made of rigid rectangular containers that are filled with planting media, can be attached to an exterior wall or be free-standing. The containers are manufactured
out of metal or lightweight structural plastic, and can be shaped as framed boxes, wire cages, or solid boxes with pre-cut holes. In some cases, the containers are subdivided into smaller individual cells and placed perpendicular or at an angle to a container’s back wall. Modular living walls can also be made from a series of troughs or horizontal mini-planters stacked vertically. Plants are then grown directly in containers that are filled with soil, non-organic planting media, or natural fiber.
Stepped terraces typically consist of concrete walls holding planting media in trays, advancing upwards in steps, much like the terraced agricultural planting fields found on steep hillsides in many parts of the world. This approach is most often used when the plants and their associated media
are varied or require a large amount of soil, and can be used as both a green roof and a green wall.
Some buildings, including Bosco Verticale, place substantial trees in front of their façades, using a projecting balcony. Such platforms typically contain planters of a depth sufficient to support a root structure and the required soil, sometimes up to the level of the safety railing. Because of the weight of the tree and soil, the platforms tend to be made of reinforced concrete and are integrated into the structure of the building.
Green wall types can include exterior walls covered with a layer of moss or grass, and even entire trees. Examples of moss- and grass-clad exterior walls include façades created by Dutch designer Oasegroen and British visual artists Ackroyd and Harvey. A fascinating green wall example, featuring trees grown twodimensionally along the exterior walls, is the façade of the Holiday Houses in Jupilles, France, designed by architect Edouard Francois. Another example of green walls includes a system of façade panels with integrated planters, such as in the Organic Building by Gaetano Pesce in Osaka, Japan, or in the Green Cast building by Kengo Kuma in Odawara-shi, Japan. Green walls can be also comprised of a layer of potted plants (Figure 4.3) or innovative construction materials with integrated planters, such as the hollow brick exterior wall of the Garden in Ibiza, Spain, by Urbanarbolismo.
In this section, a calculation method for the energy performance of Bosco Verticale envelope is developed. One typical floor (the 6th) has been modeled with EnergyPlus building energy simulation software.
For determining the geometric characteristics of the tree crowns, the Leaf Area Index (LAI) is calculated for selected typical trees on the building. The LAI is defined as “half of the total green leaf area per unit of ground surface area.” It represents a dimensional measure of the vegetation, precisely detectable through an optical instrument (Chen and Black, 1992). The canopy model of the trees exploits several LAIs measured on the Project site through the Plant Canopy Analyzer LAI-2000 tool. Hence, the “Vertical LAI”, the optical extinction coefficient and the coefficient of solar transmittance are calculated for each tree.
To identify the benefits provided by the plants and by the terraces, three different envelope configurations were simulated with EnergyPlus software and compared; (i) the actual condition, i.e. the building with terraces and with plants; (ii) the building with terraces and without trees; (iii) the building without terraces and without trees.
The evaluation of the performance of the building envelope is performed through building energy simulation
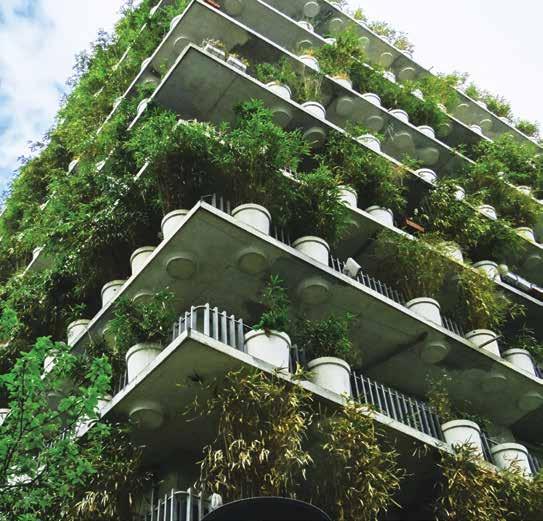
“The benefits of the façade vegetation are variable, depending on the positioning of vegetation. Their magnitude is influenced by the size and thickness of the crop, and by the leaf characteristics specific to each species.”
software. It is based on the Thermal Transfer Function Method, and is able to calculate the thermal energy behavior of the building using subhourly calculation time-steps, taking into account both the envelope and the HVAC system and occupants. In this way, a detailed assessment of the space heating/cooling energy is provided.
Regarding the weather data, the test reference year of Milan is used in order to get reliable and site-specific results.
To obtain the results, the optical description of the vegetation is needed, so that the shadows cast by the trees may be reliably calculated (Table 4.1). For this purpose, the values of LAI measured on a horizontal surface
(LAIH) are used in order to get the equivalent LAI (LAIV, and hence the solar transmission coefficient, τSolar) for vertical displacement, considering the vegetation as isotropic and according to the following equations (Palomo Del Barrio, 1998):
Ks,H = 0.74 x Ki,H
kE = LAIH x (Ks,H/htree)
Ks,V = 0.74 x Ki,V
LAIV = kE x (Ltree/Ks,V)
τSolar = e¯Ltree x kE
when:
• h tree is the average height of the tree [m]
• kE is the isotropic optical linear extinction coefficient [-/m]
• Ki,H is the bulk extinction coefficient for long-wave radiation, referred to the horizontal surface and calculated by interpolation from Table 4.1 [-/-]
• Ki,V is the bulk extinction coefficient for long-wave radiation, referred to the vertical surface and calculated by interpolation from Table 4.1 [-/-]
• Ks,H is the bulk extinction coefficient, referred to the horizontal surface and calculated [-/-] (Table 4.2)
• Ks,V is the bulk extinction coefficient, referred to the vertical surface and calculated [-/-] (Table 4.2)
• L tree is the average diameter of the tree, [m] (Table 4.2)
** [-/-] symbol indicates a dimensionless figure
In particular, in the frame of the present analysis, the following values for Ki,H and Ki,V are assumed:
Ki,H = 0.95
Ki,V = 0.55
The assessment of the space heating/ cooling energy needs is performed, referring to a reference intermediate floor. The main input data about the envelope and occupancy are:
• the thermal transmittance of the construction (external walls and floors)
• the design levels of internal heat gains, represented in Table 4.3.
Moreover, the floor is provided with mechanical ventilation, at a rate equal to 0.3 air changes per hour.
The HVAC system simulated in the frame of the present energy analysis consists of a simplified heating/cooling machine aimed solely at the evaluation of space heating/cooling energy needs. In EnergyPlus, such a simplified system is named the “Ideal Loads Air System”. It controls heating/cooling in order to keep indoor air conditions within comfort range via a dual setpoint and dead-band strategy, with set-point temperatures (Table 4.4).
The weather conditions used for the simulations consisted of a test reference year and the summer design day conditions for Milan, taken from the EnergyPlus Weather database (http://
apps1.eere.energy.gov/buildings/ energyplus/weatherdata_about.cfm).
The plants and trees are considered as plane-shading surfaces occupying the average section of the actual plant or tree. The related solar transmission coefficients are calculated as described in the previous section. However, this value is used only during the cooling period (i.e. from April 15 to October 15), whereas in the heating period, 10% of this value is considered, due to the reduction of leaf cover.
The main results presented in the frame of this analysis consist of: Yearly analysis:
• Solar heat gains entering the reference floor in winter and in summer
Table 4.3
Design level assumptions of heat gains for building energy simulations
Temperature [°C]
Table 4.4
Heating and cooling set-point temperatures for indoor air
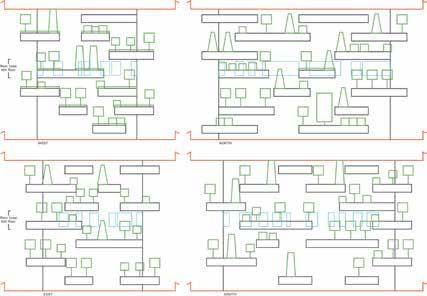
Figure 4.4
Surfaces used to implement the model for EnergyPlus
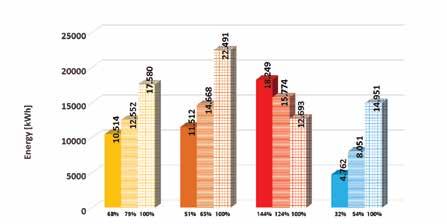
• Space heating/cooling (sensible*) energy needs
* “Sensible” in this context = heat energy that changes temperature but not other properties of a body, such as pressure or volume.
Summer design day analysis:
• Hourly solar heat gain entering the reference floor
• Space cooling capacity needed to maintain comfort conditions inside the reference floor
In particular, three building envelope configurations are simulated:
C.a) The actual configuration, i.e. the actual building with terraces and trees
C.b) The actual configuration with no trees, i.e. the plain building with terraces only
C.c) The base building, with no terraces or trees
Figure 4.5 represents the solar radiation entering the considered reference
floor of the building in winter and in summer, as well as the consequent sensible space heating/cooling energy needs, in the three configurations. The values of space heating/cooling energy needs can be converted into more versatile parameters and assigned to a single unit of floor area:
Space heating energy needs:
• Configuration C.a: 23.2 kWh/ (m2/year)
• Configuration C.b: 18.7 kWh/ (m2/year)
• Configuration C.c: 16.9 kWh/ (m2/year)
Space cooling energy needs:
• Configuration C.a: 7.0 kWh/(m2/ year)
• Configuration C.b: 11.8 kWh/ (m2/year)
• Configuration C.c: 22.0 kWh/ (m2/year)
It is evident that the presence of terraces and additional trees decreases the amount of collected solar
radiation during the winter season by 32% and 21%, for configurations C.a and C.b respectively, compared with Configuration C.c, thus resulting in 44% and 24% higher space heating energy needs, respectively.
On the other hand, in configurations C.a and C.b, terraces and trees block 49% and 35% of the solar radiation entering the reference floor in summer, compared with configuration C.c, thus making it possible to decrease spacecooling energy consumption by about 68% and 46%, respectively (Figure 4.6).
However, in order to understand the real influence of the terraces and trees on the yearly energy consumption, the electric energy consumed by the heat pumps and chillers providing heating/ cooling for the building must be assessed. Considering seasonal values of the Coefficient of Performance (COP) of the heat pump and the Seasonal Energy Efficiency Rating (SEER) of the chiller, equal to 2.5 and 3.5 respectively, the following yearly consumptions of electricity are achieved:
Annual solar gains and thermal load of a typical floor (6th floor) of Bosco Verticale: synthesis of the output data referred to a single unit of floor area
Electricity consumption for space heating:
• Configuration C.a: 10.7 kWh/ (m2/year)
• Configuration C.b: 9.3 kWh/(m2/ year)
• Configuration C.c: 7.5 kWh/(m2/ year)
Electricity consumption for space cooling:
• Configuration C.a: 2.0 kWh/(m2/ year)
• Configuration C.b: 3.4 kWh/(m2/ year)
• Configuration C.c: 6.3 kWh/(m2/ year)
Electricity consumption for space heating and cooling (Figure 4.7):
• Configuration C.a: 12.7 kWh/ (m2/year)
• Configuration C.b: 12.7 kWh/ (m2/year)
• Configuration C.c: 13.7 kWh/ (m2/year) Coefficient of Per formace (SCOP) of the heat pump = 2.5 Energy Efficiency Ratio (SEER) of the chiller = 3.5
CONF. A external walls, terraces, trees
CONF. B external walls, terraces, NO trees
CONF. C external walls, NO terraces, NO trees
Yearly consumption of electricity, considering the Coefficient of Performance (COP, equal to 2.5) of the heat pump and the Seasonal Energy Efficiency Rating (SEER, equal to 3.5) of the chiller
From this calculation, it is possible to note that the presence of terraces and vegetation decreases the yearly electricity consumption by about 7.5% in both configurations C.a and C.b with respect to configuration C.c. The impact of the plants alone, when compared to the combination of the planting containers, terraces and plants themselves, is somewhat negligible. Also, it must be acknowledged that
trees block unwanted solar radiation in the summer and desired solar radiation in the winter (though to a lesser degree when leaves are lost).
Figure 4.6 highlights one of the main advantages linked to the use of terraces and trees. The decrease in solar heat gains during the summer design day is around 40%, thus ensuring a relevant decrease of the installed
cooling capacity in configurations C.b and, even more, in C.a, compared to configuration C.c. In fact, the installed cooling capacity in configurations C.a and C.b is about 35% and 25% lower, respectively, than in configuration C.c. Thus, relevant savings in HVAC system installation are realized, in addition to the savings in yearly electricity consumption mentioned above.
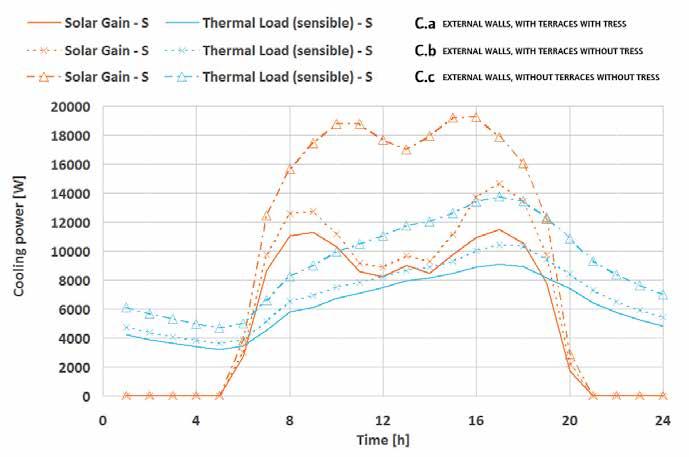
The developed calculation procedure provides results useful for evaluating the performance of the building envelope. The analysis, conducted for three different configurations of the envelope (C.a, C.b, and C.c) affords a comparison of the solar heat gains and space heating/cooling energy needs during one year and during the summer design day (Figure 4.8).
The main thermal benefits derived by the presence of the cantilevered terraces and trees around the external walls occur in summer, and terraces clearly affect cooling loads more significantly than trees. Moreover, terraces and trees together allow a decrease in installed cooling capacity, thus ensuring relevant savings in the initial costs of HVAC equipment.
Furthermore, it is important to highlight two aspects:
1. The LAI of trees was determined during 2013, when the plants had a low growth development level. The trees will grow and become thicker, increasing the shaded surface and the consequent coefficient of extinction
2. In the applied method, the vertical LAI calculation, starting from the normal LAI determination, is nevertheless valid for any application to the living green façade (and living green roof)
Dr. Francesco Chianucci made an inspection of Bosco Verticale in October 2013 and used the Plant Canopy Analyzer instrumentation to detect LAI values of typical trees. He transmitted the data (content in Figure 1.4) and confirmed the difficulty of developing reliable images for research purposes.
After the inspection of the project, he wrote:
The tree canopy represents the active interface for the exchange of energy, water and carbon between plant and atmosphere. Consequently, the tree canopy influences a large number of bio-geochemical processes at the
individual and ecosystem levels, such as evapotranspiration, photosynthesis, the carbon cycle, microclimate, water, and heat balance.
The benefits provided by the vegetation canopy are widely recognized, even in urban environments, as evidenced by the increasing focus on ecological and environmental aspects within urban and landscape planning. Consequently, the proper characterization of the plant canopy is a key element of sustainable urban planning.
The most commonly used attribute to quantify the plant canopy is represented by the Leaf Area Index (LAI), defined as “half the total green leaf area per unit of ground surface area”. The direct measurement of this attribute requires laborious and
“It is evident that the presence of terraces and additional trees decreases the amount of collected solar radiation during the winter season, causing higher energy needs, however in the summer they block the solar radiation, decreasing energy needs.”
destructive procedures, which are difficult to apply, especially in urban areas. For this reason, in recent years numerous indirect and nondestructive testing methods have been developed, most of which allow the estimation of LAI in function of measurements of radiation intercepted by the canopy, using portable instruments such as the Plant Canopy Analyzer LAI-2000 (PCA, Li-cor, Lincoln, NE, USA) (Figure 4.9).
The major limit represented by indirect methods is that they are ideally applicable at the level of a population and not of a single plant. Urban vegetation is typically sparse, and the presence of inert surrounding material makes it difficult to separate the two components.
Digital photography can overcome most of the difficulties represented by the estimation of plant canopy in urban environments. Compared to other instruments that measure radiation, digital photography has the clear advantage of providing a permanent visual representation of what was sampled, thus allowing the identification of the disturbing elements that interfere with the analysis of the crowns (inert materials, reflections of the sun, the presence of the operator, etc.).
The digital image format is also well suited to the elaboration and analysis of qualitative and quantitative factors. Spatially, each digital image is represented by a matrix of cells (pixels). Radiometrically, each pixel is characterized by a numerical value (Digital Number), which expresses the
amount of radiation reflected by the object, represented in a specific band of the light spectrum.
Digital camera standards describe the color characteristics of the visible range using the three monochromatic components Red, Green and Blue (RGB), organized into three separate channels, so that each pixel of a digital image standard will have a different numeric value, depending on the amount of digital radiation reflected in the separate RGB channels (Figure 4.10).
The different and specific capacity of the elements to reflect the radiation allows us to discriminate different entities according to their specific reflectance. For example, the high reflectivity of the leaves in the interval of wavelengths represented by the
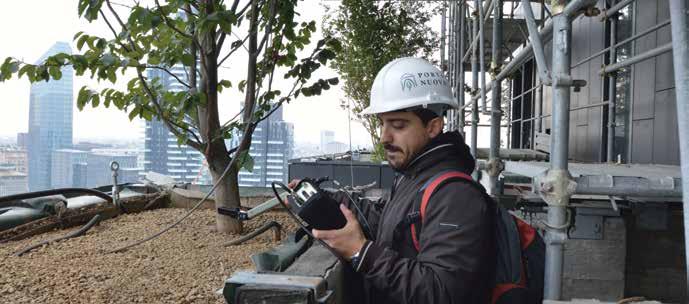
color green allows us to operate simple transformations to obtain an accurate separation of the plant canopy from the surrounding elements. A simple algebraic transformation of the RGB channels of the image to characterize the coverage would be: Leaf coverage = 2G-R-B. This multispectral transformation allows us to explore the high contrast between the light intensity reflected by the leaves and other elements of the image.
A further element of difficulty, which is specific to urban contexts, is represented by the minimum distance between the sensor and the canopy, which is closely related to the height of the plant to analyze. Digital photography has the advantage of being able to vary the size of the sampling using different focal-length lenses, thus providing a flexible tool to achieve a compromise between adequate distance from the sensor coverage and adequate spatial representation.
In conclusion, digital photography can be considered as a promising method to quickly estimate the plant canopy. It provides a proxy for all the environmental benefits provided by urban vegetation, and through which to integrate the ecological aspects of urban planning (Chianucci, 2014).
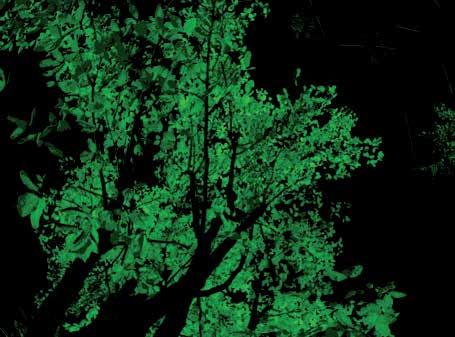
“The main thermal benefits derived by the presence of the cantilevered terraces and trees around the external walls occur in summer, and the terraces clearly affect cooling loads more significantly than trees.”
The plants of the Bosco Verticale are part of a condominium property. All of the vegetation is owned and maintained by the building management, and not by the individual owners of the apartments. The ownership of the apartment thus does not include the vegetation. So, the residents are not permitted to independently maintain or interfere with the plants without prior authorization.
According to the information acquired during the research time –when the maintenance was not ordinary- the maintenance would take place in two ways:
1. Terraces are accessed via apartments, possibly 3-6 times per year;
2. Terraces are accessed from the outside by a basket lift (moved by a telescopic arm placed on the roof of each tower) (Figure 5.1) that will drop personnel from the top to carry out the pruning and other maintenance that cannot be done from the inside, possibly 1-2 times per year.
Since the trees of Bosco Verticale have been installed, maintenance and observation of the health conditions of vegetation have been carried out. It is important to note a few existing conditions at the time of the monitoring:
The maintenance performed until the conclusion of the observation period
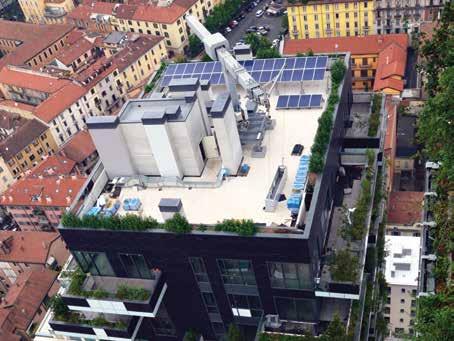
cannot be considered as “ordinary” or routine maintenance, but rather as “initial maintenance”. Since their installation between autumn 2012 and spring 2014, the trees were not pruned, because they had already been treated in the nursery and because, immediately after planting, the trees needed to grow their roots without suffering trauma of any kind (such as pruning).
As of this writing, the control room that governs the automated irrigation system had not yet begun working.
For the reasons listed above, there are no available data concerning the maintenance of non-woody vegetation (i.e. bushes and ground level plants).
This chapter, then, addresses only the maintenance of the Bosco Verticale trees.
The main concerns around the routine management of the trees are threefold: pruning, watering and fertilization.
Pruning is very important, since the installed trees need to be dimensionally constrained, and there are restrictions on maintenance personnel gaining access to the terraces of private apartments.
Fertilization has to be carried out simultaneously with watering, because the main chemical nutrients for plants are distributed with the water. Irrigation management has a great impact, not
only on the trees’ growth, but also on the energy consumption of the whole building. Such an artificial vertical landscape will need a large amount of water. It is reasonable to assume at least as much water is necessary to maintain vertical greenery as would be needed for the same number of plants placed on the ground.
Nowadays, water use needs to be reduced, monitored, and properly divided for the various needs of society, agriculture, industry, and the natural environment. At Bosco Verticale, careful management of water resources is needed to limit waste, and to supply the right amount of nourishment for trees and smaller plants.
Thus, the following chapter provides some consideration and methods for the global management of the Bosco Verticale vegetation, based on calculation procedures for traditional crops and observations in the field.
In the near future, it would be desirable to conduct this study again, so as to compare the methods applied in this chapter with ongoing data about pruning and automated irrigation activity at the building, in order to verify the accuracy of the applied formulas and, possibly, develop correction factors for the baseline formulas for trees and vegetation living on a tower.
The building’s trees are classified according to their height in three different size classes: first, second, and third magnitude. It is expected that the
maintenance activities, in particular the pruning, will be higher for trees of first and second magnitude, since these tree species tend to grow more vigorously.
For estimating the duration and costs of pruning, it is important to remember that access to the plant containers is not conventional, nor simple.
The pruning operations at height obviously take more time than at ground level. The removal of branches and pruned material is more difficult and slower on the towers. It is important to identify what type of pruning will be undertaken on the trees, since the type and period of pruning can significantly affect the growth of trees and, in general, the frequency of the maintenance.
In order to cause the minimum damage to the trees, the research team believes that pruning could be annual and “green.” “Green pruning” is performed during the summertime, i.e. during the vegetative cycle, with the purpose of removing the vegetative vigor of some parts of the plant, so that the plant material to be removed is not bulky and may be disposed of outside the building. In this way, the containment of trees is easier and faster. Furthermore, green pruning is not so traumatic for the trees themselves, in particular for those plants with low tolerance for cuts.
Following observations during the building monitoring, together with information obtained by green operators, it may be assumed that the median time for pruning one tree at
“Terraces are accessed from the outside by a basket lift (moved by a telescopic arm placed on the roof of each tower) that will drop personnel from the top to carry out the pruning and other maintenance that cannot be done from the inside, 1-2 times per year.”
Bosco Verticale is five times higher than the required time to prune a tree with the same characteristics located on the ground level.
Thus, the pruning cost of one tree installed on Bosco Verticale can be three to five times higher than the pruning cost of a tree located on the ground level.
Watering and fertilization have a strong influence on the growth of roots and trees. Roots grow longer when the humidity of the growing media is high and constant. On the contrary, roots grow less when the humidity of the growing media is low.
In the case of Bosco Verticale, the humidity of the substrate needs to be maintained constant in order to limit excessive growth of the canopy. The building is provided with a drip irrigation system, and it is possible to fertilize its plants through watering (soluble fertilizers). The irrigation system is also provided with sensors for measuring growing media humidity.
The following outlines two methods for calculating the irrigation water needs of the Bosco Verticale trees (expressed first in the formulas (3) and (4) and the second in the formula (5)). The methods have different approaches and use different parameters, but both need crop evapotranspiration data (expressed in the formula (1)).
Water irrigation can be used more efficiently when an estimation of the water requirements of the plants in relation to climatic conditions and tree exposure is calculated in advance.
Computing a forecast of irrigation water needs is simple in the field of agricultural crops and turf grasses, while it is more difficult to assess for a landscape area (urban green, park, garden), where there are different microclimatic conditions, various plant species, and different vegetation densities.
In agriculture, the water requirements of crops are estimated through the following equations (Allen, 2008):
Formula 1
ETc = Kc x ETo
ETc = Crop evapotranspiration [mm]
Kc = Crop coefficient
ETo = Reference evapotranspiration [mm]
The formula states that the water loss from a crop (i.e. Crop evapotranspiration ETc) equals the amount of water that evaporates from a cool season grass growing in optimal and open-field conditions (Reference evapotranspiration ETo), multiplied by a factor determined for the crop (Crop coefficient Kc) (Figure 5.2). The reference evapotranspiration is normally estimated from an evaporation pan or from a specialized weather station (the values of Reference evapotranspirationETo are available in scientific literature).
The Crop coefficient (Kc) is determined from field research. Normally, crop water loss is less than the reference evapotranspiration and, therefore, the Crop coefficient (Kc) is less than 1.0. Moreover, the crop coefficient varies with the change of the phenological stage of the crop.
When the daily or monthly reference evapotranspiration (ETo) values and
the Crop coefficient (Kc) value of the crop – in a specific phenological stage – are known, it is possible to estimate the amount of water loss of the crop (Crop evapotranspiration-ETc).
Reference evapotranspiration (ETo) and Crop evapotranspiration (ETc) values are normally given in millimeters of water loss.
At the same time, when the water capacity of the soil (or of substrate) is known, it is possible to determine the number of days for which the water reserve of the soil will be enough to sustain crop growth.
The watering time can be calculated as follows:
Formula 2
W = Etc – R – SW
W = Needed water [mm]
ETc = Crop evapotranspiration [mm]
R = Rain [mm]
SW = Amount of water in soil [mm]
When the soil is saturated, the needed water value (W) is negative. As the crop uses water (i.e. the crop evapotranspiration Etc), the amount of water in the soil (SW) decreases, while the needed water (W) value approaches zero. When the needed water W value is close to zero (or it is positive), it is watering time. The equation above also considers the supply of water from rain.
By determining the hydrological properties of the soil, it is possible to define the right amount of water for irrigation. There are different types
of soils, each with specific physical, chemical and biological properties. Water retention is a physical property that is influenced by several factors: particle size, bulk density, aggregate stability, and size distribution. Soil holds water that may be withdrawn by plants; this water amount varies from soil to soil.
In agronomic applications, it is possible to quantify the amount of soil water that can be used by crops.
Water is retained by soil at different levels of “water potential,” which is the work required to remove a unit quantity of water retained by the system. In agronomy, water potential is expressed as pF. In a saturated soil, there is a maximum water capacity, but in this stage, part of the water is not available for plants because it is free to drain away (the water potential is therefore equal to zero, pF=0).
After the excess gravitational water has drained, the stage called “field capacity” is reached (pF=2.5). It is at this stage that crops are able to use the water held in soil. The last stage is the “permanent wilting point” (pF=4.2), defined as the lower limit of available water retained by soil. In this situation, plants are not able to use the water in soil, because this water amount is strongly retained by soil particles.
The difference between water content at field capacity and water content at permanent wilting point is defined as “available water.” This is the amount of water that must be supplied with irrigation, when needed.
The available water amount is different for the various types of soil. A sandy soil has less available water than a clay soil, an organic soil retains more water than a mineral one, a structured soil has a better water retention than a compacted one, and so on. Therefore it is necessary to know the hydrological properties of the soil (Valagussa, 2011).
The first proposed procedure for estimating the irrigation water needs of the Bosco Verticale trees uses climatic data for container-grown tree management ( Table 5.1).
The method is composed of five steps, and the various factors related to tree water loss are used to determine irrigation frequency (De Gaetano, 2000).
These factors can be summarized as follows:
• Crown projection of tree (CP): Describes the size of the tree; the value can be computed by multiplying the square of the diameter of the crown by a coefficient=0.785
• Leaf area index (LAI): A dimensionless quantity that characterizes plant canopies and can be determined directly or indirectly (measuring canopy geometry or light extinction); LAI of deciduous trees in urban settings typically varies from 2 to 8, and an LAI of 3 may be used for trees with crown diameters <2 meters
• A set of historical daily evaporation rates (reference
Method to Estimate the Water Needs of Container Trees
July 2014 - European Beech Class 2 - Exposure to East
ETo: Reference Evapotranspiration
CP: Crown Projection Landscape Coefficient
LAI: Leaf Area Index
Table 5.1
Method to estimate the water needs of container trees
evapotranspiration ETo) for the site of interest
• Pan factor (PF): a coefficient for correcting the reference evapotranspitation value (PF=from 0.2 to 0.5)
• Available soil volume (S)
• Available water-holding capacity of substrate (WHC) (correlated to physical properties of the
growing media) and the daily available water (W) in the plant container
• Soil moisture deficit adjustment factor (DF), as transpiration decreases in response to moisture stress
• Effective daily rainfall (Re) on the surface container, considering that the first 2.54 mm of rainfall is trapped by the canopy
The daily water loss (W) is computed using the following equation:
Formula 3
W loss (m3) = CP x LAI x ETo x PF x DF
CP = Crown projection [m2]
LAI = Leaf area index
ETo = Reference evapotranspiration [m]
PF = Pan factor
DF = Soil moisture deficit adjustment factor
Applying formula (3), the value of average daily water consumption for the month of July for European beech and Persian ironwood on Bosco Verticale would be 0.03 - 0.05 m3 per day (30 - 50 liters per day), assuming:
CP = 3.4 m2
LAI = 4
Eto = 0.006 m
PF = from 0.5 to 0.7
DF = from 0.8 to 1.0
This method indicates that the water autonomy of European beech and Persian ironwood may vary from four to eight days (related to different PF and DF values, considering different exposures and the altitude of trees).
The second proposed procedure for calculating the irrigation water need of the Bosco Verticale ( Table 5.2) trees uses the “standard formulas” ((1) and (2)) implemented with the WUCOLS method for estimating the irrigation water needs of landscape plantings (Costello, 2014).
Method to Estimate the Water Needs of Landscape Plantings
This method introduces the concept of “landscape evapotranspiration” and “landscape coefficient.”
For “landscape evapotranspiration” the reference evapotranspiration is used, as follows:
Formula 4
ETL = KL x ETo
ETL = Landscape evapotranspiration [mm]
KL = Landscape coefficient
ETo = Reference evapotranspiration [mm]
This formula states that the water needs of a landscape planting are calculated by multiplying the landscape coefficient (KL) by the reference evapotranspiration (ETo).
It is necessary to define the Landscape coefficient (KL), which replaces the Crop coefficient (Kc) from formula (1).
The landscape coefficient (KL) has the same function as the crop coefficient (Kc), but is not determined in the same way. Landscape coefficient (Kc) is calculated from three factors: species, density, and microclimate.
These four factors are applied in the landscape coefficient formula (5) as follows:
Formula 5
KL = Ks x Kd x Kmc
KL = Landscape coefficient
Ks = Species factor
Kd = Density factor
Kmc = Microclimate factor
The species factor (Ks) is used to quantify the water needs of different species. In established landscapes, certain species require relatively large amounts of water to maintain health and appearance, while others are known to need very little water (Figure 5.3).
“It may be assumed that the median time for pruning one tree on the balcony of the project is five times higher than the required time to prune a tree with the same characteristics located on the ground level.”
Table 5.2
The species factor (Ks) ranges from 0.1 to 0.9 and is divided into four categories:
• very low < 0.1
• low 0.1-0.3
• moderate 0.4-0.6
• high 0.7-0.9
According to the Water Use Classification of Landscape Species (WUCOLS IV), European beech has a moderate water need (Ks=0.5) (higher in warm climates), while Holly oak has a low water need (Ks=0.2) (Costello, 2014).
If in an area there is only one species, or there are species with similar water needs, an appropriate species factor (Ks) may be chosen. Otherwise, if the species have different water needs, then the species in the highest water need category determines the “Ks” value. Unfortunately, this means that species in the moderate and low categories will receive more water than needed, which may result in damage.
The value of the Density factor (Kd) ranges between 0.5 and 1.3:
• low 0.5-0.9
• average 1.0
• high 1.1-1.3
“Vegetation density” refers to the collective leaf area of all plants in the landscape. Differences in vegetation density, or in leaf area, lead to differences in water loss. The Density factor coefficient (Kd) can be difficult to determine. Canopy cover and vegetation tiers may provide some guidance in assessing vegetation density.
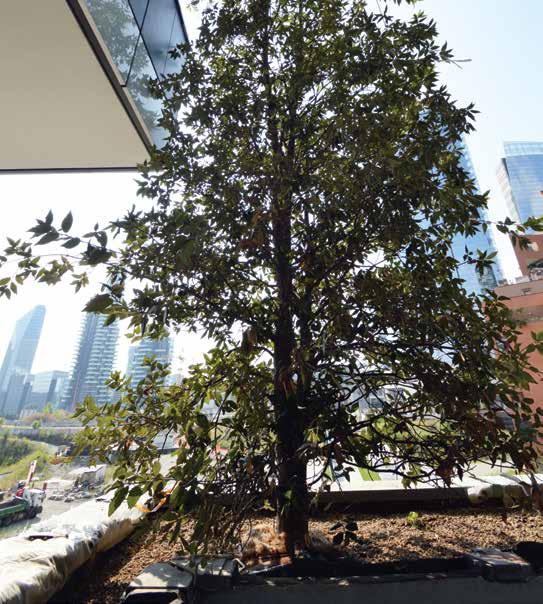
“Canopy cover” is defined as the percentage of ground surface within a planting shaded by the plant canopy. Most mature landscape plantings have a complete canopy cover, while for new plantings the canopy cover is generally less than 100%. Usually, for plantings of trees, a canopy cover of 70% to 100% is considered a complete canopy cover and the density factor value (Kd) is in the average category (Ks=1.0). A tree planting with less than 70% canopy cover is considered to be in the low category. For shrubs and ground cover, 90% of canopy
cover is at the limit below which there is a low density factor (Kd).
Vegetation tiers depend on the different growth forms of each plant (vertical dimension). Usually the amount of water loss increases with the amount of vegetation. However, plantings with multiple tiers, which do not have a complete canopy cover, may not constitute a high-density condition. A new planting with trees, shrubs, and groundcover has three vegetation tiers, but its canopy density is low, so this planting would be classified as “low density.”
The Microclimate factor (Kmc) ranges from 0.5 to 1.4, and is classified into three categories:
• low 0.5-0.9
• average 1.0
• high 1.1-1.4
The common features of urban landscapes (such as buildings and paving) influence temperature, wind speed, light intensity, and humidity of the environment. These features vary considerably among landscapes, causing differences in microclimates.
An “average microclimate condition” occurs when the area is not substantially affected by nearby buildings, structures, pavements, slopes, or reflective surfaces. Instead, plantings that are shaded for a substantial part of the day or are protected from winds will have a low microclimate factor value (Kmc). Plantings surrounded by heatabsorbing surfaces, reflective surfaces, or exposed to particularly windy conditions will have high microclimate factor (Kmc) values.
The landscape coefficient and reference evapotranspiration values help to estimate the landscape water loss (landscape evapotranspiration ETL), with the aim of achieving a good level of irrigation efficiency. Obviously, this model requires some field experience to be usable.
The landscape coefficient method (formula 4) gives estimates (not exact values) of water needs and adjustments to irrigation amounts that may be needed in the field.
The landscape evapotranspiration may be calculated to produce an estimate of the water needs for individual plants (as is the case with Bosco Verticale). The species factor (Ks) is known for each kind of plant. The Density factor (Kd) will be equal to 1.0 for trees with a height less than 5 meters, while for larger trees it will be 1.1 to 1.2 meters and related to the increase of canopy cover. The microclimate factor (Kmc) depends on the implantation site.
Although this method is not specifically developed for plant containers, the research team believes that it can be used in the situation of the Bosco Verticale for testing purposes, and to make appropriate adjustments for the specific conditions, as the trees are not on the ground, but the containers are quite large.
Through the application of this approach, reliable estimates of water needs are obtained, and an irrigation management program based on these calculations is more highly recommended than an irrigation management program that provides automated daily irrigations with predetermined amounts of water.
Below is an example of the WUCOLS evaluation method applied to the European beech on Bosco Verticale.
The European beech has a moderateto-high water need, i.e. species factor (Ks=0.6), while its density factor is a high value (Kd=1.3), considering the high canopy cover related to the site of implantation.
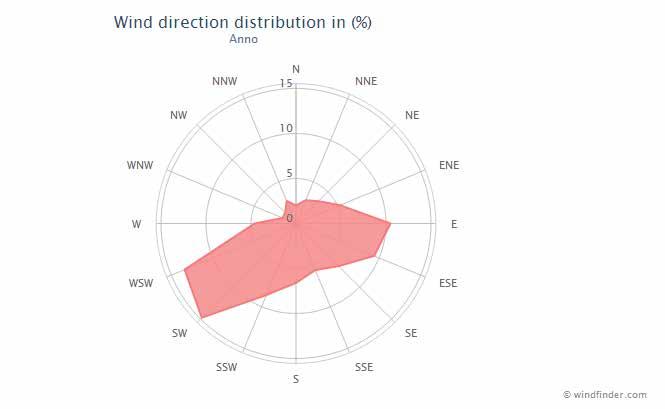
Regarding the microclimate factor (Kmc) it is necessary to make some distinctions. The selected tower has been divided into three different classes for the height; class 1 (lower floors), class 2 (middle floors) and class 3 (higher floors). The tested European beeches are present in class 1 and class 2. The tested trees are located both on north and east sides in class 1, while they are only on the east side in class 2. In this simulation, European beech and Persian ironwood may be considered together, since they have similar water needs. Monitoring Persian ironwood provides a basis for assessing class 3.
In addition to the sunshine and building factors, the wind also must be taken into account. Figure 5.4 represents the prevailing wind direction in Milan, which is from the southwest. From the northwest, south, and southeast, there are a smaller number of wind events.
Monitoring visits were carried out during strong winds, so it has been possible to verify the different wind situations at various levels of the tower (Figure 5.5).
Considering exposure, wind direction and general adverse planting conditions, it is possible to assume different microclimatic factor (Kmc) experimental values for European beech and Persian ironwood and to calculate the landscape coefficient (KL), as follows:
Trees in class 1 north exposure
KL = 0.6(Ks) x 1.3(Kd) x 1.0(Kmc) = 0.78
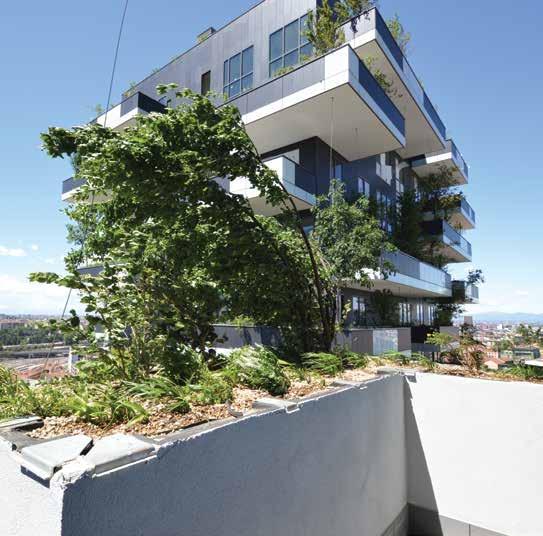
“Reliable estimates of water needs are obtained and an irrigation management program based on these calculations is more highly recommended than an irrigation management program providing automated daily irrigations with predetermined amounts of water.”
Trees in class 1 south exposure
KL = 0.6 (Ks) x 1.3 (Kd) x 1.2 (Kmc) = 0.94
Trees in class 2 north exposure
KL = 0.6 (Ks) x 1.3 (Kd) x 1.1 (Kmc) = 0.86
Trees in class 2 south exposure
KL = 0.6 (Ks) x 1.3 (Kd) x 1.3 (Kmc) = 1.01
Trees in class 3 north exposure
KL = 0.6 (Ks) x 1.3 (Kd) x 1.2 (Kmc) = 0.94
Trees in class 3 south exposure
KL = 0.6 (Ks) x 1.3 (Kd) x 1.4 (Kmc) = 1.09
Reference evapotranspiration values (ETo) are shown in Table 5.3
After the landscape coefficient (KL) is calculated, it is possible to implement equation (3) and estimate the water
consumption during the year for the different hypothetical situations.
For example, a value of the average daily water consumption in the month of July for European beech and Persian ironwood species is estimated below as reference evapotranspiration ETo. The maximum value is presented in Table 5.3
Trees in class 1 north exposure
ETL = 5.44 mm per day
Trees in class 1 south exposure
ETL = 6.56 mm per day
Trees in class 2 north exposure
ETL = 6.00 mm per day
Trees in class 2 south exposure
ETL = 7.05 mm per day
Trees in class 3 north exposure
ETL = 6.56 mm per day
Trees in class 3 south exposure
ETL = 7.61 mm per day
To define the watering time, it is necessary to estimate the available water for plants contained in the growing media. Considering the substrate physical properties, the available water should comprise at least 10% of the volume of the container. Estimating, then, a total volume in the containers for each tree as being about 2.4 cubic meters (considering a depth of 1 meter with a drainage layer of at least 20 cm and a surface of about 3 square meters) at the field capacity condition, it is possible to estimate that each tree has about 240 liters of available water (80 mm per square meter) in each plant container.
With such data, the daily amount of water loss would be from 16 to 23 liters. So, starting with the humidity of the substrate at the field capacity, the trees would be able to subsist 10 to 15 days before a new irrigation.
The WUCOLS method has been applied to plants in the ground. Applying this method to the Bosco Verticale means considering that the portion of soil available to roots is smaller and limited compared to a natural ground condition. It has been calculated that the application of an “adjustment factor” equal to 2.0 provides plausible values of irrigation water need for the different species, in line with method 1. Therefore, the daily amount of water loss would be from 32 to 46 liters, and the trees would be able to subsist for a maximum of 5 to 7 days before a new irrigation.
The method can be suitably used for estimating the irrigation water need of trees in plant containers on a tower. It
would be appropriate to verify in the field, with real water consumption data, the accuracy of the adjustment factor hypothesized through the calculations of this research.
The method to estimate water needs of container-based trees (formula 3) uses traditional factors for its irrigation calculations: vegetation density (CP = Canopy Cover and LAI = Leaf Area Index), reference evapotranspiration (ETo and the PF correcting coefficient), available substrate volume (S) and available Water Holding Capacity (WHC), in addition to a soil moisture deficit adjustment factor (DF).
The method for estimating the water need for landscape plantings (formulas 4 and 5), developed to be applied to trees on the ground, introduces three important factors that must be considered in implementing a reliable system of watering management in a tower. Once defined, the three factors for each tree – species (Ks), vegetation density (Kd), and microclimate conditions (Kmc) – are used, together with the Reference evapotranspiration value (ETo), to calculate the landscape evapotranspiration (formula 4).
The reference evapotranspiration (ETo) value can be estimated from historical data (as in the previous example), but it would be better to obtain daily data, which can be provided by weather stations located in the area of interest.
For the final landscape evapotranspiration data (ETL), comparing the calculations of both
EUROPEAN BEECH - JULY
Needed water = ≈1,55 m 3
Needed water = ≈1,40 m 3 + 7,5 % + 20%
Needed water = ≈1,30 m 3
5.6
Needed water of a European beech, located on the Bosco Verticale, in the typical month of July
methods, an additional corrective coefficient (2.0) seems to be appropriate, considering that the Bosco Verticale trees live in containers on a tower and not on the ground.
By knowing the daily water loss (ETL) and the amount of available water in the substrate (water retention), it is also possible to calculate the right watering duration for each tree.
From the application of both methods to tree specimens located at different heights on Bosco Verticale, it has been calculated that during the warmer season the needed water of the trees vary between 1.3 and 1.55 m3/ month according to their position and height: the higher the tree is placed,
the greater the water need, so as to counter the effect of the increased evapotranspiration caused by exposure to stronger atmospheric agents, such as wind and sunlight (Figure 5.6).
It would be useful to compare the real irrigation data of Bosco Verticale with the values of both applied procedures in order to correctly adjust the formulas.
The research conducted on the Bosco Verticale towers, from July 2013 to June 2014, with a suspension during the winter season, produced the following results:
• The taller species of trees were monitored to check the overall health status of these plants and their capacity to adapt to the conditions of a tower in a metropolis.
• Several measurements were performed on the 27 selected trees, including field and laboratory tests, in order to obtain comparative data for the first two years of planting.
• The success of plantings and the measurement of the trees’ size showed good and regular growth activity (Figure 6.1).
• The nutrition assessment was conducted through measurement of leaf chlorophyll content and leaf nutrient content. It was possible to verify good levels of nutrition for the selected trees (although there were some differences between species, height classes, orientations, and seasons) and, as a whole, a greater root activity and the mineralization of organic matter of the substrate, which are positive indicators of the proper functioning of the living green system.
• The effects of environmental stressors on the selected trees were assessed through the measurements of chlorophyll fluorescence and leaf heavymetal content.
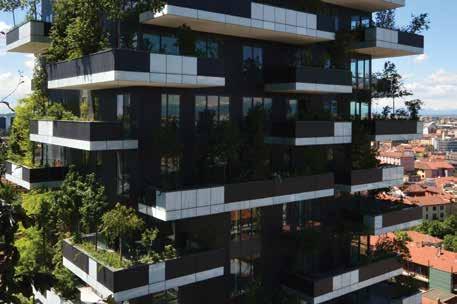
• Both tests demonstrated that any environmental stressor, determined by urban pollution or exposure to harsh sunlight and high wind (such as may surround a tower in an urban environment), generated negative effects on selected trees.
• The assessment of the tree maintenance was conducted with limited available information. Given that this research was carried out during the construction of the towers (Figure 6.2), and that the maintenance was not yet routinely undertaken, the study mainly concerned the calculation of needed water of the Bosco Verticale’s trees.
• Two methods for calculating the needed irrigation water were applied. Both procedures provided an average daily value of needed water, during the warmer season, equal to approximately 1.4 cubic meters for each tree, with 20% increased water requirement for the trees installed on the top floors, compared to trees installed on the lower floors of the tower.
• Additional knowledge about maintenance, such as the type/ frequency of pruning and the accessibility of plant containers, was provided according to information acquired from the professionals involved in the project. Nevertheless, these data are approximate, and were not independently verified after their acquisition at the outset of the project.
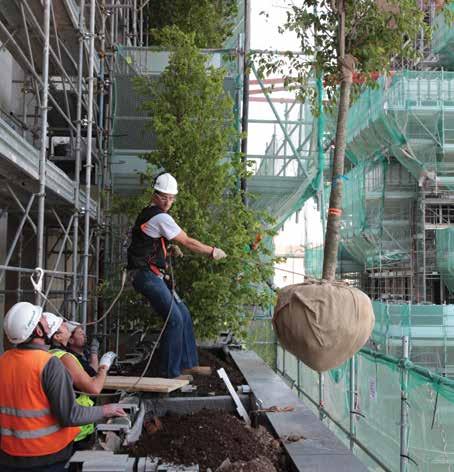
• An evaluation of the energy performance of the Bosco Verticale envelope was performed through the building energy simulation software EnergyPlus.
• The analysis was developed on a reference floor, modeling three different configurations of façade (the actual configuration, the unadorned building with terraces and without trees, and the unadorned building without terraces and without trees), for isolating the contribution provided solely by vegetation and solely by cantilevered terraces.
• The output data (solar heat gains recorded on the reference floor in winter and in summer; space heating/cooling (sensible) energy needs; hourly solar heat
gain entering the reference floor space, and cooling capacity needed to keep indoor conditions comfortable on a summer design day) provided useful results for analyzing the yearly energy performance of the Bosco Verticale envelope.
• In the final analyses, the calculation of the yearly energy consumption for space heating and cooling the reference floor, considering seasonal values of the Coefficient of Performance (SCOP) of the heat pump and of the Energy Efficiency Ratio (SEER) of the chiller, highlights that the presence of terraces and vegetation decreases the yearly electricity consumption by about 7.5% (12.7 kWh/(m2/y)) with respect to the unadorned building (13.7 kWh/(m2/y)).
• It’s important to underline that an optical description of the vegetation, needed to calculate the shadows generated by the trees, was provided starting from on-site measurements of Leaf Area Indexes of Bosco Verticale’s standard trees.
• Lastly, a description of technologies deployed on the project was given, on the basis of direct observations and information supplied by designers and professionals involved in the Bosco Verticale realization.
• This research provides a description of: the loadbearing structure; the planting restraint safety system; and the envelope; more precisely, the external walls and the terraces’ stratigraphy, the plant containers’ stratigraphy, some characteristics of the vegetation and landscape project, and the trees’ precultivation method.
• The calculation methodologies applied and developed for this research, regarding water consumption of trees installed on a tower and the energy performance of the living green envelope, represent a significant result of the work, since they are valid and applicable to other contexts, other applications, and other technologies.
Introduction
This section provides an inventory of all of the trees sampled for the Bosco Verticale research study. On page 77, a chart indicates the location of each tree diagram, including its scientific and common names, its floor, and its orientation.
The tree numbering system works as follows: QI.01.V01
The first two characters represent the scientific name of the tree species, e.g., Quercus ilex = QI.
The second two characters indicate the floor number where the tree is located.
The third set of characters indicates the number assigned to the terrace,
provided by the architect during research.
For each tree listing, there are several parameters tested.
Tree Size: The dimensions, including trunk diameter, trunk circumference, height, and crown graft height.
Crown Graft Height: The height on the trunk where the scion of one plant is inserted into the trunk of another.
SPAD: The Soil and Plant Analyzer Development (SPAD) tool measures the level of chlorophyll in the leaf. As there is a close correlation between the level of chlorophyll (the SPAD reading) and the nitrogen content in the leaf, this is a key leading indicator of the plant’s health.
Fv/Fm: This is a ratio measuring the chlorophyll fluorescence of a leaf. “Fm” is defined as “maximum fluorescence” and “Fv” is defined as “variable fluorescence”. It is the ratio of light re-emitted after being absorbed by the chlorophyll molecules of the leaves. That light which is not re-emitted is converted to chemical energy that enables photosynthesis. Thus Fv/Fm is a measurement of the plant’s “energy efficiency.”
LAI: Leaf Area Index: is a dimensionless quantity that characterizes plant canopies. It is defined as the amount of green leaf coverage per one side of the leaf, per unit of ground surface area.
Transmittance: The fraction of incident light at a specified wavelength that passes through the leaf specimen.
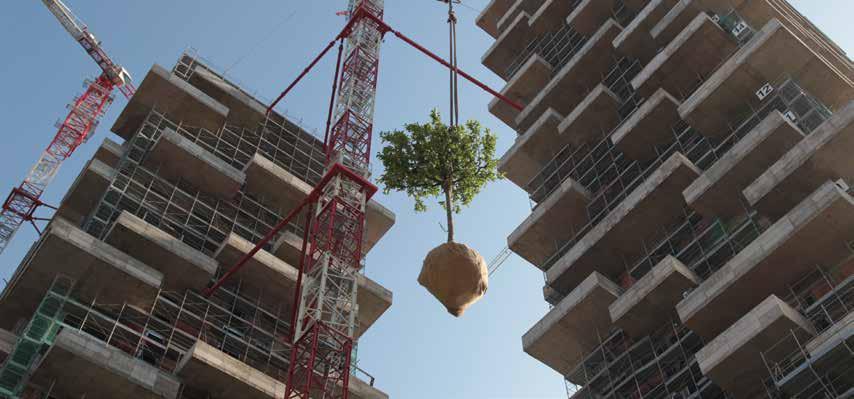
Quercus ilex
Holly oak 2nd floor
West orientation Tree number 1
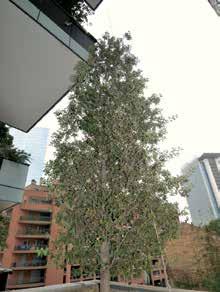
FG.02.V01
Fagus sylvatica European beech 2nd floor
North orientation Tree number 2
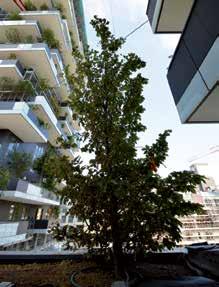
Fagus sylvatica
European beech
2nd floor
North orientation
Tree number 3
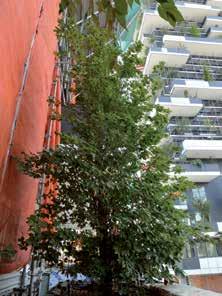
Prunus subhirtella
Higan cherry
2nd floor
North orientation
Tree number 4
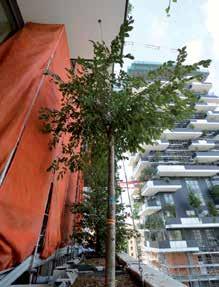
Fagus sylvatica
European beech
2nd floor
East orientation
Tree number 5
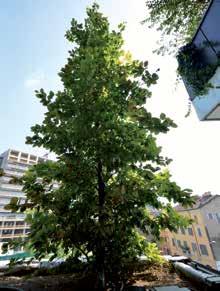
QI.02.V09
Quercus ilex
Holly oak 2nd floor
South orientation
Tree number 6
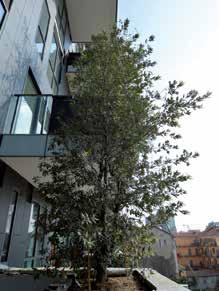
Prunus subhirtella autumnalis
Higan cherry
3rd floor
East orientation
Tree number 7
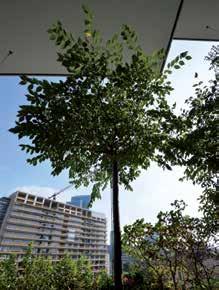
Prunus subhirtella
Higan cherry
4th floor
North orientation
Tree number 8
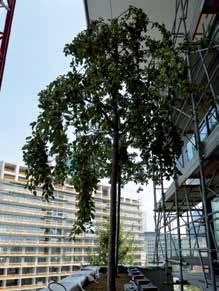
Prunus subhirtella autumnalis
Higan cherry
4th floor
East/south-east orientation
Tree number 9
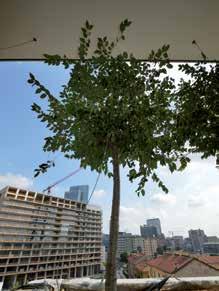
QI.04.V05
Quercus ilex
Holly oak 4th floor
South orientation
Tree number 10
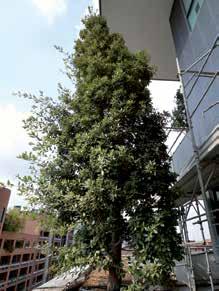
Quercus ilex
Holly oak
8th floor
West orientation
Tree number 11 DAY OF THE TEST PARAMETER 07/17/2013 09/26/2013 05/14/2014 06/19/2014 Dimensions
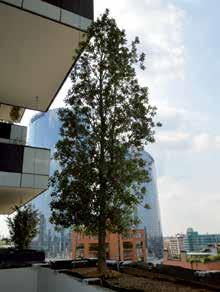
Fagus sylvatica
European beech
8th floor
East orientation
Tree number 12
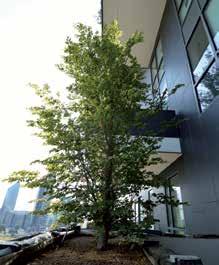
Quercus ilex
Holly oak 8th floor
South orientation Tree number 13
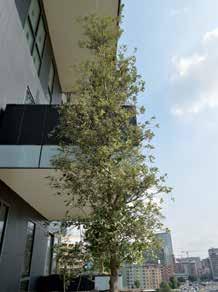
QI.08.V10
Quercus ilex
Holly oak 8th floor
South orientation Tree number 14
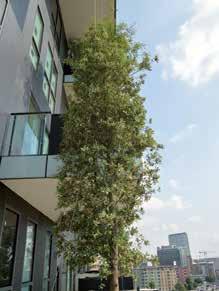
Annotation *Bifurcated trunk Soot on some of the leaves
Prunus subhirtella autumnalis
Higan cherry
10th floor
East/south-east orientation
Tree number 15
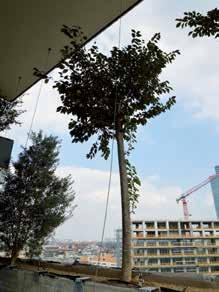
Prunus subhirtella autumnalis
Higan cherry
10th floor
South/east orientation
Tree number 16
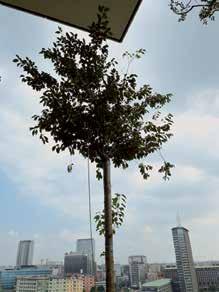
Quercus ilex
Holly oak 10th floor
South orientation Tree number 17

Parrotia persica
Persian ironwood 13th floor
North orientation Tree number 18
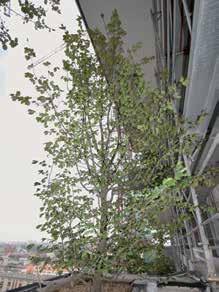
Annotation
Exellent state of health compared to the tree number 20
Quercus ilex
Holly oak 13th floor
South orientation Tree number 19
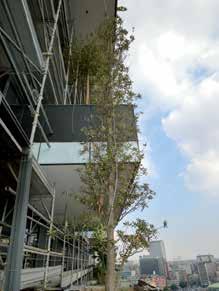
Parrotia persica
Persian ironwood 14th floor
North orientation Tree number 20
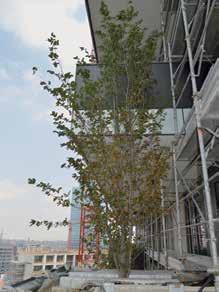
Corylus colurna
Turkish hazel
14th floor
North orientation Tree number 21
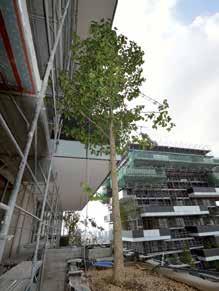
Parrotia persica
Persian ironwood 14th floor
East orientation
Tree number 22
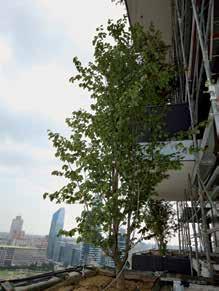
Quercus ilex
Holly oak 14th floor
South orientation Tree number 23
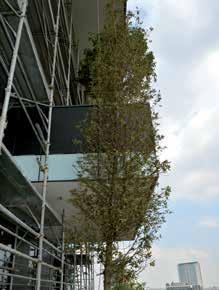
QI.14.V09
Quercus ilex
Holly oak 14th floor
South orientation Tree number 24
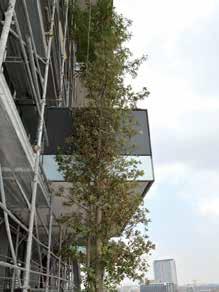
Poor health condition: no new leaves, almost essicated
Corylus colurna
Turkish hazel
15th floor
North orientation
Tree number 25
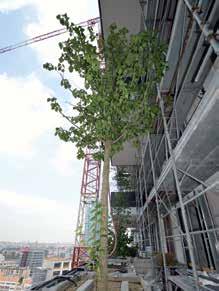
Prunus subhirtella autumnalis
Higan cherry
16th floor
East/south-east orientation
Tree number 26
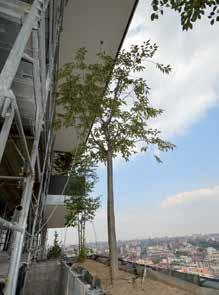
Annotation Infesting plants
Quercus ilex
Holly oak
18th floor
West orientation
Tree number 27
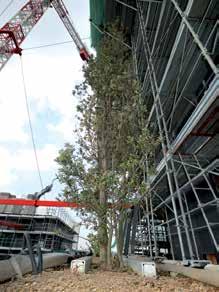
PARAMETER
Annotation
Pathogen: phylloxera
A guide to estimating irrigation water needs of landscape plantings in California – The landscape coefficient method and WUCOLS III. (2000) University of California Cooperative Extensions and California Department of Water Resources: Sacramento.
Akbari, H., et al. (1998) “Peak Power and Cooling Energy Savings of Shade Trees.” Energy and Buildings, Vol. 25, pp. 139–148.
Akbari, H., Pomerantz, M. & Taha, H. (2001) “Cool Surfaces and Shade Trees to Reduce Energy Use and Improve Air Quality in Urban Areas.” Solar Energy, Vol. 70, pp. 295–310.
Allen R.G., et al. (2008) Crop Evapotranspiration – Guidelines for Computing Crop Water Requirements. Food and Agriculture Organization of the United Nations: Rome.
Beatley, T. (2010) Biophilic Cities: Integrating Nature into Urban Design and Planning. Washington: Island Press.
Busotti, F., et al. (2012) Misurare la vitalità delle piante per mezzo della fluorescenza della clorofilla. Firenze: Firenze University Press.
Breda, N. J. J. (2013, November) “Ground-Based Measurements of Leaf Area Index: A Review of Methods, Instruments and Current Controversies.” Journal of Experimental Botany, Vol. 54, No. 392, pp. 2,403–2,417.
Canadell, J. & Vilà, M. (1992) “Variation in Tissue Element Concentrations in Quercus Ilex L. Over a Range of Different Soils.” Vegetation, No. 99–100, pp. 273–282.
Chen, J.M., & Black, T.A. (1992, May) “Defining Leaf Area Index for Non-Flat Leaves.” Plant, Cell & Environment, Vol. 4, pp. 421–429.
Cheng, C.Y., Cheung, K.K.S. & Chu, L.M. (2010) “Thermal Performance of a Vegetated Cladding System on Façade Walls.” Building and Environment, Vol. 45, pp. 1,779–1,787.
Chianucci, F. & Cutini, A. (2013) “Estimation of Canopy Properties in Deciduous Forests with Digital Hemispherical and Cover Photography.” Agricultural and Forest Meteorology, Vol. 168, pp. 130–139.
Chianucci F, et al. “Estimation of Leaf Area Index in Isolated Trees with Digital Photography and Its Application to Urban Forestry,” Urban Forestry and Urban Greening, Vol. 14, No. 2, pp. 377–382.
Clément, G. (2012) A Brief History of the Garden. Quodlibet, pp. 134.
Corp, C. (2005) Green Value: Green Buildings, Growing Assets. The Royal Institution of Chartered Surveyors: London.
Costello, L.R., & Jones, K.S. (2014) Water Use Classification of Landscape Species – WUCOLS IV. California Department of Water Resources: Sacramento.
Darlington, A. (1981) Ecology of Walls London: Heinemann Educational Books.
De Gaetano, Arthur. (2000) “Specification of Soil Volume and Irrigation Frequency for Urban Tree Containers Using Climate Data.” Journal of Arboriculture, Vol. 26, No.3.
Eichholtz, P., Kok, N. & Quiqley, J. (2010) “The Economics of Green Building.” MIT Press Journal
Flame Atomic Absorption Spectrophotometry 7000B. (2007) Environmental Protection Agency.
Fuerst, F. & McAllister, P. (2009) New Evidence on the Green Building Rent and Price Premium. Annual Meeting of the American Real Estate Society: Monterey.
Giacomello, E. (2015, January) “A New Urban Forest Rises in Milan.” CTBUH Journal, Issue 1, pp. 12–18.
Giacomello, E. (2012) Copertura a verde e risorsa idrica. Implicazioni tecnologiche e benefici per l’ambiente urbano. Milano: Franco Angeli.
Giacomello E. & Zannoni, G. (2012, April) “The Role of Green Roofs for Thermal and Hydrologic Restoration in Dense Built Environment.” in Di Giulio, D. (ed.) Improving the Quality of Suburban Building Stock: Proceedings of COST Action TU0701, UnifePress: Ferrara, Italy.
Green Living Technologies. n.d. Available from: <http://agreenroof.com/>. (7 March, 2014).
Guidelines for the Planning, Construction and Maintenance of Green Roofing (2008) Forschungsgesellschaft Landschaftsentwicklung Landschaftsbau. Bonn: FLL.
Hoyano, A. (1988) “Climatological Uses of Plants for Solar Control and Effects on the Thermal Environment of a Building.” Energy and Buildings, Vol. 11, pp. 181–199.
Irwin, G., The Green Roof Column at Greenroofs, 2008. Available from: <http://www.greenroofs.com/ content/green_walls008.htm>. (27 March, 2011).
James, P., et al. (2009) “Towards an Integrated Understanding of Green Space in the European Built Environment.” Urban Forestry and Urban Greening, Vol. 8, pp. 65–75.
Jennings, S.B., Brown, N.D. & Sheil, D. (1999) “Assessing Forest Canopies and Understorey Illumination: Canopy Closure, Canopy Cover and Other Measures.” Forestry, Vol. 72, No. 1, pp. 59–73.
Jim, C.Y. & He, H. (2011) “Estimating Heat Flux Transmission of Vertical Greenery Ecosystem.” Ecological Engineering, Vol. 37, pp. 1,112.
Jonckheere, I., et al. (2004) “Review of Methods for in Situ Leaf Area Index Determination: Part I. Theories, Sensors and Hemispherical Photography.” Agricultural and Forest Meteorology, Vol. 121, pp. 19–35.
Kontoleon, K.J. & Eumorfopoulou, E.A. (2010) “The Effect of the Orientation and Proportion of a Plant-Covered Wall Layer on the Thermal Performance of a Building Zone.” Building and Environment, Vol. 45, pp. 1,287–1,303.
Lay Ong, B. (2003) “Green Plot Ratio: An Ecological Measure for Architecture And Urban Planning.” Landscape and Urban Planning, Vol. 63, pp. 197–211.
Lazzarin, R., Castellotti, F. & Brusato, F. (2005) “Experimental Measurements and Numerical Modelling of a Green Roof.” Energy and Buildings, Vol. 37, No. 12, pp. 1,260–1,267.
LEED Reference Guide Version 4. (2013) United States Green Building Council.
Lindsey, P. and Bassuk, N. (1991) “Specifying Soil Volumes to Meet the Water Needs of Mature Urban Street Trees in Containers.” Arboricultural Journal, Vol. 17, pp. 141–149.
Liu, J. and Pattey, E. (2010) “Retrieval of Leaf Area Index from Top-OfCanopy Digital Photography Over Agricultural Crops.” Agricultural and Forest Meteorology, Vol. 150, pp. 1,785–1,490.
Maisto, G., et al. (2013) “Ranges of Nutrient Concentrations in Quercus Ilex Leaves at Natural and Urban Sites.” Journal of Plant Nutrition and Soil Sciences, Vol. 176 pp. 801–808.
Mazzali, U., et al. (2013) “Experimental Investigation on the Energy Performance of Living Walls in a Temperate Climate.” Building and Environment, Vol. 64, pp. 57–66.
Microwave Assisted Acid Digestion Of Sediments, Sludges, Soils, And Oils 3051A. (2007) Environmental Protection Agency.
Miller, N. & Spivey, J. F. (2008) “Does Green Pay Off?”. Journal of Real Estate Portfolio Management, pp. 385–399.
Mills, H. A. & Jones, J.B. (1996) Plant Analysis Handbook II: A Practical Sampling, Preparation, Analysis, and Interpretation Guide. Athens, Georgia, USA: Micro Macro Publishing, pp. 442.
Minke, G. & Witter, G. (1985) Häuser Mit Grünem Pelz. Ein Handbuch zur Hausbegrünung. Köln: Edition Fricke.
NEDLAW Living Walls, 2008. Available from: <http://www.naturaire.com/ index.php>. (28 February, 2011).
Osler, P., Wood, A., Bahrami, P. and Stephens, B. (2011). Evaluation of the Effects of Green Walls on Building Energy Consumption. WISER: Chicago.
Palomo Del Barrio, E. (1998) “Analysis of the Green Roofs Cooling Potential in Buildings.” Energy and Buildings, Vol. 27, pp. 179–193.
Peck, S., et al. (1999) Greenbacks from Green Roofs: Forging a New Industry in Canada. Canada Mortgage and Housing Corporation: Ottawa.
Pekin, B. & Macfarlane, C. (2009) “Measurement of Crown Cover and Leaf Area Index Using Digital Cover Photography and Its Application to Remote Sensing.” Remote Sensing, Vol. 1, No. 4, pp. 1,298–1,320.
Perini, K., et al. (2011) “Vertical Greening Systems and the Effect on Air Flow and Temperature on the Building Envelope.” Building and Environment, Vol. 46, pp. 2,287–2,294.
Pitts, J. & Jackson, T. O. (2008) “Green Buildings: Valuation Issues and Perspectives.” Appraisal Journal, pp. 115–118.
Reed, Richard, et al. (2009) “International Comparison of Sustainable Rating Tools.” JOSRE, Vol. 1, No. 1, pp. 10.
Renterghem, T. V., et al. (2013) “The Potential of Building Envelope Greening to Achieve Quietness.” Building and Environment, Vol. 61, pp. 34–44.
Reviplant, 2008. Available from: <http:// www.reviplant.it/>. (7 March, 2011).
Ryu, Y., et al. (2010) “On the Correct Estimation of Effective Leaf Area Index: Does It Reveal Information on Clumping Effects?” Agricultural and Forest Meteorology, Vol. 150, pp. 463–472.
Scarpa, M., Mazzali, U. & Peron, F. (2014) “Modeling the Energy Performance of Living Walls: Validation Against Field Measurements in Temperate Climate.” Energy and Buildings, Vol. 79, pp. 155–163.
Stec, W.J., van Passen, A.H.C. & Maziarz, A. (2005) “Modelling the Double Skin Façade with Plants.” Energy and Buildings, Vol. 37, pp. 419–427.
Susorova, I., et al. (2013) “A Model of External Façades for Evaluation of Wall Thermal Performance.” Building and Environment, Vol. 67, pp. 1–13.
Theodosiou, T. (2003) “Summer Period Analysis of the Performance of a Planted Roof as a Passive Cooling Technique.” Energy and Buildings, Vol. 35, pp. 909–917.
UNI 11235. (2007) Istruzioni per la progettazione, l’esecuzione, il controllo e la manutenzione di coperture a verde (Criteria for design, execution, testing and maintenance of roof garden). Ente nazionale italiano di unificazione: Milano.
Vaingsbo, P. Green Walls and Their Thermal Merits. Available from <http://www.worldwatch.org/greenwalls-and-their-environmentalmerits/>. (March, 2014).
Valagussa, M. (2011) Gli indicatori di qualità del suolo per una corretta gestione. Cermenate (Como): Arti Grafiche Maspero Fontana Press.
Valagussa, M. & Pozzi, A. (2006) Irrigare – Guida all’utilizzo della risorsa acqua. Quaderni per l’agricoltura sostenibile PSR 2000-2006 Regione Lombardia Agricoltura.
Wanphen, S. & Nagano, K. (2009) “Experimental Study of the Performance of Porous Materials to Moderate Roof Surface Temperature
By Its Evaporative Cooling Effect.” Building and Environment, Vol. 44, pp. 338–351.
Weiler, S., & Scholz-Barth, K. (2009) Green Roof System. A Guide to Planning, Design and Constructing Landscapes Over Structure. John Wiley & Sons: Hokoben.
Welles, J. M. & Norman, J. (1991) “Instrument For Indirect Measurement of Canopy Architecture.” Agronomy Journal, Vol. 83, pp. 818–825.
White, E. V. & Gatersleben, B. (2011) “Greenery on Residential Buildings: Does It Affect Preferences and Perceptions of Beauty?” Journal of Environmental Psychology, Vol. 31, pp. 89–98.
Wilmers, F. (1988) “Green For Melioration of Urban Climate.” Energy and Buildings, Vol. 11, pp. 289–299.
Wong, N. H., et al. (2010) “Thermal Evaluation of Vertical Greenery Systems For Building Walls.” Building and Environment, Vol. 45, pp. 663–672.
Wood, A., Bahrami, P. & Safarik, D. (2014). Green Walls in High-Rise Building. Chicago: Council on Tall Buildings and Urban Habitat (CTBUH) in conjunction with IIT, Tongji University, and Images Publishing.
Yu, C. & Wong N. H. (2006) “Thermal Benefits of City Parks.” Energy and Buildings, Vol. 38, pp. 105–120.
Chairman: David Malott, Kohn Pedersen Fox USA
Vice-Chairman: Timothy Johnson, NBBJ, USA
Executive Director: Antony Wood, CTBUH / Illinois Institute of Technology, USA / Tongji University, China
Secretary: Craig Gibbons, Arup, Australia
Treasurer: Steve Watts, Alinea Consulting LLP, UK
Trustee: Mounib Hammoud, Jeddah Economic Company, Saudi Arabia
Trustee: Dennis Poon, Thornton Tomasetti, USA
Trustee: Kam-Chuen (Vincent) Tse, Parsons Brinckerhoff
Hong Kong
Trustee: Joseph Chou, Taipei Financial Center Corporation, Taiwan ROC
STAFF / CONTRIBUTORS
Executive Director: Antony Wood
Associate Director: Steven Henry
Operations Manager: Patti Thurmond
China Office Director: Daniel Safarik
Research Manager: Dario Trabucco
Leader Coordinator / Events Manager: Jessica Rinkel
Membership Coordinator: Carissa Devereux
Digital Platforms Manager: Son Dang
Production Associate: Mary Carver
Media Associate: Jason Gabel
Staff Writer / Communications Coordinator: Alannah Sharry
Website Content Editor: Aric Austermann
Production Associate: Kristen Dobbins
Events Assistant: Chuck Thiel
Administrative Assistant: Bonnie Payo
Research Assistant / China Operations: Peng Du
Skyscraper Database Editor: Marshall Gerometta
Skyscraper Database Assistant: Will Miranda
Publications Associate: Tansri Muliani
General Counsel: Matt Rossetti
Special Media Correspondent: Chris Bentley
ADVISORY GROUP
Chair: Peter Weismantle, Adrian Smith + Gordon Gill Architecture, USA
Ahmad K. Abdelrazaq, Samsung Corporation, Korea
Donald Davies, Magnusson Klemencic, USA
Johannes de Jong, KONE Industrial Ltd., Finland
Jean-Claude Gerardy, ArcelorMittal, Luxembourg
Faudziah Ibrahim, KLCC, Malaysia
Abdo Kardous, Hill International, China
James Parakh, City of Toronto, Canada
Mic Patterson, Enclos, USA
Glen Pederick, Meinhardt, Australia
Robert Pratt, Tishman Speyer Properties, China
Mark P. Sarkisian, Skidmore, Owings & Merrill LLP, USA
WORKING GROUP CO-CHAIRS
BIM: Stuart Bull
Demolition: Dario Trabucco
Façade Access: Lance McMasters, Kevin Thompson & Peter Weismantle
Performance Based Seismic Design: Ron Klemencic & John Viise
Security: Sean Ahrens
Sustainable Design: Antony Wood
Tall Timber: Carsten Hein & Volker Schmid
Urban Habitat / Urban Design: James Parakh
COMMITTEE CHAIRS
Awards: Mun Summ Wong, WOHA, Singapore
Height: Peter Weismantle, Adrian Smith + Gordon Gill Architecture, USA
Young Professionals: Sasha Zeljic, Gensler, USA
REGIONAL REPRESENTATIVES
Australia: Bruce Wolfe, Conrad Gargett Architecture
Belgium: Georges Binder, Buildings & Data S.A.
Brazil: Antonio Macedo, EcoBuilding Consultoria
Cambodia: Michel Cassagnes, Archetype Group
Canada: Richard Witt, Quadrangle Architects
Costa Rica: Ronald Steinvorth, IECA International
Denmark: Julian Chen, Henning Larsen Architects
Finland: Santeri Suoranta, KONE Industrial, Ltd.
France: Trino Beltran, Bouygues Construction
Germany: Roland Bechmann, Werner Sobek Stuttgart GmbH
India: Girish Dravid, Sterling Engineering
Indonesia: Tiyok Prasetyoadi, PDW Architects
Israel: Israel David, David Engineers
Italy: Dario Trabucco, Iuav University of Venice
Lebanon: Ramy El-Khoury, Rafik El-Khoury & Partners
Malaysia: Matthew Gaal, Cox Architecture
Mongolia: Tony Mills, Archetype Group
Myanmar: Mark Petrovic, Archetype Group
Nigeria: Joe Osammar, Osmo Geotechnical Energy Serv., Ltd.
Philippines: Felino A. Palafox Jr., Palafox Associates
Poland: Ryszard M. Kowalczyk, University of Beira Interior
Qatar: Shaukat Ali, KEO International Consultants
Romania: Mihail Iancovici, Technical University of Civil Engineering of Bucharest (UTCB)
Russia: Elena A. Shuvalova, Lobby Agency
Saudi Arabia: Bassam Al-Bassam, Rayadah Investment Company, KSA
Singapore: Juneid Qureshi, Meinhardt (S) Pte Ltd.
South Korea: Dr. Kwang Ryang Chung, Dongyang Structural Engineers Co., Ltd
Spain: Iñigo Ortiz Diez de Tortosa, Ortiz Leon Arquitectos
Sri Lanka: Shiromal Fernando, Civil and Structural Engineering
Consultants (Pvt.) Ltd
Taiwan: Cathy Yang, Taipei Financial Center Corp.
Turkey: Can Karayel, Langan International
UAE: Dean McGrail, WSP Middle East
United Kingdom: Steve Watts, alinea consulting LLP
Vietnam: Phan Quang Minh, National University of Civil Engineering
SUPPORTING CONTRIBUTOR
AECOM
Beijing Fortune Lighting System Engineering Co., Ltd.
Broad Sustainable Building Co.
BuroHappold Engineering
CCDI Group
CITIC HEYE Investment CO., LTD.
Dow Corning Corporation
Emaar Properties
Illinois Institute of Technology
Jeddah Economic Company
Kingdom Real Estate Development
Kohn Pedersen Fox Associates
KONE Industrial
Lotte Engineering & Construction
National Engineering Bureau
Otis Elevator Company
Ping An Financial Centre Construction & Development
Renaissance Construction
Samsung C&T Corporation
Schindler Top Range Division
Shanghai Tower Construction & Development
Shenzhen Parkland Real Estate Development Co., Ltd.
Skidmore, Owings & Merrill
Sun Hung Kai Properties Limited
Suzhou Zhongnan Center Development
Taipei Financial Center Corp.
Turner Construction Company
Underwriters Laboratories
WSP Group
PATRON
Al Ghurair Construction - Aluminum
Arabtec Construction
Blume Foundation
BMT Fluid Mechanics
Citic Pacific
DeSimone Consulting Engineers
East China Architectural Design & Research Institute
Gensler
Guild of Ural Builders
HOK, Inc.
Hongkong Land
ISA Architecture
KLCC Property Holdings Berhad
Langan
Meinhardt Group International
NBBJ
Permasteelisa Group
Ridley Shenzhen Overseas Chinese Town
SL Green Management
Studio Libeskind
The Bund Finance Center
The Durst Organization
Thornton Tomasetti
ThyssenKrupp AG
Tishman Speyer
United Technologies Corporation
Weidlinger Associates
Wordsearch 添惠达
Zuhair Fayez Partnership
DONOR
Adrian Smith + Gordon Gill Architecture
ALT Limited
American Institute of Steel Construction
Aon Fire Protection Engineering
ARCADIS (US)
Arquitectonica International
Arup
Aurecon
BALA Engineers
Brookfield Multiplex
CBRE Group
CH2M HILL
China Architecture Design & Research Group
Enclos Corp.
Fender Katsalidis
Frasers Property
Halfen United States
Henning Larsen Architects
Hill International
Jensen Hughes
JORDAHL
Laing O’Rourke
Larsen & Toubro
Leslie E. Robertson Associates
Magnusson Klemencic Associates
MAKE
McNamara / Salvia, Inc.
Nishkian Menninger Consulting and Structural Engineers
Outokumpu
Parsons Brinckerhoff
(Continued on next page)
PDW Architects
Pei Cobb Freed & Partners
Pickard Chilton Architects
PNB Merdeka Ventures Sdn. Berhad
PT Gistama Intisemesta
Quadrangle Architects
Rowan Williams Davies & Irwin
RTKL Associates
SAMOO Architects and Engineers
Saudi Binladin Group / ABC Division
Schüco
Severud Associates Consulting Engineers
Shanghai Construction (Group) General
SHoP Architects
Shum Yip Land Company Limited
Sika Services AG
Sinar Mas Group - APP China
Solomon Cordwell Buenz
Studio Gang Architects
Syska Hennessy Group
TAV Construction
Terracon
Time Equities
Tongji Architectural Design Group
Walsh Construction Company
Walter P. Moore and Associates
Werner Voss + Partner
CONTRIBUTOR
Aedas
AkzoNobel
Alimak Hek
Alinea Consulting
Allford Hall Monaghan Morris
Altitude Façade Access Consulting
Alvine Engineering
AMSYSCO
ArcelorMittal
architectsAlliance
Architectural Design & Research Institute of Tsinghua
University
Architectus
Barker Mohandas, LLC
Bates Smart
Benoy Limited
Benson Industries Inc.
bKL Architecture
Bonacci Group
Boundary Layer Wind Tunnel Laboratory
Bouygues Construction
British Land Company
Broadway Malyan
Brunkeberg Systems
Canary Wharf Group
Canderel Management
CB Engineers
CCL
Clark Construction
Conrad Gargett
Continental Automated Buildings Association
Cosentini Associates
CS Group Construction Specialties Company
CS Structural Engineering
CTSR Properties
Cubic Architects
Dar Al-Handasah (Shair & Partners)
Davy Sukamta & Partners Structural Engineers
DCA Architects
DCI Engineers
Deerns
DIALOG
Dong Yang Structural Engineers
dwp|suters
Elenberg Fraser
EllisDon Corporation
Eversendai Engineering Qatar
FXFOWLE Architects
GGLO
Global Wind Technology Services
Glumac
gmp • von Gerkan, Marg and Partners Architects
Goettsch Partners
Grace Construction Products
Gradient Wind Engineering Inc.
Graziani + Corazza Architects
Guangzhou Design Institute
Hariri Pontarini Architects
Heller Manus Architects
Hiranandani Group
Housing and Development Board
Humphrey & Partners Architects, L.P.
Hutchinson Builders
Irwinconsult Pty.
Israeli Association of Construction and Infrastructure
Engineers
JDS Development
Jiang Architects & Engineers
JiangSu Golden Land Real Estate Development Co., Ltd
JLL
John Portman & Associates
KEO International Consultants
KHP Konig und Heunisch Planungsgesellschaft
Langdon & Seah Singapore
LeMessurier
Lend Lease
Lusail Real Estate Development Company
M Moser Associates
Maeda Corporation
Mori Building Company
Nabih Youssef & Associates
National Fire Protection Association
National Institute of Standards and Technology
Nikken Sekkei
Norman Disney & Young
OMA
Omrania & Associates
Ornamental Metal Institute of New York
Pace Development Corporation
Palafox Associates
Pappageorge Haymes Partners
Pei Partnership Architects
Perkins + Will
Plus Architecture
Pomeroy Studio
Project Planning and Management Pty Ltd
PT Ciputra Property
Rafik El-Khoury & Partners
Ramboll
RAW Design
Read Jones Christoffersen
Related Midwest
RMC International
Ronald Lu & Partners
Royal HaskoningDHV
Sanni, Ojo & Partners
Schöck United States
Sematic S.r.l.
Shanghai Jiankun Information Technology Co., Ltd.
Shimizu Corporation
Silvercup Studios
SilverEdge Systems Software
Silverstein Properties
SIP Project Managers
Soyak Construction and Trading Co.
Steel Institute of New York
Stein Ltd.
SuperTEC (Super-Tall Building Design & Engineering Tech
Research Center)
Surface Design
SWA Group
Takenaka Corporation
Tekla Corporation
Terrell Group
TFP Farrells
The Harman Group
TMG Partners
TSNIIEP for Residential and Public Buildings
Uniestate
University of Illinois at Urbana-Champaign
UrbanToronto
Vetrocare
Werner Sobek Group
Wilkinson Eyre Architects
WOHA Architects
Woods Bagot
WTM Engineers International
WZMH Architects
Y. A. Yashar Architects
YKK AP Façade
PARTICIPANTS
There are an additional 251 members of the Council at the Participant level. Please see online for the full member list. http://members.ctbuh.org
Cities are facing unprecedented expansion through population growth and urbanization in the coming decades, and the horizontal-suburban model of urban development is increasingly being discredited on sustainability grounds. With less available land to build on, the logical solution is to build upwards. However, a major human need – access to greenery – must be addressed by any viable plan for increased height and density.
The Bosco Verticale in Milan, Italy – whose name literally means “Vertical Forest” –is a stunning example of the potential of deploying substantial greenery at height. The building was chosen as the subject of a one-year research study, funded by Arup via the CTBUH International Seed Funding Program, because of the extensiveness of its implementation. Some 13,000 individual plants from 90 species cover its many balconies, forming a “second skin” that provides valuable shade and privacy, and makes a statement about the viability of “green” architecture in tall buildings in an unprecedented fashion.
This Research Report chronicles the project in five main chapters and includes dozens of detailed photos, drawings, and diagrams explaining the general urban plan, design concept, and specifics of the implementation of several different kinds of restraining and securing systems for the trees, as well as the process for evaluating the health and effectiveness of the plants as part of the building envelope. An appendix contains an inventory of the study results for each tree included in the survey.
This CTBUH Research Report is intended to further the body of research on the design and operation of tall buildings, with a specific interest in greening the environment, both at the building and the urban scale. The CTBUH Research Report series chronicles the research projects undertaken directly by CTBUH or funded through its initiatives. Each examines strategies for improving the performance of tall buildings, including reducing their environmental impact, while taking the industry closer to an appreciation of the myriad factors that constitute sustainability in the context of tall.