
From Click to Car Sale:


Much of today’s dealership marketing is built around generating leads not necessarily connecting with people. But leads are just data points, often disconnected from the real shoppers behind them. As a result, many dealerships are making advertising and spend decisions based on a narrow view of performance and missing critical opportunities to influence buyers earlier in the journey. It’s not that their data is wrong it’s just incomplete. For example, data provided to Autotrader by Clarivoy, a marketing analytics company for automotive retail, show how often sales assists are missing from CRMs:
In 2024...
car sales happened without a lead conversion.
No call.
No form. No chat. Just a sale.
In 2024, in a sample set of 875,000 shoppers, Autotrader assisted in 413,000 sales. Of those, only 8% were traceable in CRM. That means the other 92% about 380,000 sales were to people who never submitted an inquiry (such as phone calls, chats, form and tool submissions, and other contacts that result in a lead)1
It isn't just Autotrader. Other data collected by Clarivoy more clearly highlights the degree to which dealerships may fail to understand all the forces driving their sales: out of a larger data set of 1.18 million sales tracked by Clarivoy last year, over a third of them occurred without a lead conversion.2
That’s a problem because, while many dealers still evaluate marketing success based only on lead volume, many buyers don’t convert into leads.
Even when they do, relying too heavily on a single piece of information such as asking the customer how they found your dealership or only looking at form submissions doesn't offer visibility into the other touchpoints that influenced customer decision-making, creating a huge blind spot for dealers. How do you meet customers where they are if you don’t know where they’re coming from? And how can you invest in the most effective advertising channels
1 Sample set of data sourced from Autotrader clients that opted to share their data back with Autotrader via Clarivoy.
2 This data set, containing over 1.18 million sales, forms the basis for all multi-touch attribution insights presented in this white paper. Insights were developed using Clarivoy’s platform and proprietary analysis of this data set. For more information on the Clarivoy data, see the "Sources" section at the end of this white paper.

if you don’t know what customers are looking at? More nuanced lead generation and attribution methods offer a fuller picture of which channels actually drive results and help dealers prioritize their advertising investments even when shoppers remain anonymous.
Fortunately, the increased role of online shopping and research in the car buyer’s journey has created a wealth of data that can benefit dealerships that adopt a modern, data-driven approach to marketing measurement.
Today’s car shoppers engage with multiple marketing channels from marketplace listings and paid search to video and social media before ever contacting a dealership. Without visibility into the details of the customer journey, dealerships risk missing key sales opportunities and misallocating their advertising budget. A process called multi-touch attribution (MTA) can show dealers which channels are driving sales, whether or not those channels generate formal leads.
If you can’t see the full buyer journey, you’re missing sales— and wasting budget. Because most buyers don’t convert on the first click.
Though the car buyer journey is more complex than it used to be, many dealers still track only the last channel a customer engaged with (such as the dealer’s TV ad) as the lead source. That approach typically called “last-touch attribution” assumes that the last channel the customer interacted with caused the sale. While simple, this approach overlooks the rest of the customer journey, where dozens of earlier touchpoints may have played a more influential role.
To illustrate this point, imagine a customer who’s planning to buy a new car but hasn’t decided on anything yet:
On the way home from work, they see someone driving a new model of car that catches their interest. They go online to do some research and compare prices. They like what they see but haven’t made a decision. Targeted social media ads keep the car top of mind. They watch a YouTube review of the car and keep mulling it over. A few days later, they see a Facebook ad promoting the car at a local dealership and decide to go check it out in person.
In this example, measuring only the last touchpoint (for instance, asking “what brought you in today?” or “how did you hear about us/this car?”) would indicate the Facebook ad as being responsible for the sale, ignoring earlier steps like comparison shopping on marketplaces and retargeting ads that also influenced the shopper's decision.
Multi-touch attribution addresses this concern. As the name suggests, MTA looks at all the places (“touchpoints”) where a customer engages with your advertising before making a purchase. It then gives credit (“attribution”) to each touch- point in proportion to how influential it was. Multiple models of MTA exist, allowing analysis to focus on different aspects of the buyer journey. For example, a U-shaped model prioritizes first and last touches, giving more importance to the beginning and end of the customer journey, while linear models value all touch- points equally. It's even possible for machine learning to analyze the data and determine the appropriate values for each touchpoint.

Buyers don’t convert in one step. Multi-touch attribution shows every step that mattered.
Every campaign. Every channel. Every impression that helped drive the
This broader view helps you see where your advertising is most effective and how different marketing channels work together. It’s especially helpful for identifying early- and mid-funnel channels, like third-party marketplaces, paid social media ads, or influencer partnerships, that might get overlooked something that can happen all too easily given the length of the modern car shopping experience.
According to the Cox Car Buyer Journey study, the average car buyer spends 95 days in market, interacting with dozens of channels and tools, before making a purchase. The data reviewed in this white paper show that:
7
Hours spent by shoppers over researching online
62+
The average amount of touch- points the buyer interacts with before making a purchase
4
Distinct channels are actively being used in average during buyers shopping journey
Using MTA allows dealers to track and evaluate each step in this longer, more complex buyer’s journey. Even better, each step gets an appropriate share of the credit for the sale. This more granular picture of the customer's behavior allows dealers to understand which marketing efforts exert the most influence, enabling them to learn how customers are really finding their dealership.
In a real-life example, Clarivoy data showed that Autotrader influenced over half of all car sales that Clarivoy tracked, but less than 4% of those sales showed up as leads in dealer CRMs. A dealer relying solely on lead tracking to make advertising decisions would have no idea where many sales came from but a dealer using MTA would see the value that online channels were driving to their dealership and could invest advertising dollars accordingly.
While it may not be surprising that customers are doing more of their car shopping online, dealers may not expect how often those customer journeys begin and develop on digital channels.
48% of car shoppers start their search on a marketplace site.
In the survey conducted by Cox Automotive, 8 out of 10 shoppers reported interacting with a third-party site during their purchase journey. Nearly half (48%) said it was their first stop when starting to shop for a car, while 23% visited a search engine first, and only 14% reported a dealer website as their first stop.
Just 23% begin on search engines and only 14% start on a dealer website. These data points indicate that many customers visit a marketplace even before using search engines, let alone visiting dealer sites.
Multi-touch attribution analysis confirms that this apparent lack of information among dealers who rely solely on one-touch attribution or lead tracking isn’t just perception it’s reality. In Clarivoy’s analysis of 1.18 million sales from shoppers, last-touch attribution credited 5,156 unique sources, while multi-touch attribution (MTA) revealed 8,501. MTA nearly doubled the number of recognized touchpoints, uncovering a broader view of the customer journey and capturing contributions that would otherwise go unseen.
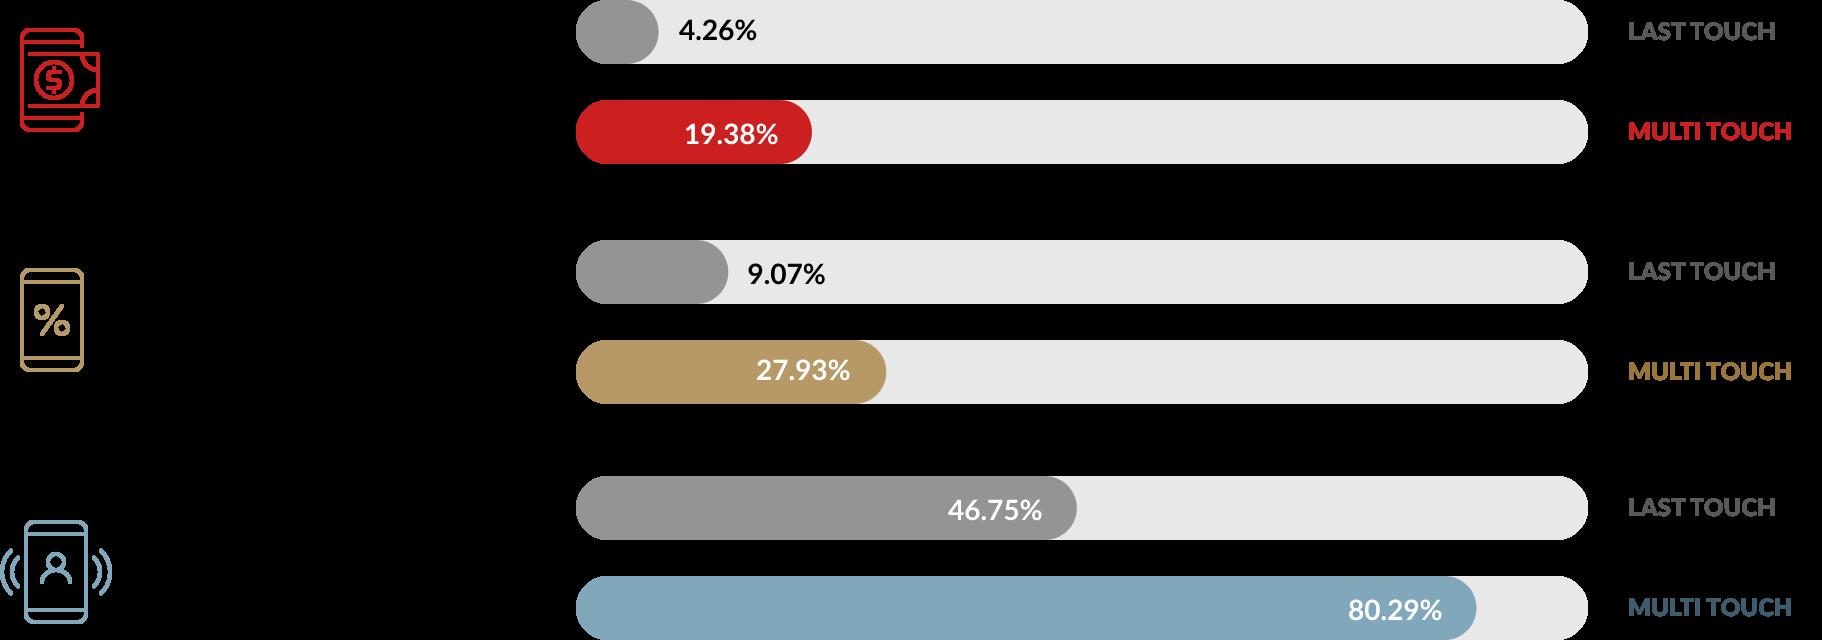
Comparing last-touch and multi-touch attribution at the channel level. Clarivoy data show that three of the biggest blind spots may be paid search, organic search, and third-party marketplaces. This chart compares how credit for sales conversions shifts between last-touch and multi-touch attribution models across these key marketing channels.
These data points reinforce that digital channels, especially marketplaces, consistently play a meaningful role in most customer journeys. That trend holds when we look at what the data reveals about specific sources, such as Autotrader. When customers see a listing on Autotrader early in the journey, but fill out a lead form somewhere else later, the marketplace gets left out of the picture entirely.
Autotrader influenced 55% of sales under MTA, compared to just 21%with onetouch tracking.
Autotrader is just one example of how MTA surfaces hidden impact.
When measured this way, Autotrader appears to be involved in just 21% of total sales but multi-touch attribution tells a fuller story. By crediting every relevant interaction in the journey, MTA reveals that Autotrader actually influenced 55% of sales in the Clarivoy data-set more than 2.5x as many as indicated by one-touch measurements.
[source: Clarivoy (Autotrader Influenced Sales (MTA): 648,784 (54.9% of 1,181,705)].
And that’s only the measurable influence. When you look closer at complex shopper behavior, the impact grows. Of the 701,646 sales journeys in Clarivoy's dataset that included a touch to Autotrader or Kelley Blue Book in 2024, a notable 46% included a follow- up visit to a dealer website, even when there was no direct click-through from the marketplace. These visits likely came through search, direct URL, or retargeting important parts of the buyer journey that often don’t show up in standard tracking.
As you can see, online channels are an integral part of the customer journey. Much of their importance is due to the role marketplaces and other digital channels play in shaping customer decisions and driving traffic to dealerships. Considering that almost half of shoppers look at third-party marketplaces first, some customers may even decide on a car or at least narrow their options before they consider where to buy.
If you're only tracking what happened right before the sale, you may be missing what's really bringing in customers.
Even when marketplaces don't capture the lead, they often spark the customer journey, shape buying decisions, and send high-intent buyers your way. Without measuring the full journey, all of that influence goes unnoticed, causing dealers to underinvest in some of the most influential channels in automotive retail.
This is especially likely when dealers need to save money due to slow or uncertain market conditions. They may cut higher-cost channels without knowing whether those channels provide better ROI.
Tracking channel influence isn't the only area where the automotive industry has blind spots. Many dealers also fail to evaluate the real impact each channel has on sales.
That's because many dealers continue to rely on cost per lead (CPL) as their primary success metric but CPL focuses on volume, not value. It rewards campaigns that create lots of leads, regardless of how likely those leads are to convert to a sale.
This creates two problems. Dealers may:

Chasing cheap leads can cost you more. To maximize ROI, you need to focus on the leads most likely to convert.
• Over-invest in channels that appear effective on paper but actually drive few sales
• Undervalue channels that generate fewer leads, even if they convert at higher rates
Cost per lead is easy to calculate, but it can be dangerously misleading in today’s fragmented and self-directed buyer journey. In some cases, CPL can even lead to dealers losing money if they spend significant time and resources chasing low-quality leads that don’t drive sales.
That’s where the Weighted Engagement Formula comes in. It helps dealers move beyond lead volume by turning all types of shopper activity into a single, comparable metric tied to sales potential.
The weighted engagement approach does this by normalizing all shopper engagement activities like walk-ins, phone calls, or chats to a lead form submission. Lead form submissions are easily tracked and widely understood, so they serve as a consistent benchmark. For example, if chat interactions convert at one-third the rate of a lead form, WEF would assign a value of 0.33. If walk-ins convert three times as often, they would be weighted at 3.0. These weights turn raw engagement volumes into a normalized “lead-equivalent” metric that better reflects their potential to generate sales and evaluate return on investment.
Let’s say a dealership receives 2,000 shopper interactions, spread evenly across four engagement types (500 chats, 500 walk-ins, 500 phone calls, and 500 lead forms), With the following hypothetical lead-equivalent weights:
Note: The close rate is the same for all types here because each activity type has been normalized (or weighted) based on its relative converted value to a form lead. The close rate isn't being applied to the raw engagement total.
In this scenario, walk-ins “count” three times as much as form submissions, and nearly nine times as much as chats despite each type having the same volume. This makes it easy to see which types of engagement are truly driving sales potential. From here, it’s a small step to turn projected sales into a full ROI calculation by layering in media spend and profit per vehicle. The result is a clearer picture of which engagement types deliver the greatest return on marketing investment.
The Weighted Engagement Formula isn’t one- size-fits-all. Dealers can customize it using their own data on engagement volume, conversion behavior, and sales outcomes ensuring the model reflects their actual market dynamics, and giving them an accurate, data-based way to compare “apples-toapples” performance and profitability across stores and across vendor partners.
This level of individualized insight isn’t possible without the reality provided by multi-touch attribution. MTA reveals which marketing channels and touchpoints influence shopper behavior, while WEF quantifies the business impact of the resulting interactions like chats, walk-ins, and calls. Used together, they connect the dots between marketing activity, shopper action, and real sales outcomes.
Identify which marketing efforts lead to high-value shopper engagement

Move beyond CPL with more accurate, ROI-driven performance metrics.

Evaluate those engagements based on their likelihood to convert
Allocate budget based on what actually drives profit not just leads.
Dealers that want to connect media investment to meaningful business outcomes should pair multi-touch attribution with a customized weighted engagement formula turning engagement into a sales- and ROI-informed strategy.
Digital shopping has transformed how people buy cars, yet marketing measurement hasn’t kept pace. Many dealers still evaluate performance based on lead volume, even though that metric only reflects a small part of the customer journey.
Multi-touch attribution (MTA) and weighted engagement formulas (WEF) offer a more accurate view capturing how different marketing channels influence buyer behavior and assigning value to shopper interactions based on actual performance.
To stay competitive, dealers need to rethink how ROI is measured. With the right data and tools, they can shift focus from lead quantity to lead quality and tailor WEF models that reflect their unique customers, markets, and close rates, ultimately driving more profitable outcomes.
This starts with collaboration. Marketing teams and leadership should work together to evaluate the true performance of each lead source and create a personalized weighted engagement formula grounded in their specific business realities.
Your WEF doesn’t need to be perfect on day one. In fact, it shouldn’t be. The most effective formulas evolve shaped by real results, shifting shopper behavior, and changing media dynamics. As you track engagement across sources, you’ll refine your model and continue improving how marketing drives results. This iterative approach helps you optimize spend and maximize returns over time.
If your dealership has good marketing analytics information, you could start looking at multiattribution modeling yourself. Otherwise, multiple providers in the automotive industry offer MTA solutions, supporting dealers with the data tracking and analysis needed to surface the insights that matter most.
Dealers should look for a marketing technology partner that fits their needs and budget. If you decide to work with a partner, make sure that you select one with the right technology and approach. Factors to consider include identity resolution technology, identity graphs, and data-collection reach. Once MTA and WEF are in place, you’ll have performance metrics that reflect how buyers actually shop and can credit all channels based on their real contribution to sales, maximizing your return on ad spend (ROAS).
Dealers who embrace MTA and WEF will unlock insights their competitors are still missing like how third-party marketplaces playing a bigger role in driving sales than many dealers realize. Armed with this intelligence, they can make smarter investments, optimize their media mix, and maximize every dollar spent. In today’s market, that kind of clarity isn’t just helpful it’s a competitive advantage.
• Clarivoy 2024 sales data: Clarivoy is a marketing technology firm in the automotive industry. They collected and analyzed anonymous buyer data from 1,181,705 sales in 2024.
• Cox Automotive Car Buyer Journey Study: In 2024, Cox Automotive surveyed roughly 2,300 people who purchased or leased a vehicle between September 2023 and August 2024 and used the internet as part of their buying and shopping process.