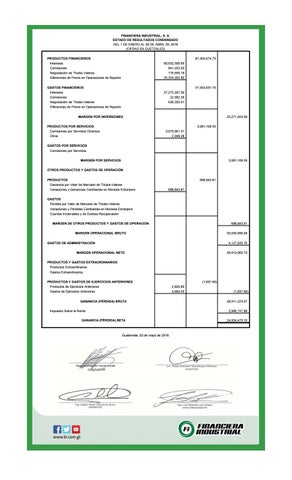
FINANCIERA INDUSTRIAL, S. A. ESTADO DE RESULTADOS CONDENSADO DEL 1 DE ENERO AL 30 DE ABRIL DE 2018 (CIFRAS EN QUETZALES) PRODUCTOS FINANCIEROS
87,204,674.79
Intereses
60,632,500.69
Comisiones
841,255.03
Negociación de Títulos-Valores
176,656.18
Diferencias de Precio en Operaciones de Reporto
25,554,262.89
GASTOS FINANCIEROS
57,933,631.70
Intereses
57,275,297.30
Comisiones
22,002.39
Negociación de Títulos-Valores
636,332.01
Diferencias de Precio en Operaciones de Reporto MARGEN POR INVERSIONES
29,271,043.09
PRODUCTOS POR SERVICIOS
3,081,109.59
Comisiones por Servicios Diversos
3,079,061.31
Otros
2,048.28
GASTOS POR SERVICIOS Comisiones por Servicios 3,081,109.59
MARGEN POR SERVICIOS OTROS PRODUCTOS Y GASTOS DE OPERACIÓN PRODUCTOS
688,843.81
Ganancia por Valor de Mercado de Títulos-Valores Variaciones y Ganancias Cambiarias en Moneda Extranjera
688,843.81
GASTOS
0.00
Pérdida por Valor de Mercado de Títulos-Valores Variaciones y Pérdidas Cambiarias en Moneda Extranjera Cuentas Incobrables y de Dudosa Recuperación 688,843.81
MARGEN DE OTROS PRODUCTOS Y GASTOS DE OPERACIÓN MARGEN OPERACIONAL BRUTO
33,040,996.49
GASTOS DE ADMINISTRACIÓN
4,127,935.76
MARGEN OPERACIONAL NETO
28,913,060.73
PRODUCTOS Y GASTOS EXTRAORDINARIOS
0.00
Productos Extraordinarios Gastos Extraordinarios
0.00
PRODUCTOS Y GASTOS DE EJERCICIOS ANTERIORES
(1,837.66)
Productos de Ejercicios Anteriores
2,826.89
Gastos de Ejercicios Anteriores
4,664.55
GANANCIA (PÉRDIDA) BRUTA Impuesto Sobre la Renta
(1,837.66) 28,911,223.07 3,986,747.88
GANANCIA (PÉRDIDA) NETA
Guatemala, 03 de mayo de 2018.
24,924,475.19