

T HE 2022 CURIOSITY REPORT
DESIGNING WITH NEW ENERGY
“The best way to predict the future is to design it.”

BUCKMINISTER FULLER
THE CURIOSITY REPORT
CURIOSITY REPORT

Letter from the Editor
Over the past three years, this publication has examined the role of emerging technologies and how they are shaped by social behaviors. We have focused on the perspectives of everyday people, evolving business practices, technology advancement, the policies, the trade-offs, and the trends that are reimagining the world of architecture and the exciting futures they bring. In the process, we have explored outer space and taken a deep dive into the metaverse — and how these new frontiers will influence the way we design and prepare for the future.
But the energy in the air is changing.
This year, our focus is here, on earth, looking at one of the most complex systems ever created in human history — a system that will, out of necessity, continue to accelerate innovation. As architects and designers, we need to approach energy transformation wholistically — from the embodied energy in the materials we use, to on-site energy generation and consumption; from the food we eat, to the mental health of our workforce. Everything we think we know about energy is about to change. Luckily, this transition towards a cleaner, more convenient energy future is inevitable — and we are the pioneers exploring that brave new world.
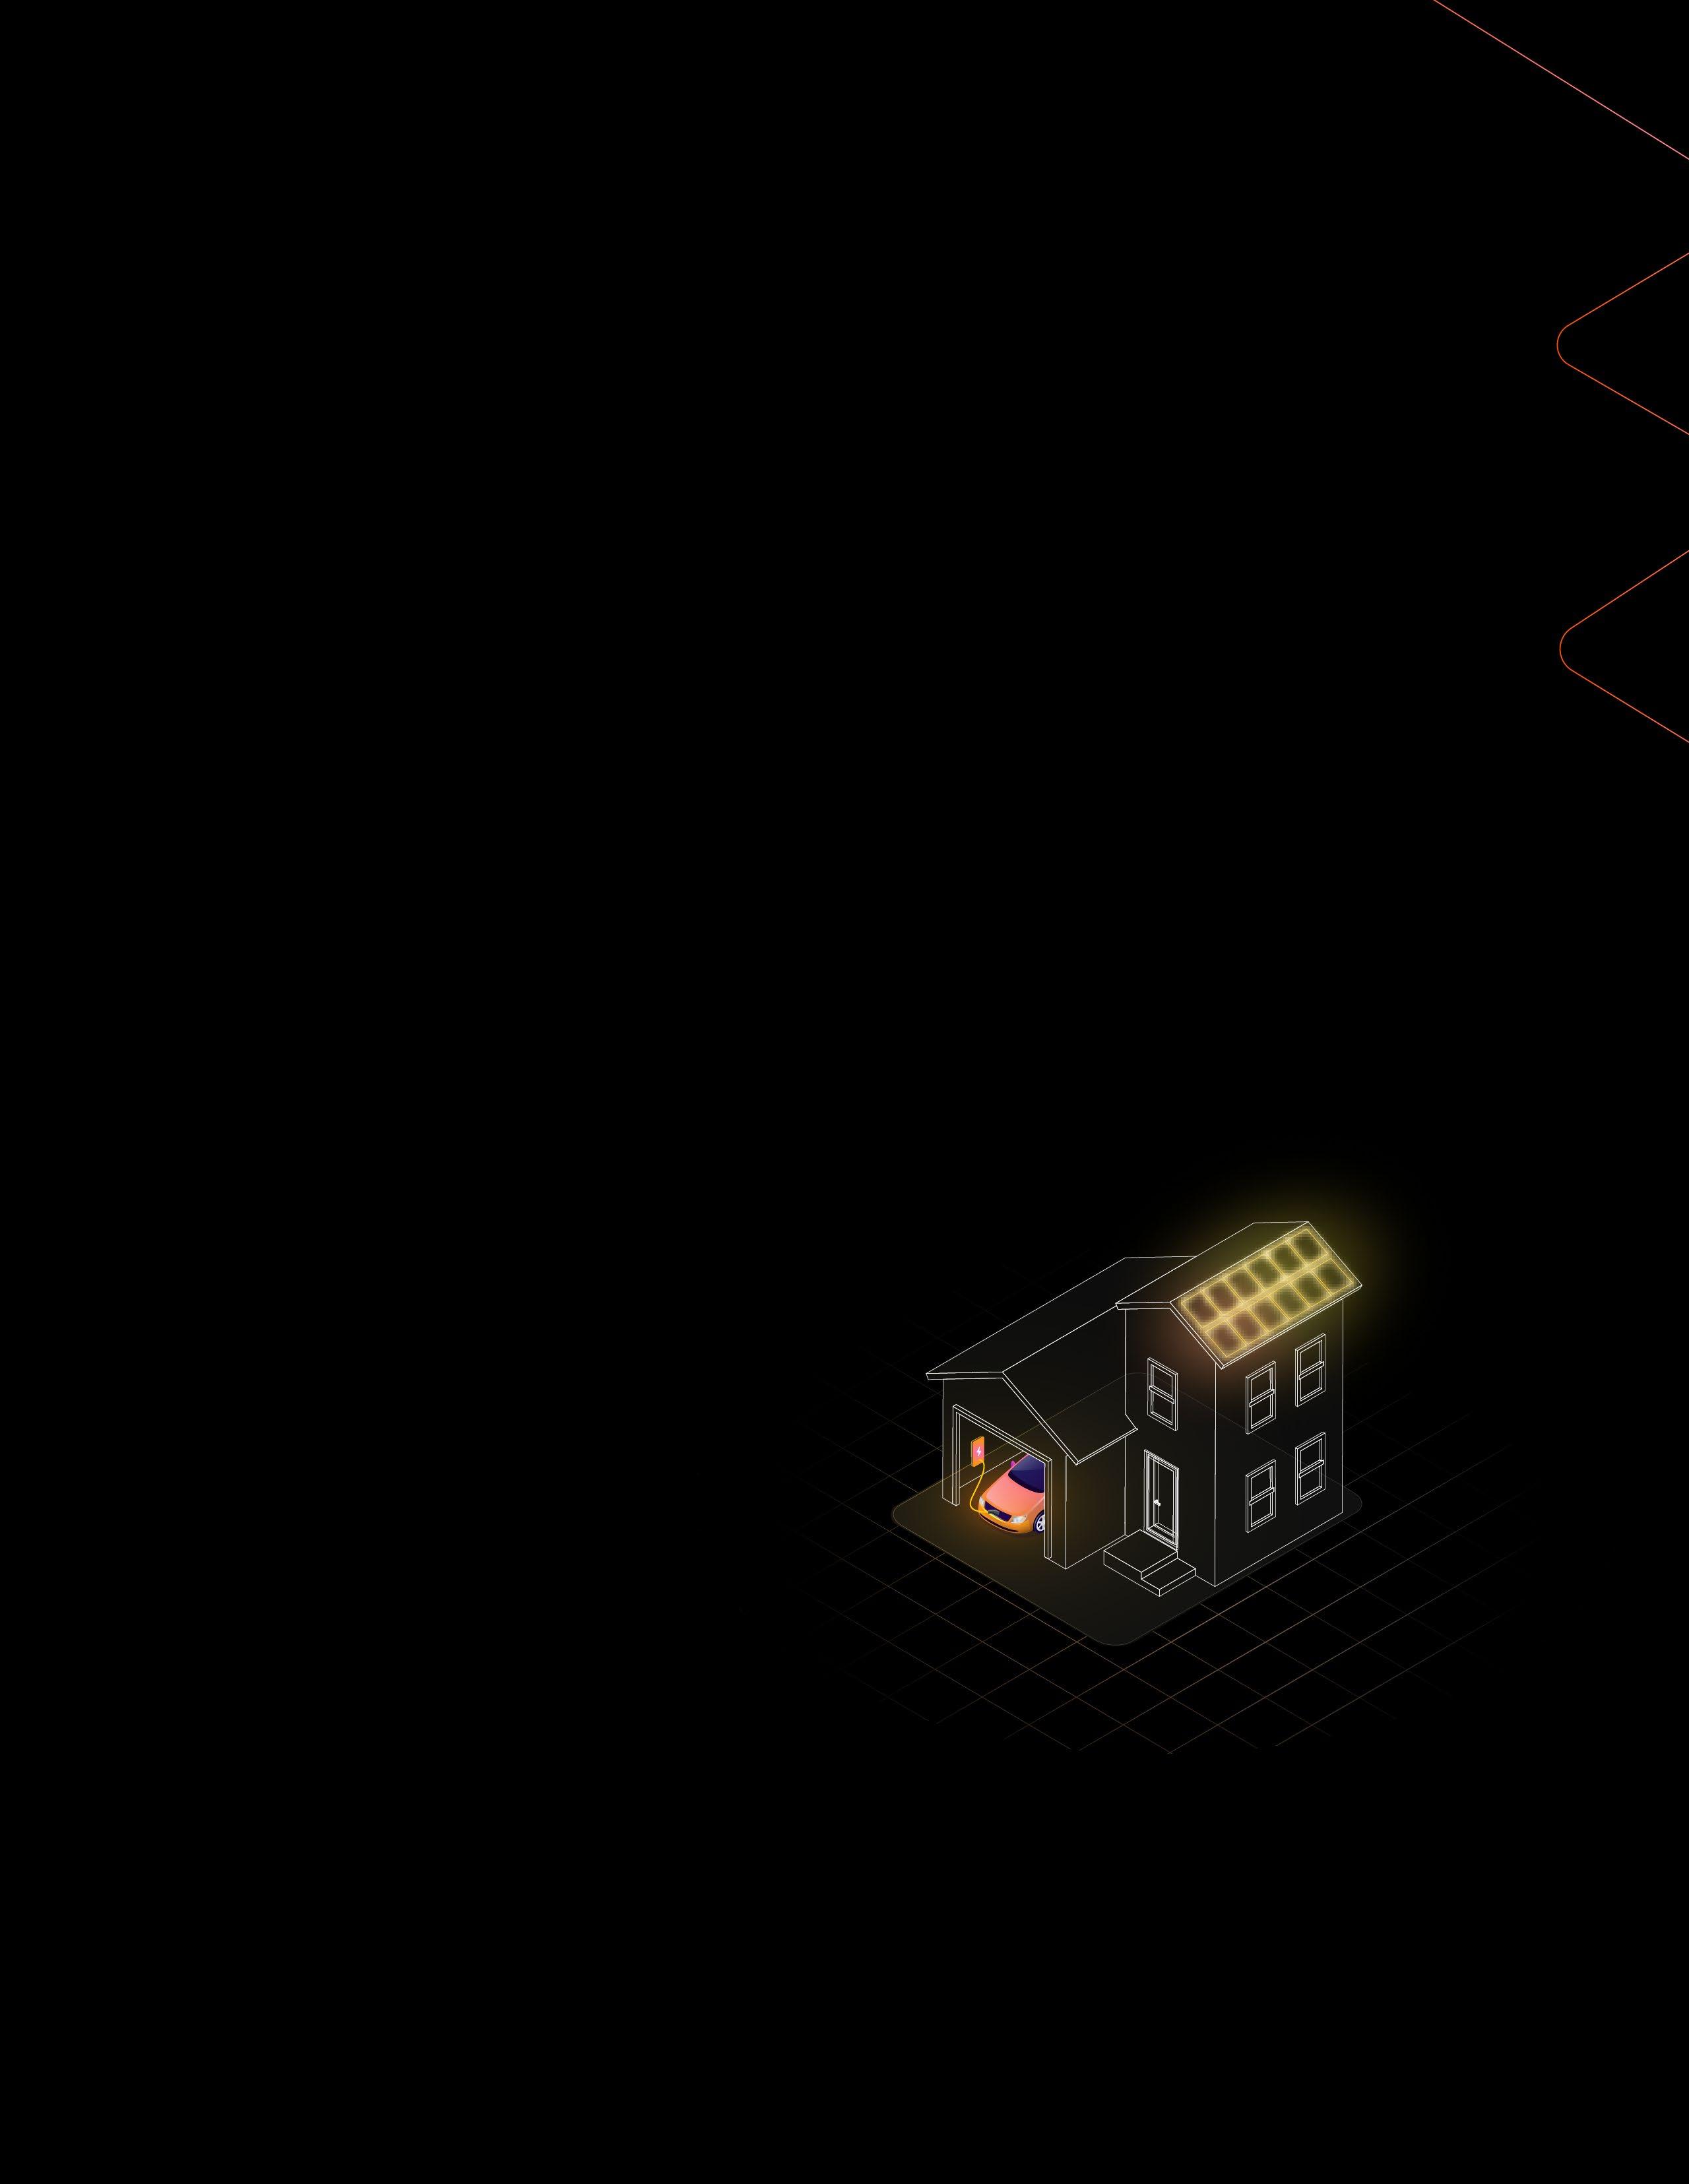
It’s not just solar panels — wind farms are moving from remote fields to our urban rooftops, batteries are rapidly evolving to capture renewable energy and deliver it at the times and locations when we need it most, electric vehicles are parking in our garages and delivering energy back to the grid, microgrids are turning building owners into prosumers, communities are gamifying and personalizing energy exchanges, and simultaneously, extreme weather events are taking down our power grids.
Energy is the most invisible and yet, most demanded commodity on our planet. Most people don’t even think about it — until it’s not working, or the bill is due. Everyday behaviors — such as washing our hands, sending an email,
and grabbing a fresh salad — all rely on electricity to function. And with that, comes a reliance on fossil fuels and rising greenhouse gas emissions. Today, we are increasingly aware of our personal impact on and interaction with the power grid as well as the collective corporate responsibilities we must adopt in our built environment to move towards a cleaner, digitized, and democratized energy economy.
Policy and emerging technologies are working together to analyze these trends and respond to them. In less than 10 years, almost all of our energy will be generated by renewable sources, the majority of car sales will be electric, and all new buildings will be required to be zero-carbon ready.
This is no longer an unbelieveable future — it’s already happening.
Within the next decade, the way we produce, distribute, and consume power will be cleaner, cheaper, and infinitely more complex. In this edition of the Curiosity Report, we investigate areas in which technology is already helping reduce emissions and where breakthrough innovations in building construction and energy generation are needed, all while speaking directly with the experts who are working on these innovations themselves.
But we don’t stop there.
Energy is more than just keeping the lights on — it’s literally defined as “the capacity for doing work.” As we exit the era of the “attention economy” and power through the “Great Resignation,” we are forced to confront energy management on a personal level as well as the power to switch off and reboot. We are living through a fundamental shift that could have profound implications on future generations — the same generations that told us “green matters.”
This year, with renewed focus and big energy, we are exploring how our industry is evolving today, to advocate for a better tomorrow.


Introduction
Let’s Talk About Energy
“When one half of the population literally cannot imagine how the other half thinks, small talk about the weather is an entrée to our shared humanity.”1
Add this to your reading list.
The Energy Switch: How Companies and Customers Are Transforming the Electrical Grid and the Future of Power
by Peter Kelly-Detwiler

Energy efficiency must remain a top priority for zero carbon even with a decarbonized energy supply. Every dollar invested in energy efficiency saves about two dollars in energy supply, whether that investment is made in local, on-site generation or at a grid level.2
But the weather is no longer just polite conversation for when there’s nothing else to talk about. It now frequently makes headlines ― “Wildfires covering full states and continents”; “Increased frequency and intensity of hurricanes”; “Breaking records with extreme temperatures and seasons that are no longer recognizable.”
However, weather will soon become one of the most important indicators for the health of our energy supply. Sunny days won’t just be reason to lounge by the pool — they will represent opportunities to capture power and save it for that next rainy day.
When you think about energy efficient building solutions, you may think about using better insulation, or double-glazed façades. And while there have been incremental changes in these technologies over the last few decades, we are at a tipping point. If we want to achieve zero-carbon building design, we need to think bigger. We need to be working towards grid resiliency and understand how our buildings can support that transition for the 21st century.
Energy Generation
The Tesla-Edison Model
An age-old model for energy generation.
Renewable Generation
A tapestry of solutions.

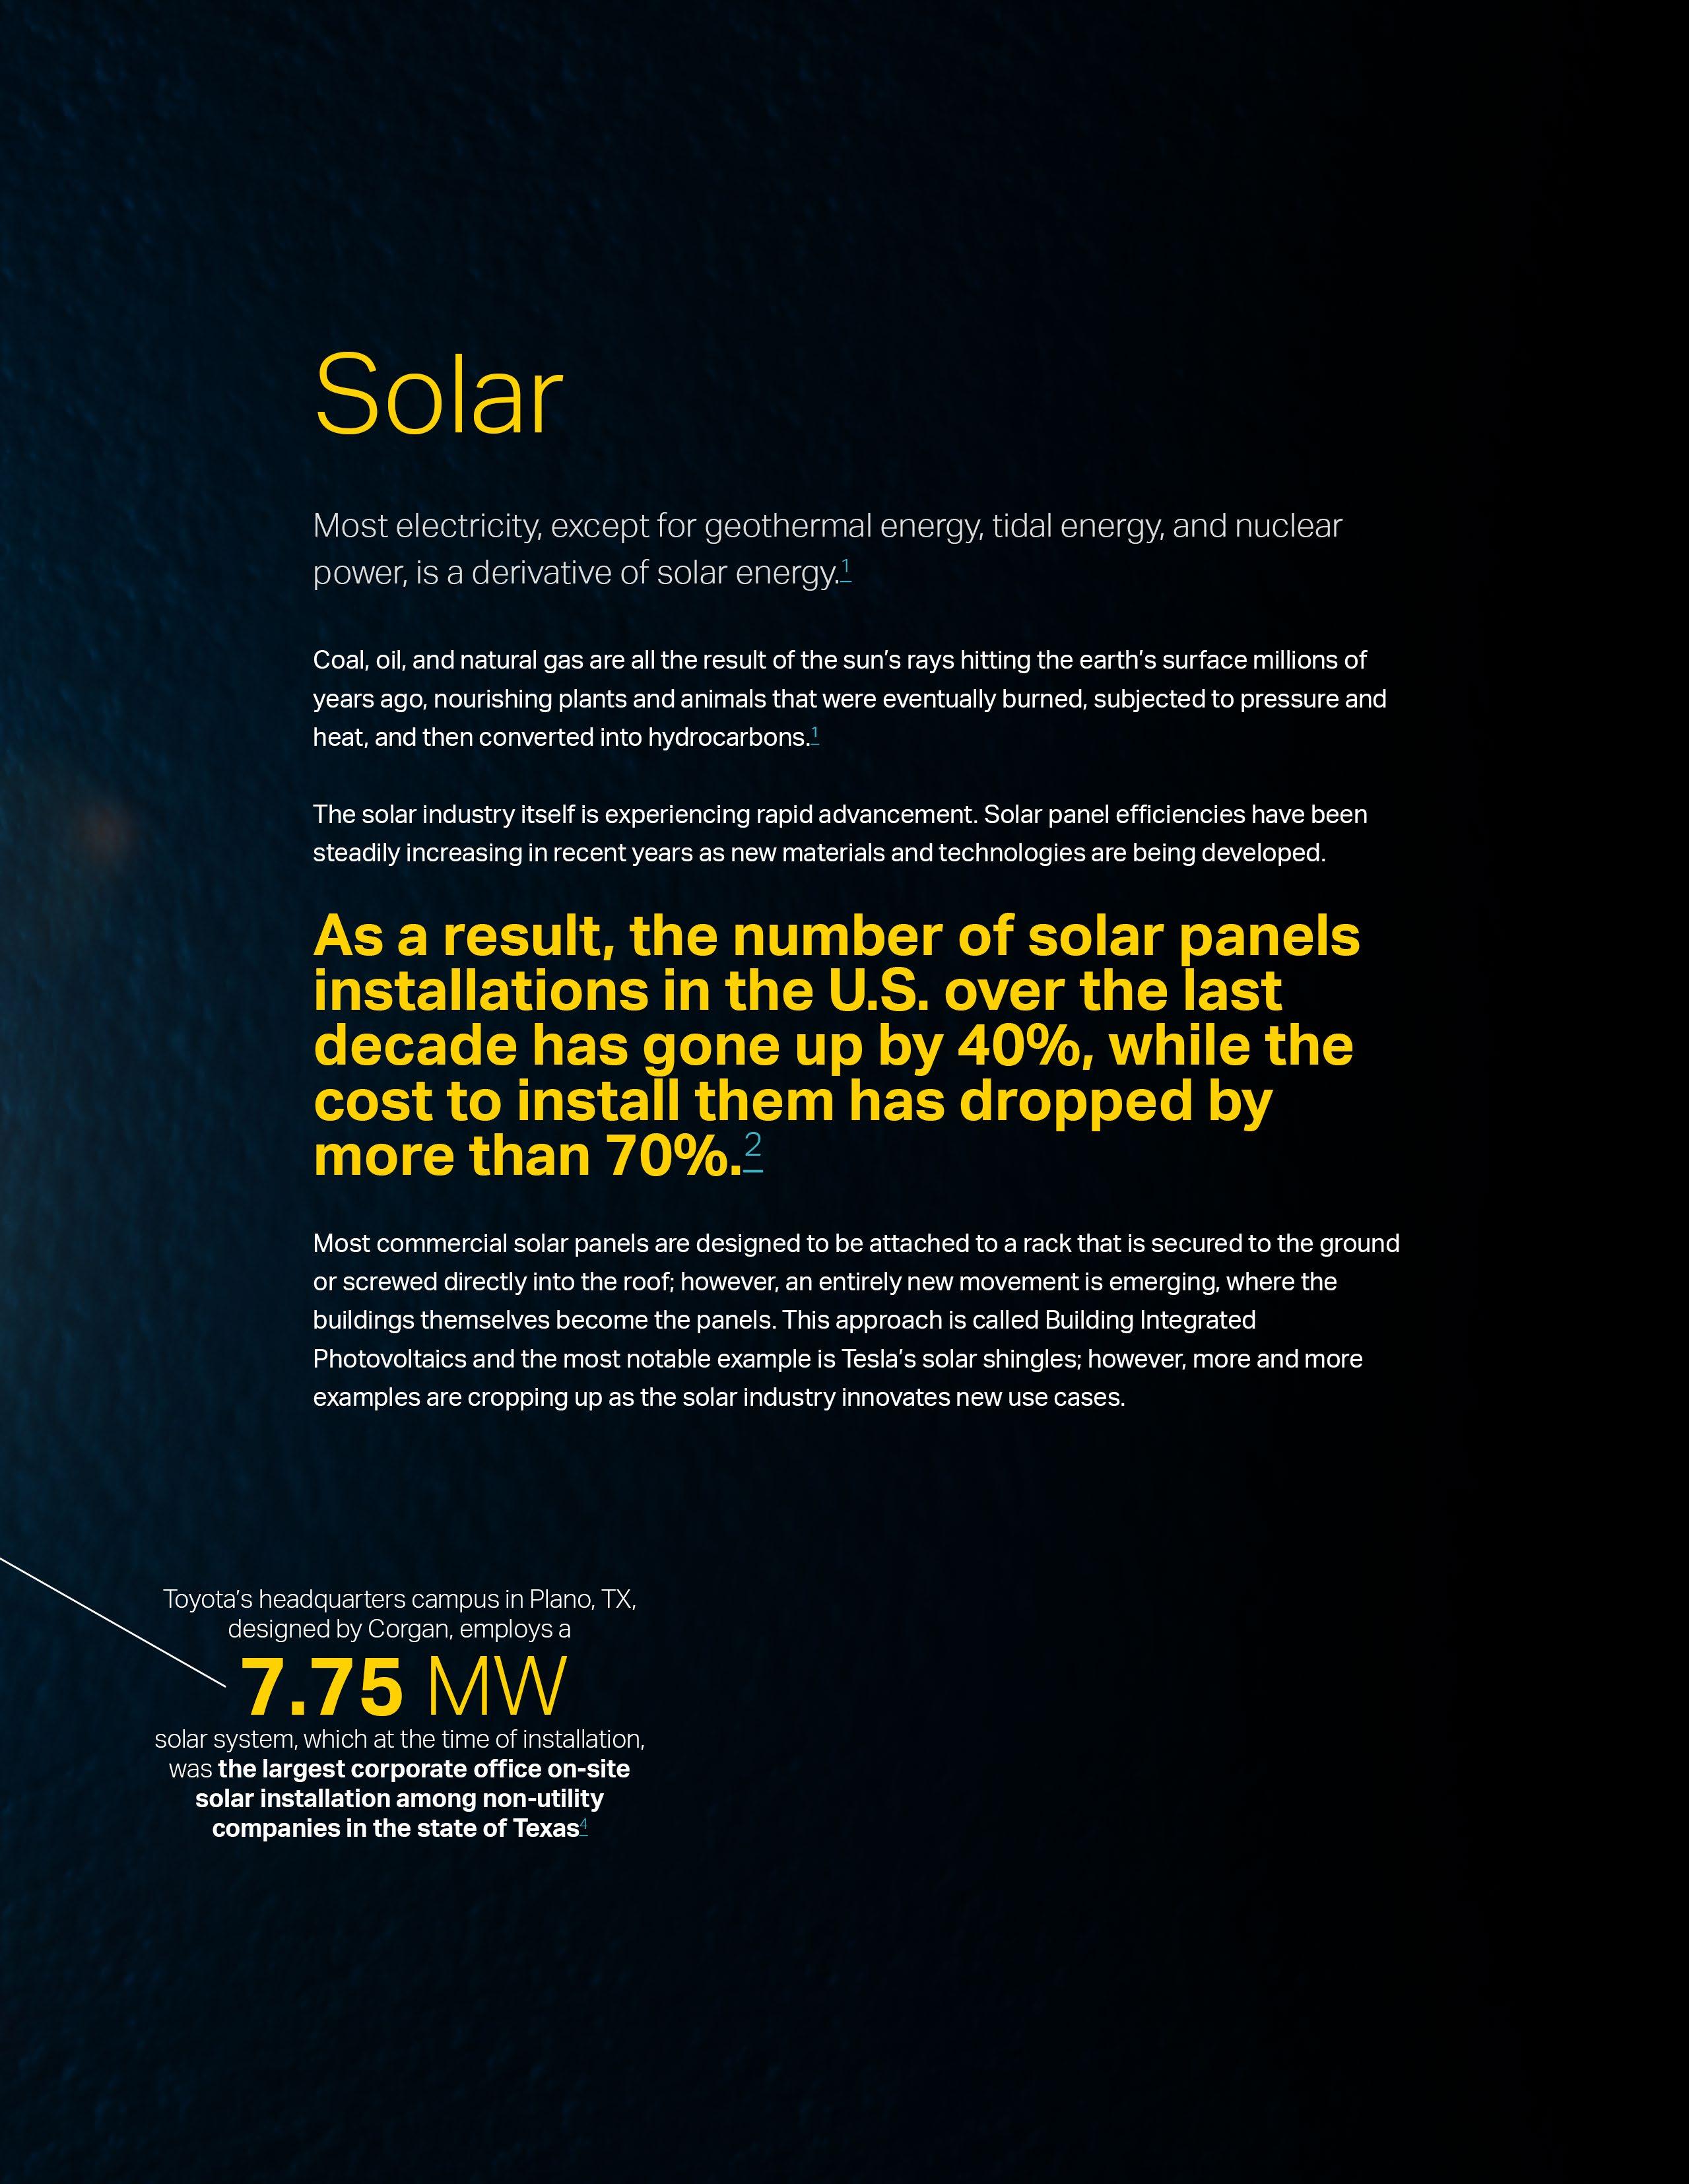
Solar + Wind
Weather-based
renewable sources and their growing industries.
Capturing the Power That Is All Around Us
Wind turbines and how they integrate within our buildings.
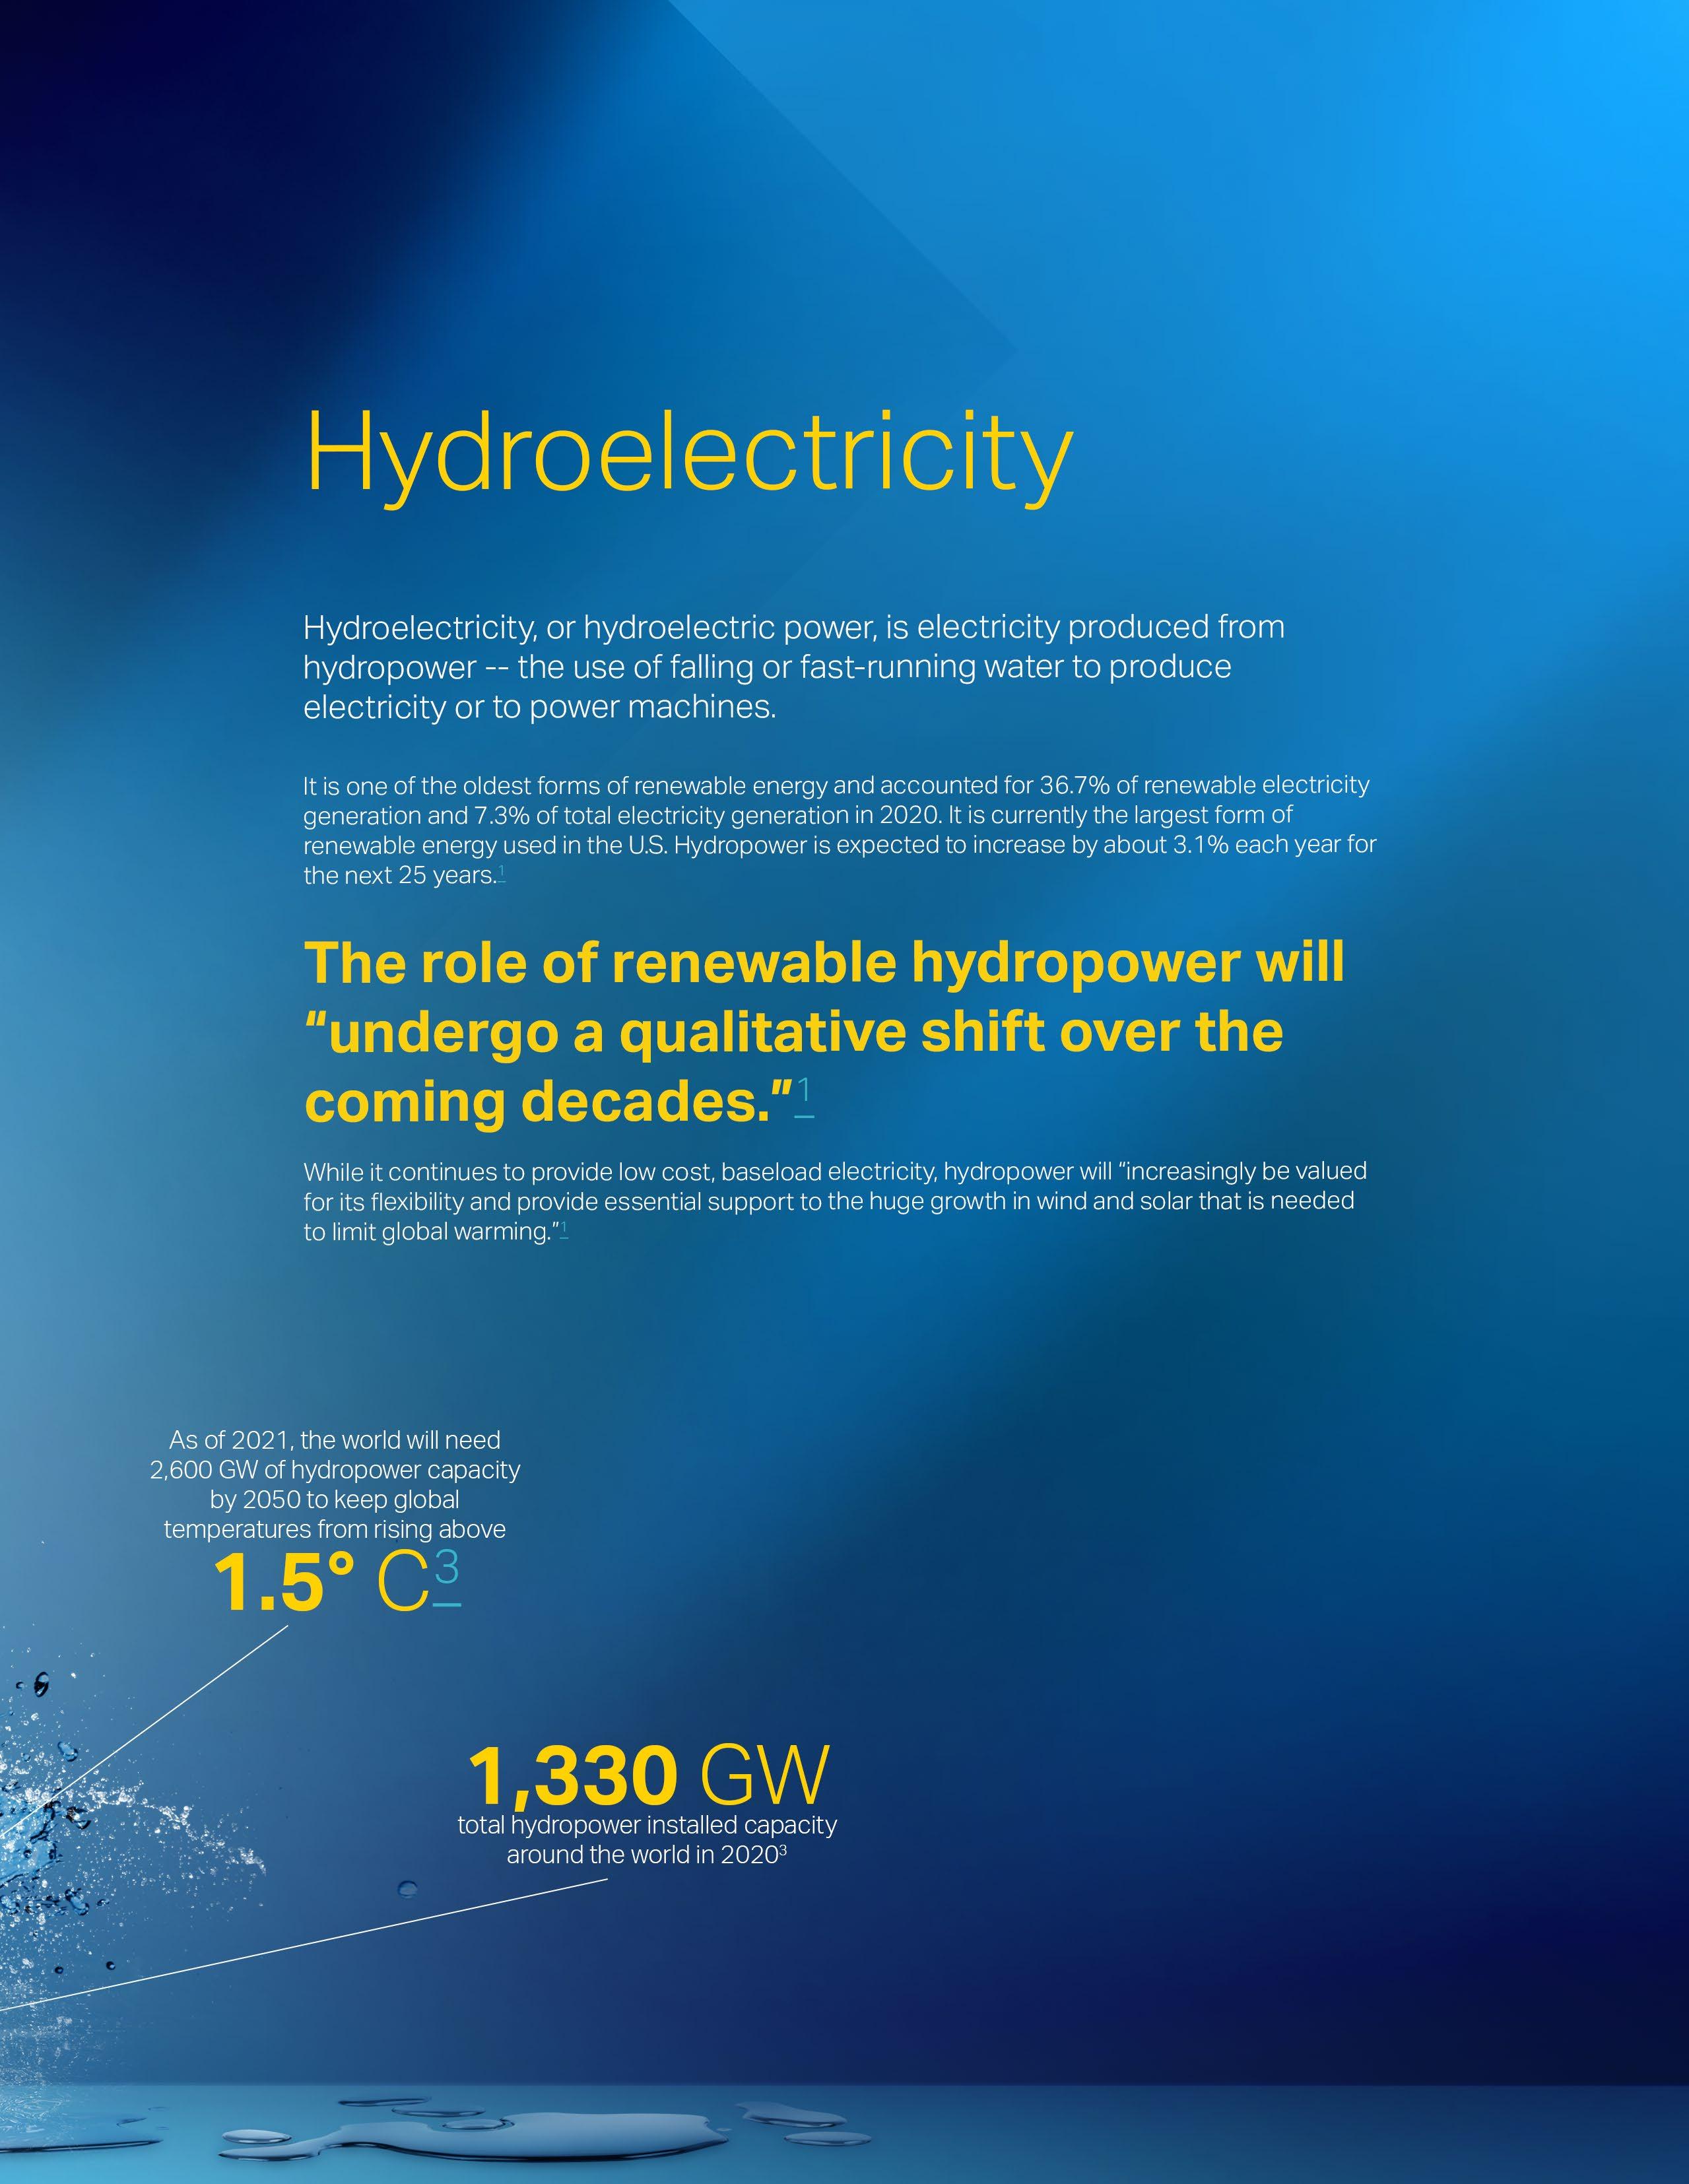
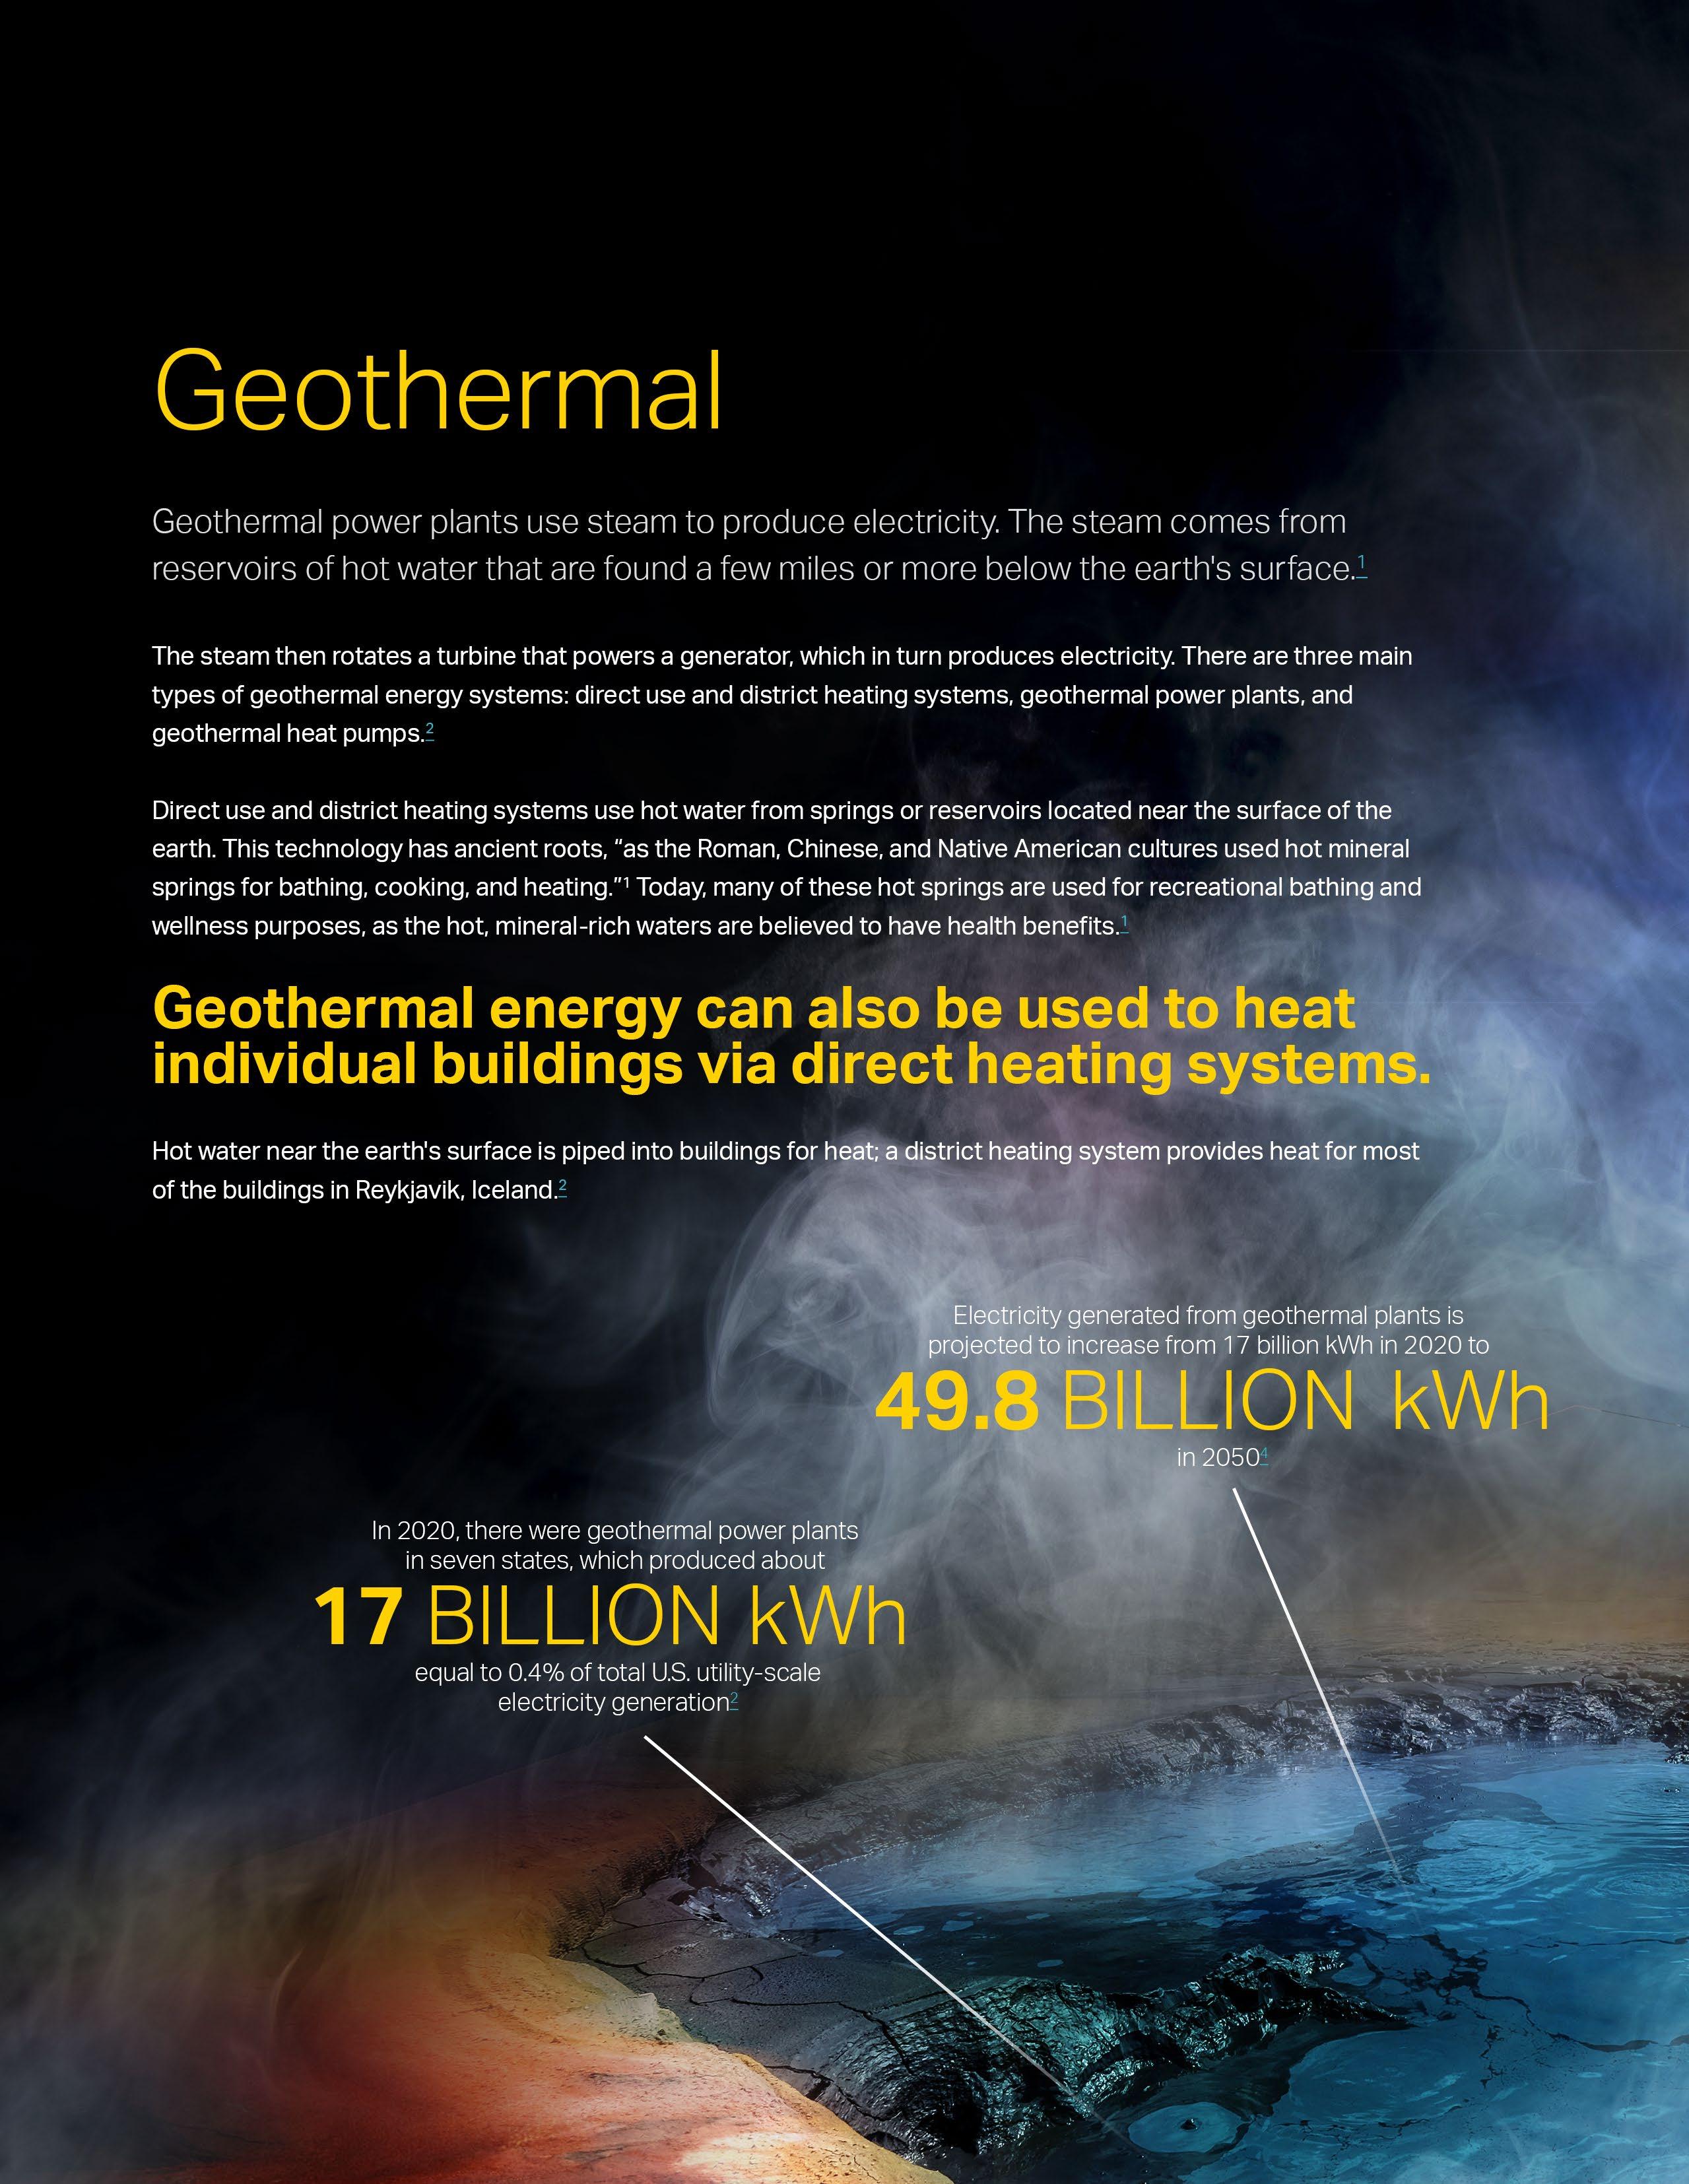
Hydroelectricity, Biofuels, Geothermal, + Nuclear
Alternative energies and their emerging industries.
Joltz
Kinetic energy within a prosumer model.

“I’d put my money on the sun and solar energy. What a source of power! I hope we don’t have to wait until oil and coal run out before we tackle that.”
— THOMAS EDISON
The Tesla-Edison Model
Our modern society cannot live without it. As Peter Kelly-Detwiler, author of The Energy Switch, describes it, “It powers our homes, our factories, our increasingly digital economies, indeed our lives. Without it, society would quickly disintegrate into chaos. And yet, we only vaguely understand what it is, how we generate it, move it, or consume it.”1
However, the grid we know today is founded on ideas that are almost 120 years old. This is why we call it the Tesla-Edison energy paradigm. While Thomas Edison invented the “first practical and affordable light bulb, he didn’t invent a practical and affordable system for keeping those lights on nationwide.”2 According to Jil Jonnes, author of Empires of Light: Edison, Tesla, Westinghouse, and the Race to Electrify the World, “If we were living in Edison’s world, we’d have a large coal-operated generating plant every
Source: How to Avoid a Climate Disaster by Bill Gates4 CURIOSITY
mile or two, because direct current (DC) couldn’t travel any distance.” 2
As we’ve increased our ability to generate energy, we have developed ways to distribute and access it across the world. For this reason, consumer demand and grid supply must always be balanced.
The goal of a generator is to produce set power levels for each hour up to their own capacity limit. Therefore, different fuels result in different
HOW MUCH GREENHOUSE GAS IS EMITTED
BY THE THINGS WE DO?
Making Things (cement, steel, plastic)
Plugging in (electricity)
Growing Things (plants, animals)
Getting Around (planes, trucks, cargo ships)
Keeping Warm & Cool (heating, cooling, refrigeration) 7%
HOW MUCH POWER DOES IT TAKE?
costs of electricity. This means that when we operate our energy system, we should consider the cost of energy types. Certain generators have different constraints — for example, they might have different requirements for advanced notice. Some need a couple hours; some need a day. So, they’re not always able to react immediately to changes in demand which is something to consider as we attempt to decarbonize power generation throughout our buildings and across the globe.
According to estimates, global energy consumption is expected to increase by 28 percent by 2040 as compared to 2015.3
Add this to your reading list.
How to Avoid a Climate Disaster by Bill Gates

“Whenever
you hear kilowatt, think house. Gigawatt think city. A hundred or more gigawatts, think big country.”
— How to Avoid a Climate Disaster by Bill Gates4

Renewable Generation: A Tapestry of Solutions
Peter Kelly-Detwiler points out, “For much of the past century, the generating plants on the grid were typically quite large and fueled mostly by a mix of coal, oil, natural gas, and uranium. However, they’re slowly being retired. The generating assets lining up to replace these retired plants are mostly clean wind and solar resources. That means they will generate electricity when nature’s fuel shows up, in other words, when the sun shines or the wind blows.”1
As we explore renewable energy generation, it’s important to remember there is not one singular bullet solution. It will more than likely result in a tapestry of solutions that consider price, efficiency, and location.

In the U.S., energy generation from renewable sources surpassed coal in 2020 and is now second only to gas. 2


Capturing the Power That Is All Around Us
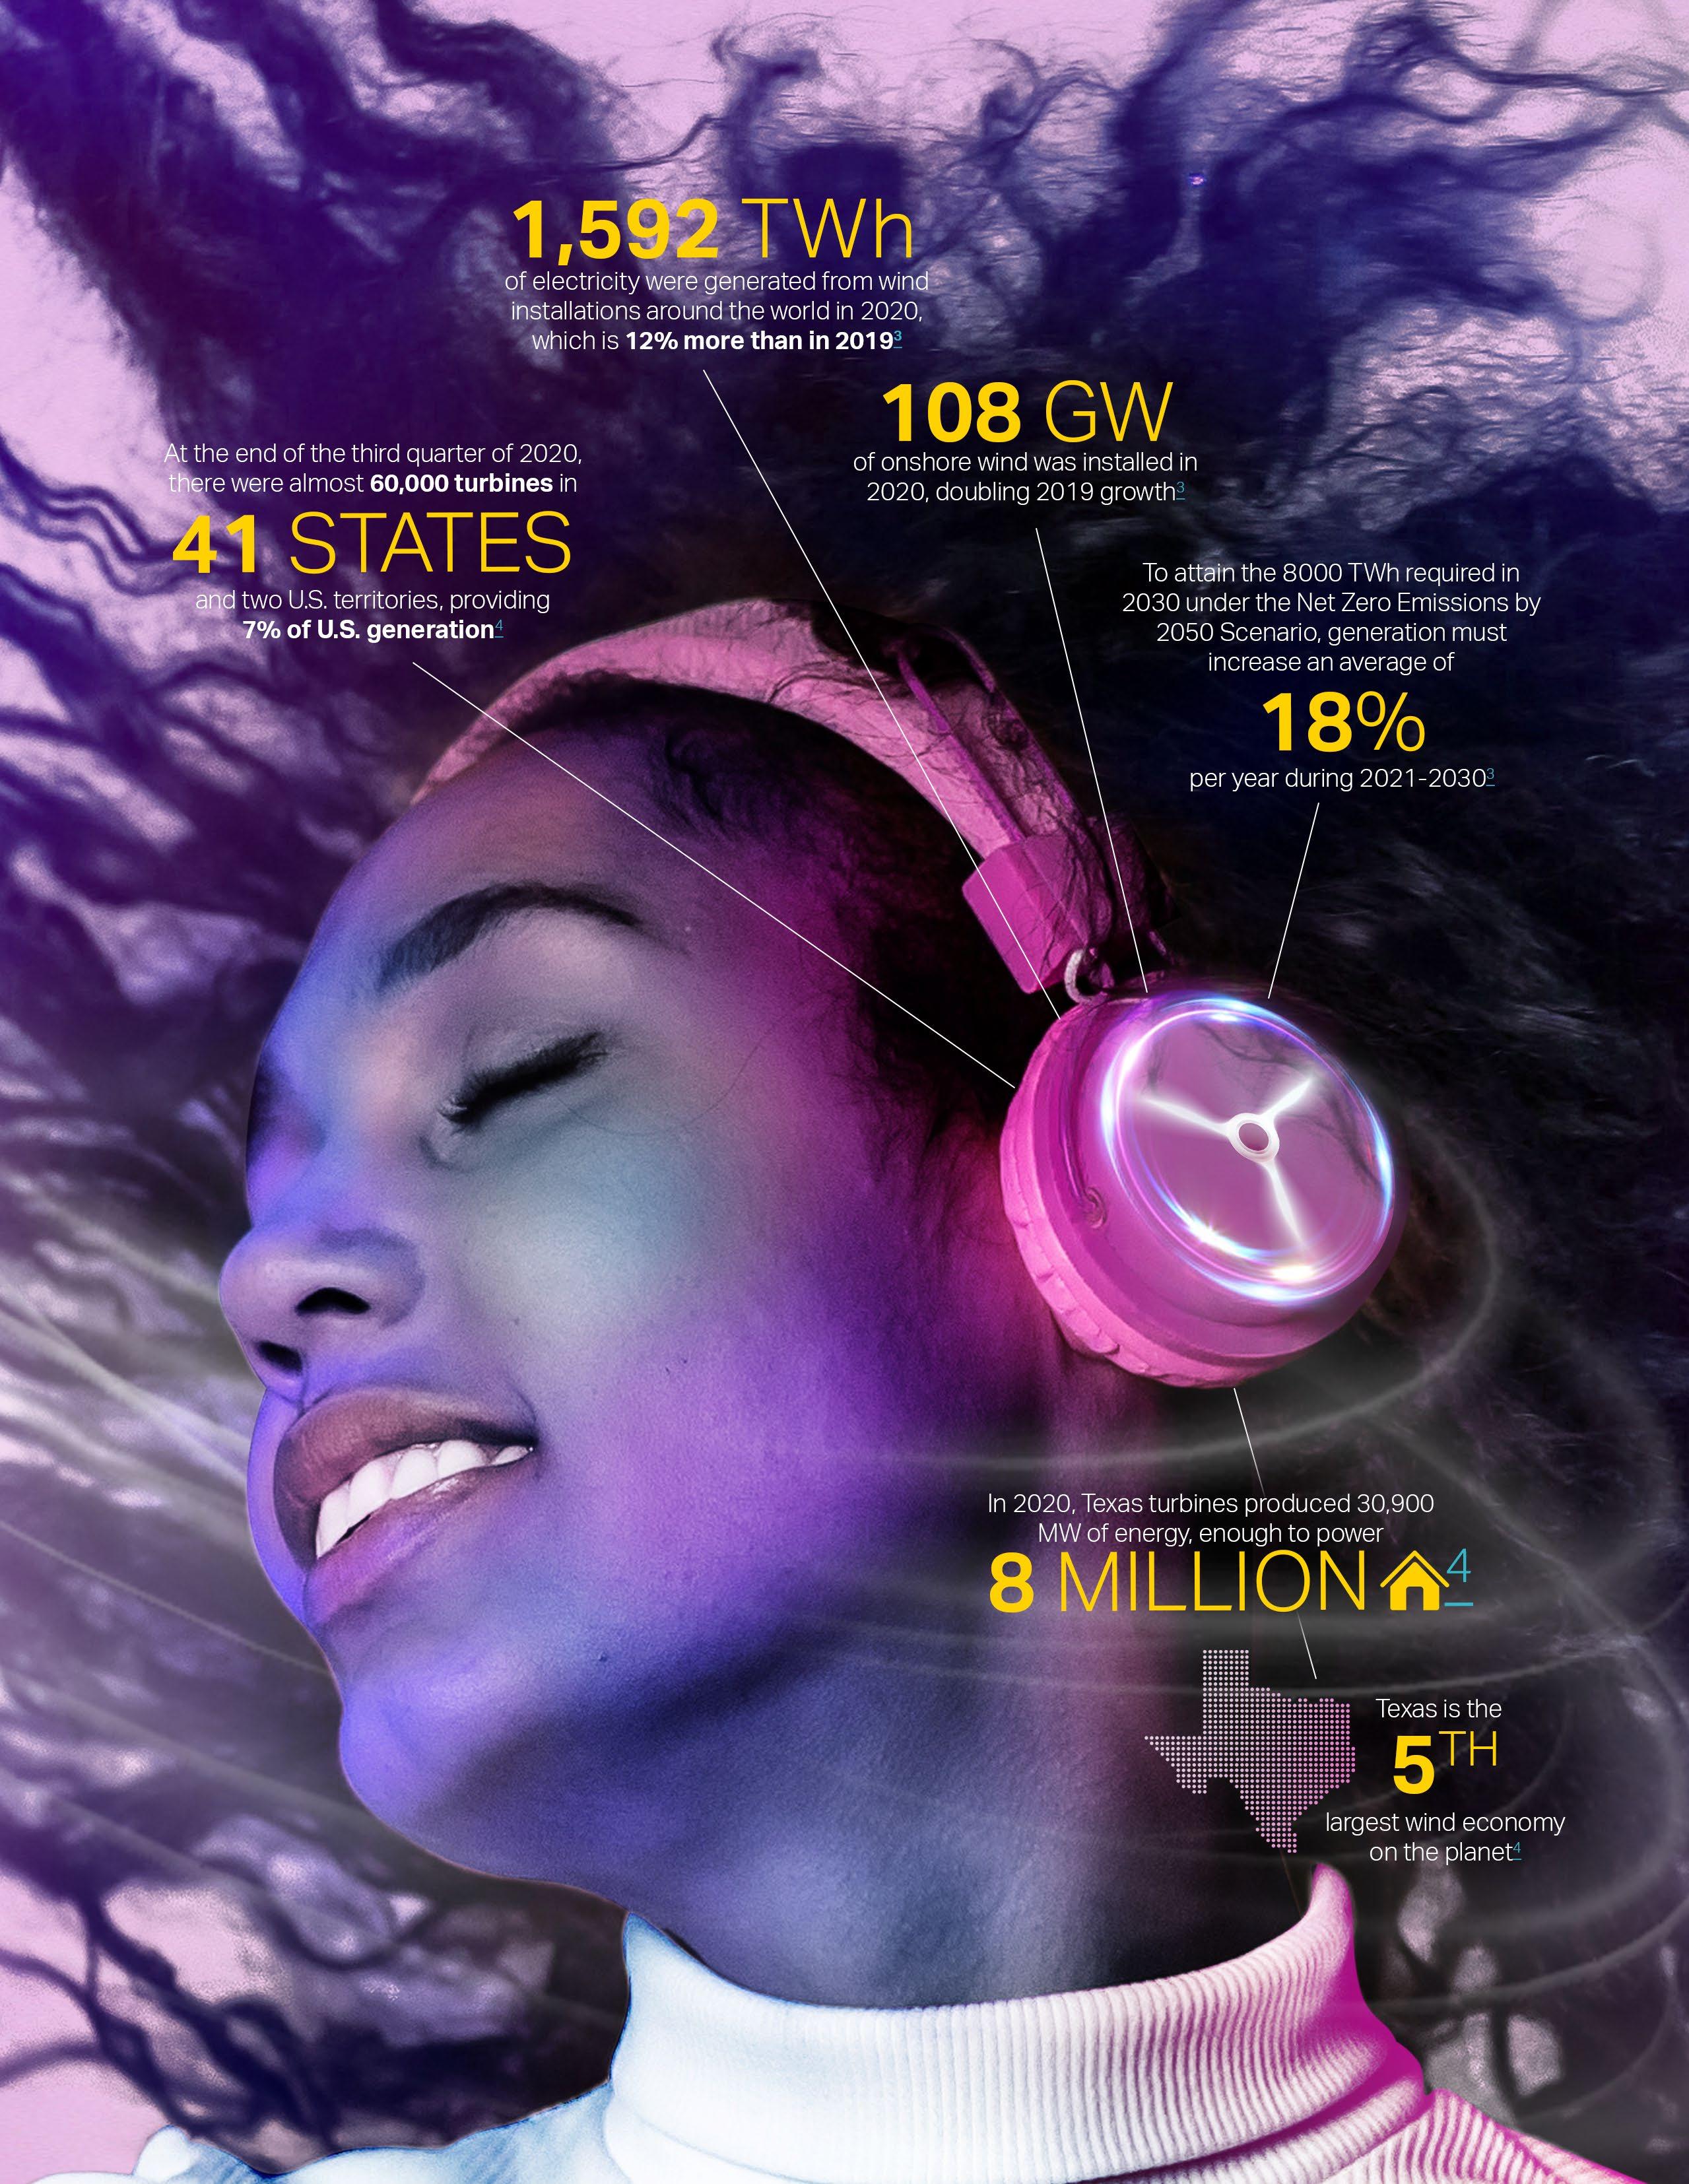
Over the past decade, the global wind power market has nearly quadrupled in size, becoming one of the most resilient and cost-competitive ways to generate power in the world, thanks to emerging technologies and increasing adoption across various communities. In fact, the wind industry experienced a 53% increase from 2019, setting a new record in 2020 by installing 93 Gigawatts (GW) of new capacity — enough to power almost 70 million homes.
Today, the U.S. and China combined account for 75% of 2020 installations, while Texas alone became the fifth-largest wind energy economy in the world.2 Over $50 billion has been invested in Texas wind projects, while at the same time, somewhere around 25,000 jobs have been created to support the growing industry.2
Wind isn’t just creating jobs and lowering electricity bills. With a total of 743GW of wind power capacity worldwide, we are globally reducing over 1.1 billion tons of CO2 — a number equal to the annual carbon emissions of South America.1
However, as aggressive as this growth may seem, it’s not enough to reach the 2050 carbon neutrality goals set by world leaders. Government benchmarks are a great way to set long-term ambitions — but near-term targets are where we should be focusing our attention. To achieve net zero by 2050, the world needs to be installing wind power three times faster than the current rate within the next decade, and that may necessitate a new model for power creation and consumption.1
Historical Development of New Wind Power Installations
New Wind Power Installations in 2020
Source: 2021 Global Wind Report, GWEC1
This could mean a paradigm shift for large corporate businesses in the coming years. Today, more than 1,200 companies spanning 60 countries are working with the Science-Based Target initiative (SBTi) to reduce their emissions, and with an estimated 94 GW of wind capacity to be added to the grid annually until 2025, wind power is poised to accelerate the global energy transition.1
Not only are companies adopting renewable energy as part of their corporate green initiatives, it is also becoming a requirement for incoming talent recruitment and retention.
Corgan’s Workforce Blurred study found that 64% of surveyed incoming workforce members prioritize cutting edge green practices as a part of the office environment when choosing their employer.
And while 94 GW a year is a very ambitious goal, in order to reach carbon neutrality by 2050, that number needs to double, according to the Global Wind Energy Council, requiring bold actions by companies who can lead the charge towards energy independence.1 “Necessity is the mother of all invention,” says Chris Griffin, CEO and Co-
New Global Wind Installations Needed to Reach Net Zero by 2050
Total new Wind Installations Required Under IEA’s NZE2050 Scenario
Founder of Hover Energy, a company that designs, develops, and deploys wind-powered microgrids in the urban environment, “we are now turning the built environment into a power source.” What does power generation in the urban environment look like? Today, it may look like companies investing in solar roofs — tomorrow, they will also be investing in wind.
“We are in the middle of the biggest transitions in the history of the modern world, and no one knows it yet. And we are talking about public infrastructure and not just private industry…. We’re going to be inventing new ways of doing things that are in some ways, old things…”
— The Energy Switch by Peter
Kelly-Detwiler2
Shooting the Breeze at the Office: Not Just Water Cooler Talk Anymore
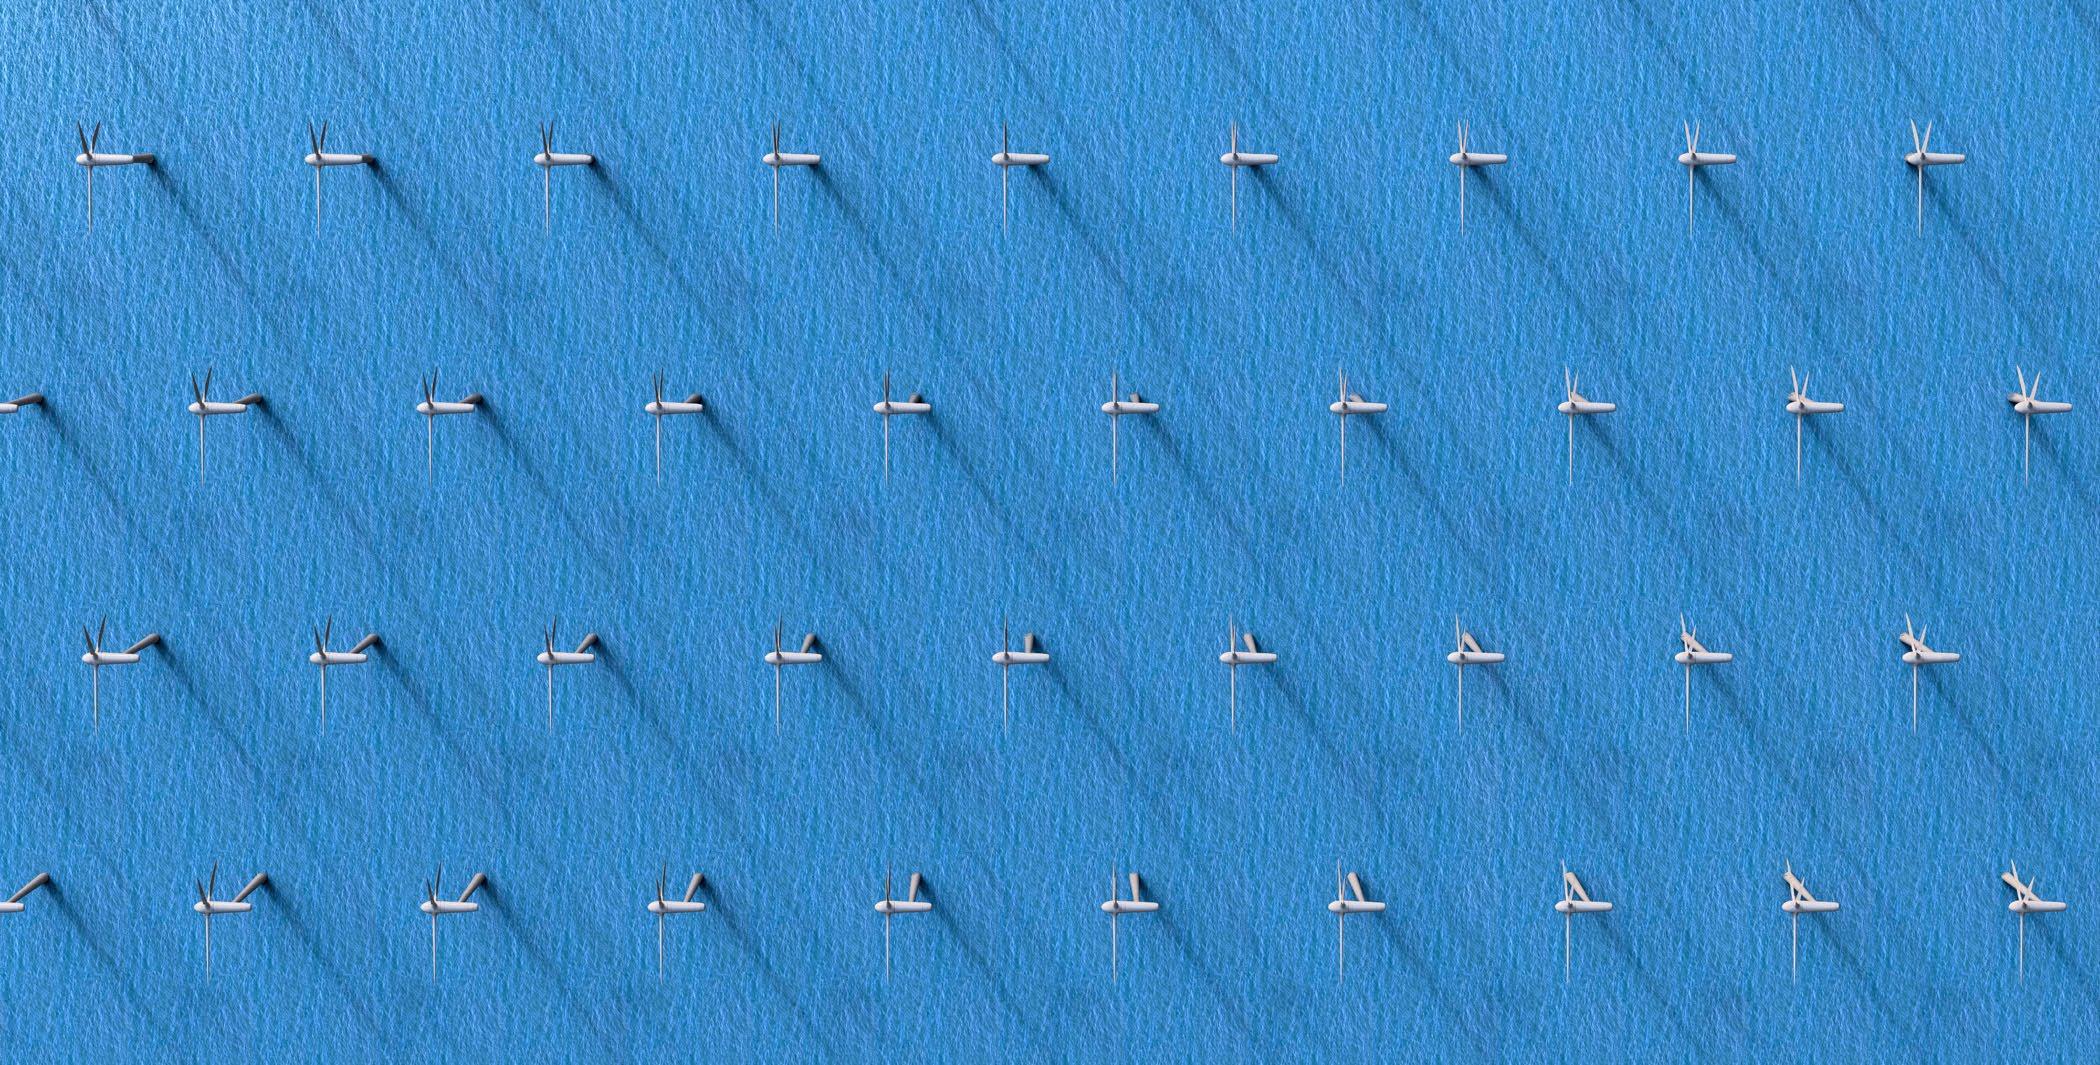
Our cities not only experience the urban heat island effect, causing cities to be warmer than surrounding rural areas, but they also experience the “urban wind island” phenomenon, making them windier, too. Tall buildings naturally create street canyons, pushing turbulent air close to the building
façade. The warm air combined with the turbulence increases the wind speed in cities, with a peak in the afternoon in areas among low-rise buildings.3 This creates an optimal environment for building-scale wind generation.
During the last decade, architects and engineers have been investigating urbanscale wind generation, often adding miniature versions of the vertical axis turbines (seen in the Texas panhandle) to office building rooftops. However, because of the variable direction and turbulent airflow within cities, these solutions are unstable. The vibrations and increased pressure these turbines create result in diminished performance, increased noise levels,
limited functionality, and component wear down, therefore generating little energy.
“Much like other approaches, we, too, started with a vertical axis wind turbine,” Griffin recounts, “but then quickly connected with experts across other industries, including motor generator designers, aerospace engineers developing maglev trains and direct drive motors, and architects. The game changing revelation came once we included the building in our design efforts. That had never been done before.” Griffin and his team of engineers, aerodynamicists, and architects were determined to create a solution that could capture the abundance of turbulent wind in our cities and use that energy to power our buildings. “Traditional wind turbines are loud, due to vibration and turbulence. The blades of our turbines are magnetically levitated and achieve laminar airflow, which eliminates vibration, making our units near silent and also dramatically scales up production output per square foot. These innovations have made Net Positive a reality,” Griffin adds.

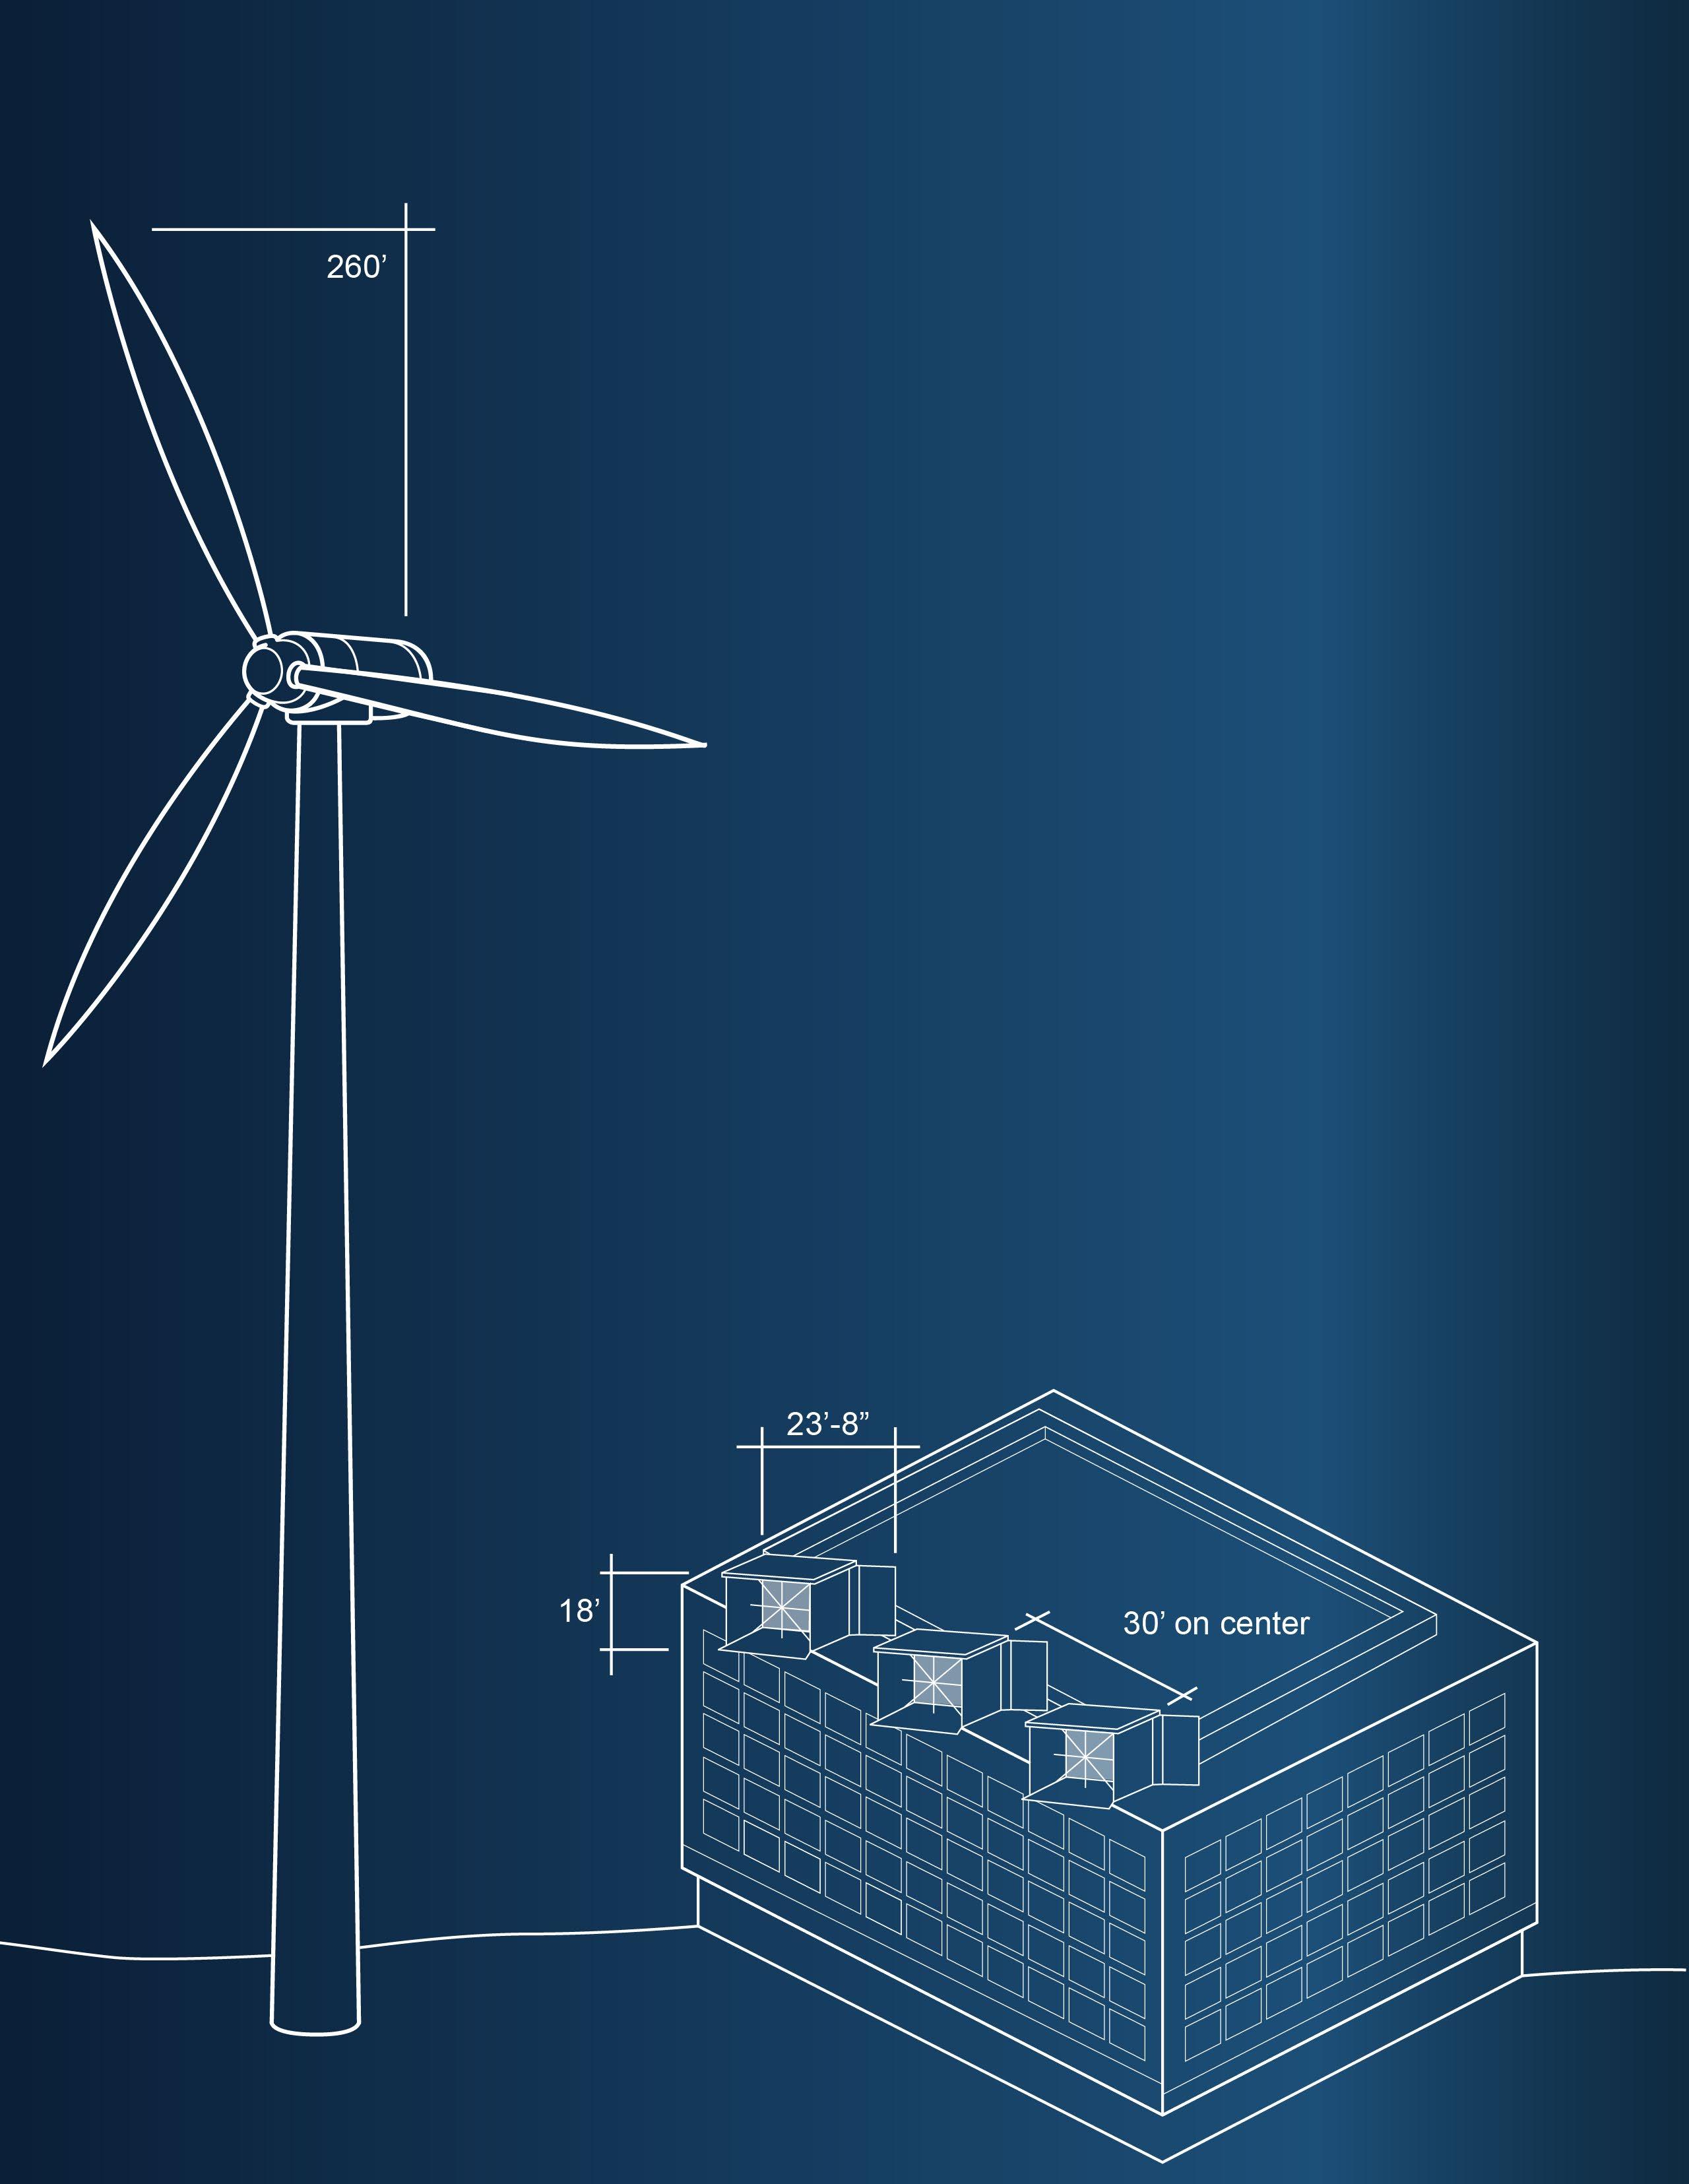
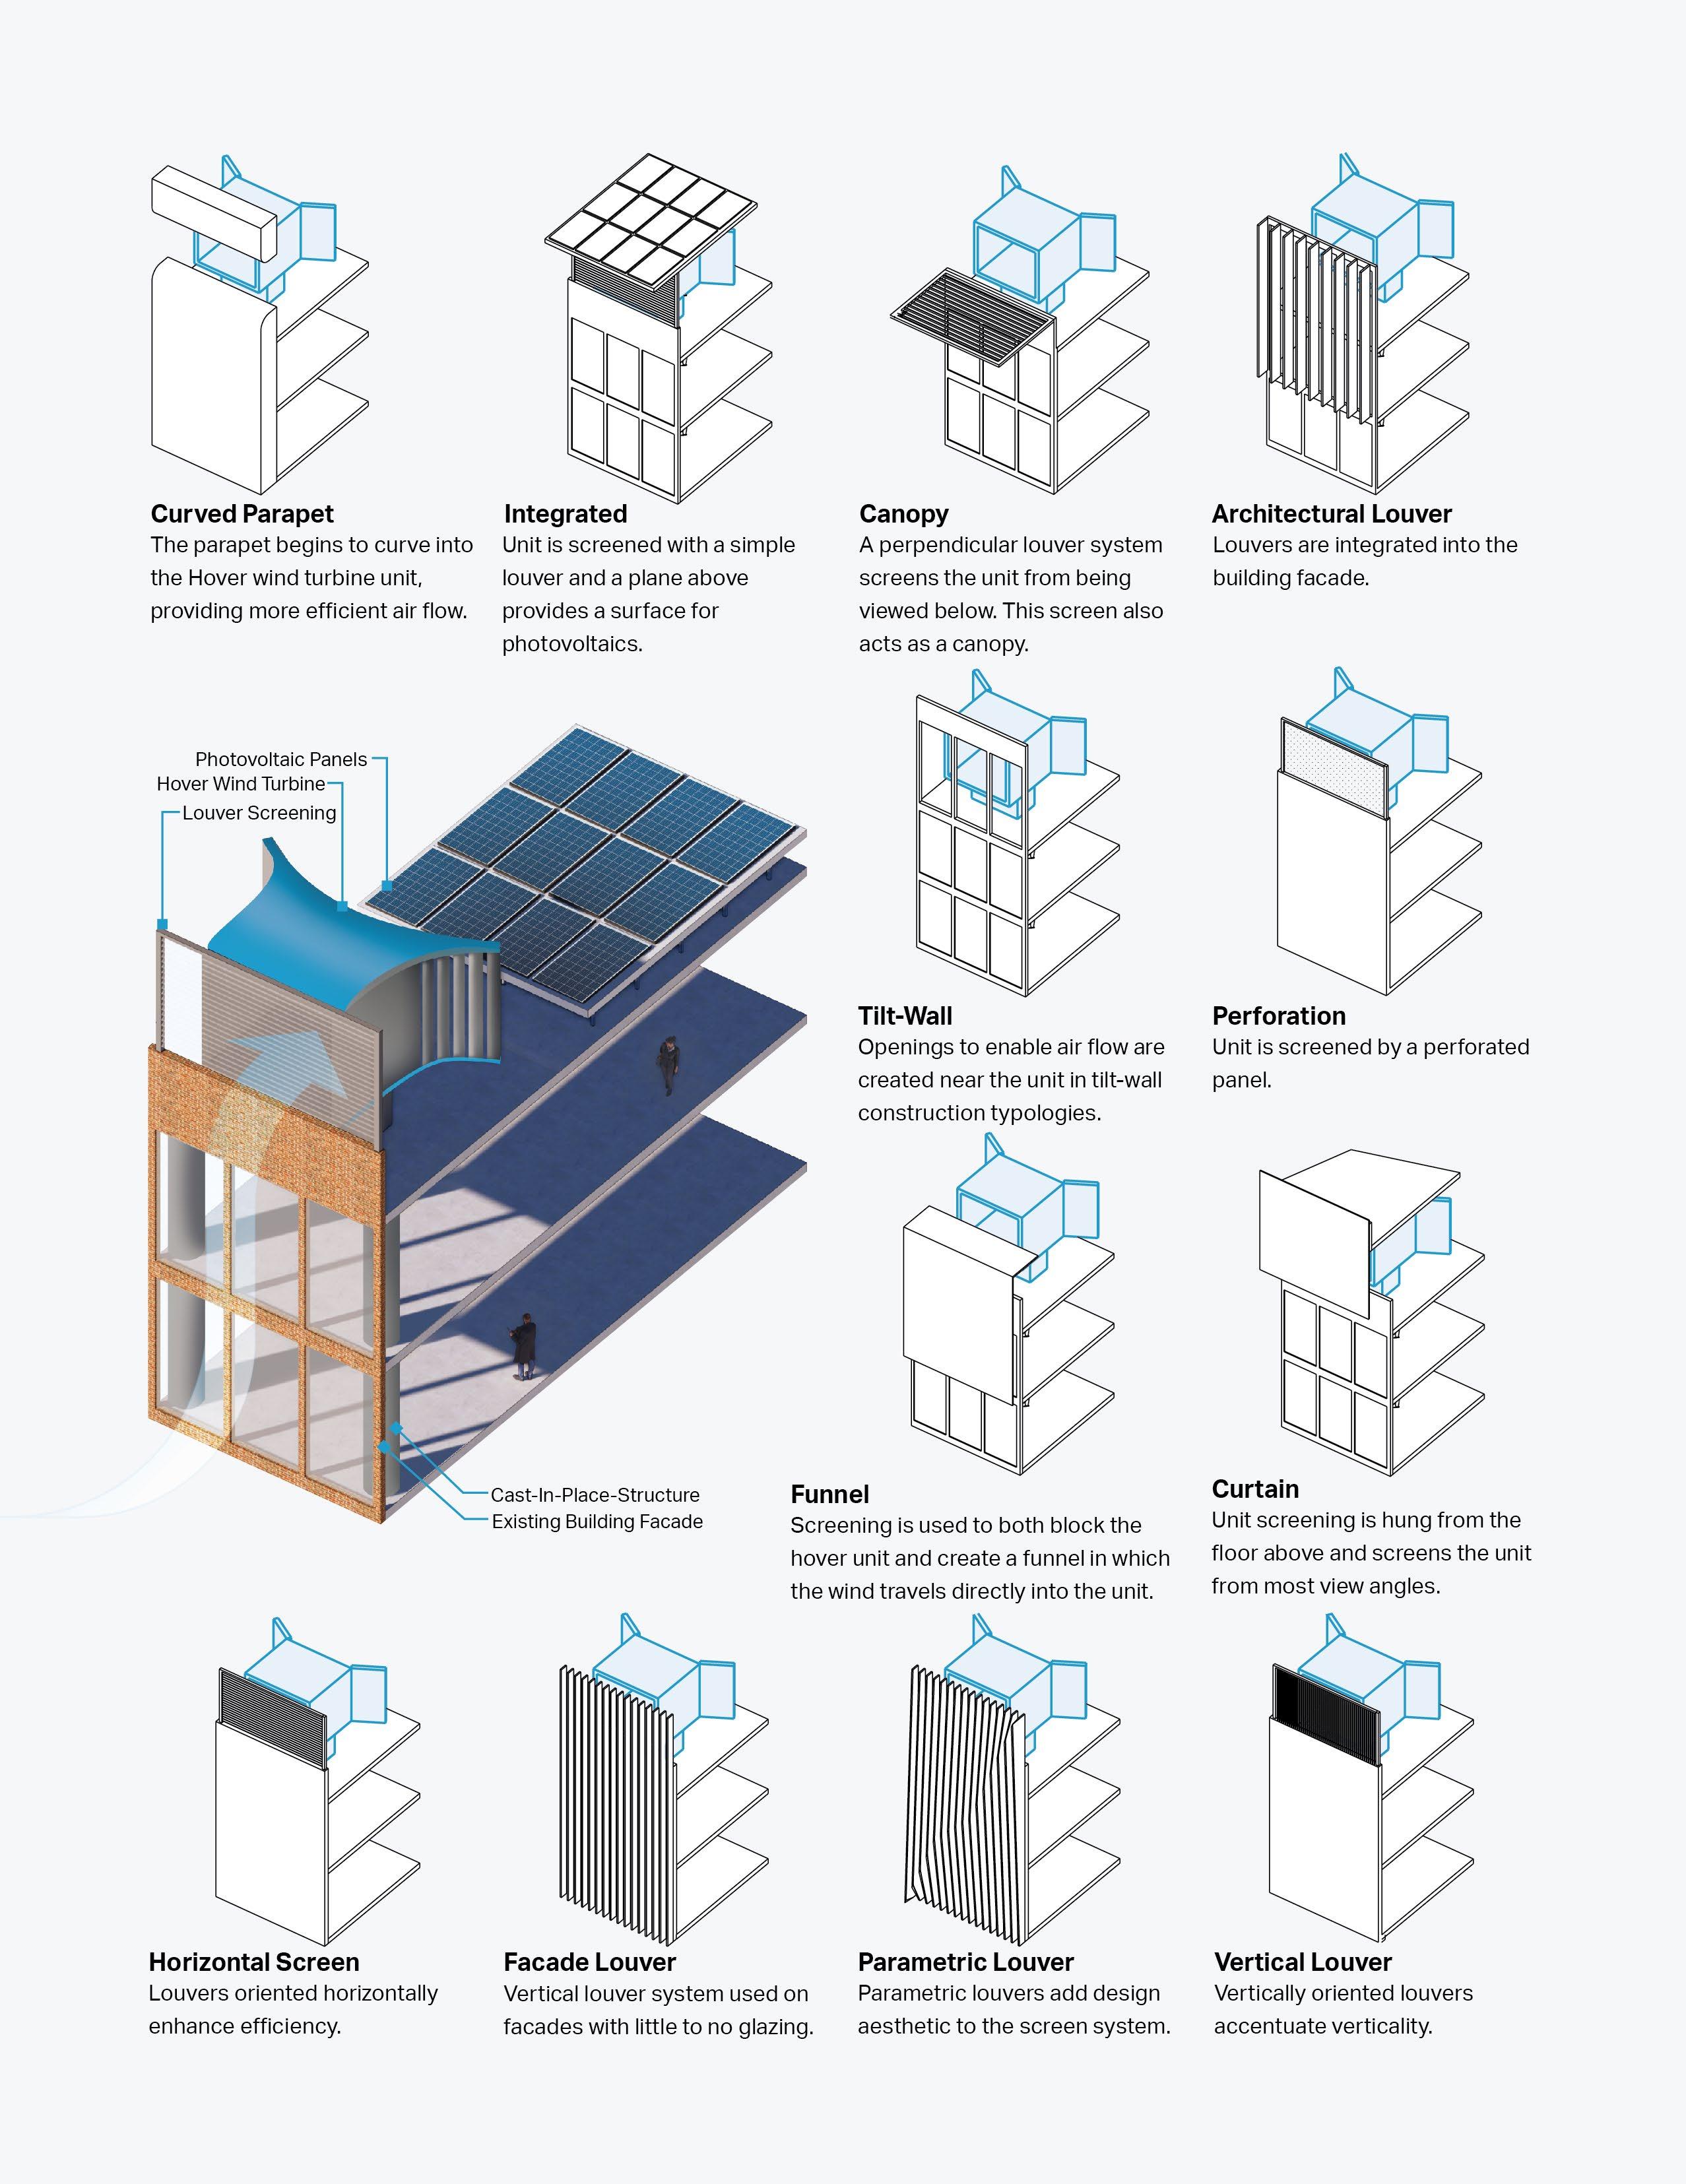
The Hover Energy wind turbine is the first ever magnetically levitated, magnetically powered wind turbine, carefully designed to achieve laminar airflow — uniform airflow in both velocity and direction. This reduces vibration, allows the rotor to spin silently, and dramatically increases the efficiency of the system, resulting in a greater amount of energy produced. But it doesn’t end there.
WHAT THIS MEANS FOR BUILDING DESIGN
In order to maximize efficiency, the shape of the building matters significantly. “The updraft on the windward edge of the building has a tremendous impact, in addition to the horizontal wind you get across the building,” Griffin explains, “you need to capture both.” To do this, wind turbines are mounted in an array along the windward edges of building rooftops, harnessing the wind flow, and generating energy day and night.
For architects planning to integrate on-site wind energy generation — whether in new construction or retrofitting an existing building — aerodynamically designing the building to direct wind into the turbine array can increase how much energy is produced, and therefore reach net zero faster.
WHEN THE SUN SHINES
Historically, employing multiple renewable energy sources means choosing between one or the other. This isn’t because wind only blows when the sun isn’t shining. It’s because the energy generated from solar PV panels converts into direct current (DC), while wind energy converts into alternating current (AC). “We don’t have an energy problem — we have an energy conversion problem,” says Griffin. While combining energy sources at the grid level is common — using active switchgear to toggle between multiple power sources — it is not common at the building level.
One solution to this conversion challenge is the Integrated Energy Management System (IEMS) within the Hover Wind-Powered MicrogridTM. The IEMS combines the energy generated by both wind (AC) and solar (DC) into one clean power stream — something that has never been achieved at the building scale before. “We are installing wind-powered microgrids — which no one else is doing yet,” Griffin explains. “People think this is happening everywhere, but conversion is only happening on the MACROgrid. We are putting it on a MICROgrid.” Combining renewable resources, buildings can now generate enough reliable power to cover more than 100% of the annual energy consumption with zero added transmission infrastructure.
On October 13, 2021, the U.S. Department of Energy (DOE) announced a $61 million investment to deploy new technology for the design of smart buildings to accelerate renewable energy adoption and grid resilience — with the goal of reaching a net-zero carbon economy by reducing the building sector’s contribution to the climate crisis.5
Potential Solar Energy
Potential Wind Energy
STORE OR SELL
A building scale microgrid — a localized energy system that generates and distributes its own supply of energy — operates at all times, enabling owners to become gridindependent.
Historically, buildings with a solar-only option must remain connected to the utility grid. That’s because solar panels only generate electricity during the daytime, making nighttime electrical use grid-dependent — and when the grid goes down, so do your solar panels.4
It’s natural to assume that a building powered by on-site renewable energy would be safe from utility blackouts during extreme weather events. However, when wildfires blazed across California in 2020, homeowners with solar rooftops were shocked to find themselves without power. That’s because solar installations need a backup system that can store and provide electricity for use when the sun isn’t shining — and when these renewable energy resources are unavailable, electricity from the grid supplies the building in whatever form of fossil fuel is available. Going completely “off-grid” requires more than just solar panels — it requires multiple energy sources and a way to store and manage electricity use on-site, without relying on the grid for backup.
“If one adds batteries and software to the right mix of wind and solar, you have a fairly reliable asset.”
— Tom Kiernan, CEO, The American Wind Energy Association2
Cost-effective storage solutions like batteries are necessary for grid resilience and are becoming increasingly affordable for both short duration applications — with prices declining by 90% for lithium-ion batteries in electric vehicles since 2010 — and also for long duration applications — with prices for grid management batteries declining by two-thirds in the same time.1 Decarbonizing the grid increasingly relies on renewable energy generation and battery storage, together. But for all buildings to decarbonize, battery life needs to mature. According to the 2021 Global Wind Report, a study of California’s grid decarbonization found that it would require up to 55GW of long-duration storage by 2045 — more than 150 times the state’s current storage capacity.1 We not only need better batteries, we need more.
Combining wind, solar, storage, and an IEMS system like the one designed by Hover, creates a microgrid that not only resolves market volatility through load shifting and time-ofuse practices, but can be specifically designed to produce enough power to supply the building each year — and then some. But what do building owners do with the surplus? There are three options: they may decide to store the excess energy on site for personal use in case of emergencies; they could stay connected and sell any excess energy back to the utility grid, for a small revenue stream; or they may choose to share the surplus with the surrounding community.

POWER TO THE PEOPLE
In most cases, U.S. wind resources are located in areas where many people don’t live — which means that getting renewable wind energy to towns, cities, and communities requires large amounts of transmission infrastructure. For example, the world’s longest underground transmission line connects the wind-rich areas of northern Germany with major consumption areas further south — a 700km line that spans almost the entire country,6 which is only slightly smaller than the state of Montana. While isolated wind farms (both onshore and offshore) are an increasingly important part of the renewable energy utility mix, deploying transmission lines from the windiest regions to markets in need is a growing challenge.2
With microgrids, transmission is from rooftop to outlet — and as more and more of the urban and suburban environments employ microgrids, the challenge for transmission is significantly reduced. This would enable more wind generation to enter the utility mix in a distributed way. Introducing smart grids that use technologies like Hover’s IEMS system, in addition to improved forecasting and scheduling tools, will enable companies to better understand energy variability, and ultimately increase the amount of energy generated in this country.2
Even better, when a building’s smart grid uses blockchain for micro-transactions, grids can begin to share with each other, offloading excess energy as the load demands. “Our goal is to make power ubiquitous. But more importantly, how can our buildings become contributors to the community around us?” asks Griffin. “With Hover, yes, a building can be completely off the grid, and then some, but it also depends on your building. Burj Kalifa? Not yet. But a large distribution warehouse, absolutely. It is possible to provide 200-300% power on a large distribution center, just with the wind turbines — if we add solar, we generate even more. So, the question becomes, what do you do with that extra 200% power? My answer is always — sell it to your neighbor. Create a microgrid for your community. Why not do community power on-site, on a building that is already there, rather than using new land for community solar programs dozens of miles away?”
This is why big box companies — Walmart, Target, Home Depot — are such an interesting typology. These stores are distributed across cities of varying population sizes. In some cases, these stores are strongholds in a community — people trust these stores to support them in their everyday needs. Here, people buy groceries, shop for clothes, and even… pay their electric bills. What is more of an everyday (and every season) need than electricity? Creating transparency for a broader range of consumers regarding where their energy is coming from, who is providing it, and how they are contributing to the reduction of greenhouse gas (GHG) emissions will not only help close the gap between energy volatility and vulnerability everyday customers are prone to experience, but more importantly, it will set us on a path to decarbonization.
In 2017, Walmart announced Project Gigaton, an initiative which encourages suppliers to reduce “beyond-theshelf” GHG emissions from the global value chain. The goal is to avoid one billon metric tons, or one Gigaton of CO2 emissions (the equivalent annual emissions from 211 million passenger vehicles) from global value chains by 2030. Walmart was the first retailer with an emissions-reduction goal approved by the SBTi.7
Scaling up wind energy generation will require cooperation between grid infrastructure and government policy, improved standards, supply chain regulation, environmental protection, and so much more.1 Creating transparency, and gaining community interest and adoption, is a necessary first step.
The winds of change are coming.


IDEA IN BRIEF
THE REALITY
The 21st century electric grid will require different ways to generate power. One of the ways we can extract power is through use of kinetic energy, or energy in motion.
THE PROBLEM
Today, most people don’t have a relationship with their energy other than the monthly bill they receive in the mail.
THE SOLUTION
The prosumer model is encouraging people to control their energy production and consumption with more transparency and agency.
Joltz
ENERGY GENERATION CAN BE A WALK IN THE PARK — LITERALLY
Historically, when we think about personal energy generation, we think of rooftop wind turbines or solar panels atop our businesses or at our residences. Over the past decade, these technologies have seen vast improvements in the amount of energy able to be generated, the price to enter the market is steadily dropping, and multiple avenues to participate have been created. This has turned many people into prosumers — people who both PROduce, conSUME, and actively manage their personal generation by storing, selling, and trading energy.
WORDS TO KNOW
pro·sum·er (prə’sju:mə) noun — a person who both consumes and produces energy — a person actively engaged in managing their energy. In some states, prosumers can not only buy electricity from the market, but also sell it back to the market through various programs.
While prosumerism is on the rise in the U.S., certain circumstances can quickly preclude would-be prosumers from entering the market. Geographic location on both the national and local level can easily determine where and when gains can be realized from both solar and wind installations. Financial strain can also be a deterrent, especially when panel installation costs can take anywhere from 7-20 years — depending on location — to cover with the savings you gain from a home solar installation.1 And what about multi-family residential properties? Net-metering enables renters to participate in the renewable energy market, typically offsetting the costs of shared community spaces, but not personal offset.
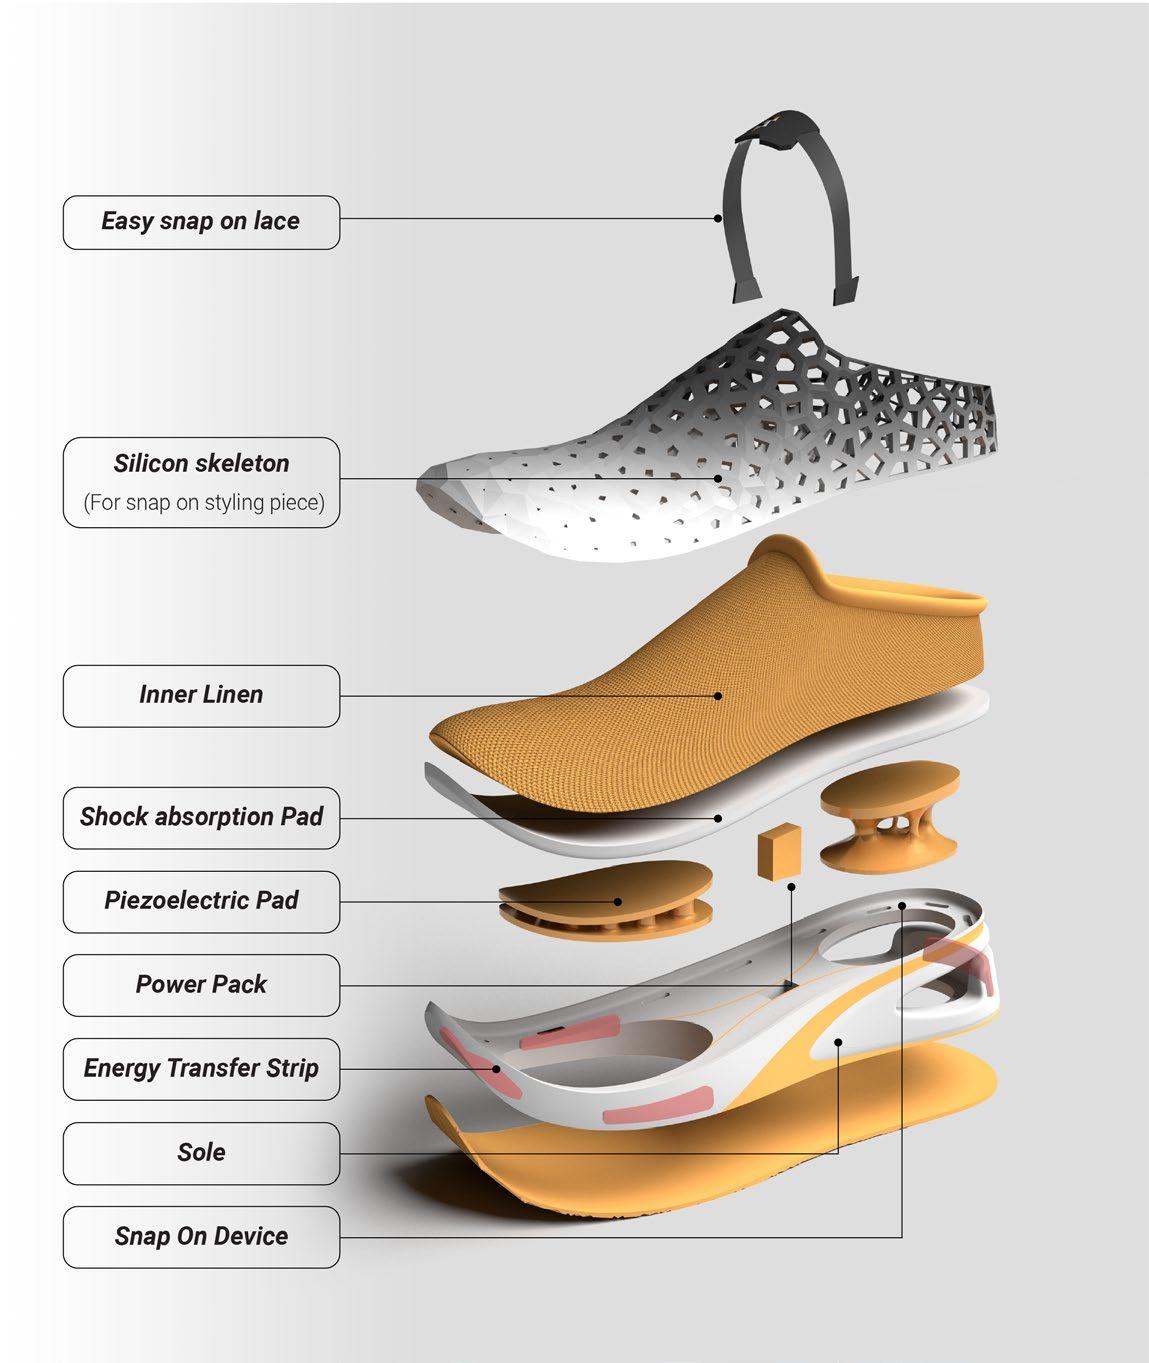
What if personal energy generation was as easy as walking to work, going for a jog, or letting your kids play longer? With a pair of Joltz sneakers — it can be. In the summer of 2021, Corgan hosted a two-week summer intern design sprint where students explored the end-user’s relationship with and impact on the built environment from a different perspective. One of the projects investigated combining in-sole piezoelectric technology with an energy-to-currency exchange system to create Joltz — a concept shoe that enables movers of all shapes, sizes, ages, and socioeconomic backgrounds to generate energy with each footstep they take.


Your Energy is Now Currency
In a prosumer model, a person can treat managing their electric bill like a game – changing their energyuse behavior by leveraging the data and tools available. Through a paired smartphone app, the Joltz wearer can exchange this energy as a currency. Each stored charge can be later used for instantaneous transfer at a series of quick transaction points throughout cities where people already participate in currency exchange for services such as city buses, rail turnstiles, parking meters, or even ATMs. As batteries continue to develop on their current trajectory – getting smaller and storing more – this can mean significant savings for everyday citizens.
What is Piezoelectricity?
Piezoelectricity is the ability of a variety of materials to generate an alternating current (AC) voltage when subjected to vibration or mechanical stress through compression, tension or torsion — like taking a step — and then storing that stress as an electric charge with a battery.2
Harvesting energy from pedestrian footsteps is not new. British-based company, Pavegen, has been harvesting foot traffic through piezoelectric tiles in highfoot-traffic places like Dupont Circle in Washington, D.C., or even in high school campuses like Bloomington High School South in Indiana. Each Pavegen tile can create about 4.76 joules of energy, which translates to 8 watts — about enough to power an LED lightbulb.3
Sidewalk tiles, however, are semi-permanent infrastructure — which require planning and financial commitment. Introducing the same technology into a shoe mobilizes this infrastructure and puts the power of energy generation and use into the consumer’s hand.
Patent Pending
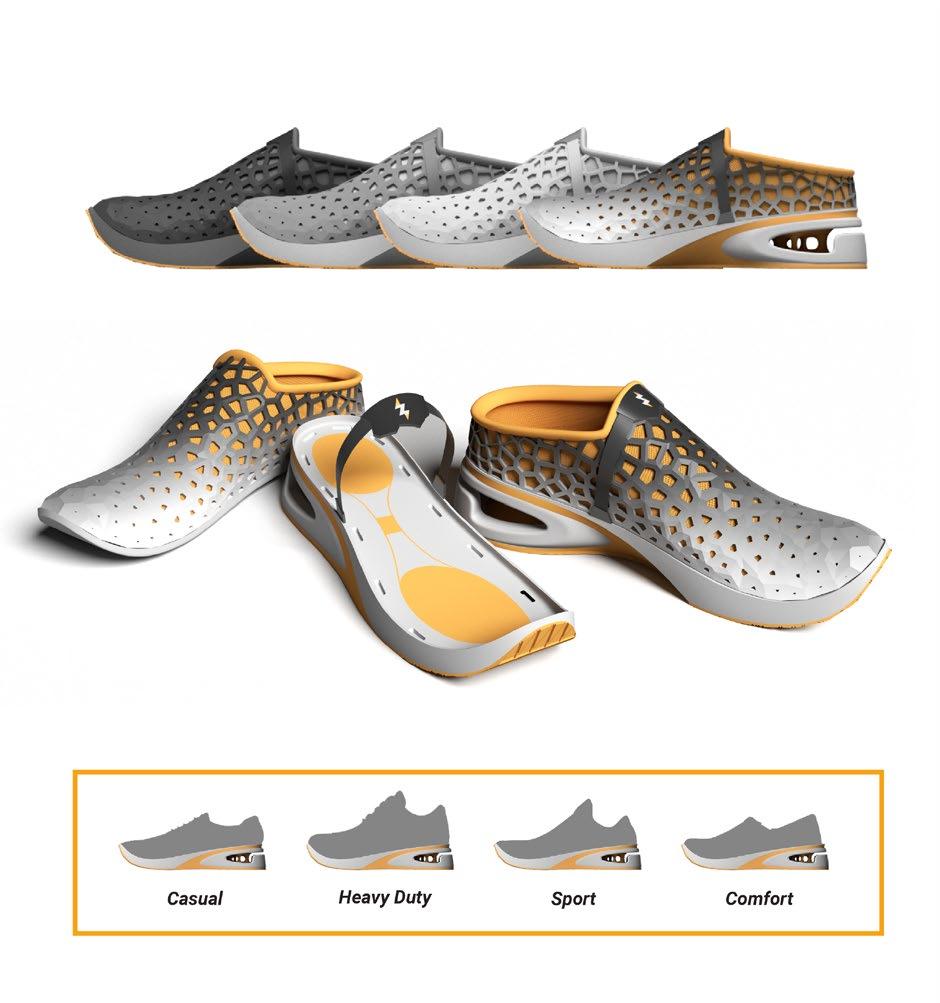
The Joltz Sneaker
Traditional piezoelectric materials — like ceramics and crystals — tend to be brittle and stiff and are therefore unable to easily flex. However, the University of Tokyo in collaboration with Ricoh has developed a much more durable piezoelectric rubber composite, which can harvest energy from more elastic movement, such as the flex from the arch of the foot.4 Using topology optimization, the Joltz sneaker optimizes the rubber composite for the flex of the arch and concentrates significant touchpoints at the heels and outsoles, where much more direct, axial, compressive stress is exerted.
The removable shoe sole houses a light-weight battery that temporarily stores the electrical charge generated from each step. This sole can be tapped or docked for quick energy transfer — changing the way we personally interface with the power grid, as well as how the grid will need to respond.
Patent Pending
With a traditional power grid, energy is lost along the entire process from generation to transmission to distribution to the final end-user. This loss can be significant. For example, in 2019, approximately 22.9 quadrillion BTUs were lost in the conversion process — that’s 60% of the entire energy input into the system.5 Storage — especially in the form of batteries — are creating the potential to move the electricity grid from a “just-in-time instantaneous electricity generation and delivery system” to something far more flexible, resilient, and economically efficient.
Prosumerism — Democratized
It’s common practice today to track your steps, physical activity, and health through a range of affordable wearables. Joltz taps into that existing behavior. For example, the typical nurse records approximately 15,580 steps a day, which could translate to a 12.5kWh charge. Compare that to the typical household electricity consumption of 28.9kWh per day — that’s a significant gain! And in a household of four with various step profiles, we could easily see those daily costs covered. Households previously precluded from participating as prosumers for one reason or another now have a low-risk way to enter the personal energy management market.
It’s not only the batteries that are rapidly morphing. As the grid quickly evolves, the use cases — how and where batteries can be deployed and used for currency exchange — do as well.
What if Joltz were a part of a school donation program? Not only would school children have new shoes to start the year (removing one burden from the parents) but throughout the day, as kids naturally play, run, jump, and change classes, each child is generating energy. Their shoe soles can be docked during quiet time, or while doing desk work, transferring the energy to the school’s collective storage system. Additionally, quick transfer locations in the cafeteria could ensure each student has money for the school’s food program, while also transferring the energy to the school to reduce their monthly electricity bill.
Joltz is the first step in responding democratized prosumerism — empowering the everyday person to become grid-resilient, independent, and selfsustaining with every footstep.


Want piezo-electric shoes today? Try out this Instructables Workshop6 which teaches you how to create shoes that charge your phone with some basic tools!
Energy Storage
The Importance of Energy Storage
Why renewable energy will depend on storage technology.
V2X Parking Garage
How bidirectional EV charging could integrate with the built environment.

Energy-asPayment
Mobile and distributed energy credits.
The Nissan Pavilion
Accepting electricity as payment for parking.
Evolving Standards + Safety
How energy storage will impact building design.

“As the saying goes, the Stone Age did not end because we ran out of stones; we transitioned to better solutions. The same opportunity lies before us with energy”
— STEVEN CHU
The Importance of Energy Storage
Electricity is the flow of electrons racing at nearly the speed of light from one point to another. It is also the only commodity on earth that is both produced and consumed almost instantaneously. However, unlike other commodities, electricity is a fundamentally difficult one to store for later use.
Typically, electricity has taken the form of “raw fuel in a coal pile, natural gas in a pipeline, or water behind a dam — these energy sources are eventually converted into electrical energy when the power plant is called into action and dispatched.”1 However, wind and solar fuel only show up when the wind blows and sun shines which means the grid will have increasingly less control over when and where electricity is generated.
Our ability to trap and store energy from intermittent sources and deliver a continuous supply of power will be instrumental in the creation of a renewable energy grid.
With batteries, the rule of thumb today is to add four hours of storage capability for every megawatt of capacity added.1
3,177MW
U.S. battery storage capabilities in Q3 2021 (up from 59MW in 2010)2
Energy Storage Technology
The proliferation of clean energy creates a demand for long-duration storage in places with high concentrations of wind and solar farms. Advancing these storage technologies will mean that regardless of where or when the sun shines or the wind blows, we need to find ways to accurately size, integrate, and design storage facilities into our buildings.
CHECK THIS OUT
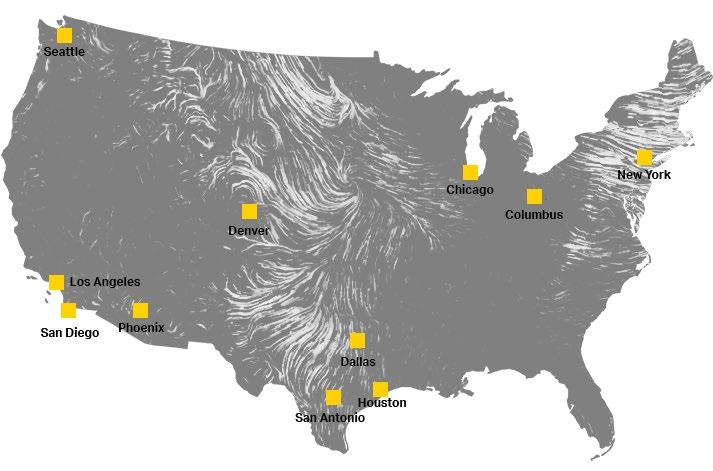
Hint.FM’s Wind Map project that uses data from the National Digital Forecast Database to make nearterm forecasts which are revised once per hour.
Visit http://hint.fm/wind/ to see the map in real time.
As our buildings move from being passive consumers on the grid to active on-site energy producers, planning for energy storage is essential and needs to be considered early in the design process.
Planning is not limited to locating where the containersized battery will be sited (and how many will be needed). Understanding which type of storage is right depends on how the client values continuity of operations, energy rates and financial benefits, or carbon usage compared to the cost of the storage solution.2
The AIA points out that “designing for [passive] energy conservation and efficiency is essential to reducing the first costs of any renewable energy system; the less energy the building uses, the smaller the renewable energy system”
and subsequent storage solution needs to be Next, determining what application the battery should serve and when is key to maximizing return on investment.2
Batteries are being used more widely for on-site renewable energy storage and are increasingly reducing in size, improving the technology and increasing capacity. These incremental gains will make batteries more cost-effective storage solutions in the near future. Other incentives to consider are Federal Investment Tax Credits, which specifically lower the cost of storage if coupled with renewable energies, as well as state incentives for storage.2 If on-site battery storage isn’t possible for the present, “the design should absolutely plan for battery storage in the future.”2
Source: HINT. fM.5
CURIOSITY REPORT 2022
Batteries
All batteries are devices that “provide electrical power from a chemical energy source.”3 The electrochemical reaction in a battery involves the transfer of electrons from one material to another through an electric current. Batteries have a particular advantage in that they can be deployed across the entire grid in a distributed manner.
Some batteries may be recharged and used multiple times, while other batteries can only be discharged one time. If a battery is designed to be disposable, it is called a ‘primary battery’. A ‘secondary battery’ is rechargeable. The design of a disposable battery, however, is much simpler than that of a rechargeable one because it doesn’t need to incorporate the features necessary for the discharge products to be recharged.
IT’S ALL ABOUT THE SOFTWARE...
The battery itself is a “passive device and essentially a dumb brick if you don’t apply intelligence to it.”1 If no one is telling that battery how much power to absorb or release at a certain time — and for how long — it has no intrinsic value. Emerging software systems can “examine correlative relationships and identify patterns that can predict future behaviors, fade curves, and knows exactly how fast they are wearing out.”1 Companies like GE are also developing digital twin technology that integrate energy management systems within the building.
PRIMARY BATTERIES
Chemical Energy
■ Non-rechargeable
■ High internal resistance
■ Suitable for portable applications due to light design
■ Can be used in clocks, toys, and small household devices
■ Not suitable for high-cost applications
■ Low initial cost
Common Primary Batteries
■ Zinc-Carbon
■ Alkaline
■ Silver Oxide
SECONDARY BATTERIES
Chemical Energy
■ Rechargeable
■ Low internal resistance
■ Not suitable for portable devices
■ Highly recommended for backup and high cost applications
■ Highly versatile and therefore large spectrum of applications
■ Higher initial cost
Common Secondary Batteries
■ Lead Acid
■ Lithium Ion
■ Nickel Metal Hydride
■ Nickel Cadmium
Grid-Scale Energy Storage
Grid energy storage (sometimes called large-scale energy storage) is a collection of methods and technologies used to store energy on a large scale within and electrical power grid.
PUMPED HYDRO ELECTRIC STORAGE (PHES)
Potential Energy
When the sun is shining and the wind is blowing, electricity is in high supply and water is pumped to higher elevation reservoirs. When the sun goes down or the wind stops blowing, water is released back to lower reservoirs, generating the needed electricity and filling the gaps during peak demand.
More than 6% of the nation’s electricity comes from hydro power and it’s the most dominant form of energy storage on the electric grid today.6
COMPRESSED AIR ENERGY STORAGE (CAES)
Potential Energy
What if… we could use rainwater to produce and store power in our buildings? Today’s hydroelectric storage technology relies on large-scale facilities. But what if we could localize hydroelectric power at a smaller scale to help power specific parts of the building?
CAES plants are very similar to pumped-hydro power plants. However, instead of pumping water from a lower to an upper pond during periods of excess power, ambient air or gas is compressed and stored under pressure in an underground cavern or container. The air is then released from the cavern to a local gas-fired turbine to generate electricity. A traditional CAES can store energy but needs to be paired in tandem with a power plant to operate. New CAES models are being developed that operate off purpose-built storage caves that do not rely on existing geology (natural salt caverns) and can be situated wherever the grid requires them.
HYDROGEN
Potential Energy
Hydrogen energy storage is a process where surplus energy created by renewables during low energy demand is used to power electrolysis — a process by which an electrical current is passed through a chemical solution to separate hydrogen. The hydrogen can then be stored in existing gas pipelines, generating electricity at a later date.
Green hydrogen, in particular, is a fuel-type that is created using renewable energy (instead of fossil fuels) and its only byproduct is water. While there is a lot of excitement around green hydrogen, it’s currently expensive to produce.7
FLYWHEELS
Kinetic Energy
Flywheels store the kinetic energy of a rotating mass by accelerating a rotor (flywheel) to a very high speed and maintaining the energy in the system as rotational energy. The flywheel and motor-generator can be enclosed in a vacuum chamber to reduce friction and energy loss.

IDEA IN BRIEF
THE REALITY
A renewable energy grid needs to store massive amounts of energy from intermittent sources for later use.
THE PROBLEM
While energy storage solutions are advancing, they cannot currently be deployed at the scale or density required.
THE SOLUTION
Building structures that can facilitate the distribution and storage of renewable battery systems via electric vehicles, microgrids, and information energy systems (EIS).
The V2X Parking Garage
Parking garages are typically seen as a utility for parking. But what if they could store power for the surrounding community and support fluctuating energy demands?
Transitioning to a renewable power grid boils down to our ability to store as much wind and solar energy as possible. Storing energy for later use is “emblematic of the change that is taking place across the electric grid” because it will help “address the short-term intermittency issues associated with renewable energy.”1
One of the emerging technologies being developed in this arena is the ability for car batteries to offload their excess energy via V2X systems.
What is V2G and V2X?
The best EV battery on the market today can store about 100 kWh – which is enough energy to power the average home for three to four days. 2
V2G stands for “vehicle-to-grid” and is a bi-directional charging technology that allows electric vehicles (EV) to both charge and offload their EV’s energy onto various grid locations. With electrical vehicle-to-grid technology, a car battery can be charged and discharged based on local energy production and consumption. As of today, this technology is not readily available but companies like Nissan and Tesla are exploring future applications. One of the major advancements needed to realize this potential is the development of high storage battery units.
V2X means “vehicle-to-everything.” It includes a variety of different use cases like vehicle-to-home (V2H), vehicle-to-building (V2B) and general vehicle-to-grid services
Steady power output from both V2G and V2X technology could serve as a backup for emergency blackouts, stabilize the grid during peak demand times, or help buildings function as their own microgrid.2
In 2020, Bloomberg announced that battery giant CATL had developed a two million-kilometer, 16year battery. The promise of longer-life batteries would radically remake the transportation space and energy grid.3
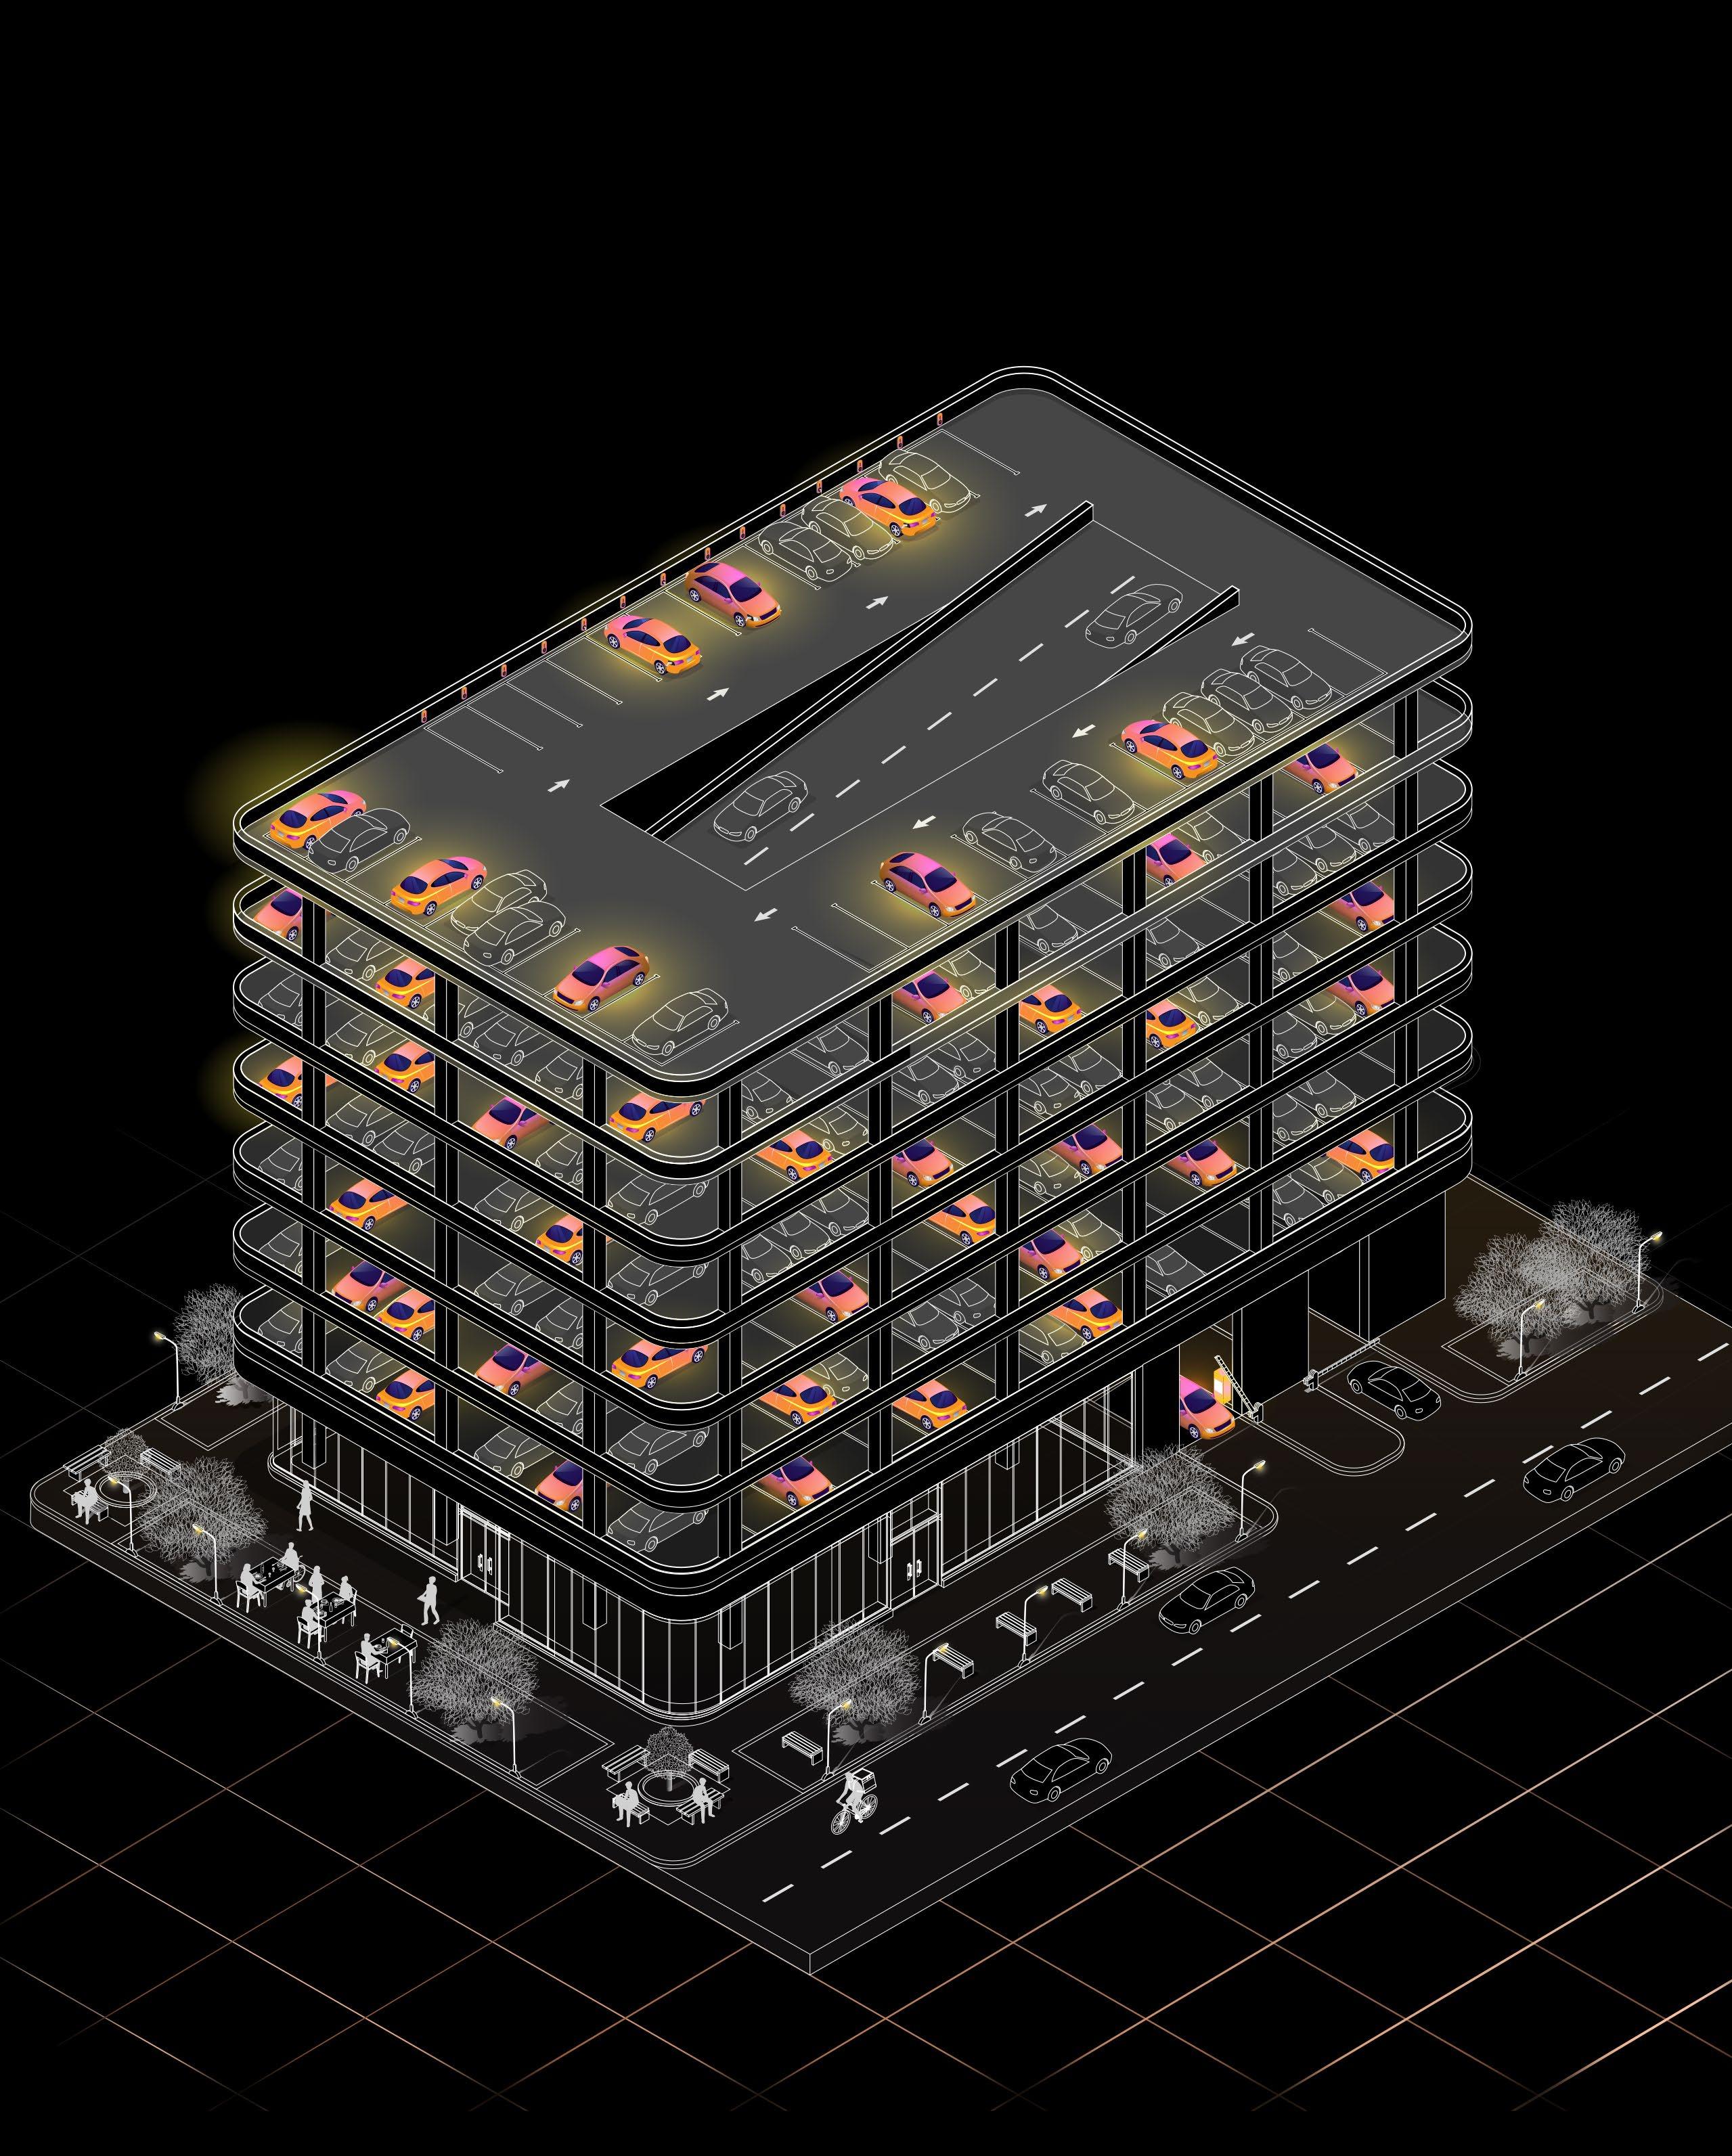
V2X Parking Garage
When EVs become less expensive than internal combustion vehicles, you will start to see [a] tipping point... Recent estimates suggest that the U.S. EV fleet may grow from 1.6 million cars on the road today to somewhere between 10 million and 35 million vehicles by 2030 – admittedly a very wide range.” - The Energy Switch by Peter Kelly-Detwiler2
Energy-as-Payment
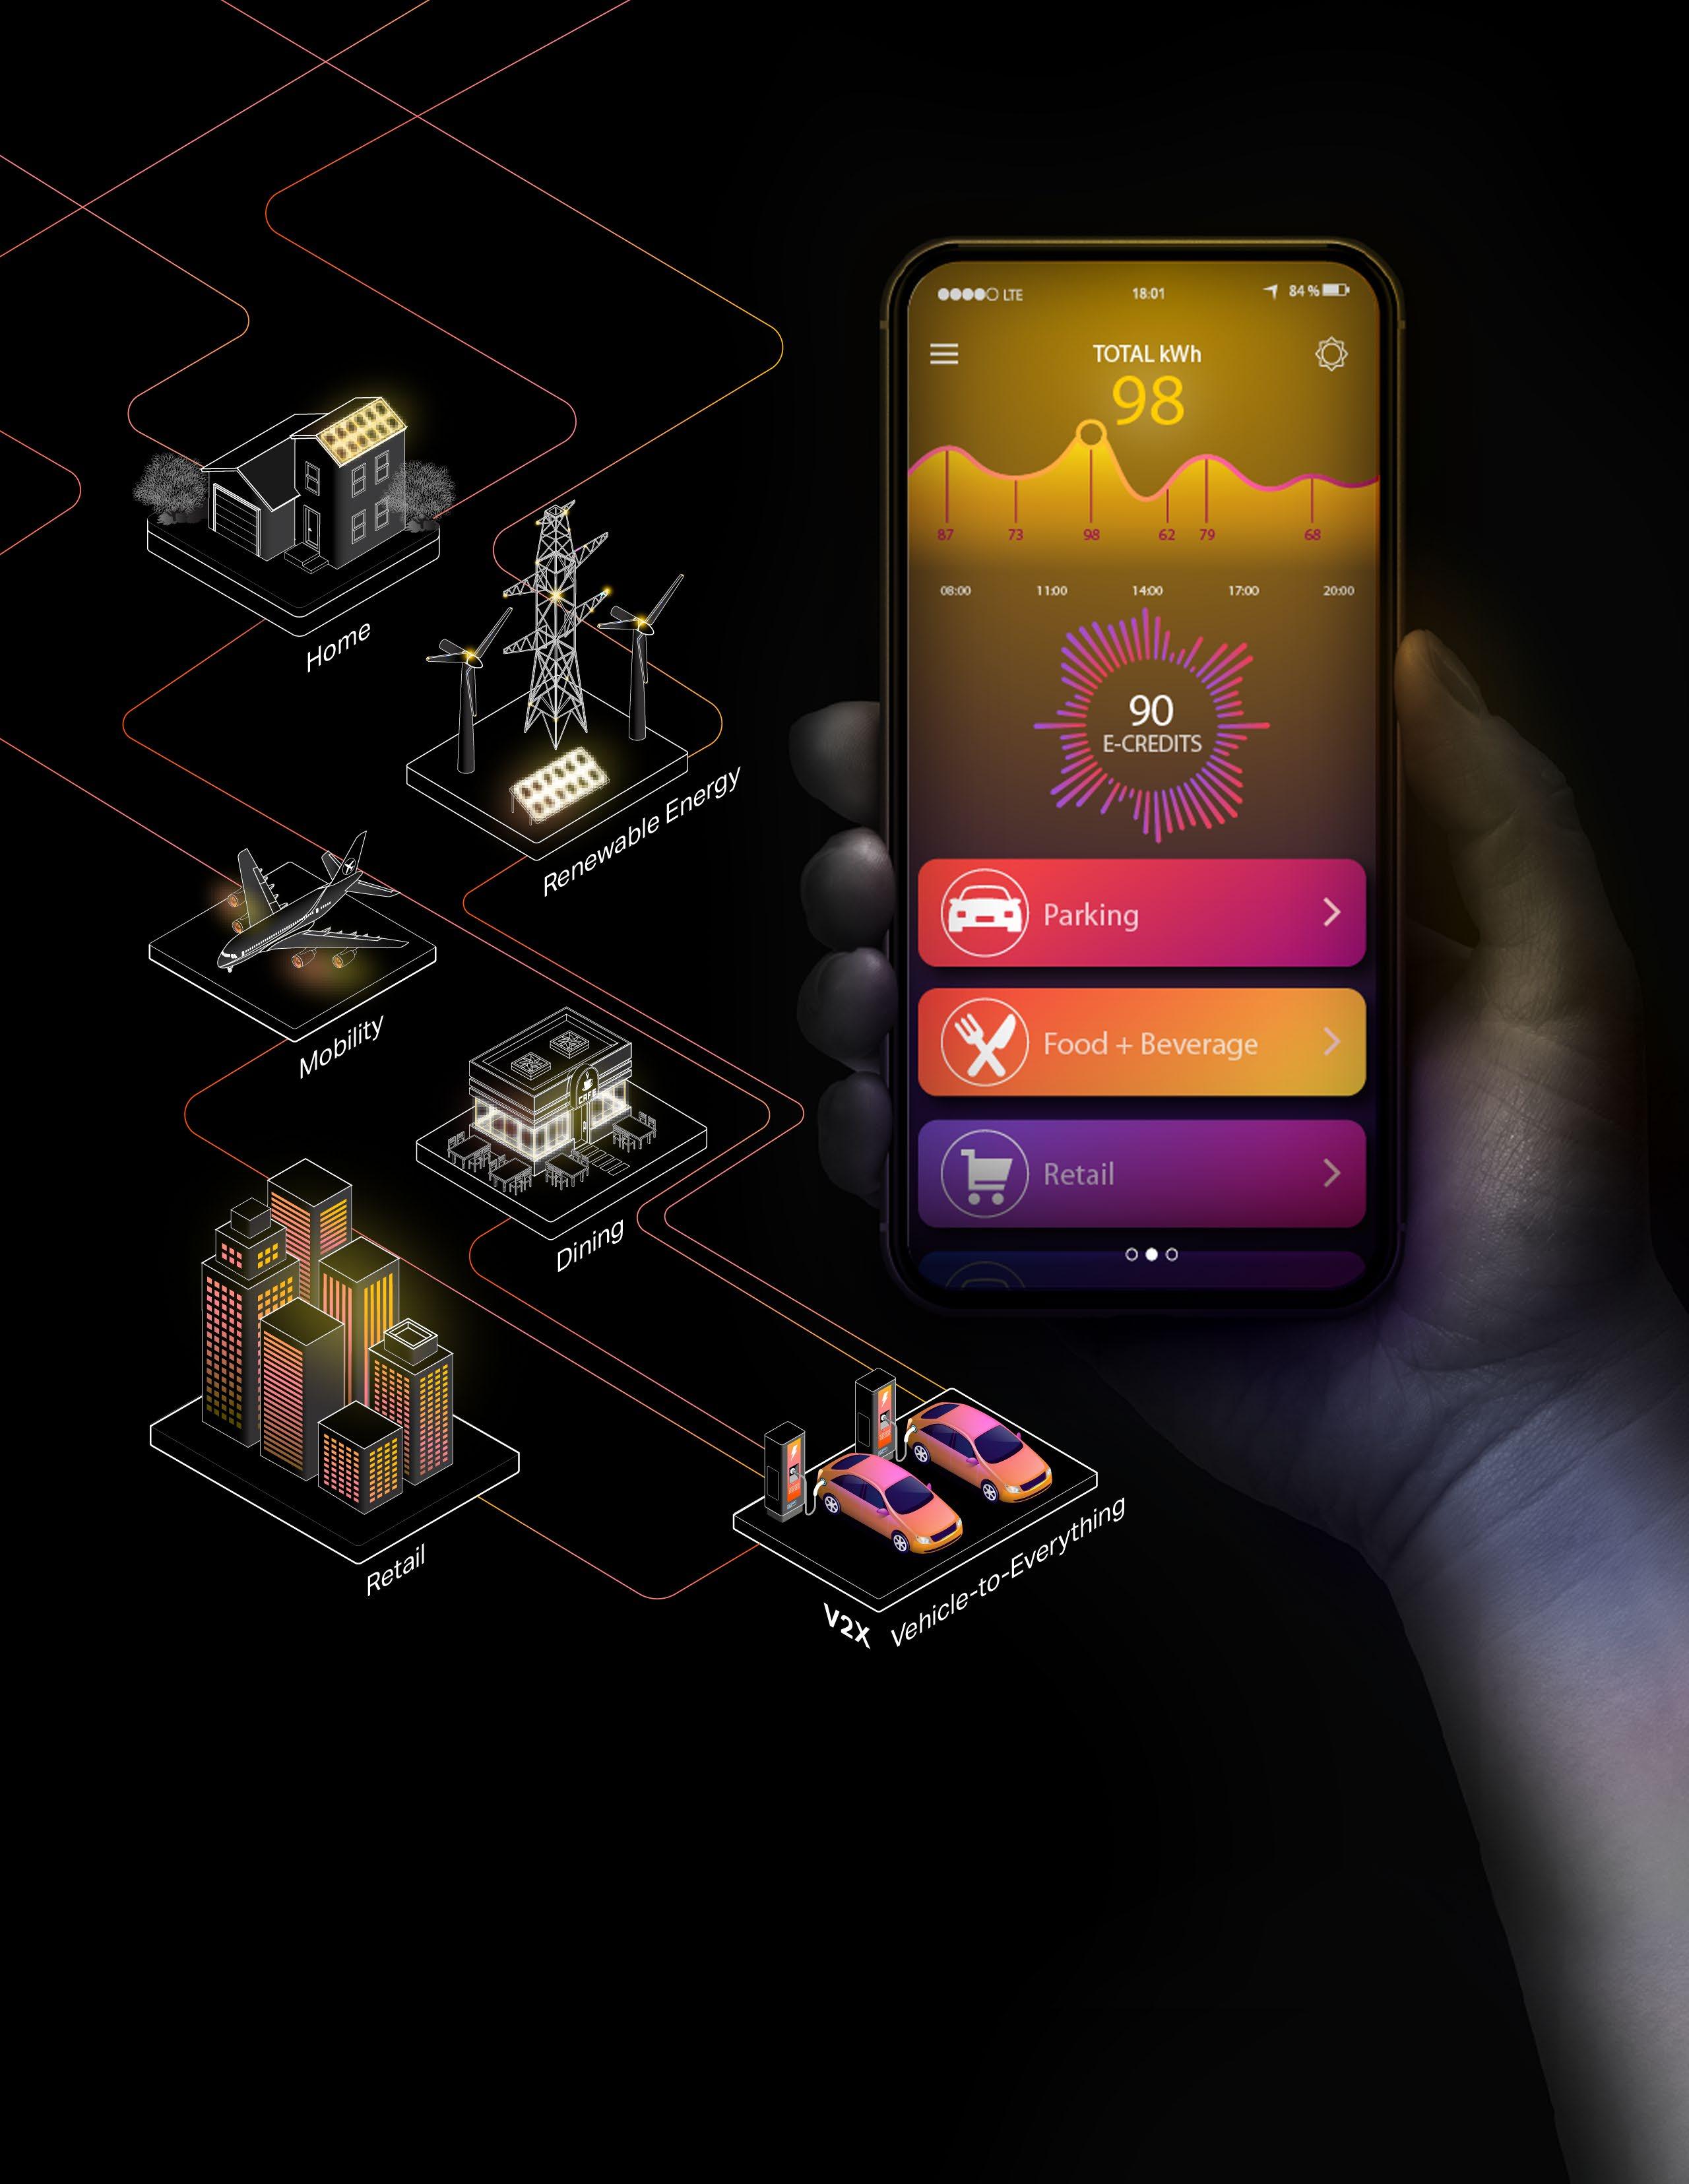
The V2G parking garage stores excess energy from parked EVs and, in turn, functions as a large battery pack for the surrounding ecosystem. In this distributed energy model, electricity storage behaves like a form of currency that enables EV drivers to charge and offload their energy in exchange for redeemed credits. Drivers can pay for parking, dinner reservations, and other nearby services using their EV’s excess energy capacity.

Hospitals, which operate as mission critical facilities, depend on backup generators in times of emergency. However, even generators need gasoline, diesel, or natural gas which can potentially be difficult to access during emergencies. A fleet of hospital EV shuttled with bi-directional battery systems could provide on-site and mobile energy storage solutions.
THE NISSAN PAVILION
From August through October 2020, Nissan Leaf drivers were able to discharge power from their car’s battery pack to pay for parking while visiting the Nissan Pavilion exhibition space in Yokohama. “The Pavilion is a place where customers can see, feel, and be inspired by our near-future vision for society and mobility,” said Nissan CEO Makoto Uchida. “As the world shifts to electric mobility, EVs will be integrated into society in ways that go beyond just transportation.” Nissan introduced the world’s first mass-market electric car, the zero-emission Nissan Leaf, back in 2010. Since then, they have partnered with governments and businesses around the world to expand the use of EVs.1
When energy is both portable and distributed as suggested in the V2G parking garage, it requires a cost profile that encourages consumers to buy and sell their excess energy at an advantageous rate. The value of renewable energy is continuously determined by local weather patterns the less sun or wind power that is readily available, the more valuable stored energy becomes. However, in this prosumer model, consumers get to decide when and how much they want to contribute to the grid at a variable market rate.
This distributed energy model also introduces regional and seasonal weather inequities. Places like the Pacific Northwest, that cannot rely on consistent solar power, would engage much differently with this energy market compared to EV drivers in the Southwestern United States, resulting in an unequal advantage for consumers closer to renewable energy sources.
This only furthers the stance that a renewable energy grid of the future requires a tapestry of solutions, rather than one single bullet.

Evolving Standards + Safety
Since EVs don’t release emissions like an internal combustion engine does, a V2X garage doesn’t need to incorporate the same level of ventilation as a traditional garage. This means that a V2X system can be located underground without having to occupy valuable real estate above ground. However, a significant amount of energy is held within a battery storage unit, which means that overheating and safety are major issues to consider.
As we consider integrating battery storage solutions into our buildings, there will need to be an evolving set of standards and code requirements that account for things:
■ Permitted amount of kilowatt per square footage
■ Updated ventilation standards
■ Safety protocols related to overheating and release of battery gases
■ Strategies that address the dynamic weight load of EV batteries
Most importantly, batteries store a lot of heat, which can result in a “thermal runaway” effect. In addition to developing advanced battery technology, companies are also exploring “improved layout and spacing of batteries within their purpose-built containers to minimize the potential for thermal runaway.”1
A recent analysis by the ICCT estimates that with the current number of U.S. EV chargers at 216,000, the country will need 2.4 million public and workplace chargers by 2030 if it wants to meet its goals.2


Energy Distribution
The Grid That Powers Us
A network of complex infrastructure.
From A to B
Domestic agricultural freight flows and their environmental impact.

The New Rivian Frontier
Amazon invests in a fleet of EVs to meet their sustainability goals.
The Changing Consumer Experience
How evolving user behaviors will require more warehouse space.
Micro-Fulfillment Centers
Reimagining the retail experience in dense urban environments.
Prioritizing the Hospital Grid
Co-locating resources and building services to support community resilience.

“The spread of civilization may be likened to a fire; first, a feeble spark, next a flickering flame, then a mighty blaze, ever increasing in speed and power.”
— NIKOLA TESLA

The Grid That Powers Us
If you’re reading this anywhere in North America, you’re more than likely connected to the largest machine ever constructed in human history — the North American power grid. As you flip a switch and effortlessly summon electricity, you rely on a complex network of over 7,700 power plants stitched together by over 160,000 miles of high voltage transmission lines, 2.7 million miles of mid to low-voltage distribution lines, managed by over 3,300 utilities.1 Carefully coordinated by numerous regulatory entities, this patchwork of interdependent systems is orchestrated into the symphony that makes modern life possible.
Today the electric grid provides reliable power to over 145 million customers across three major grid regions: Eastern Interconnection, Western Interconnection and the Electric Reliability Council of Texas (ERCOT).1
These interconnections provide redundancies and allow electricity to be directed from one grid to another if needed. Such a vast, complex system requires strategic oversight and cooperation by myriad entities. But while regulatory oversight is now crucial to the operation of the grid, the power grid remained largely unregulated for much of its history. Many of the regulatory entities that govern the energy grid today were born out of cooperative means to ameliorate the impacts of energy crises and prevent future ones from occurring.
Every five minutes, each power plant bids into the wholesale markets at a price at which they are willing to sell, with each bid based on its own economic requirements. Those plants with higher operating costs will only bid in when they can cover their cost. Most days across the country, especially in the spring and fall, it’s relatively easy to manage electricity supply and demand. Those seasons are the Goldilocks periods — neither too hot or too cold — when demand is softer owing to reduced heating and cooling loads, and many power plants are taken down for routine maintenance. However, during weather extremes, and most especially the intense heat waves of summer, the entire grid comes under significant stress.
As consumers are able to produce their own localized power in the foreseeable future, the way energy is distributed and managed will need to evolve.
“What’s really shaking up the grid these days are the new on-site technologies — such as solar panels and batteries — they allow the consumer to generate and store electricity for the first time.”
— The Energy Switch by Peter Kelley-Detwiler2

Grid Supply Chain & Infrastructure
The power grid consists of many levels of infrastructure which requires constant maintenance and employs an army of engineers and technicians. Energy generation encompasses a long, complex supply chain of moving parts. Petroleum for example, which remains a leading source of fuel for industrial power generation, must be extracted, transported via ship or pipeline, refined, again transported for further processing or to power generating facilities where it can be converted to electricity. The electricity generated must be stepped up in voltage for long distance over
transmission lines, stepped down at local substations for distribution on mid-low voltage distribution lines and finally connected to homes and businesses. The astronomically high cost of all this infrastructure is what has historically given power utilities a natural monopoly over the industry, as the exorbitantly high cost of entry bars smaller entities from entering the market. When you pay your electric bill, you not only pay for the electricity you’ve used, but the distribution infrastructure as well.
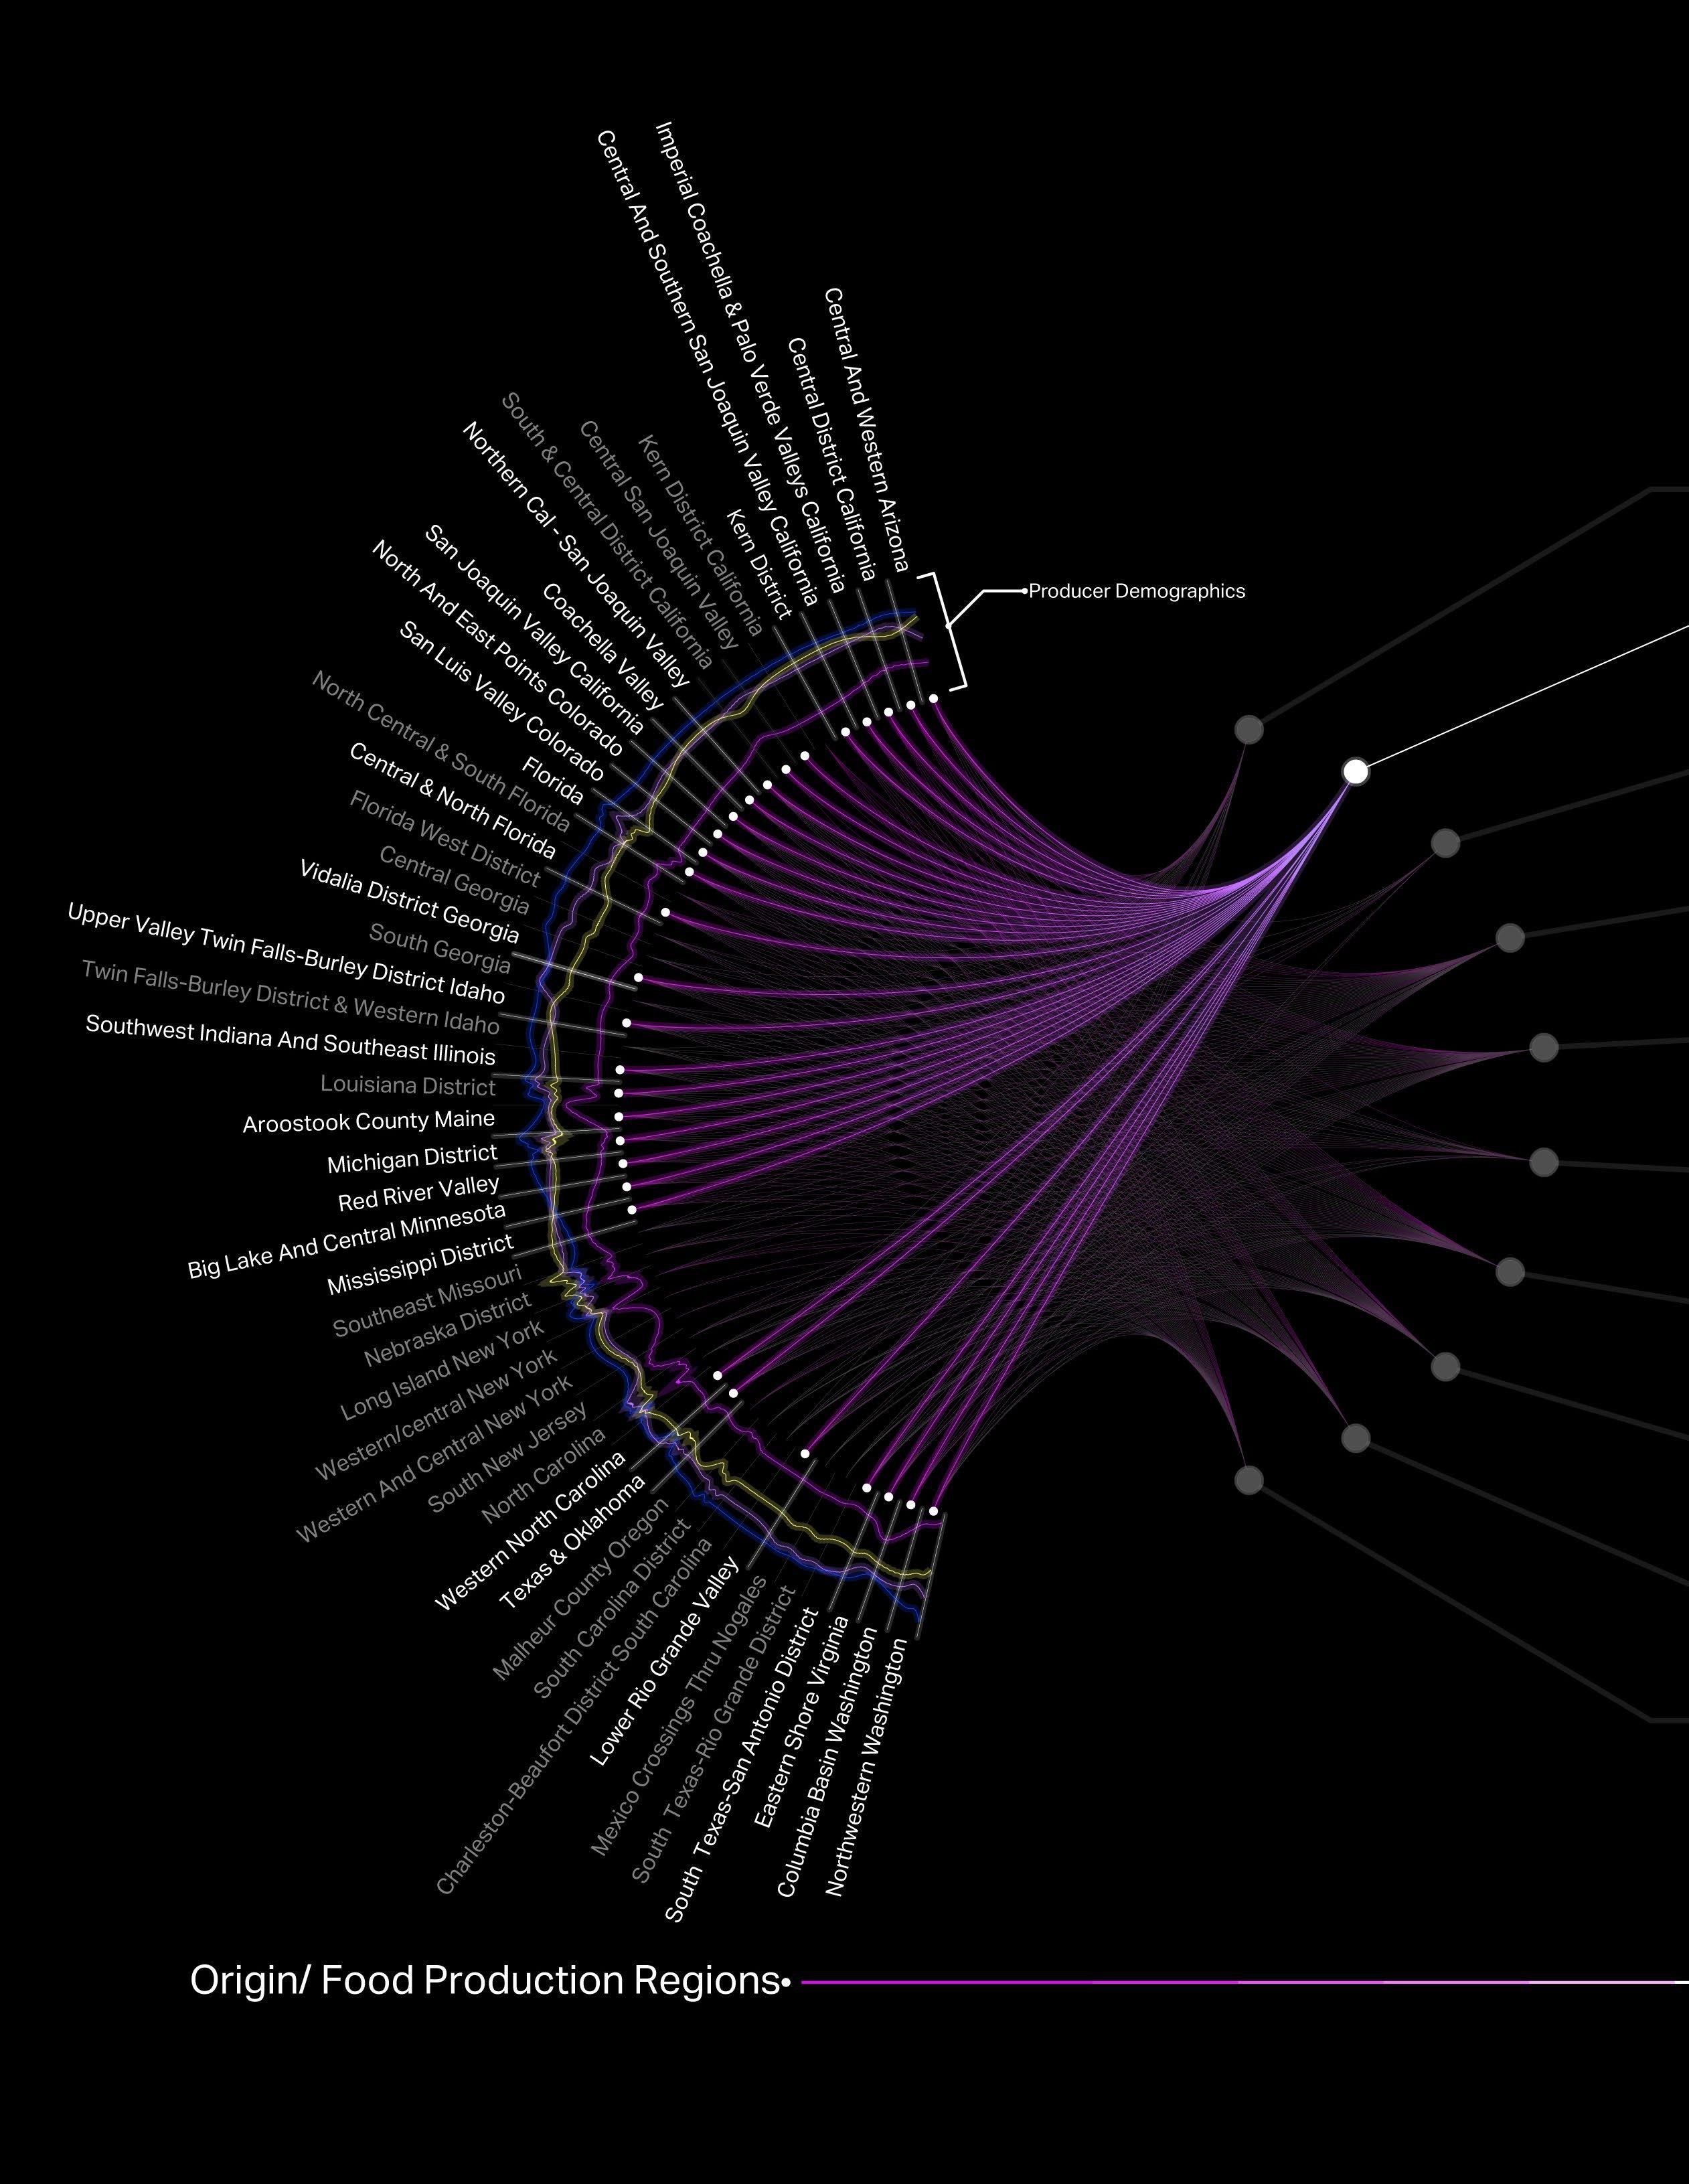
Food Miles Study
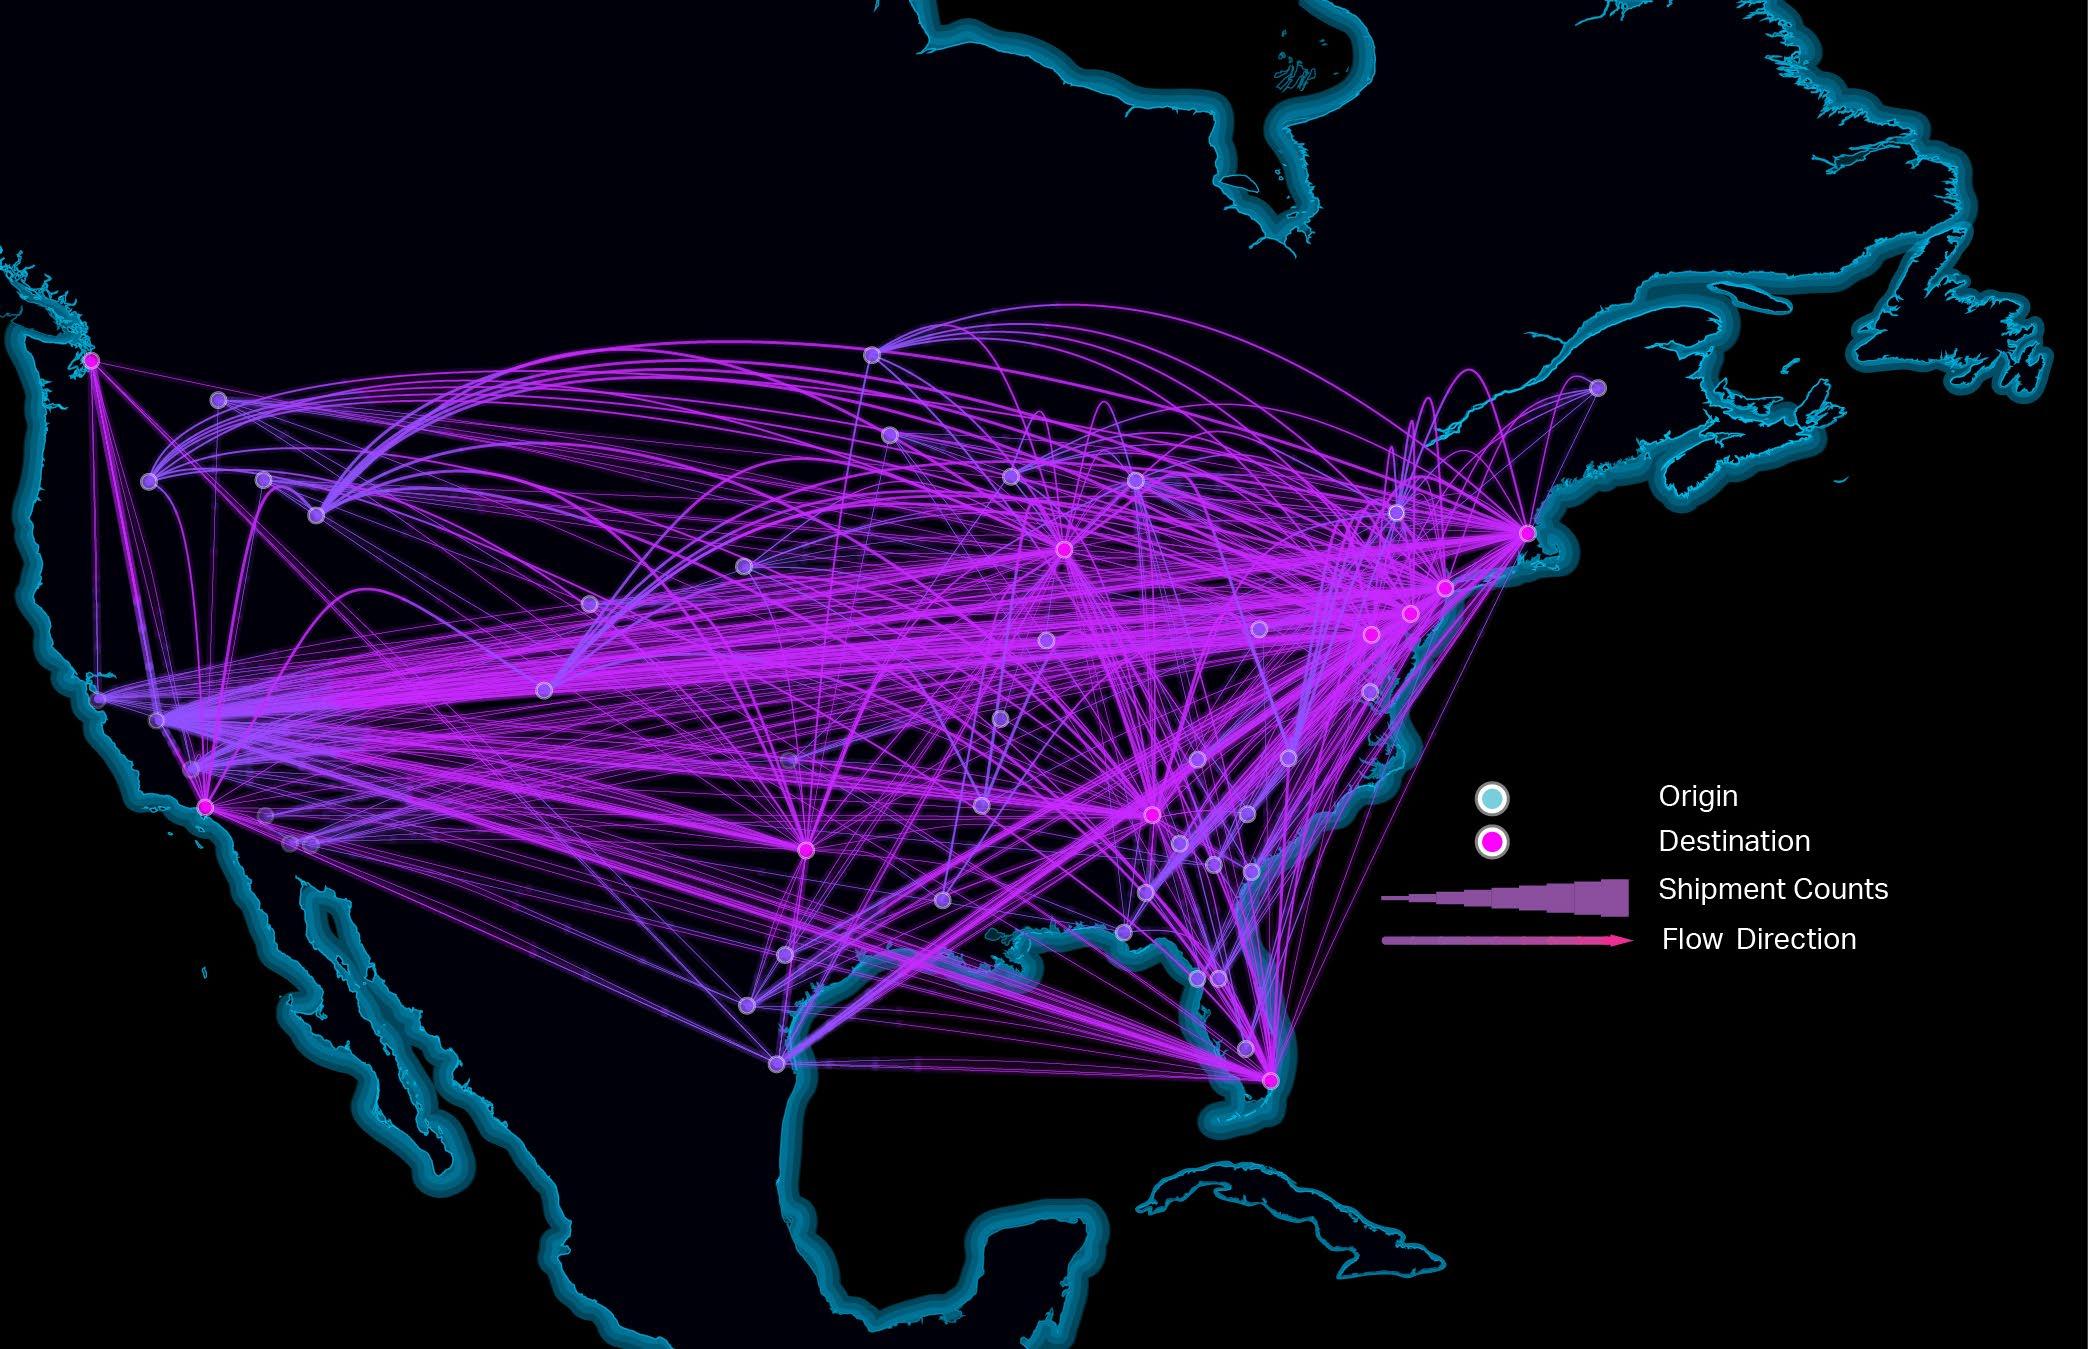
The following study examines domestic agricultural freight flows and calculates high level estimates of energy consumption and environmental impact. It also explores how on-site food production at scale may help to mitigate those impacts via reduced foodmiles. Agricultural products are the single largest user of freight services in the United States comprising 24% of freight services across all modes by tonnage and 27% of all ton-miles. Additionally, trucks account for 83% of agricultural freight movements by tonnage and 88% by market value.1 Our distributed network of highways will continue to be the backbone of our agricultural transportation system and can provide critical first and last mile connections to higher volume modes of transport.


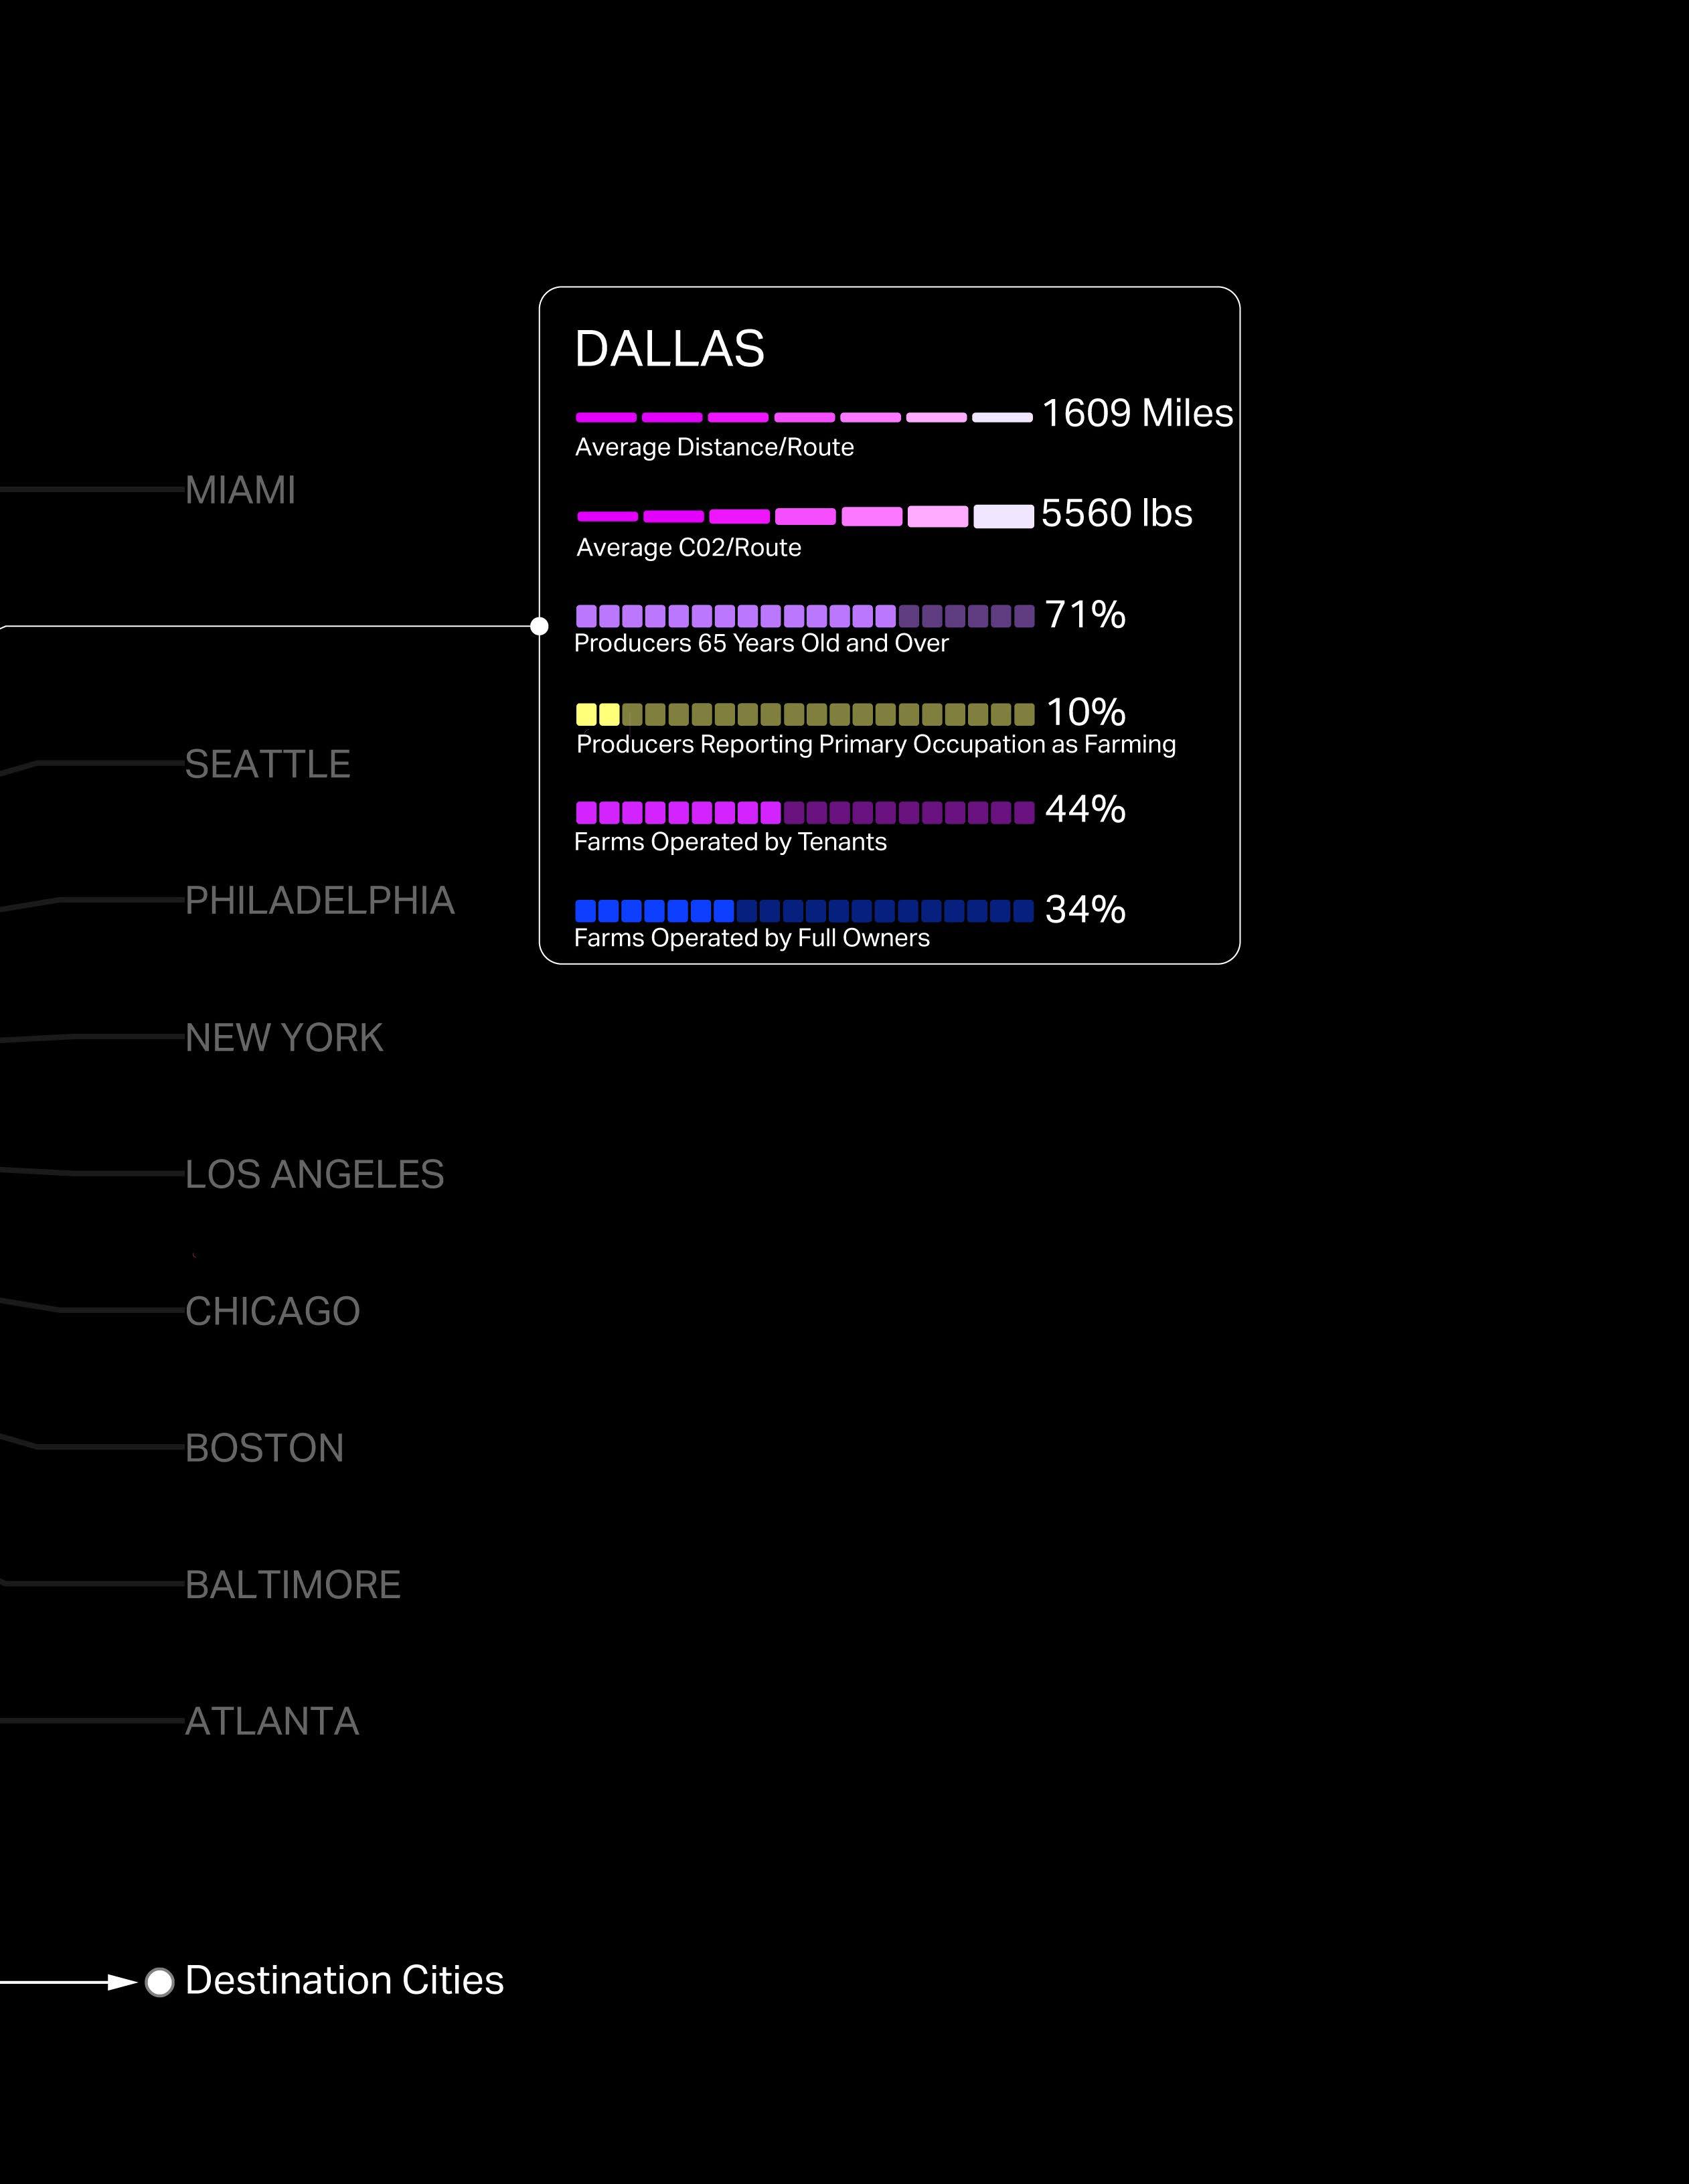
From A to B
THE FOOD THAT FUELS US
Amongst the top ten U.S. cities, domestically cultivated agricultural products travel an average of 1365 miles to reach their destination. Given an average miles per gallon fuel burn rate for a conventional semi-truck, and an average of 22.46 lbs of CO2 per gallon of spent diesel fuel, we can roughly estimate an average fuel consumption and CO2 emissions per domestic refrigerated truck route as 210 gallons of diesel fuel and 4714 lbs of CO2 1
When agricultural highway freight flow data over the preceding decade are aggregated, we can estimate average annual fuel consumption and carbon emissions. On average, long haul highway shipments of agricultural products are responsible for roughly 938,775 gallons of spent diesel fuel and 21,084,895 lbs of CO2 respectively. 1
Under the assumed conditions of this exercise, if we imagine a scenario where the average trip length of agricultural products is reduced from approximately 1400 miles to 50 miles, average annual fuel consumption and carbon emissions related to highway transport of agricultural products, would drop to roughly 224,945 gallons of diesel fuel and 777,271 lbs of CO2 respectively.
Agriculture Freight Flow Patterns: The Future of Food Distribution
THE MODERN FARMER
Almost 71% of farmers who supply agricultural goods to the following ten U.S. cities are over the age of 65. That means nearly three quarters of farmers who support these major U.S. cities are at or nearing retirement age. As they leave the workforce and insufficient workers take their place, there will be gaps in the food supply chain leading to increased cost, inefficiencies, and vulnerabilities to disruptions.
AUTONOMOUS TRUCKING AND THE NEED FOR EV INFRASTRUCTURE
The long-haul trucking industry has been a primary focus for autonomous vehicle technologies. With significant investment and R&D, the trucking industry is likely to see the rise of autonomous long-haul trucking in the near future. Most autonomous truck concepts rely on electric batteries rather than fossil fuels.
As farmers age into retirement and transportation infrastructure is reimagined for both electrical and autonomous vehicles, how might we integrate on-site food production? For more information related to on-site food production, read Vertical Farming on page
98
1,400mi is the average distance food travels
4,700lbs of embodied carbon [released] per typical route
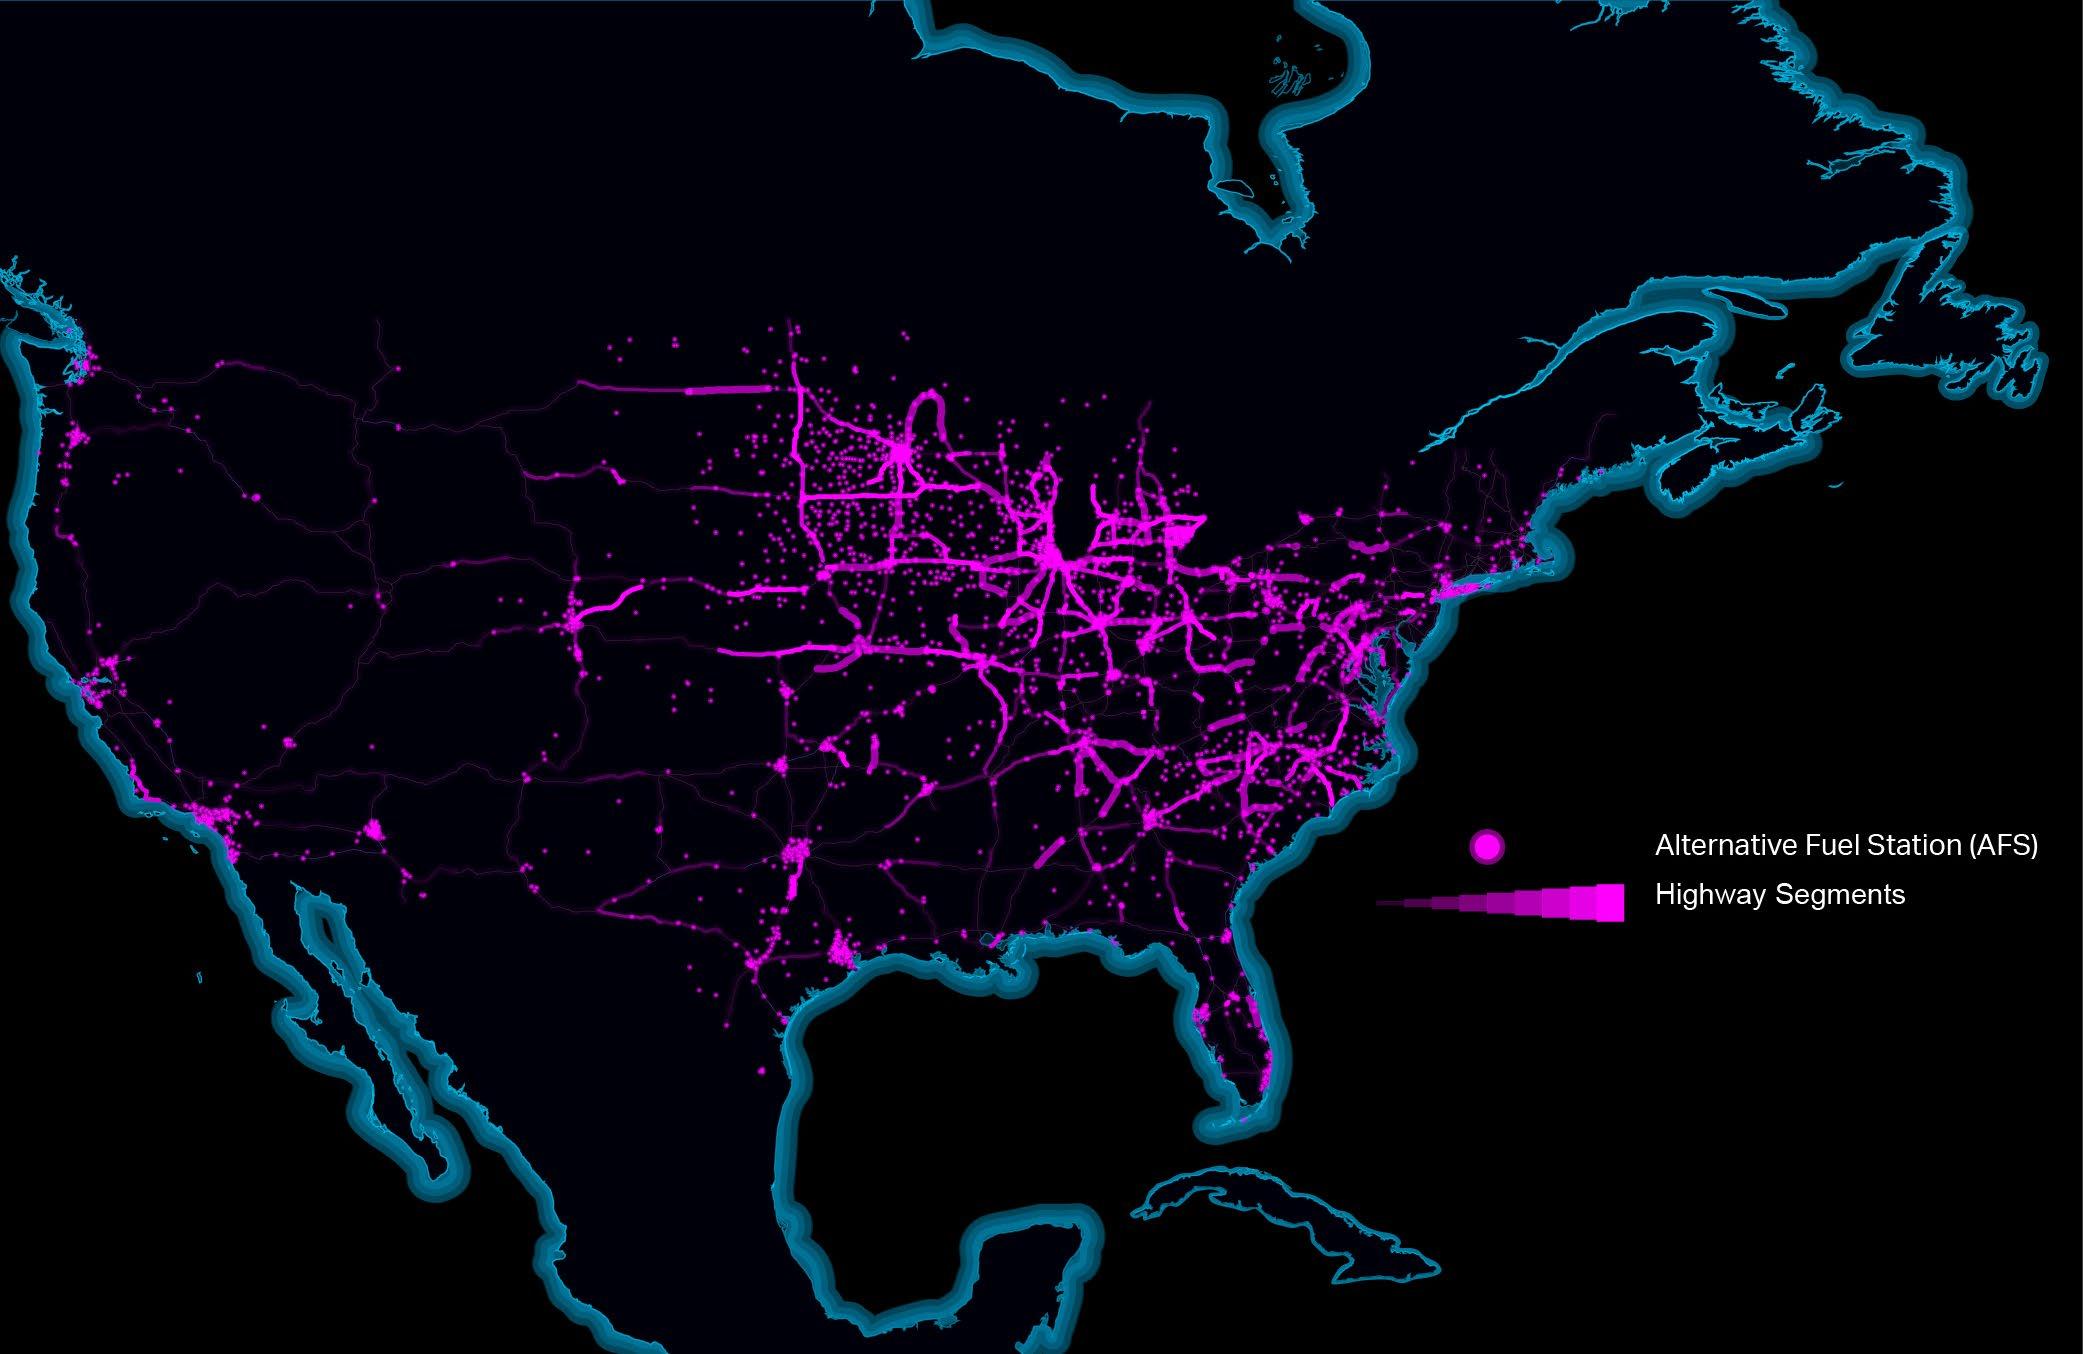
This map illustrates the relationship between alternative fuel station (AFS) locations and major corridors of the national highway system. AFS locations are mapped to points along their closest highway segment. The number of AFS locations along each highway segment is counted. Highway segments with a greater number of AFS locations are visualized with thicker line weights and increasing brightness, highway segments with fewer AFS locations are visualized with thinner line weights and decreasing brightness.
The New Rivian Frontier
It’s no secret — the transportation sector is one of the biggest offenders when it comes to climate pollution. It accounts for 29% of the total U.S. greenhouse gas emissions, and 82% of these emissions come from light, medium, and heavy-duty trucks, making delivery companies like Amazon think differently about how to address its environmental footprint.1
As the nation’s leader in online retail, Amazon annually delivers more than 10 billion items worldwide via gas-guzzling planes, vans, ships, and you guessed it — trucks.2
Due to pandemic-fueled online shopping, Amazon’s carbon emissions skyrocketed by 19% in 2020.2 As a result, minimizing its significant impact on the environment is high on Amazon’s priorities as Jeff Bezos announces plans to become carbon neutral by 2040.2
To meet this goal, Amazon is investing in several key transportation technologies — from the 2020 acquisition of Zoox, an all-electric, fully autonomous vehicle, to ordering 1,000 autonomous driving systems from self-driving truck start-up.2 Most recently in 2021, Amazon has also developed micro-mobility options like autonomous delivery bots and delivery bikes for last-mile deliveries in dense, urban environments.2
More recently, Amazon’s determination to operate their entire fleet off of renewable energy has led to a strategic purchase of 100,000 electric delivery vehicles from Rivian, an EV startup that focuses on pickups, SUVs, and adventure vehicles tailored to the end-user.3
Amazon has invested more than $1.3 billion in Rivian. Amazon’s 20% stake in the business is now worth more than $21 billion. 2
Rivian is hoping to leverage the growing market of pickup truck owners — a market expected to account for one-fifth of new cars in the coming years3 According to Edmunds, a site that provides comparative data on automobiles, Rivian’s R1T “out-accelerates, out-corners and out-brakes every truck we’ve tested,” which is a very attractive feature for a company that promises next-day delivery.4
Adding Rivian to the nation’s sprawling logistics network is the first step in decarbonizing the grid, making on-demand delivery of goods cheaper, faster, and most importantly, more environmentally friendly.2
2019 U.S. Transportation Sector GHG Emissions by Source
Source: Environmental Protection Agency (EPA)1 Light-Duty Vehicles Medium & Heavy-

Using human-centered design principles, Rivian has developed a series of lifestyle products that integrate seamlessly with their vehicle design.

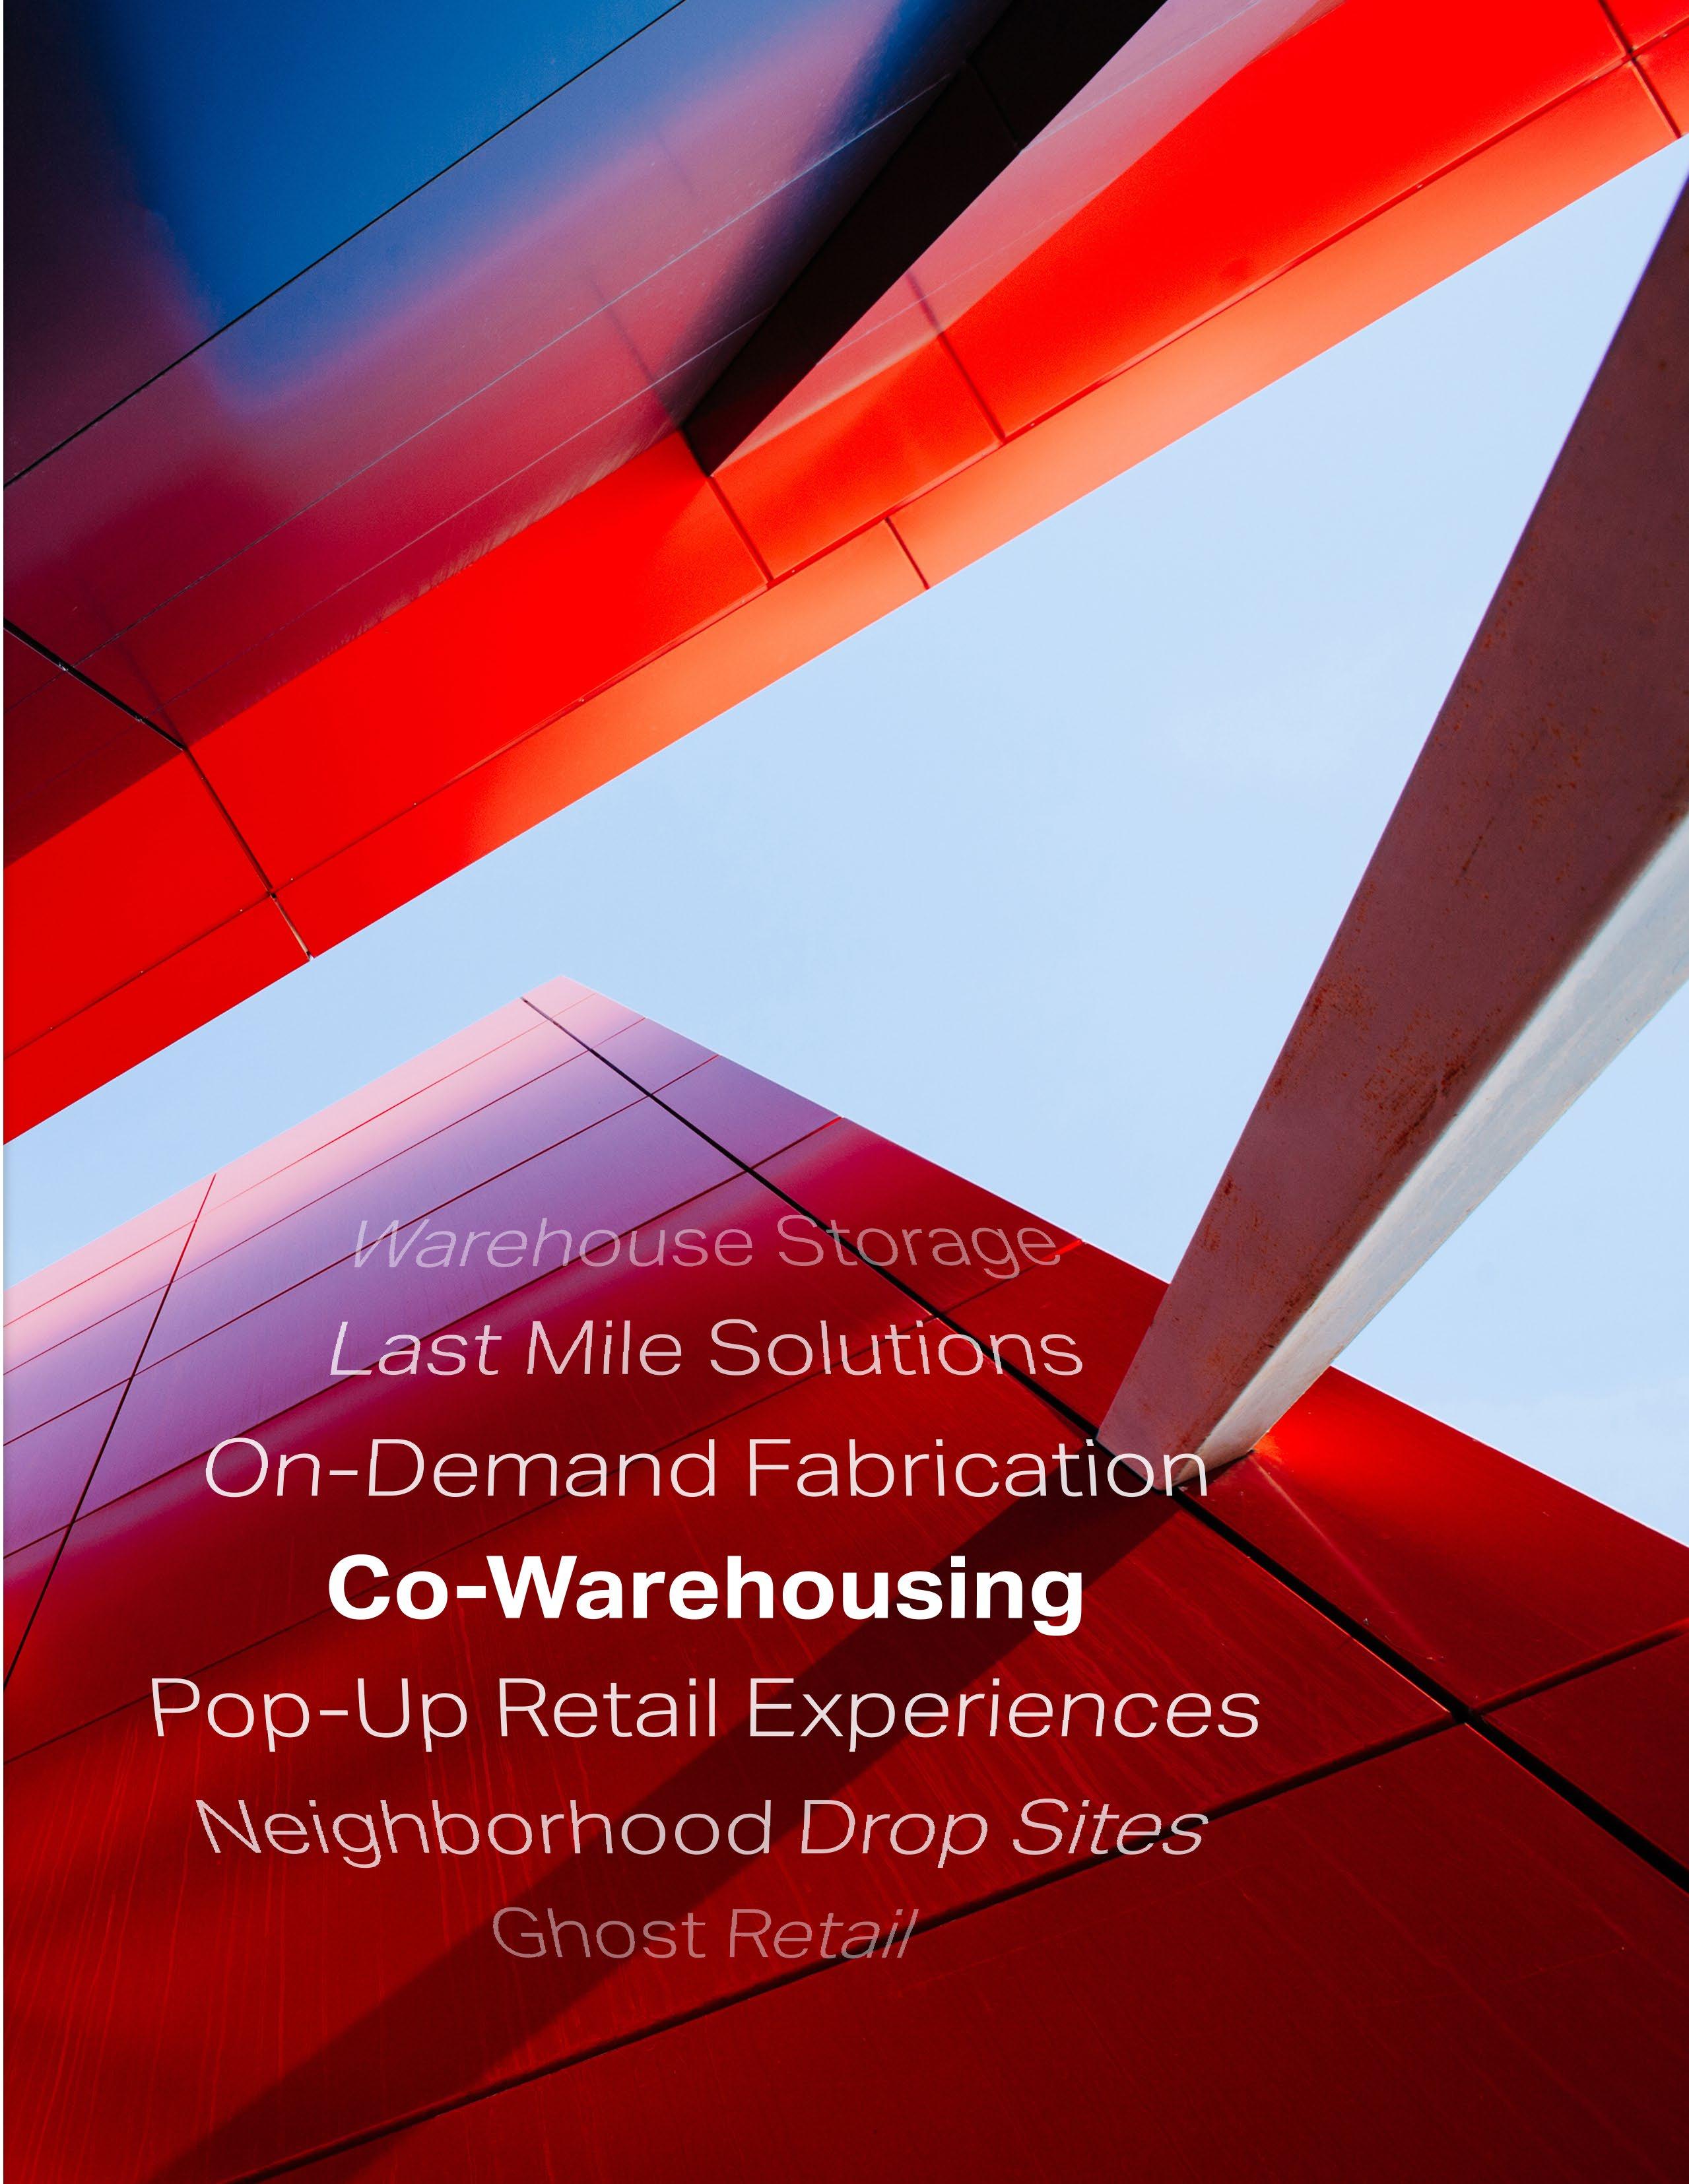
Ghost Retail
Retail experiences that combine the richness and higher conversions of in-store shopping with the convenience and safety of eCommerce
Co-Warehousing
Certain facilities can operate with multiple tenants who need delivery services. Their subscription model can pay for drone delivery, eVTOL cargo delivery, and autonomous delivery from the co-warehousing location

Drone Delivery
Currently, medicine, food, and household essentials can be delivered to residential locations via drone within a 10-minute window. This will likely expand rapidly over the next few years due to consumer demand
Microwarehousing
Small warehousing locations within the urban environment that can tailor to the quick-demand delivery times. These smaller facilities specify certain products per location
Gig-Economy Delivery
Last-mile on-demand delivery from microwarehousing facilities
Transportation Storage
Storage and maintenance
repair locations for logistics companies
Neighborhood Drop Sites
Neighborhood lockers and drop sites will allow multi-family residential shoppers and others to participate in drone delivery
Autonomous Delivery
Autonomous delivery trucks save in fuel costs and carbon footprint of consumables, while also increasing on-road delivery despite the 15-year labor shortage in truck drivers
The Changing Consumer Experience
HOW EVOLVING USER BEHAVIORS WILL REQUIRE MORE WAREHOUSE SPACE
When the global pandemic hit in 2020, 10 years of e-commerce growth happened in three months.1 As communities around the world went into lockdown, one of the immediate responses was the adoption of delivery and fulfillment services that limited in-person contact.
According to CBRE, the following factors are driving growth in e-commerce:2
■ Urban population growth
■ Digital skills of the general population
■ Mobile internet sales ratio
■ Debit and credit card use
■ Residual effects of pandemic lockdowns
Even as the pandemic continues to fluctuate in its severity, consumers have continued to purchase goods online as retailers “scramble to land warehouse and distribution space in order to hold inventory and fulfill online orders.” This has resulted in low vacancy rates nationwide as “the demand for industrial real estate continues to outpace supply.”3
“Consumer expectations are changing too, as same-day or nextday delivery becomes the new norm. This change in consumer behavior is an indicator that retail and logistics need to adapt.”4
This dramatic shift from traditional brick-and-mortar retail to e-commerce fulfillment is driving demand for real estate solutions that can facilitate supply chain logistics for both the manufacturer and its consumers. According to Hines, this boils down to building:5
■ Industrial space along a faster supply chain
■ Inventory that is stored closer to the consumer with shorter transit times
■ Dense and less risky supply chains
DIGITAL SHOPS NEED PHYSICAL SPACE, TOO
Cushman & Wakefield estimates that if companies on average hold just 5% more inventory going forward, then that would require some 700 million to 1 billion square feet of warehouse space across the US.4
A recent CBRE report suggests that the U.S. must add
330M square feet of e-commerce warehouse space by 2025 to keep pace with industry growth.2
THE REALITY
The “Just-in-Time” manufacturing model, in which supplies are delivered to factories as they are required, allows companies to stay nimble and responsive. This business model has dominated supply chain logistics for decades.
THE PROBLEM
While “Just-in-Time” manufacturing allows companies to stay nimble, it also exposes them to shortages and disruptions. Within an urban setting, the last leg of the supply chain is also less efficient, comprising up to 53% of the total cost to move goods.1 This last leg (the “Last Mile”) is also the most energy consuming portion of the supply chain.2
THE SOLUTION
E-commerce is not a one-size-fits-all model. We need varying degrees of proximity, inventory, fabrication, and delivery modalities in order to meet evolving consumer demands.
Micro-Fulfillment Centers
EXAMINING THE WAYS WE TRANSPORT AND
PURCHASE GOODS IN THE 21ST CENTURY
The micro-fulfillment center can be distributed throughout an urban core, alleviating certain pain points associated with last mile delivery as consumers use services like on-site fabrication to purchase goods in closer proximity.
A micro-fulfillment center can also feature a quasi-retail experience. Pop-up storefronts attached to the warehouse encourage consumers to connect with the retailer’s brand and identity while also providing the chance to observe state of the art fabrication and manufacturing methods.
As traditional retail footprints are expected to shrink, excess floor space can be repurposed into on-site fulfillment microwarehouses. The high ceilings, deep space and shipping and receiving access found in department stores are ideal for this conversion. However, most retail space was not designed with such a purpose in mind — so increased retrofitting and redevelopment of these spaces is expected. Therefore, these micro-fulfillment centers require features that are different from traditional warehouse space, including:3
■ Surroundings
Urban setting with proximity for local delivery
■ Site
More parking — specifically for users receiving products, warehouse employees, distribution vehicles
■ Warehouse
30- to 40-foot clear height inside the warehouse
Increased ventilation
Access to renewable power and adequate energy storage
■ Shipping and Receiving
Maximizing dock doors
■ Retail Experience
Pop-up storefront
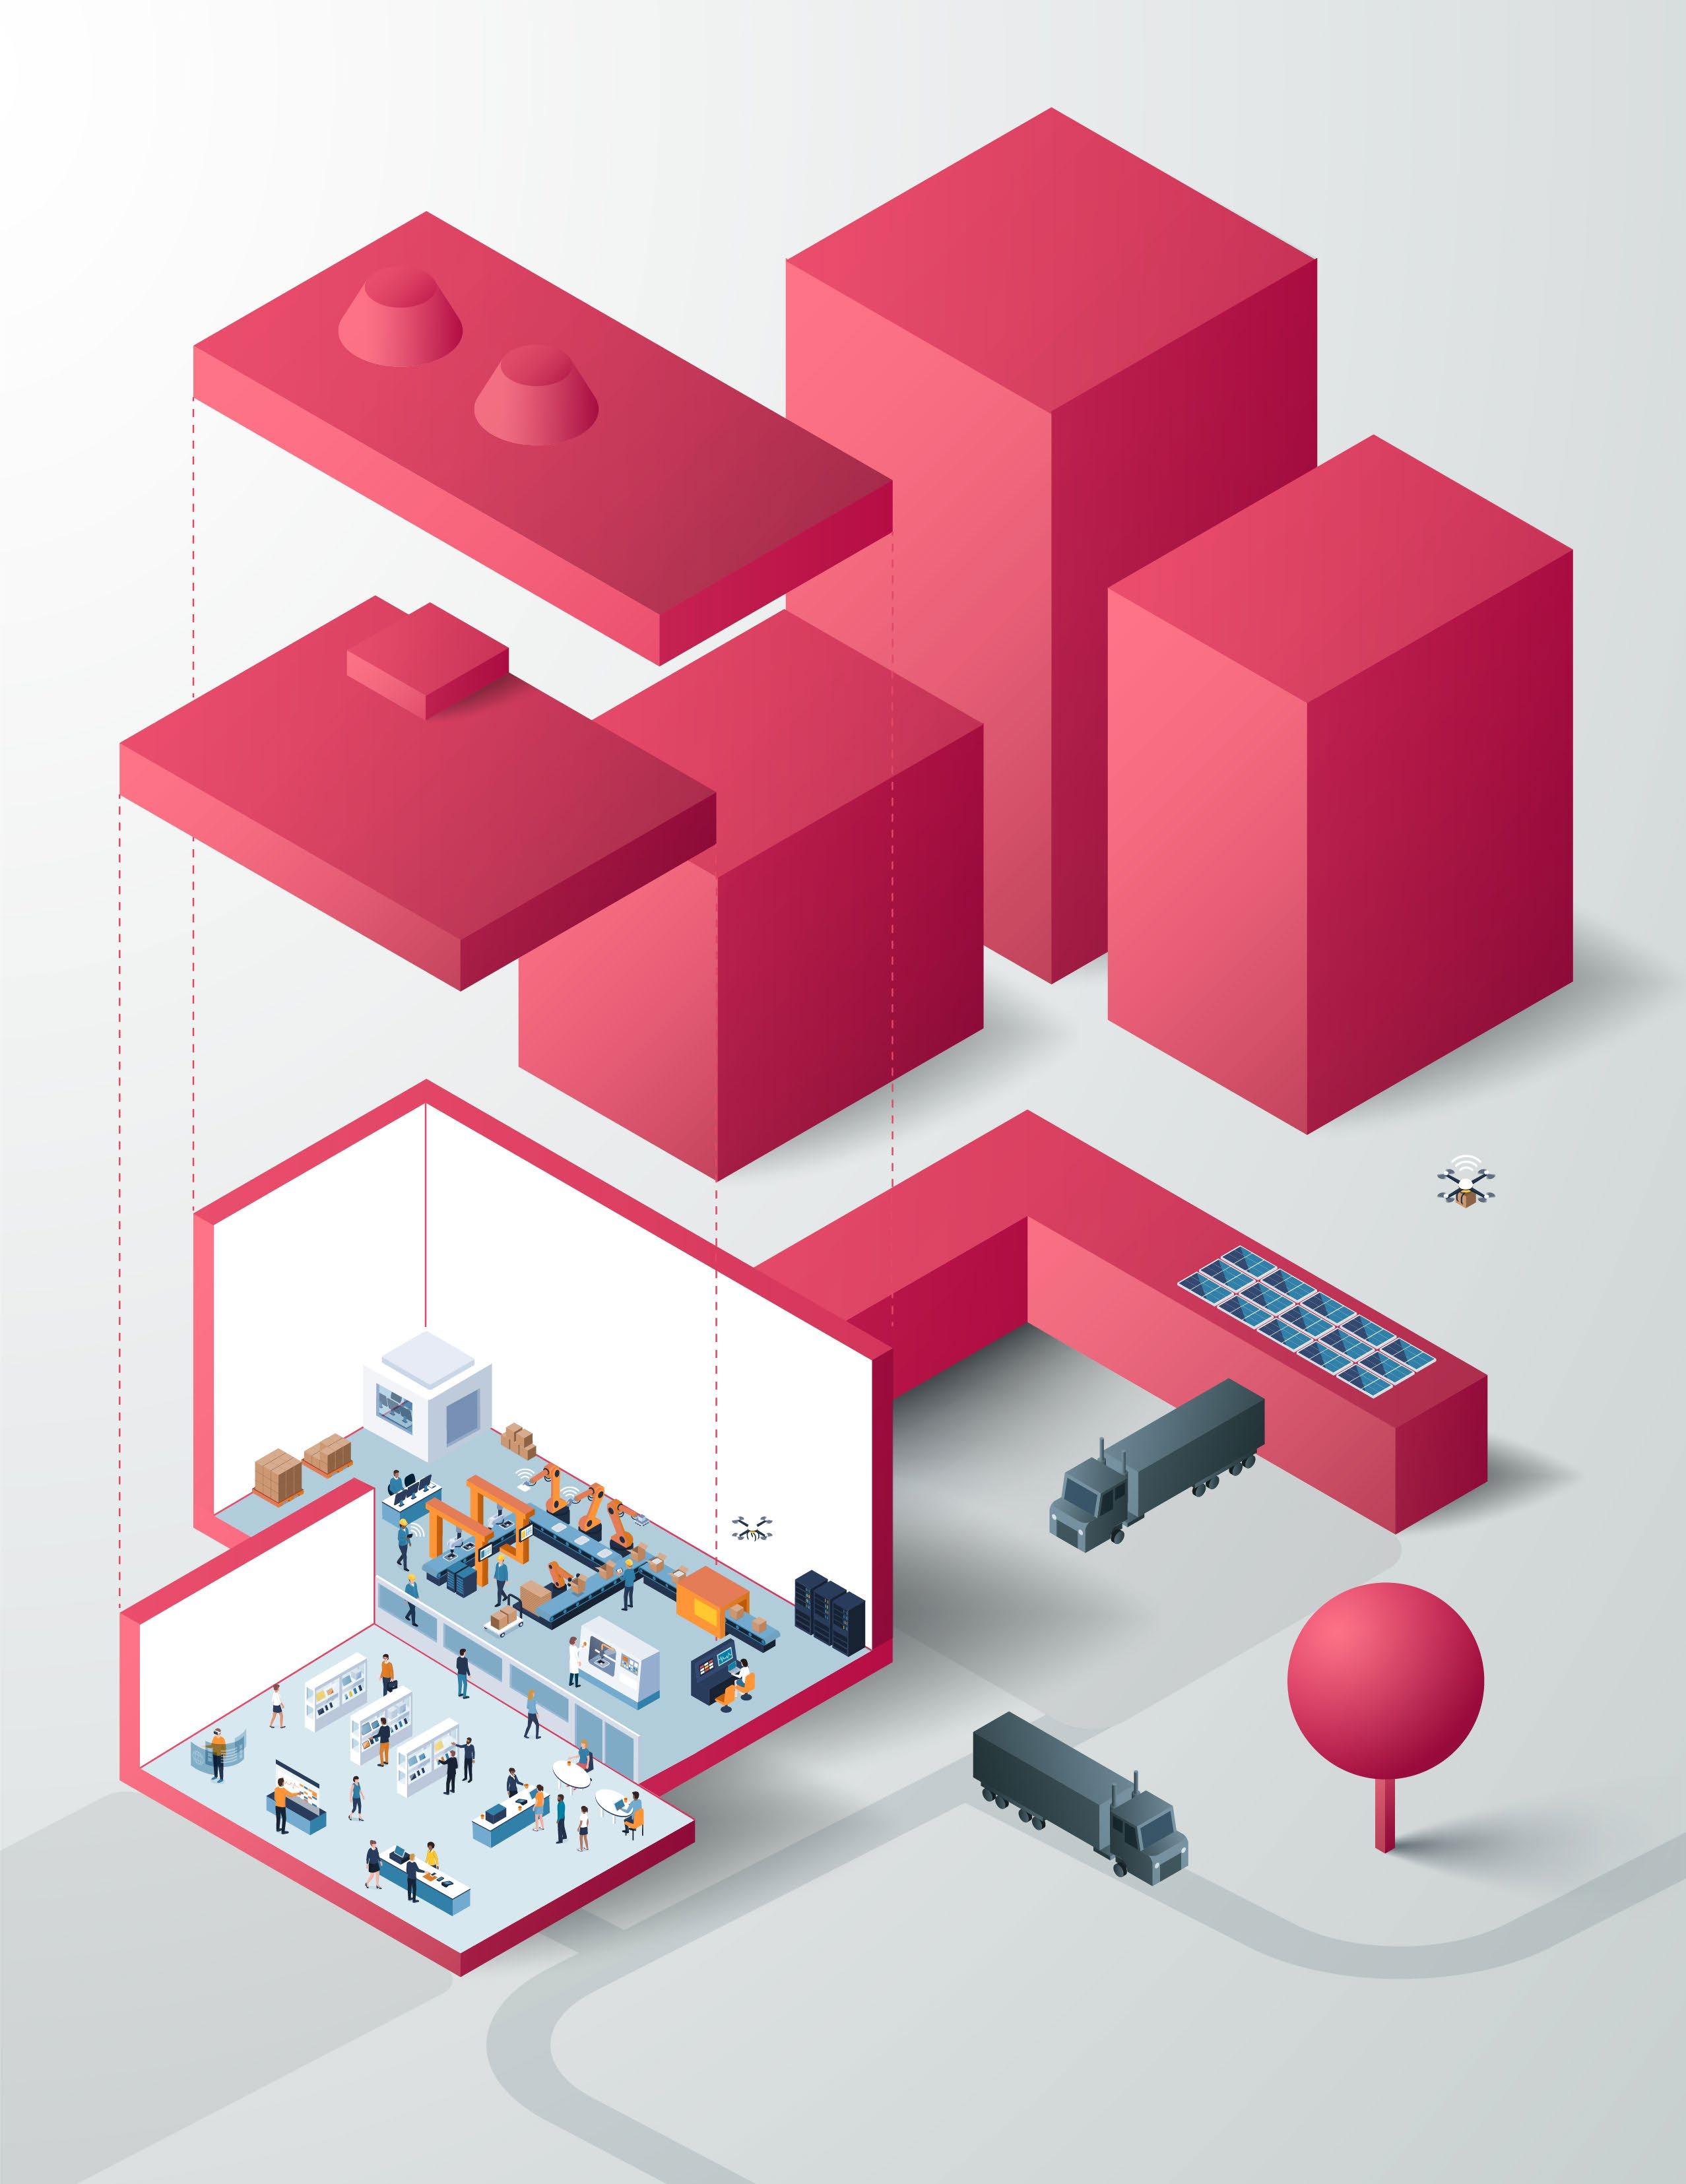
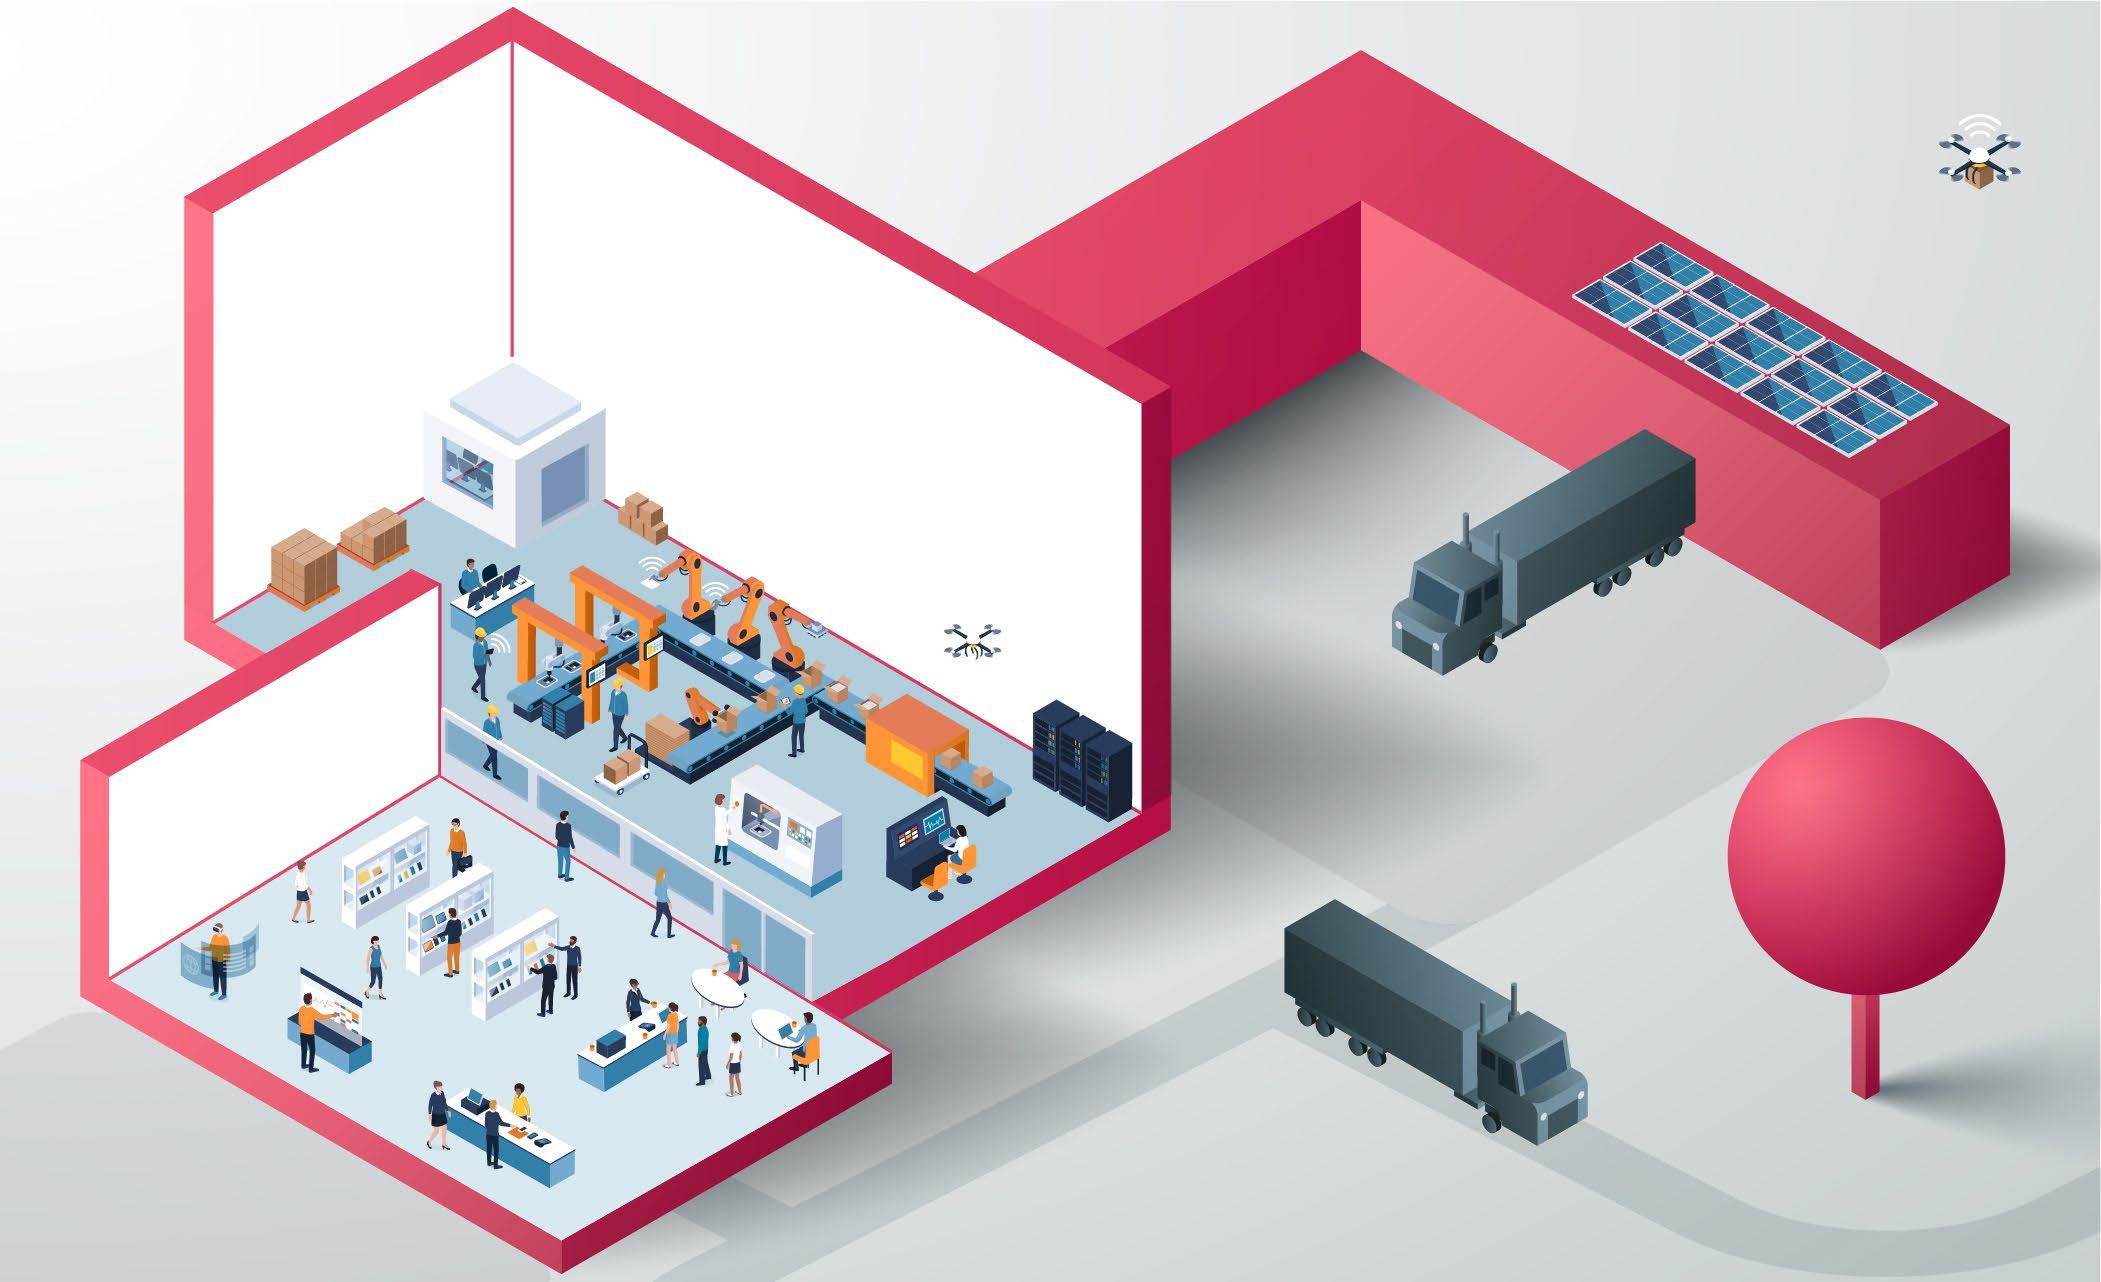
Micro-Fulfillment Center + Retail
Consumers own the last portion of the distribution process by picking up goods from a collection point.


Microwarehouse + On-site Fabrication
Employee focused warehouses, integrating unmanned and autonomous machinery, located in urban environments that are tailored to quick delivery times.

Energy
Use
A network of micro-fulfillment centers is potentially more energy efficient.
Last-mile fulfilment is among the most energy consuming portion of the supply chain because of the vast amount of stops and low fill rates that trucks need to make. A 2020 study found that transportation in the last mile is highly energy consuming, and that energy could be saved when goods are carried as far as possible to collection points close to the point of consumption (POC).2
These findings suggest that the consumer could be responsible for the last portion of the last mile. Additionally, the proximity between private households and collection points increases the possibility that consumers will walk or use public transportation.
Within an urban setting, the last leg of the supply chain is less efficient, comprising up to 53% of the total cost to move goods 2

The Warehouse-as-aWorkplace
While fulfillment centers are pushing the boundaries on automation and robotics, there is an opportunity to develop a more cohesive workplace strategy that facilitates human-centered employee experiences.
Palmer Letzerich of Hines writes, “The design of the logistics hub is fast becoming more people-centric. These buildings should be developed with amenities and shaped with the employee in mind. The very best modern-day distribution centers are being delivered with cafes, outdoor seating and dining, and basketball courts. Offices have been evolving for the last decade or two with employees front and center. The logistics sector is now rethinking inside the big box.”4

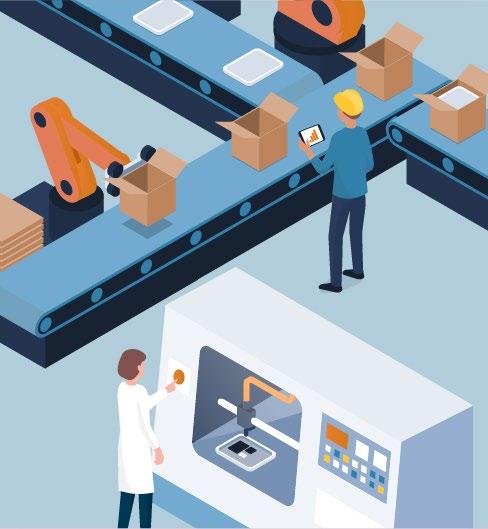
WAREHOUSE AUTOMATION + ON-SITE FABRICATION
For warehouse robotics, the dock is the final frontier.3 Low-cost, autonomous vehicles would allow manufacturers to consider less expensive locations that are not as reliant on air and seaports or train lines. Additionally, reduced labor costs associated with moving materials via autonomous machinery will allow fulfillment to become more flexible and meet short-term peaks in demand.
TIER 1 — THE MICRO-FULFILLMENT CENTER
A hyper local and just-in-time warehouse with fabrication capacity.
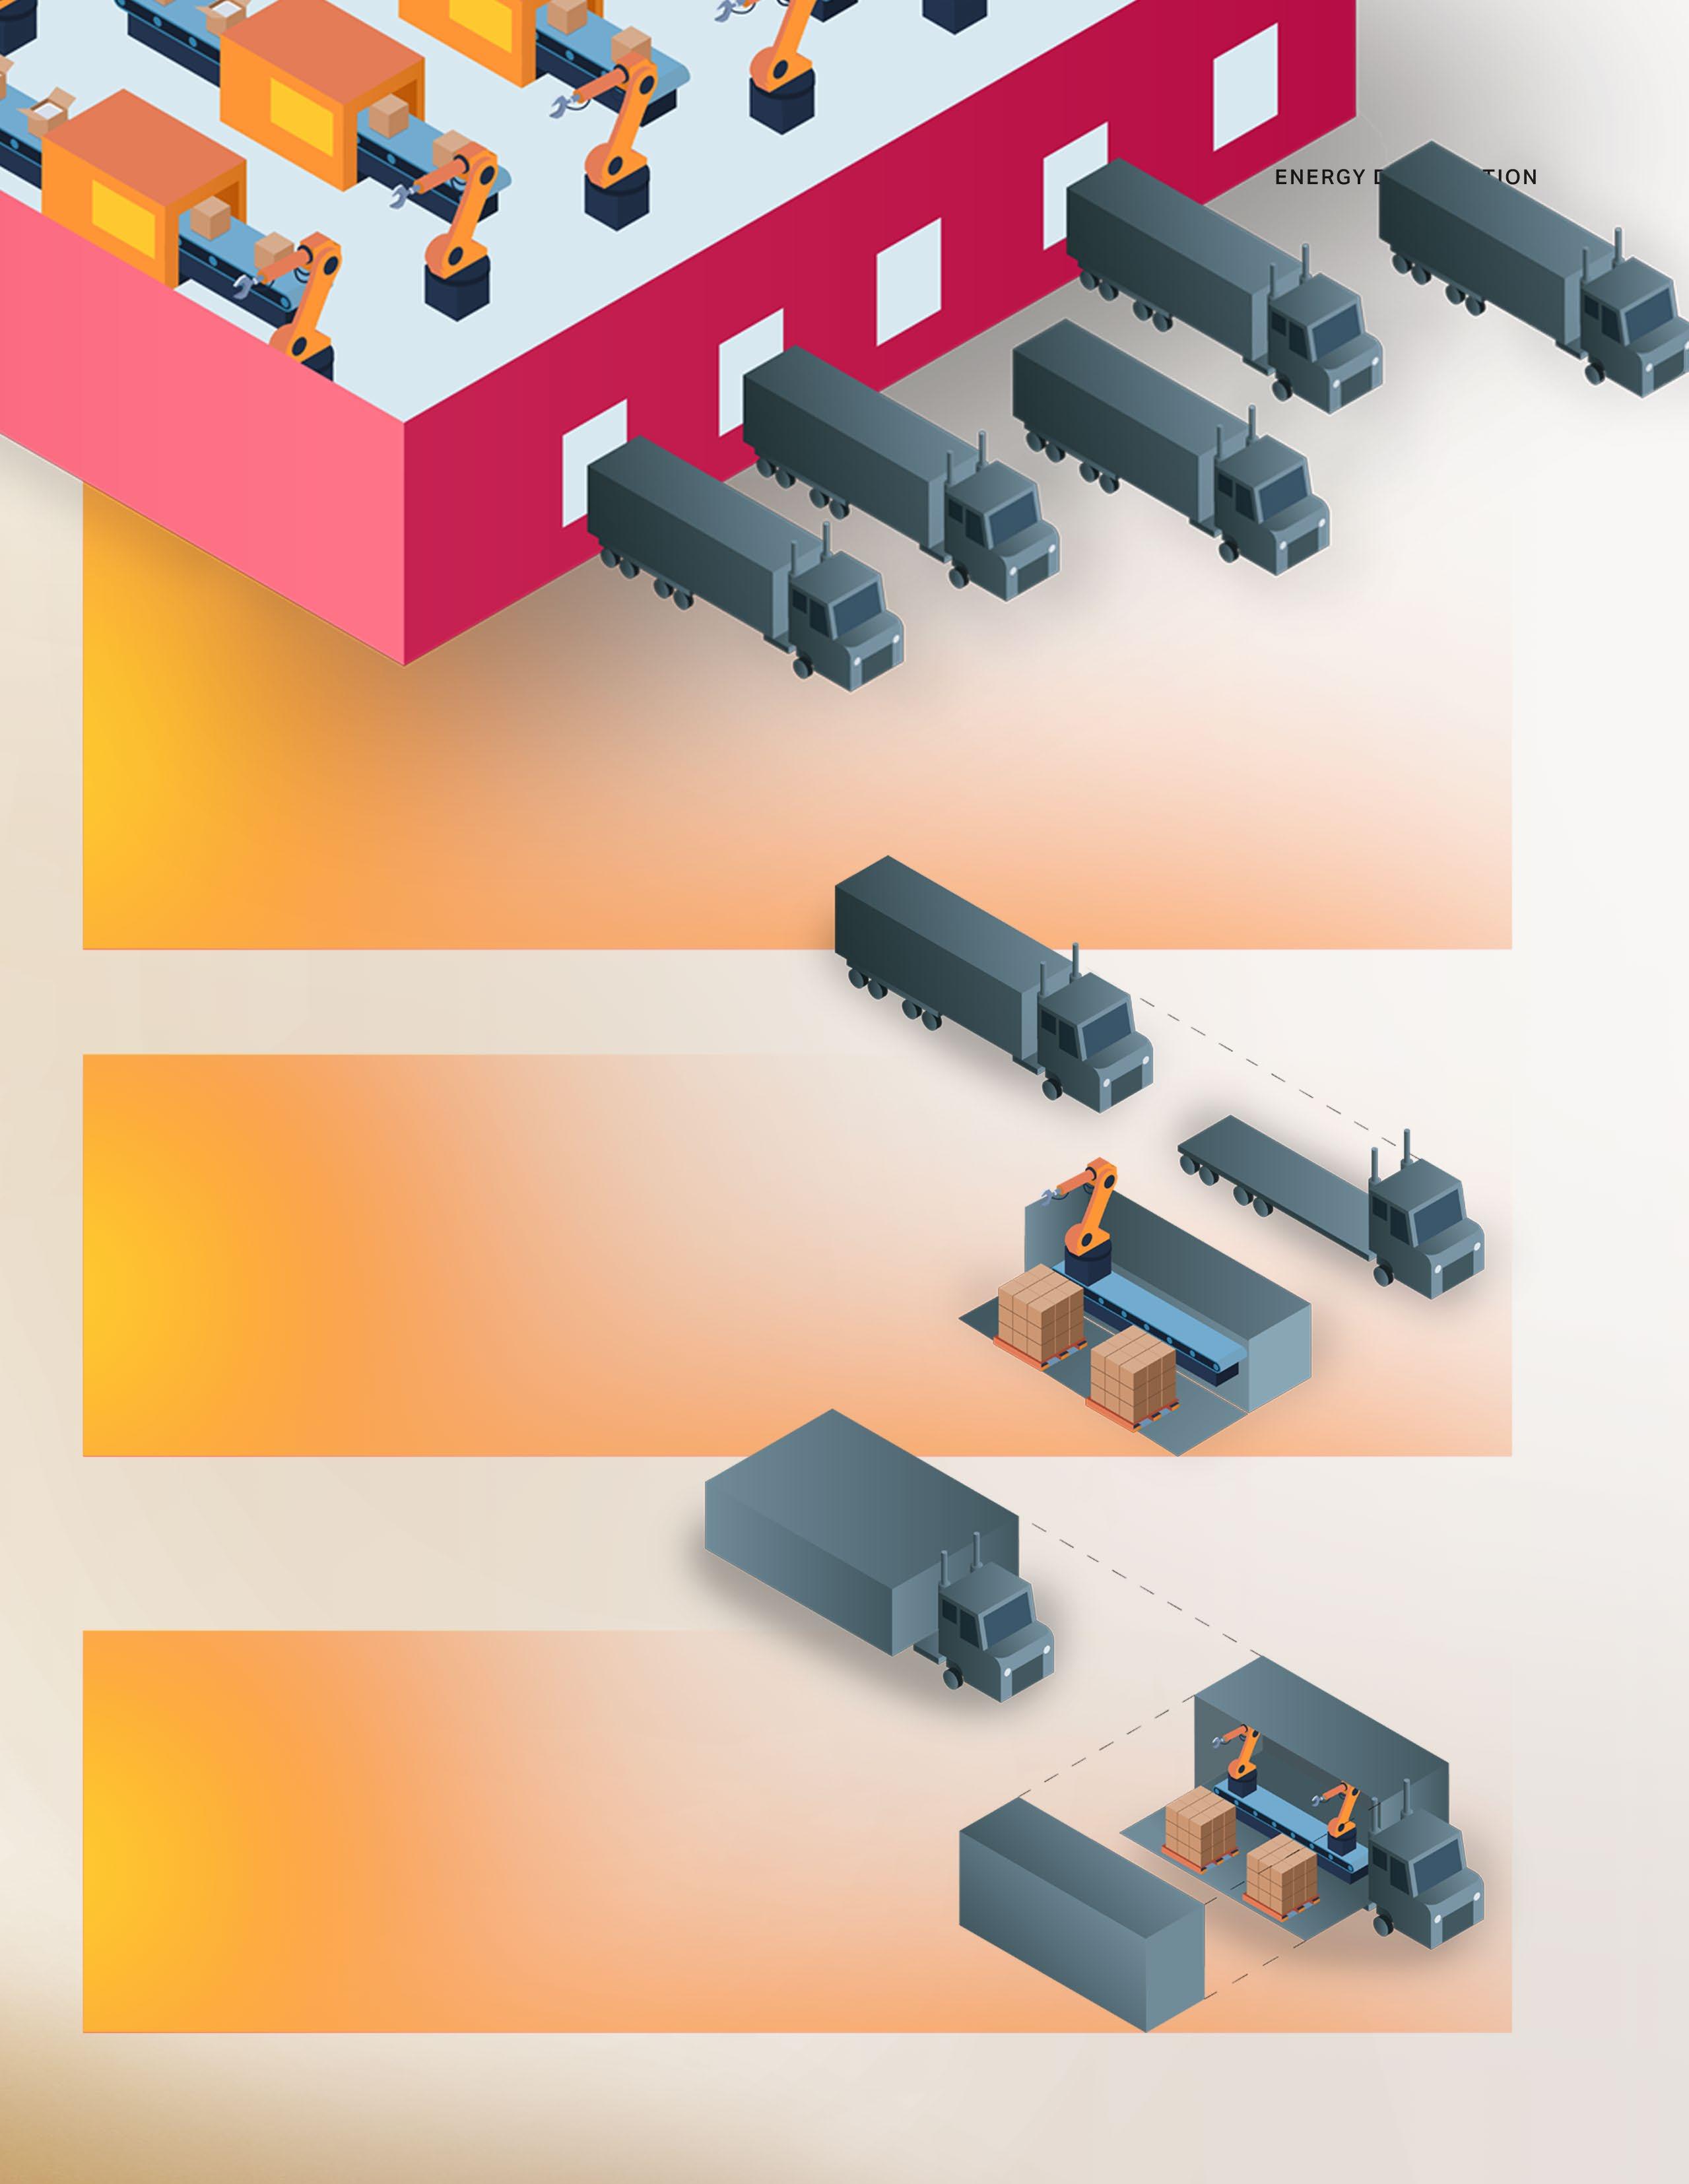
TIER 2 — ON-DEMAND FABRICATION
AV Trucks that can combine like a Lego set to create a temporary fabrication site that meets temporary shifts in demand.
TIER 3 — ON-THE-GO FABRICATION
AV Trucks that can fabricate as they travel to their final drop-off location with ready-made good.
Prioritizing the Hospital Grid
CO-LOCATING RESOURCES TO SUPPORT COMMUNITY RESILIENCE
It is hard to envision a facility that is more critical to public health, and electrically dependent, than a hospital. Operation as a 24-hour facility is not only a crucial capacity to maintain during a disaster scenario, but it also requires more energy than most other building types. While large hospitals only account for less than 1% of commercial buildings, they utilize 4.3% of energy delivered to cities and municipalities.1
“Electricity is the lifeblood for hospitals. From electronic health records to electrocardiography and automated pill dispenser machines, these digital tools are relied upon to maintain secure environments and provide consistent care for patients.”2
Regulations & Decision Making
Hospitals, long-term care facilities, and many other provider types are required to follow emergency preparedness regulations to address their susceptibility to power outages. Regulations outline that these facilities must have standby power generation with critical assets but do not need to cover all functions and power needs.”3 While these systems have maintenance requirements, roughly 23% of these standby power generation systems fail when deployed during a power outage.4
THE 2021 TEXAS WINTER STORM

Power outages spread throughout Texas during the 2021 February Winter Storm. Temperatures dropped, equipment failed due to increased demand and a lack of winterization, and therefore power generation was diminished. Widespread outages were put in place to load shed and protect the grid from a full collapse that would take weeks to fix. Some were lucky and maintained power, many others, including critical resources, did not. In addition to billions of dollars in damage, there were over 200 deaths.5
During these long-term outages, energy providers determined what areas of the grid to shut off to meet reduction needs, not government entities. Most hospitals in the Dallas–Fort Worth area maintained power. This is in part due to the advocacy of DFW Hospital Council CEO, Steve Love who worked with ONCOR (a major energy distributor in Texas) to ensure serviced hospitals were prioritized in outage decision making. However, this still leaves hospitals using other energy providers vulnerable.6
Disaster Types
Natural disasters are often the cause for power outages
— “between 2008 and 2012, major outages caused by weather increased from 70 to 130 outages per year… in the last five years it’s accounting for 68 to 73 percent of all major outages.”7 With climate change, these types of weather and natural disasters are setting new records every year, adding increased stress to an already aging grid.
However, human-caused disasters (and exacerbating circumstances where both play a role) are also detrimental to offering consistent power. Human-caused disasters include energy demand and are expected to double by the year 2050.8 Providers that participate in Medicare and Medicaid are required to plan for both natural and humancaused disasters.3
Predictable
■ Hurricanes, cyclones and typhoons
■ Drought
■ Severe heat waves
■ Snow and ice storms
■ High winds
■ Increasing user demand (bigger houses, more appliances/ devices, etc.)
■ Unbalanced energy supply and demand
■ Lack of automated analytics
■ “Poor Visibility” – lack of situational awareness
IT’S ALL ABOUT EXACERBATING CIRCUMSTANCES
Often, there is no one cause for an outage — many of these can layer causing difficulty in restoring power. for example, bad weather can cause poorly maintained equipment to fail. If it is an overcast, or still day, that can also remove the option for renewable energy sources. It is critical to have multiple systems to maintain energy during these exacerbating circumstances.
■ Wildfires
■ Flooding
■ Tornadoes
■ Animals
■ Lack of availability in renewable energy sources due to weather (e.g. cloudy days)
Unpredictable
■ Cyberattack
■ Vehicle or construction accidents
■ Increase in economic activity
■ Rolling power outages (avoid damage to infrastructure)
■ Slow response of switches
THE REALITY
When either natural or human-caused disasters occur, energy distribution is limited due to damaged systems or the need to conserve energy usage. Energy prioritization is most often at the discretion of the energy distribution company, not legislation.
THE PROBLEM
Hospitals, emergency response stations/ military bases, and other protected circuits are needed to maintain functionality of the grid. They are also typically the highest priority for energy distribution. This approach often leaves other critical resources that a community needs during a disaster unavailable as many residential areas are classified for load shed.
THE SOLUTION
By co-locating critical facilities and infrastructure to hospitals on a centralized grid, a community would be better equipped to respond to a disaster and operators could better prioritize outage areas. Through the possible incorporation of a hospital microgrid, critical resources would be better protected during a disaster, even against equipment failure.

The Hospital Microgrid
“Today’s electricity system is 99.97 percent reliable, yet still allows for power outages and interruptions that cost Americans at least $150 billion each year — about $500 for every man, woman and child.”8
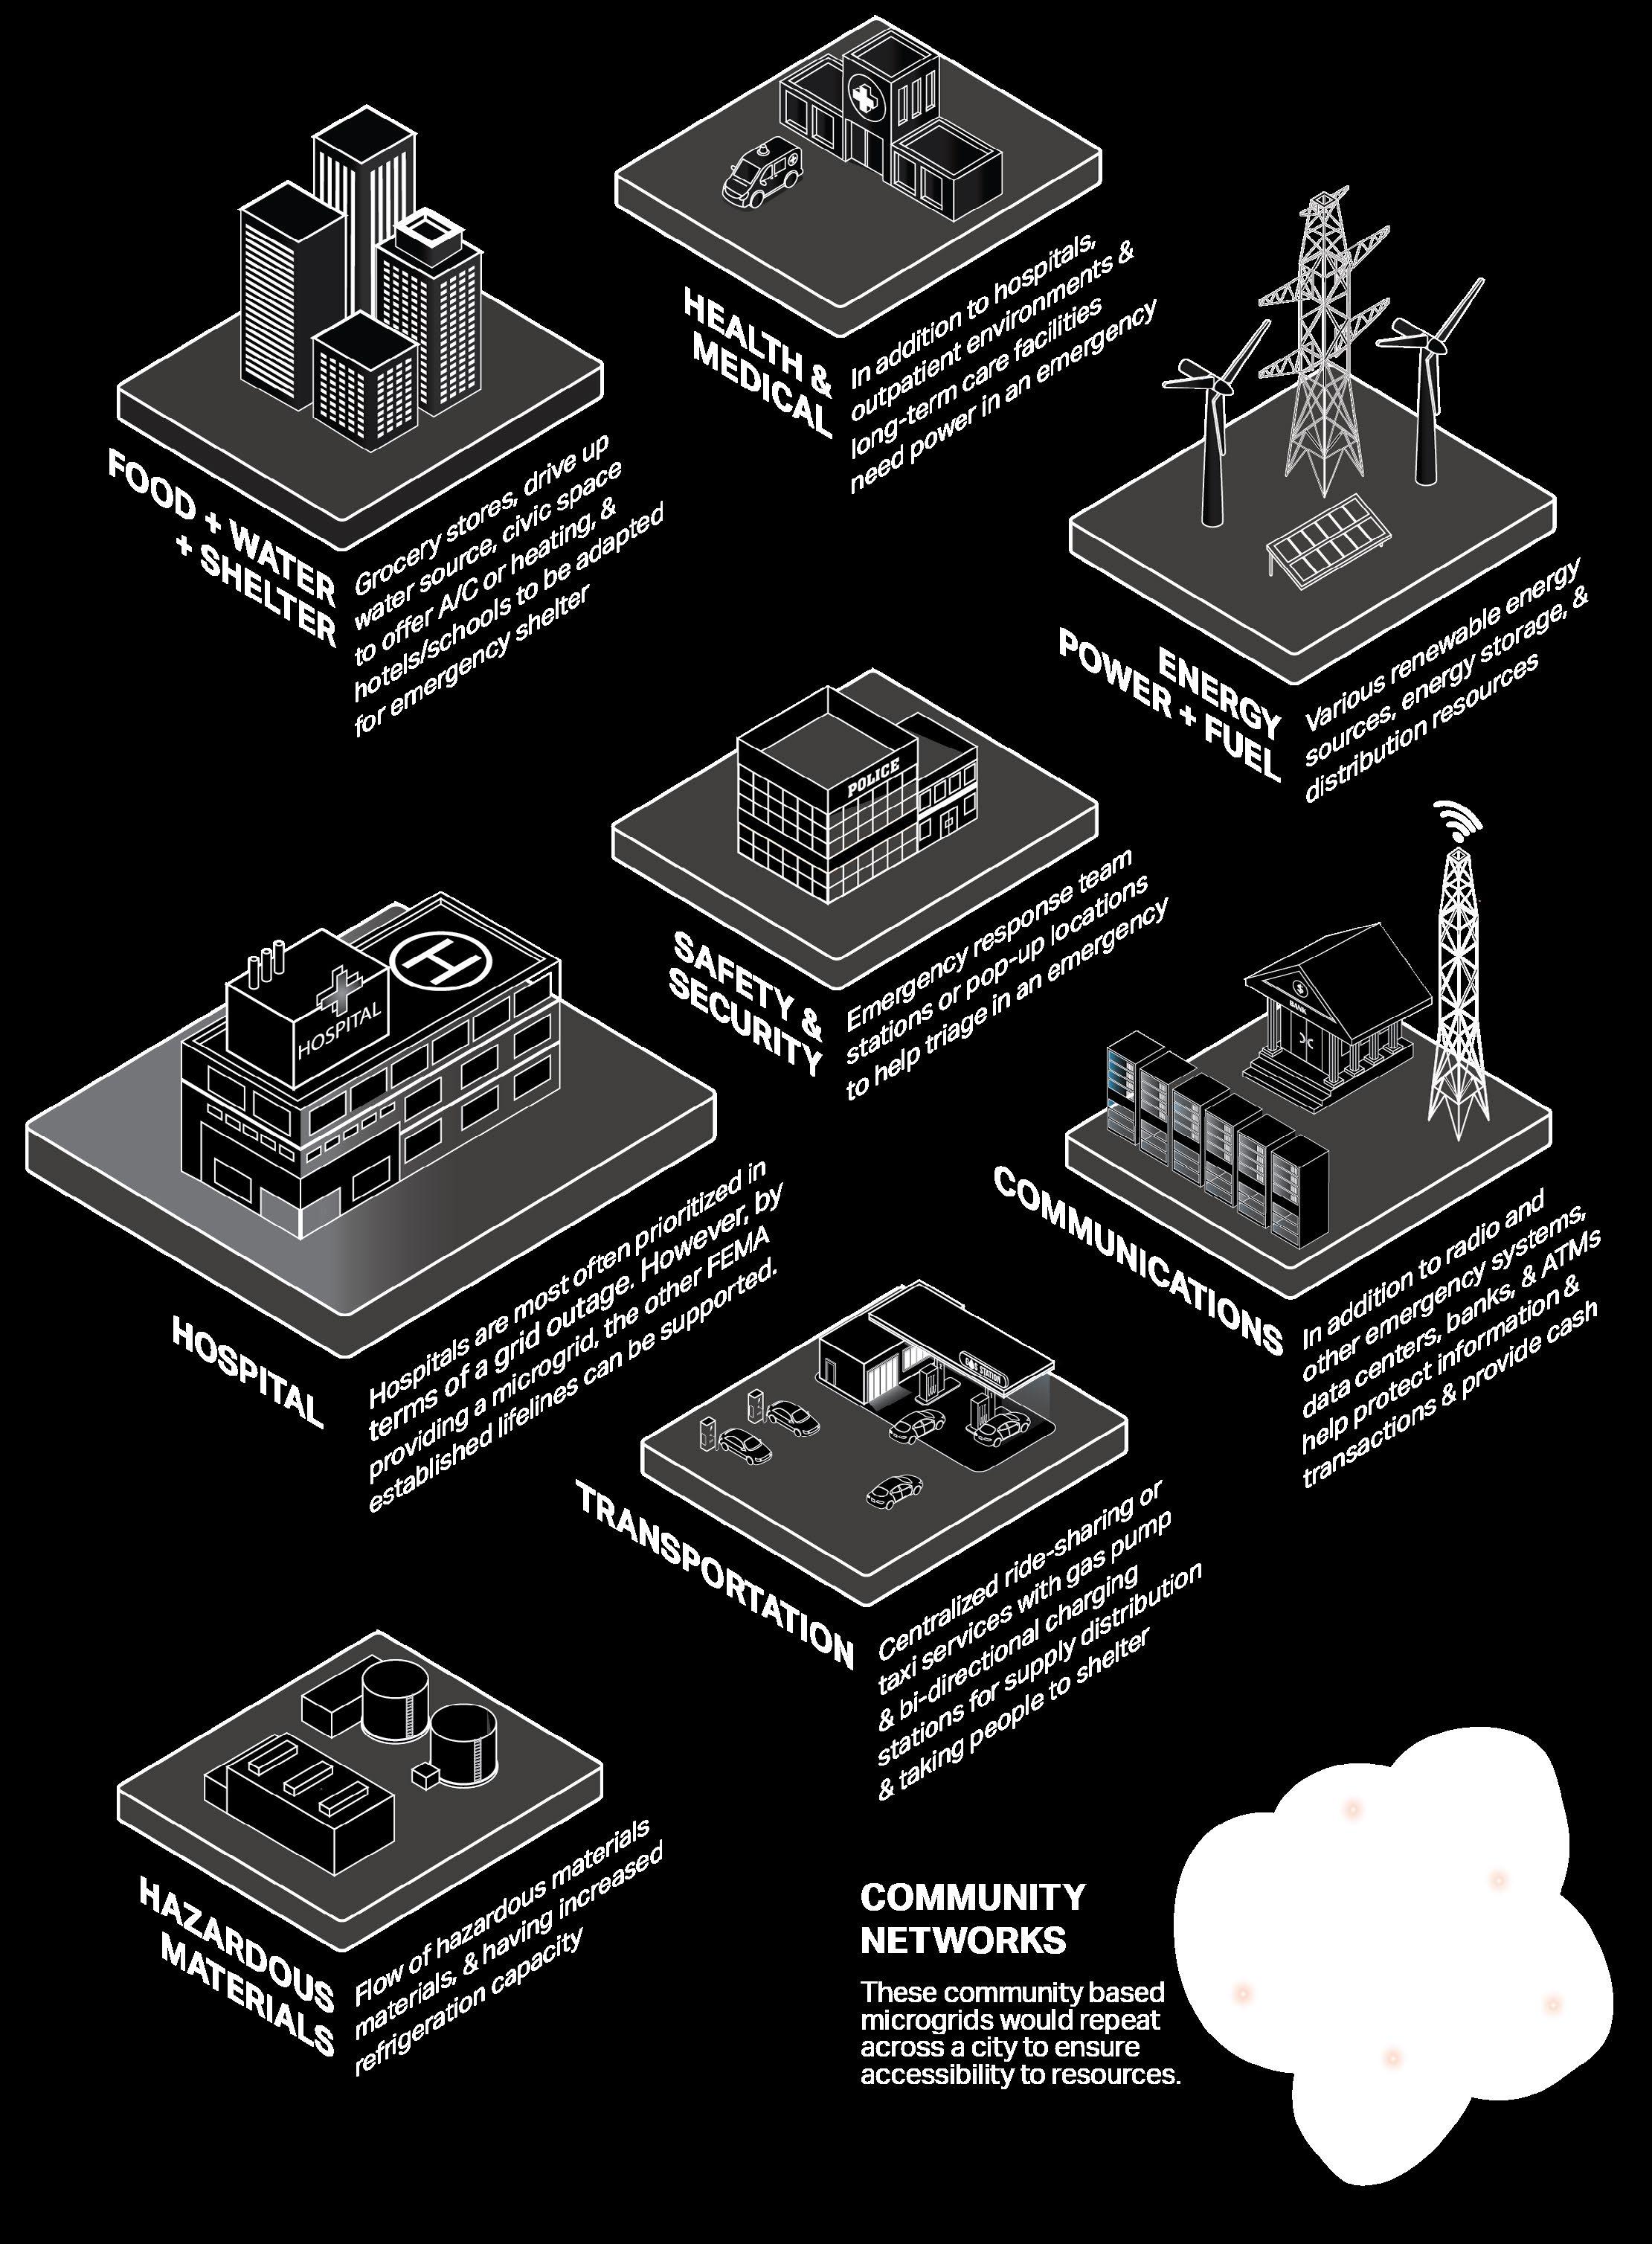
Outages will continue to be an expensive issue as our grid system ages and climate change causes more extreme weather events. To better respond in disaster situations, FEMA developed and tested a set of seven community lifelines. These lifelines are “the most fundamental services in the community that, when stabilized, enable all other aspects of society.”9 When a catastrophic event occurs, FEMA’s response dictates that the efforts should prioritize stabilizing these seven community lifelines first. These lifelines include health and medical, safety and security, food, water and shelter, energy, communications, transportation, and hazardous materials.9
Co-locating these lifelines onto a centralized portion of the grid, with the hospital serving as the epicenter, could better protect a community during an outage scenario, and would also decrease demand on the hospital to fulfill needs outside of their walls for the overall community. This approach would not only benefit in the event of an outage (where the hospital is prioritized by the energy distribution company to maintain power), but also if hospitals were forced to use their back-up power systems.
Many hospitals no longer rely on diesel generator backup systems, which have vulnerabilities in storage, distribution, and reliability. Some have instead switched to CHP plants (combined heat and power plants) that provide electricity and heat, more efficiently and cost effectively. CHP plants “can also be configured as microgrids, which, in turn, can incorporate a variety of distributed energy resources (DERs), such as solar panels, wind turbines or fuel cells.”10
A hospital microgrid can produce, store, and distribute energy for its own use and for other community resources on the grid. This autonomy from energy distributors encourages the design of resilient communities that look to maintain lifelines that benefit everyone, instead of just the lucky individuals that live next to a hospital.

Energy Use(r)
The Energy We Use
Managing electricity and our personal energy levels.
Zero to (be a) Hero
The moonshot to create zero-carbon concrete.

The Office Buzz Creating energy in the workplace.
The Consolidated Travel Experience Reducing a passenger’s mental cognitive load.
Vertical Farming
A case for on-site food production.

“As an architect you design for the present, with an awareness of the past, for a future which is essentially unknown.”
— NORMAN FOSTER
The Energy We Use
In 2019, the world consumed roughly 162,000 terawatt-hours of energy.1 One terawatt-hour is enough to power one million homes for a year, for reference.2
Our energy use is determined by both weather and individual choices. For example, a heatwave will influence people’s decisions to turn on their AC units, while a steel company may decide to start up a 100MW electric arc furnace to complete their production quota. In both scenarios, the grid must accommodate these changes in behavior by making more energy readily available for use.
Most of us, however, do not have a lot of control over the energy we use or how that transaction is managed. Author of the Energy Switch, Peter Kelly-Detwiler, compares the uncertainty of your utility bill to filling up your car with gas but you don’t know how many gallons it will take to fill your tank and the price per gallon changes continuously.
But the way we use and purchase energy is changing. These days, “many individuals now have the ability to own their own little power plants” via microgrids in the prosumer
ENERGY CONSUMPTION BY SOURCE
160,000 TWh
140,000 TWh
120,000 TWh
100,000 TWh
80,000 TWh
60,000 TWh 40,000 TWh
TWh
model.3 This transition towards on-site energy creation and subsequent use is also being explored for commercial buildings.
The term energy doesn’t just refer to the movement of electrons across transmission lines either. It also indicates personal mood levels, that sudden spark of creativity, and the atmosphere you feel when you’re part of a large crowd. Consistently low energy levels can indicate fatigue or burnout. And there’s an entire industry of soft drinks and caffeine supplements that promise to boost your energy and focus.
After two years of prolonged stress and uncertainty during the height of the pandemic, we are examining energy use on multiple fronts — from the way we consume it, to how we can preserve it, and the decisions we make around it.
In the energy industry, there are various units thrown around – joules, exajoules, million tonnes of oil equivalents, barrel equivalents, British thermal units, terawatt-hours, to name a few. This can be confusing and make comparisons difficult. Our World in Data tries to maintain consistency by converting all energy data to watt-hours. Source: Our World in Data4
GLOBAL ENERGY DEMAND AND CARBON EMISSIONS
Source: BP’s Statistical Review of Energy, 20215
“We call the grid a complex socio-technical system, because the most complex creatures on the planet built the most complex infrastructure, and that’s what the grid is.”
— Mike Legatt, CEO and founder of Resilient Grid3


Zero to (be a) Hero
“There
are two numbers you need to know about climate change. The first is 51 billion. The other is zero. Fifty-one billion is how many tons of greenhouse gases the world typically adds to the atmosphere every year… Zero is what we need to aim for.”1
— How to Avoid a Climate Disaster by Bill Gates
Simply producing the energy that powers everything in our offices and homes — from our desk lamps to our water heater — creates CO2 emissions. Buildings alone are responsible for almost 40% of global annual emissions. That’s a lot when you consider that almost 2/3 of the global building footprint existing today will still be operational and usable in 2040,2 and is expected to double by 2060 — that’s the equivalent of adding the entire New York City footprint to the world every month for the next 40 years.2
Most net zero commitments are expected to be met by 2040. As architects, our energy should be focused on actionable ways we can reduce carbon emissions from the built environment — from both new construction and existing building stock.
Getting to zero will require two things: first, that we design our buildings to be entirely powered by renewable energy, and second, that we reduce our emissions through building operations and the construction process.
ENERGY EFFICIENT BUILDINGS
Energy efficient buildings consider the energy use of everything, from on-site renewable energy generation to end-user appliances. They work best — and save money — when building owners and operators consistently monitor energy usage in real-time and enact real-time adjustments as needed. There are two types of energy efficient buildings:
■ Net-zero buildings leverage off-site renewables or produce as much renewable energy on-site as they consume annually. Because they are considered “net zero,” these buildings are not required to host on-site storage of energy and are also not precluded from connecting to standard utilities, such as natural gas.3
■ Zero energy buildings on the other hand are highly energy efficient buildings that generate more than 100% of the annual energy they consume using on-site renewable energy sources. The surplus can be sold back to the grid when the market is convenient for profit.
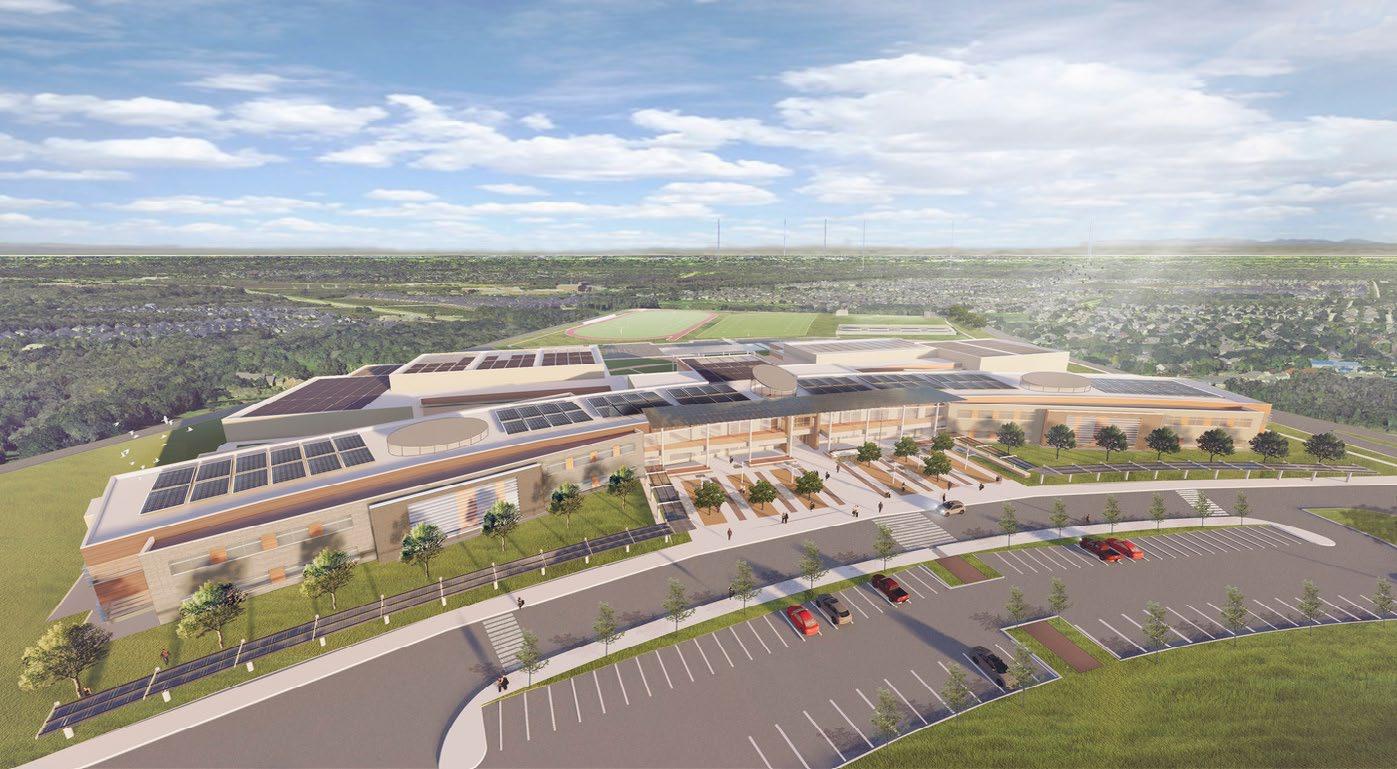
Corgan is currently building the largest net-zero energy education building in the nation, Fort Bend Middle School near Houston, Texas will achieve net zero by deploying a tapestry of solutions. Solar PV arrays on the roof and select canopies have been designed to generate solar energy — and because of the acceleration of increased PV efficiency, the number of panels required rapidly declined over the course of the design. Over 600 geothermal bores will be integrated under fields, parking lots, and landscaping, drawing heat from the earth to power the school’s HVAC system. The building will also reduce total water consumption, as compared to a baseline building that is code compliant.
EMISSIONS
All forms of electricity generation produce greenhouse gases, whether directly or indirectly. While more than 40% of energy-related CO2 emissions can be directly linked to the burning of fossil fuels for electricity,4 some emissions can be significantly reduced by focusing on efficient building operation practices, as well as planning to reduce embodied carbon and CO2 emissions throughout the construction process.
■ Operational carbon emissions are generated through the use, management, and maintenance of a building, and can be reduced over time by 10-20%5 through building energy upgrades. Using efficient appliances, electronics, and other miscellaneous items — such as escalators, garage door openers, and automatic doors — can significantly increase a building’s efficiency while saving on operational costs. Existing buildings will likely need to undergo upgrades by shifting to electric heating systems and using renewable energy, while new construction should be designed to use 100% on or off-site renewable energy.
■ Embodied carbon emissions consider the lifecycle of every material in the building’s design and are permanent once the building is built. The process of extraction, manufacturing, delivery, construction, maintenance, and disposal of every material in the building should be considered to reduce carbon emissions — especially in aluminum, steel, and the industry’s biggest offender: concrete.
Source: Architecture 20302
We are living in a materials world — and that material is concrete.
The Stone Age. The Bronze Age. The Iron Age. Human history is often defined by the materials we master at certain times.6 By those standards, we, the people of the 21st century, are living through The Concrete Age.
“At the dawn of the industrial revolution approximately 200 years ago, the carbon footprint of humanity was close to zero. Today, humanity’s carbon footprint is more than half of our overall ecological footprint, resulting in humans using far more resources than could be renewed each year — equivalent to the renewable resources of 1.6 Earths. Recent reports have indicated that since the introduction of Portland cement around 200 years ago, our built environment is now outgrowing the natural environment that has existed for millions of years. This is driven primarily by rapid urbanization. By 2050, 80% of the world’s population is expected to live in cities.”
— Brant Walkley, World Economic Forum7
Thornton Tomasetti’s CORE studio has devleoped several tools that enable engineers and architects to visualize and then optimize their projects to reduce embodied carbon.BEACON, an open source Revit plug-in, allows designers to visualize total embodied carbon by floor level, structural material (steel, concrete, re-bar, or timber), and also by framing type (column, floor, wall, and foundation). Their Spotlight web tool can then perform both a cost and embodied carbon estimate for the project, with the ability to show timebased comparisons and optimization.
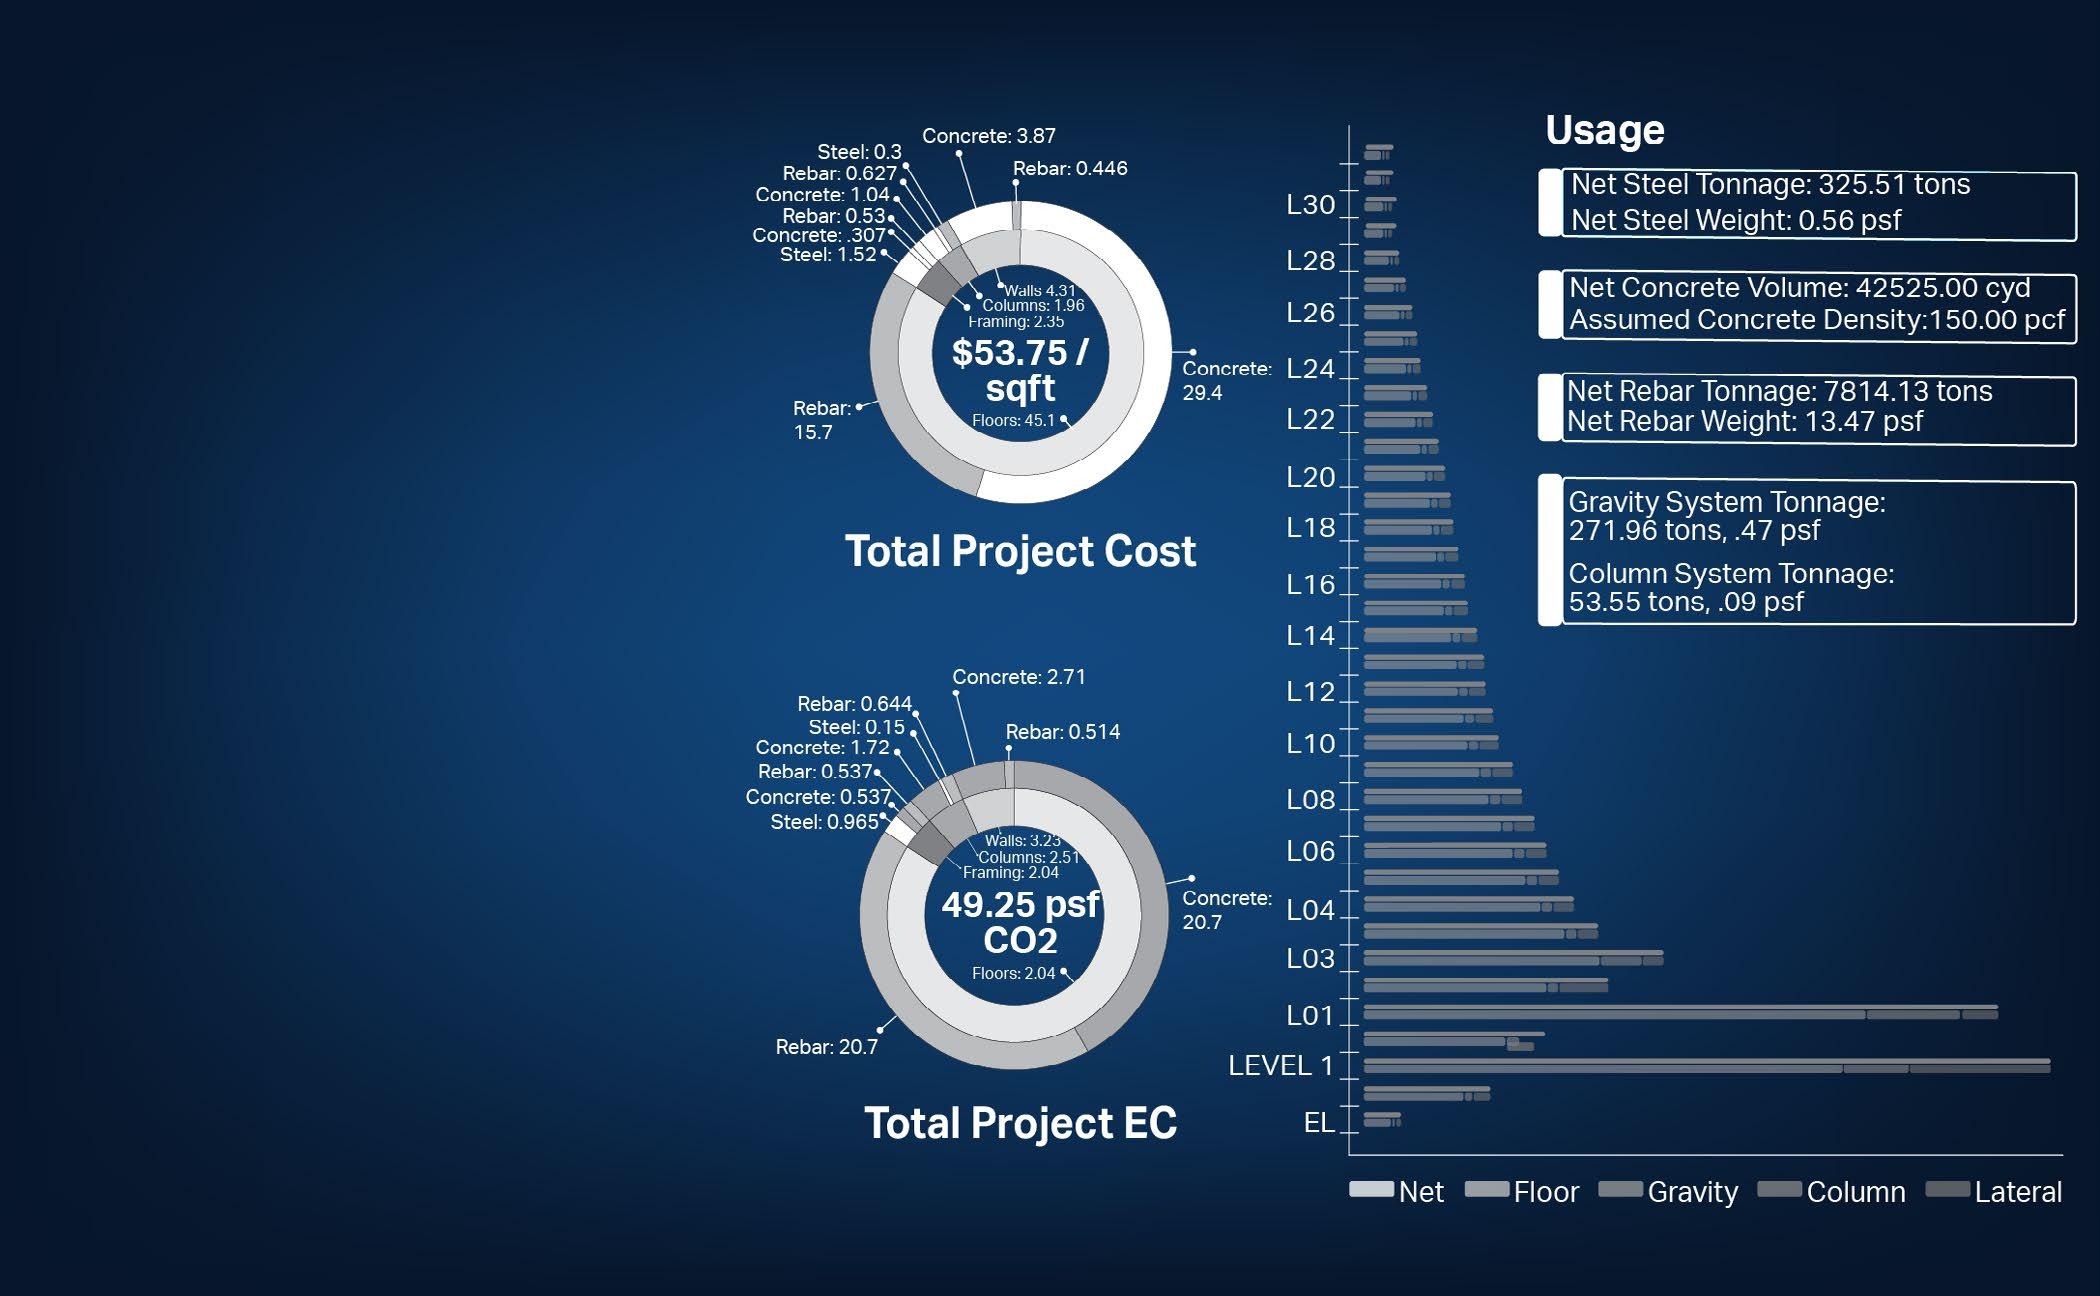
Architects and engineers alike have an affinity for concrete — it is inexpensive, durable, flexible in form, fire resistant, and lasts a lifetime. It’s the second most-used resource in the world, behind water,8 with an estimated 26 billion tons produced annually worldwide.9 And we aren’t expecting to kick our concrete habit anytime soon. According to Brent Rollins, a concrete scientist, and Vice President of Business Development for Spray-Lock, “If we could build a 4-foot wide, 4-inch-deep sidewalk out of the concrete we use every year, it would circle the earth at the equator 880 times. The same concrete sidewalk could make the trip to the moon and back 48 times.”
While cement makes up only 10% of the concrete mix, it is responsible for over 80-90% of concrete’s embodied carbon.10 It’s no wonder
why zero-carbon concrete is literally, and figuratively, the foundation of a global net-zero economy. “It will provide the foundations for our green energy systems, for climate-resilient infrastructure, for safe, healthy, and secure housing, for clean water and for low-carbon transportation around the world,” according to the World Economic Forum.8
However, without innovative interventions, cement production is on track to contribute nearly a quarter of all human-driven CO2 emissions by 2050.7 This is because energy — from non-renewable sources — is needed to produce the high temperatures to initiate the chemical reaction that turns limestone into cement. Reducing this electricity use — the largest emissions source during curing — is key and can be possibly streamlined by using waste heat.9 However, given the scale of the
industry, technologies that can reinvent the process of producing cement altogether will have a profound impact on global greenhouse gas emissions.
The concrete industry has a suite of options that can reduce its carbon footprint:8
■ Alternative fuels and the electrification of kilns can drive fossil fuels out of its energyuse.
■ Its transport infrastructure can be decarbonized.
■ Efficiency of material use can be maximized, buildings repurposed, and recycling can be promoted (concrete is 100% recyclable).
■ Carbon-capture technology can also be employed to manage unavoidable process emissions.
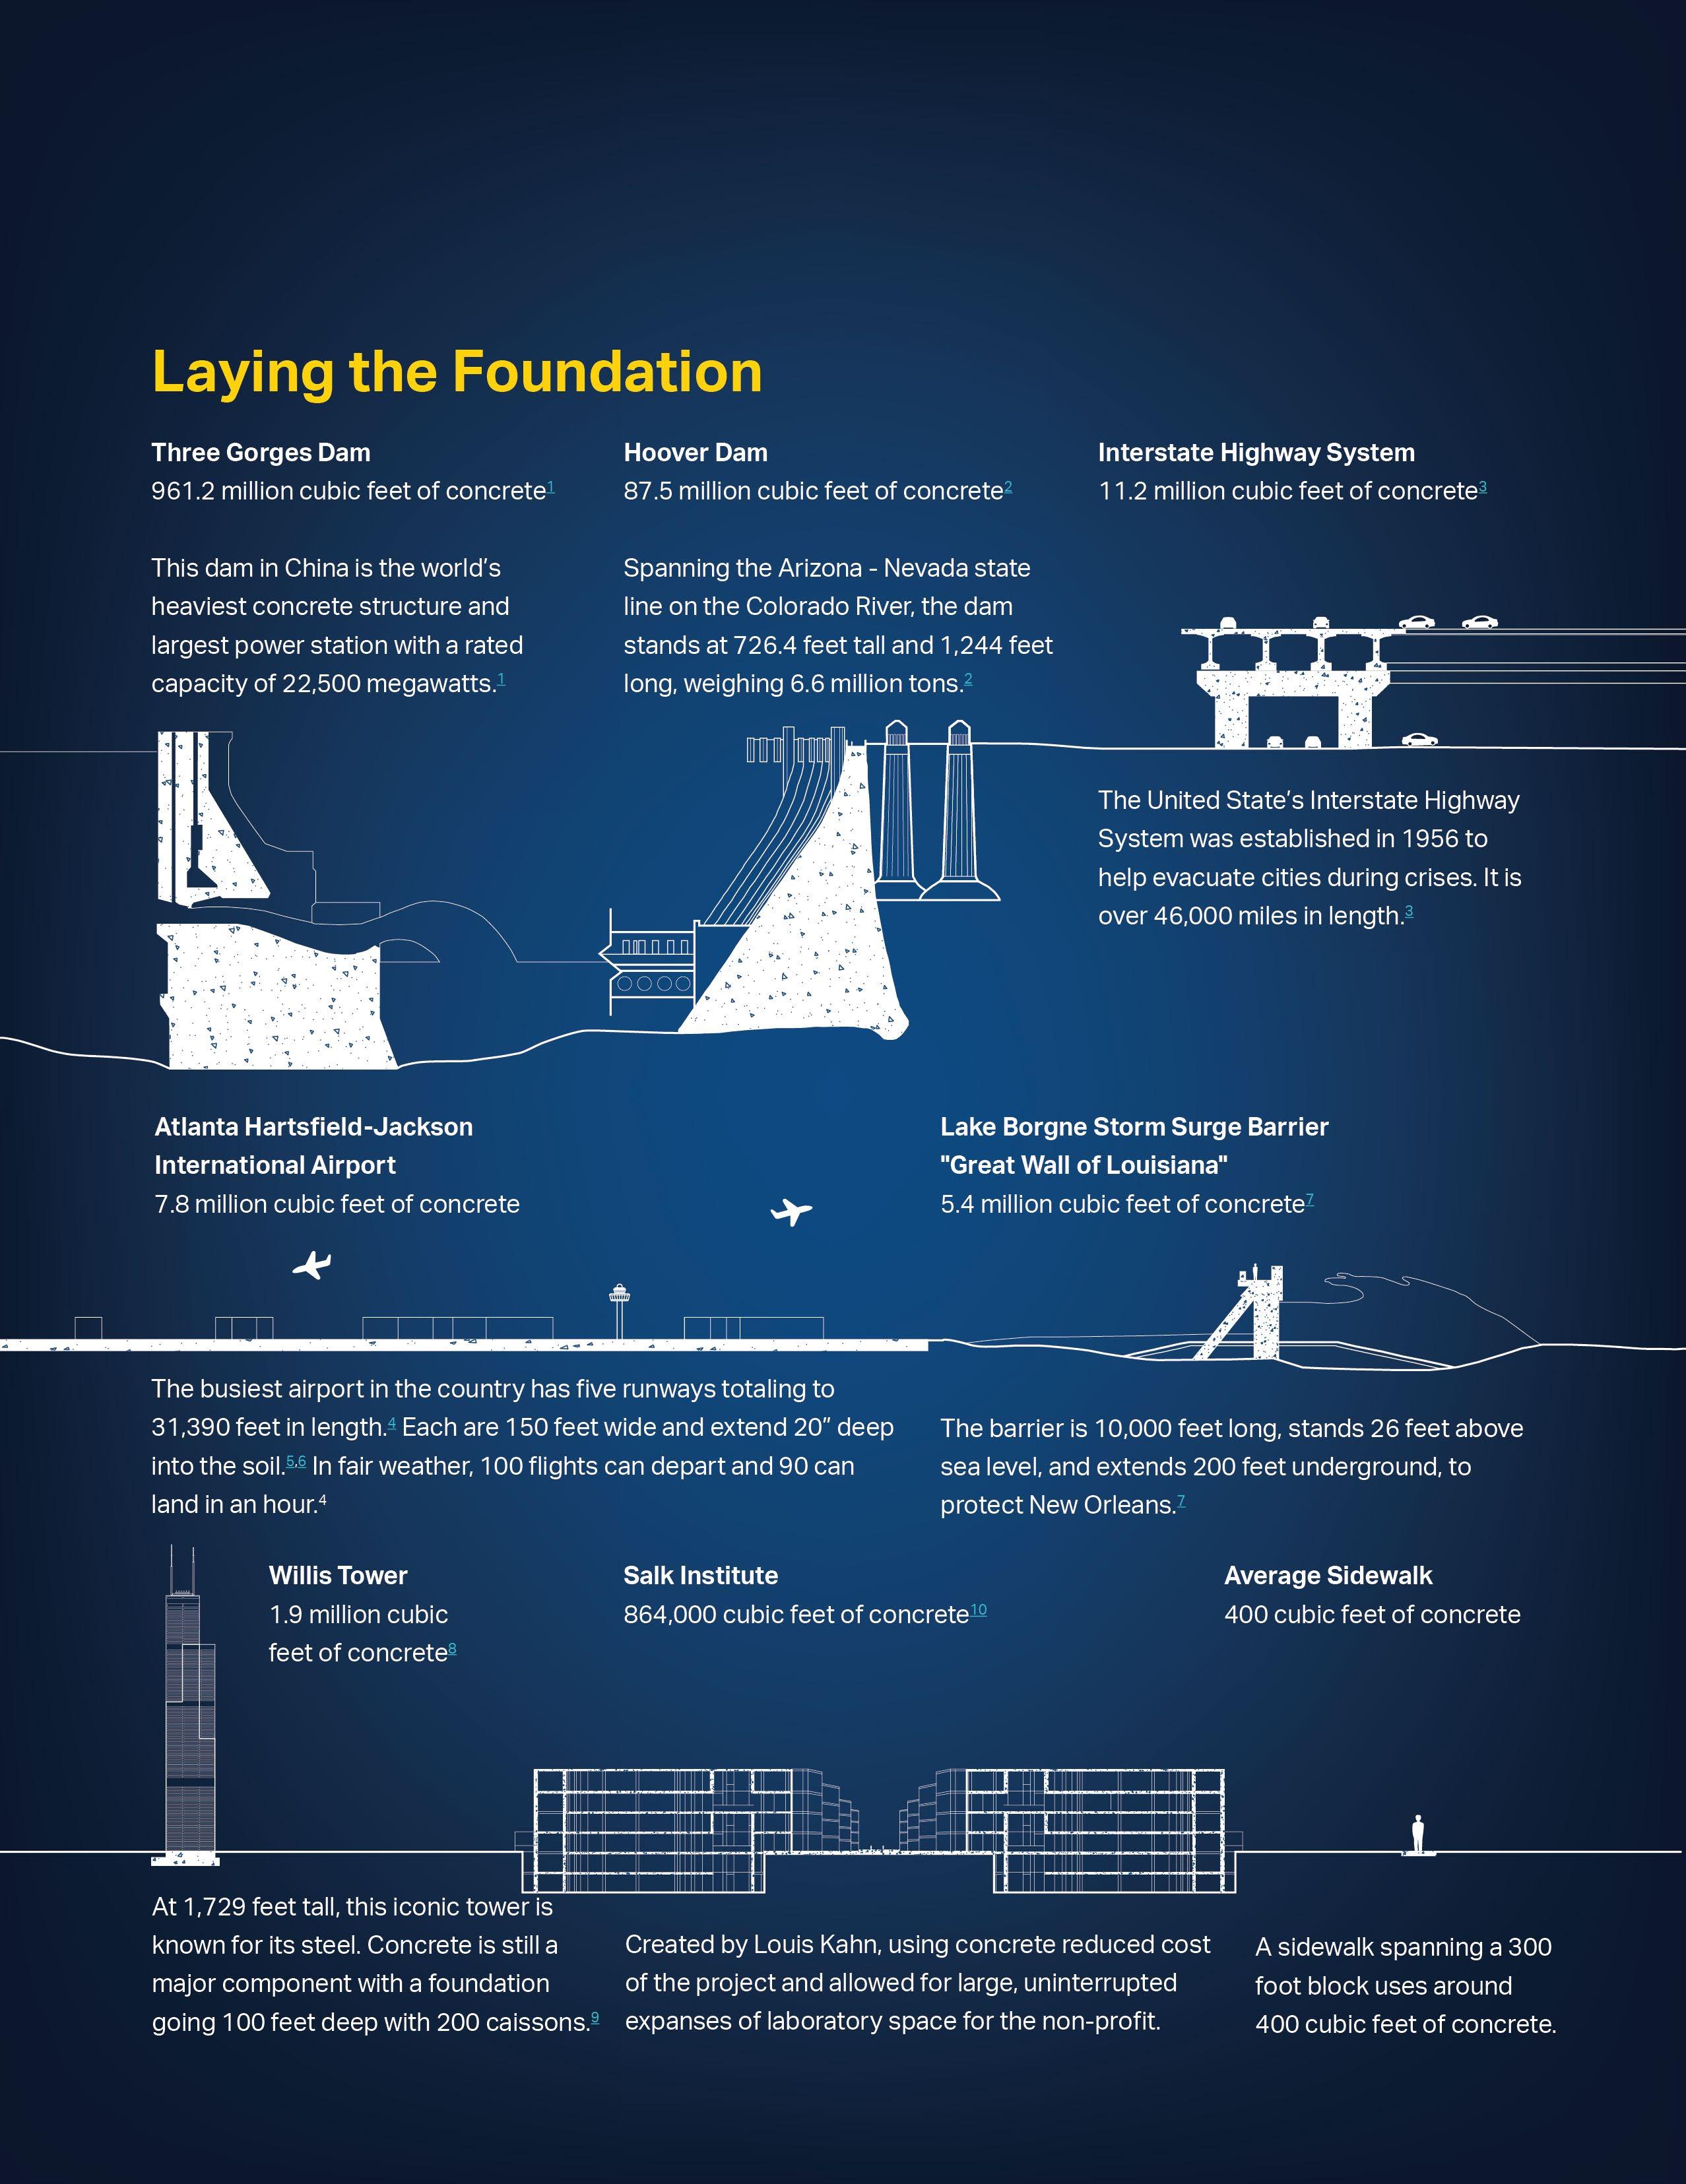
Researchers and practitioners are hard at work putting their innovations to the test. Companies like CarbonCure and XPrize winner, CarbonBuilt, are exploring ways to inject captured carbon into the concrete itself, which may also improve the strength and durability of concrete. “Improving the lifetime of our concrete is the most important thing we can do. When concrete is more durable, we will need less for repairs – building structure will span further, roads will last longer,” says Rollins. Another way the industry is taking steps to reduce CO2 emissions in the process is by using industrial waste by-products called geopolymers, such as blast furnace slag or coal fly ash. “More environmentally friendly geopolymer cements are used in less than 1% of all concrete today,” says Rollins. “If the cement companies decide to get behind the idea, my guess is that we could be up to 25% in 10 years.” And depending on the technology used, this could reduce emissions between 50% and 80%.7
In addition to geopolymers, researchers at Lancaster University are turning to carrots to increase durability, use less cement, and overall, reduce CO2 emissions. And while building our future buildings with food waste may seem like an outlandish idea, they are not the only ones investigating this solution.
Brent Rollins has partnered with the North American manufacturer SIS Group to research cement-based material with zero conventional rock or sand, using a 100% renewable agricultural waste in their place. The resulting material — called Hi-
StrainTM Concrete — is as strong in compression as conventional concrete, but several times stronger in flexure and tension. SIS Group’s projects initial manufacturing is set to begin during the first quarter of 2022. “Concerns such as decay of the organic aggregate and attack by insects have all been addressed, providing an opportunity to use this material in most of the places conventional concrete is used today,” explains Rollins. “Improved thermal properties as well as energy absorption capabilities round out Hi-StrainTM Concrete’s offering to the construction market. With a modulus of elasticity nearer to that of wood than conventional concrete, beams tested in flexure can bet observed visually to bend before the first cracks emerge – something that is unheard of in conventional concrete.” Another notable improvement is the lack of reinforcing steel needed in the construction of the precast elements – removing the potential for rebar corrosion completely, and ultimately neutralizing one of the leading causes of concrete durability problems.
The challenge now is to consider how we can increase the adoption of these new techniques. “The ready-mix industry already has tight margins but optimizing the mix using A.I. can increase that margin,” says Alex Hall, CEO of Concrete AI, a company that uses the power of big data and machine learning to leapfrog concrete design by optimizing concrete mixes for carbon reduction and therefore, carbon offsets. And soon, with quantum computing, this process will be even quicker and less energy intensive to execute.
Reaching net-zero emissions in concrete will require more than the participation and exploration from producers – it also needs collaboration from customers and regulators. Hall believes it’s imperative to start seeing carbon credits as a revenue stream. “The client is currently left out of the equation,” explains Hall. “They are integral to adopting these innovations and need to reap a benefit so we can continue to reduce the carbon content in our buildings.” Using blockchain, carbon credits can be achieved by the producer, and trade hands to the building owner once construction is complete. And it doesn’t stop with building owners and operators – city planners, designers, and architects all need to understand the potential of using concrete more efficiently and will therefore need more clarity on lowcarbon label claims and carbon credit ownership.8
Across the U.S., local governments seem to be taking the first steps by requiring new construction to use “low embodied carbon concrete”. The World Economic Forum reports that, “In New York and New Jersey, lawmakers have proposed state-level policies that would provide price discounts in the bidding process to proposals with the lowest emissions from concrete. These policies could serve as a blueprint for reducing carbon emissions from concrete production and other building materials.”9
We have a lot of work to do. And building the right foundation is key to successfully achieving net-zero and zeroenergy building goals across the world.
The Office Buzz
CREATING ENERGY IN THE WORKPLACE
Developing disparate energies in a workplace is critical to establishing a motivational and enriching atmosphere for a variety of users and needs. Incorporating and balancing both dynamic and sustained energies throughout space can be managed through strategic design.
Creating different energies in the workplace caters to the variety of users occupying the space and their related workplace needs. Often, these needs change throughout the day depending on the task, activity, or group. Zones capturing each type of energy protect and designate space for these dissimilar purposes.
Dynamic energy (vibrant, offering serotonin release such as being excited to see someone, laughter) needs to be balanced with sustained energy (motivating energy without distraction for focus). While both energies can occur throughout a workplace, managing how they are deployed can help to avoid undesirable spatial qualities as well as providing buffer, connective spaces between them.
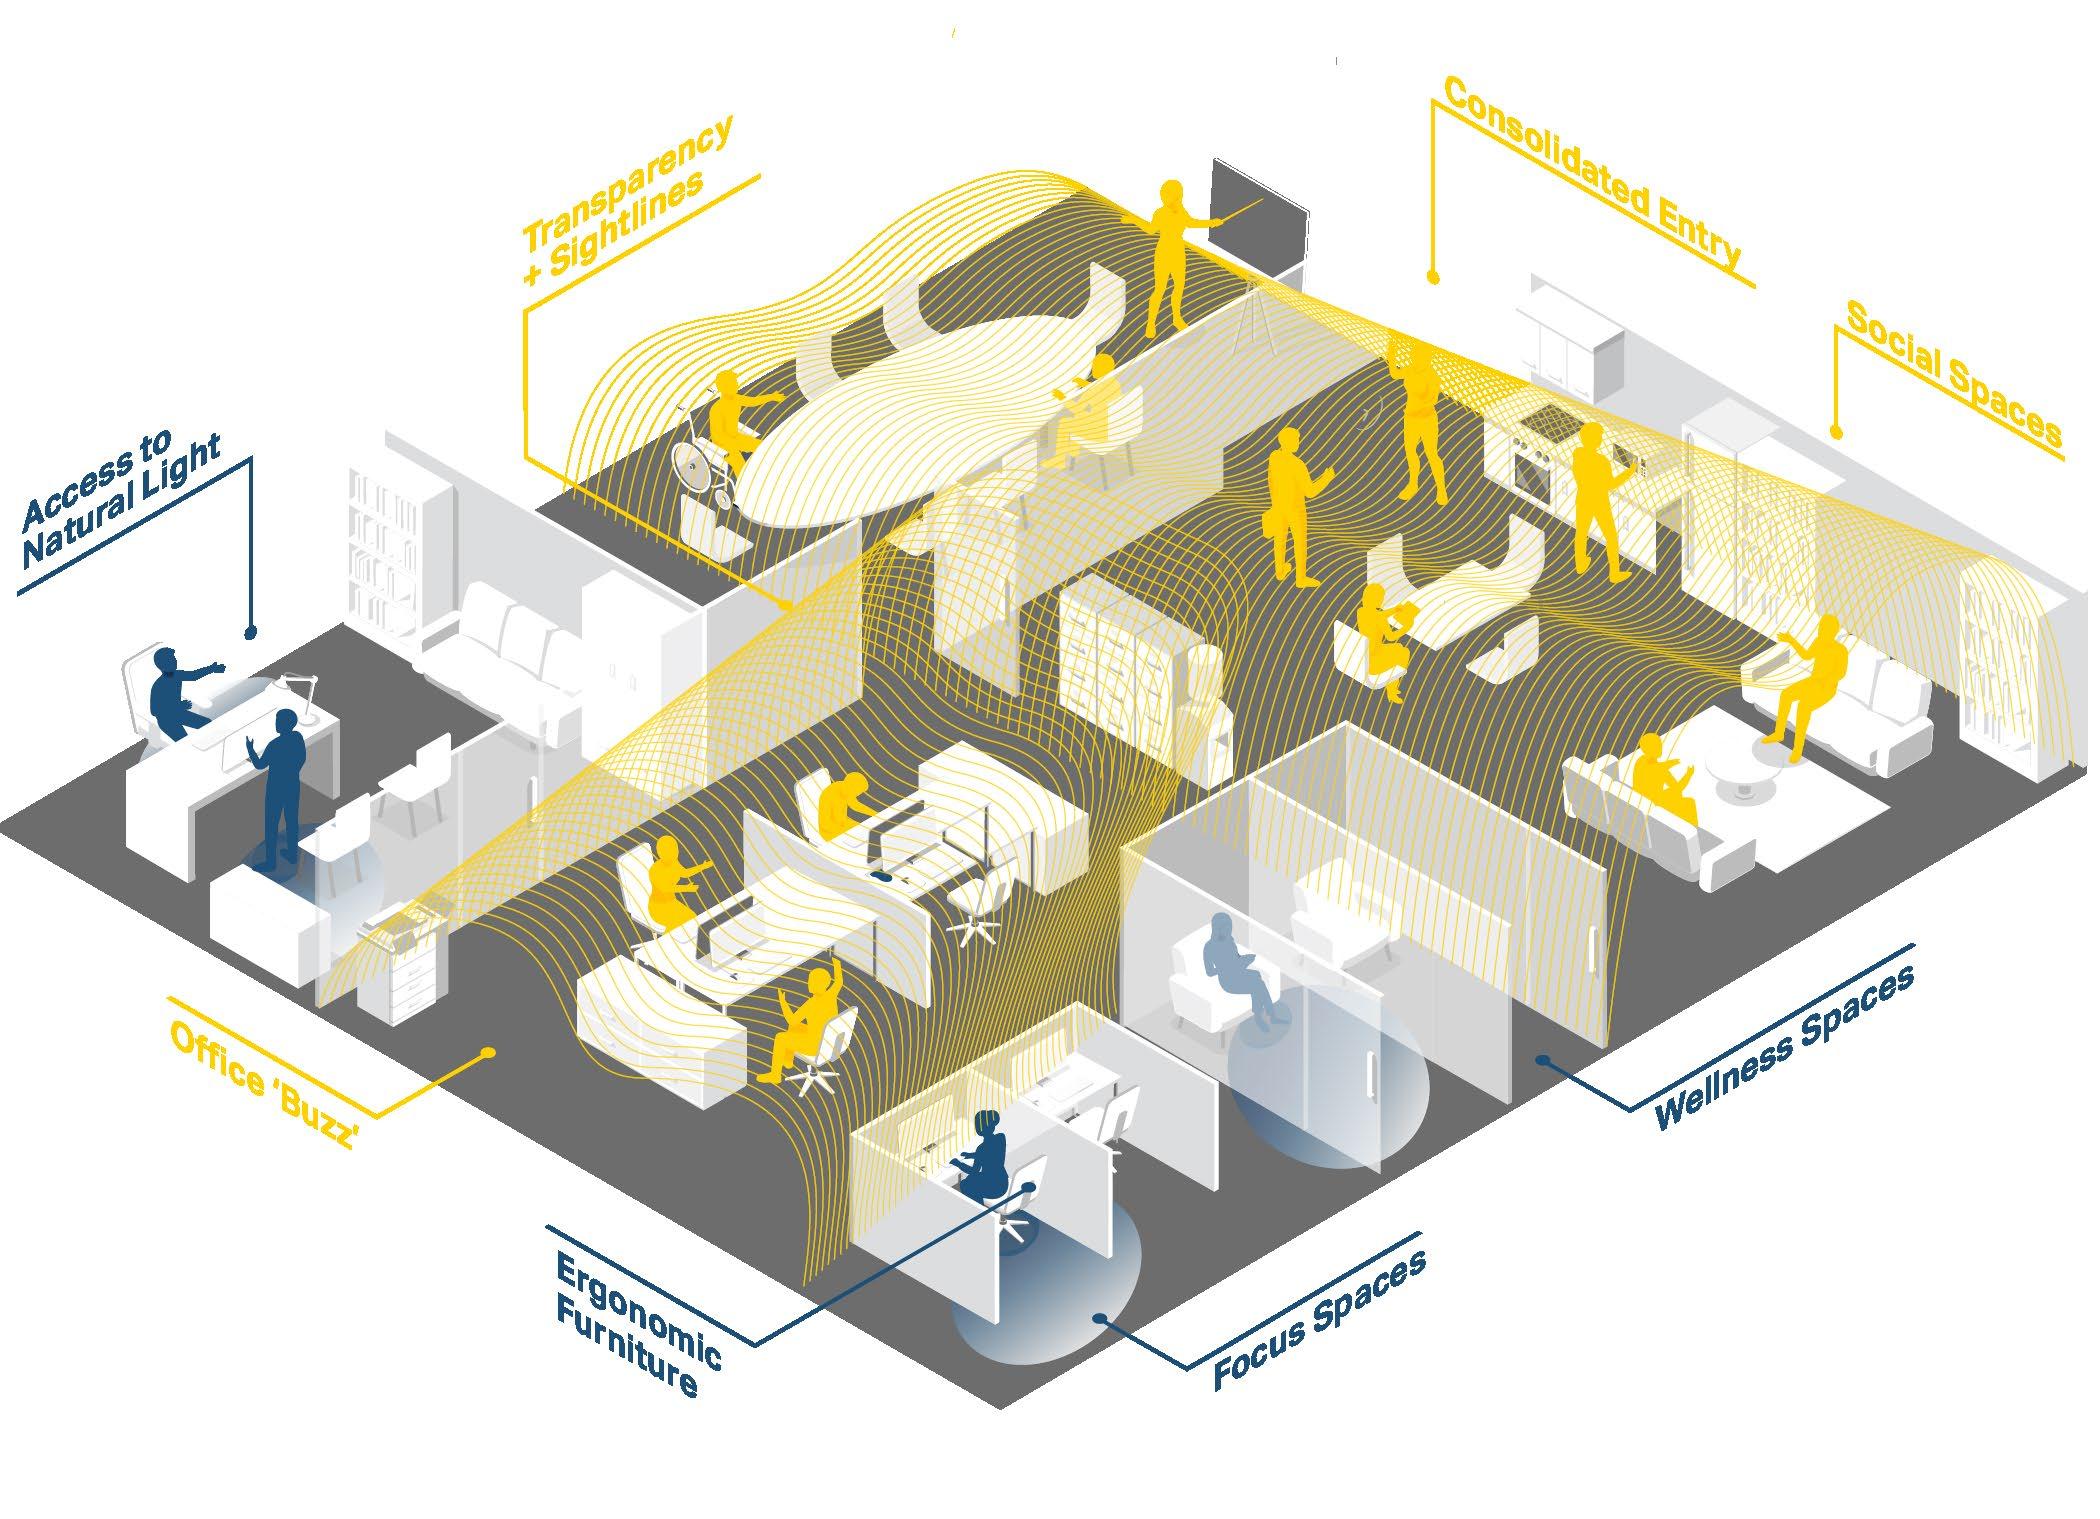
DYNAMIC ENERGY
Dynamic energy often occurs in shared spaces in high traffic areas including support spaces, multi-purpose spaces, and collaboration spaces.
■ Consolidated Entry Point + Employee Lobby Space
Funneling everyone through one entry point creates a common experience and provides moments for spontaneous interaction. This space can offer amenities to draw in users such as a welcoming host/receptionist and access to lifestyle amenities such as coffee or Amazon lockers for packages.
■ Intentional Sightlines
With varying stages of occupancy each day due to remote and hybrid workers, long views of empty cubicles may not be desirable. Sightlines can be managed through the creation of small expanses of space.
■ Places to Connect Socially
To promote relationship building between employees, social spaces provide opportunities for planned or unplanned interactions. These can include outdoor spaces, cafés, or lounge spaces.
■ Transparency
In opportune and appropriate locations, using glass allows people to see when spaces are occupied and provides views to others working towards a common goal, enhancing motivation.
CORGAN CASE STUDY: THE WORKFORCE EVALUATION
In working with a recent home decor retail client, Corgan’s Workplace Strategy team developed solutions to address the needs of a new set of users in their corporate office ranging from resident workers to fully hybrid workers. The office composition changes daily, and each user type will have a different experience. Differing design solutions were needed to support each unique worker’s job while promoting workplace interaction and productivity, whether in person or hybrid. To create a workplace matching various needs, distinct zones were developed to intentionally distinguish shared, collaboration spaces from individual workspaces with flexible, connective spaces between them. The design also created a focused entry for employees to promote passive interaction and invigorate the space with energy. This approach aims to achieve an energized atmosphere that is adaptable, welcoming, and productive.
SUSTAINED ENERGY
Sustained energy is often desired at spaces focused on the individual worker including workspaces and other private or focus spaces.
■ Wellness Spaces
Wellness spaces in the workplace offer reprieve and privacy to address personal needs. These can include meditation rooms, outdoor spaces, walking trails, or fitness rooms.
■ Access to Natural Light
Natural light is critical for worker satisfaction, productivity, and wellbeing. Areas with sustained energy are where employees typically spend most of their day and natural light is key in these highly frequented spaces.
■ Office ‘Buzz’ + Sound
While quiet is important for focus, allowing some sound to drift can offer a consistent ‘buzz,’ making distractions less noticeable. Be cautious to not place areas of focus next to loud areas (e.g., break rooms).
■ Ergonomic Furniture
By providing ergonomic furniture, employees can personalize their set-up to meet their needs throughout the day including adjusting posture, sitting, or standing.
■ Focus Space
Focus spaces offer minimal sound and visual distractions, allowing for deep work and thinking.
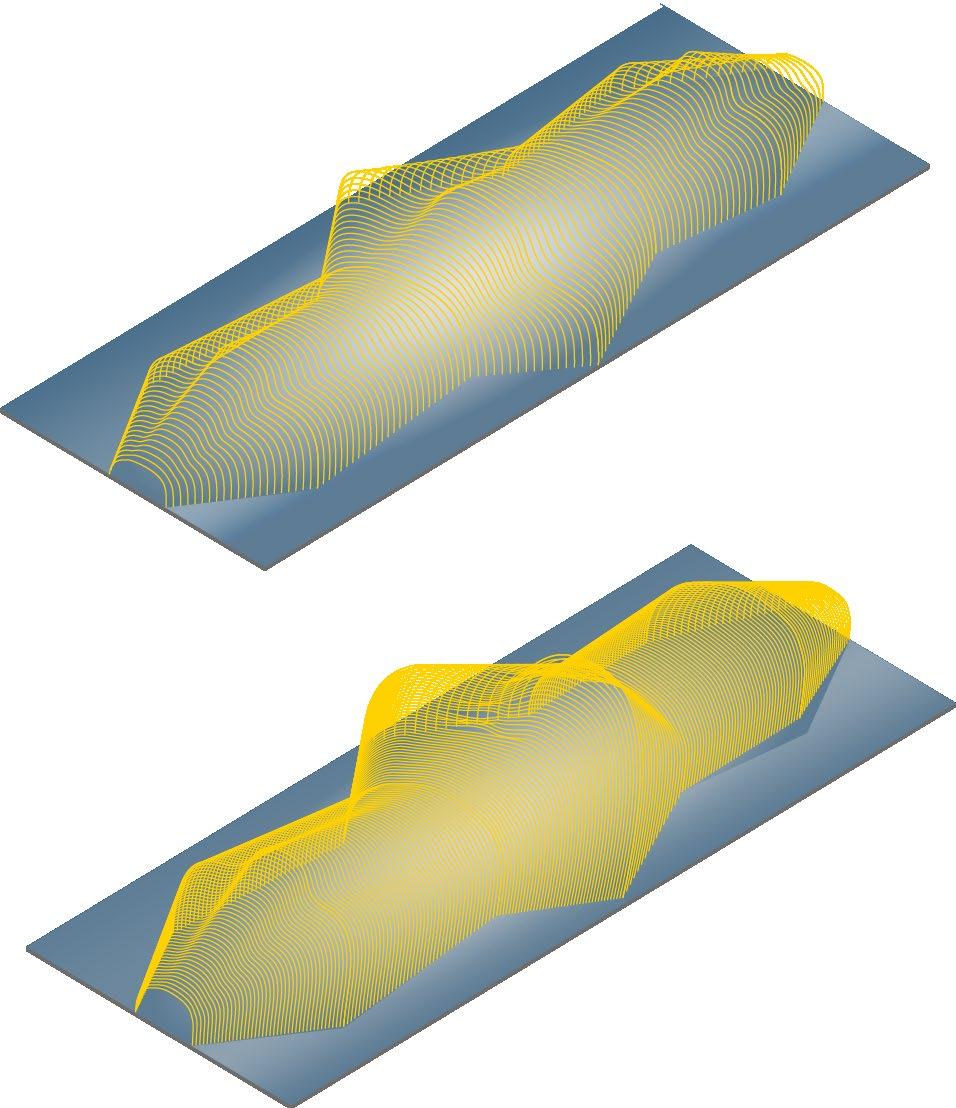
You cannot create new energy. You can only transfer it in new ways.
“The
Law of Conservation of Energy states that energy can neither be created nor destroyed — only converted from one form of energy to another. This means that a system always has the same amount of energy…”1
Our personal energy is a finite resource. While the pandemic and our subsequent “return” to work and school has reminded us of our own limitations, personal energy has been a topic of interest for much longer. In a study reviewing 50 years of career and workfamily literature, most of the findings reinforce that “heavy allocation of time and energy to career success meant individuals were constrained to allocate less energy to managing [work-family] roles and family success generally.”2
Deciding where to spend our energy is influenced by more than just work and family. We have personal passions, mental + physical health and wellbeing, cultural interests, and caregiving responsibilities that impact how we spend our time. And while they all hold importance in our lives, they can also drain our limited time and energy.
When many were initially forced to quarantine during the COVID-19 pandemic, we gained certain bits of time and energy back — no more commutes, less time socializing, and limited access to the outside world. Some found this extra time created a reasonable balance they hadn’t had before. Many others simply worked more, resulting in climbing burnout rates. In a survey from global job site Indeed, burnout was up by 9% in 2021 from pre-COVID-19.4 Burnout even made dictionary.com’s shortlist for 2021 word of the year.5
Employee
Burnout
Desires
With steadily rising burnout rates, workers want their employers to help address it by offering:
Society now has the unique opportunity to rewrite the script — not just reproducing what we did before or during the pandemic but by reimagining something new and better. We can scrutinize how we spend our limited resources as we return to the office, school, and our lives in general and ask: How can we be more mindful with our personal energy? Can we design a more sustainable and fulfilling life for ourselves?
There is now an increased desire for flexibility so that we may adopt schedules that work best for us individually (where it happens, how much time and energy is spent on it, etc.). This hyper focus on personalization and choice requires the spaces we use to respond. Strategies to do this may include:
■ Provide unique opportunities and spaces that support work and learning that aren’t available at home (social, focus, wellbeing spaces, etc.)
■ Provide options for spaces to work and learn in that provide flexibility throughout the day and environmental control
■ Design spaces unique to the organization, responding to their values and needs — not a cookie cutter environment
Survey conducted in the US in July 2021 with 2,000 workers.
Source: The Hartford3
■ Develop efficiency in flows — designated spaces and paths of circulation based on user and their unique needs
■ Offer a variety of spaces to meet differentiating needs — improving productivity so users can go home
“Every economic upheaval needs a name. Call this one The Great Reallocation. It might be disruptive for a little while, but the result just might be a more humane labor market.”6
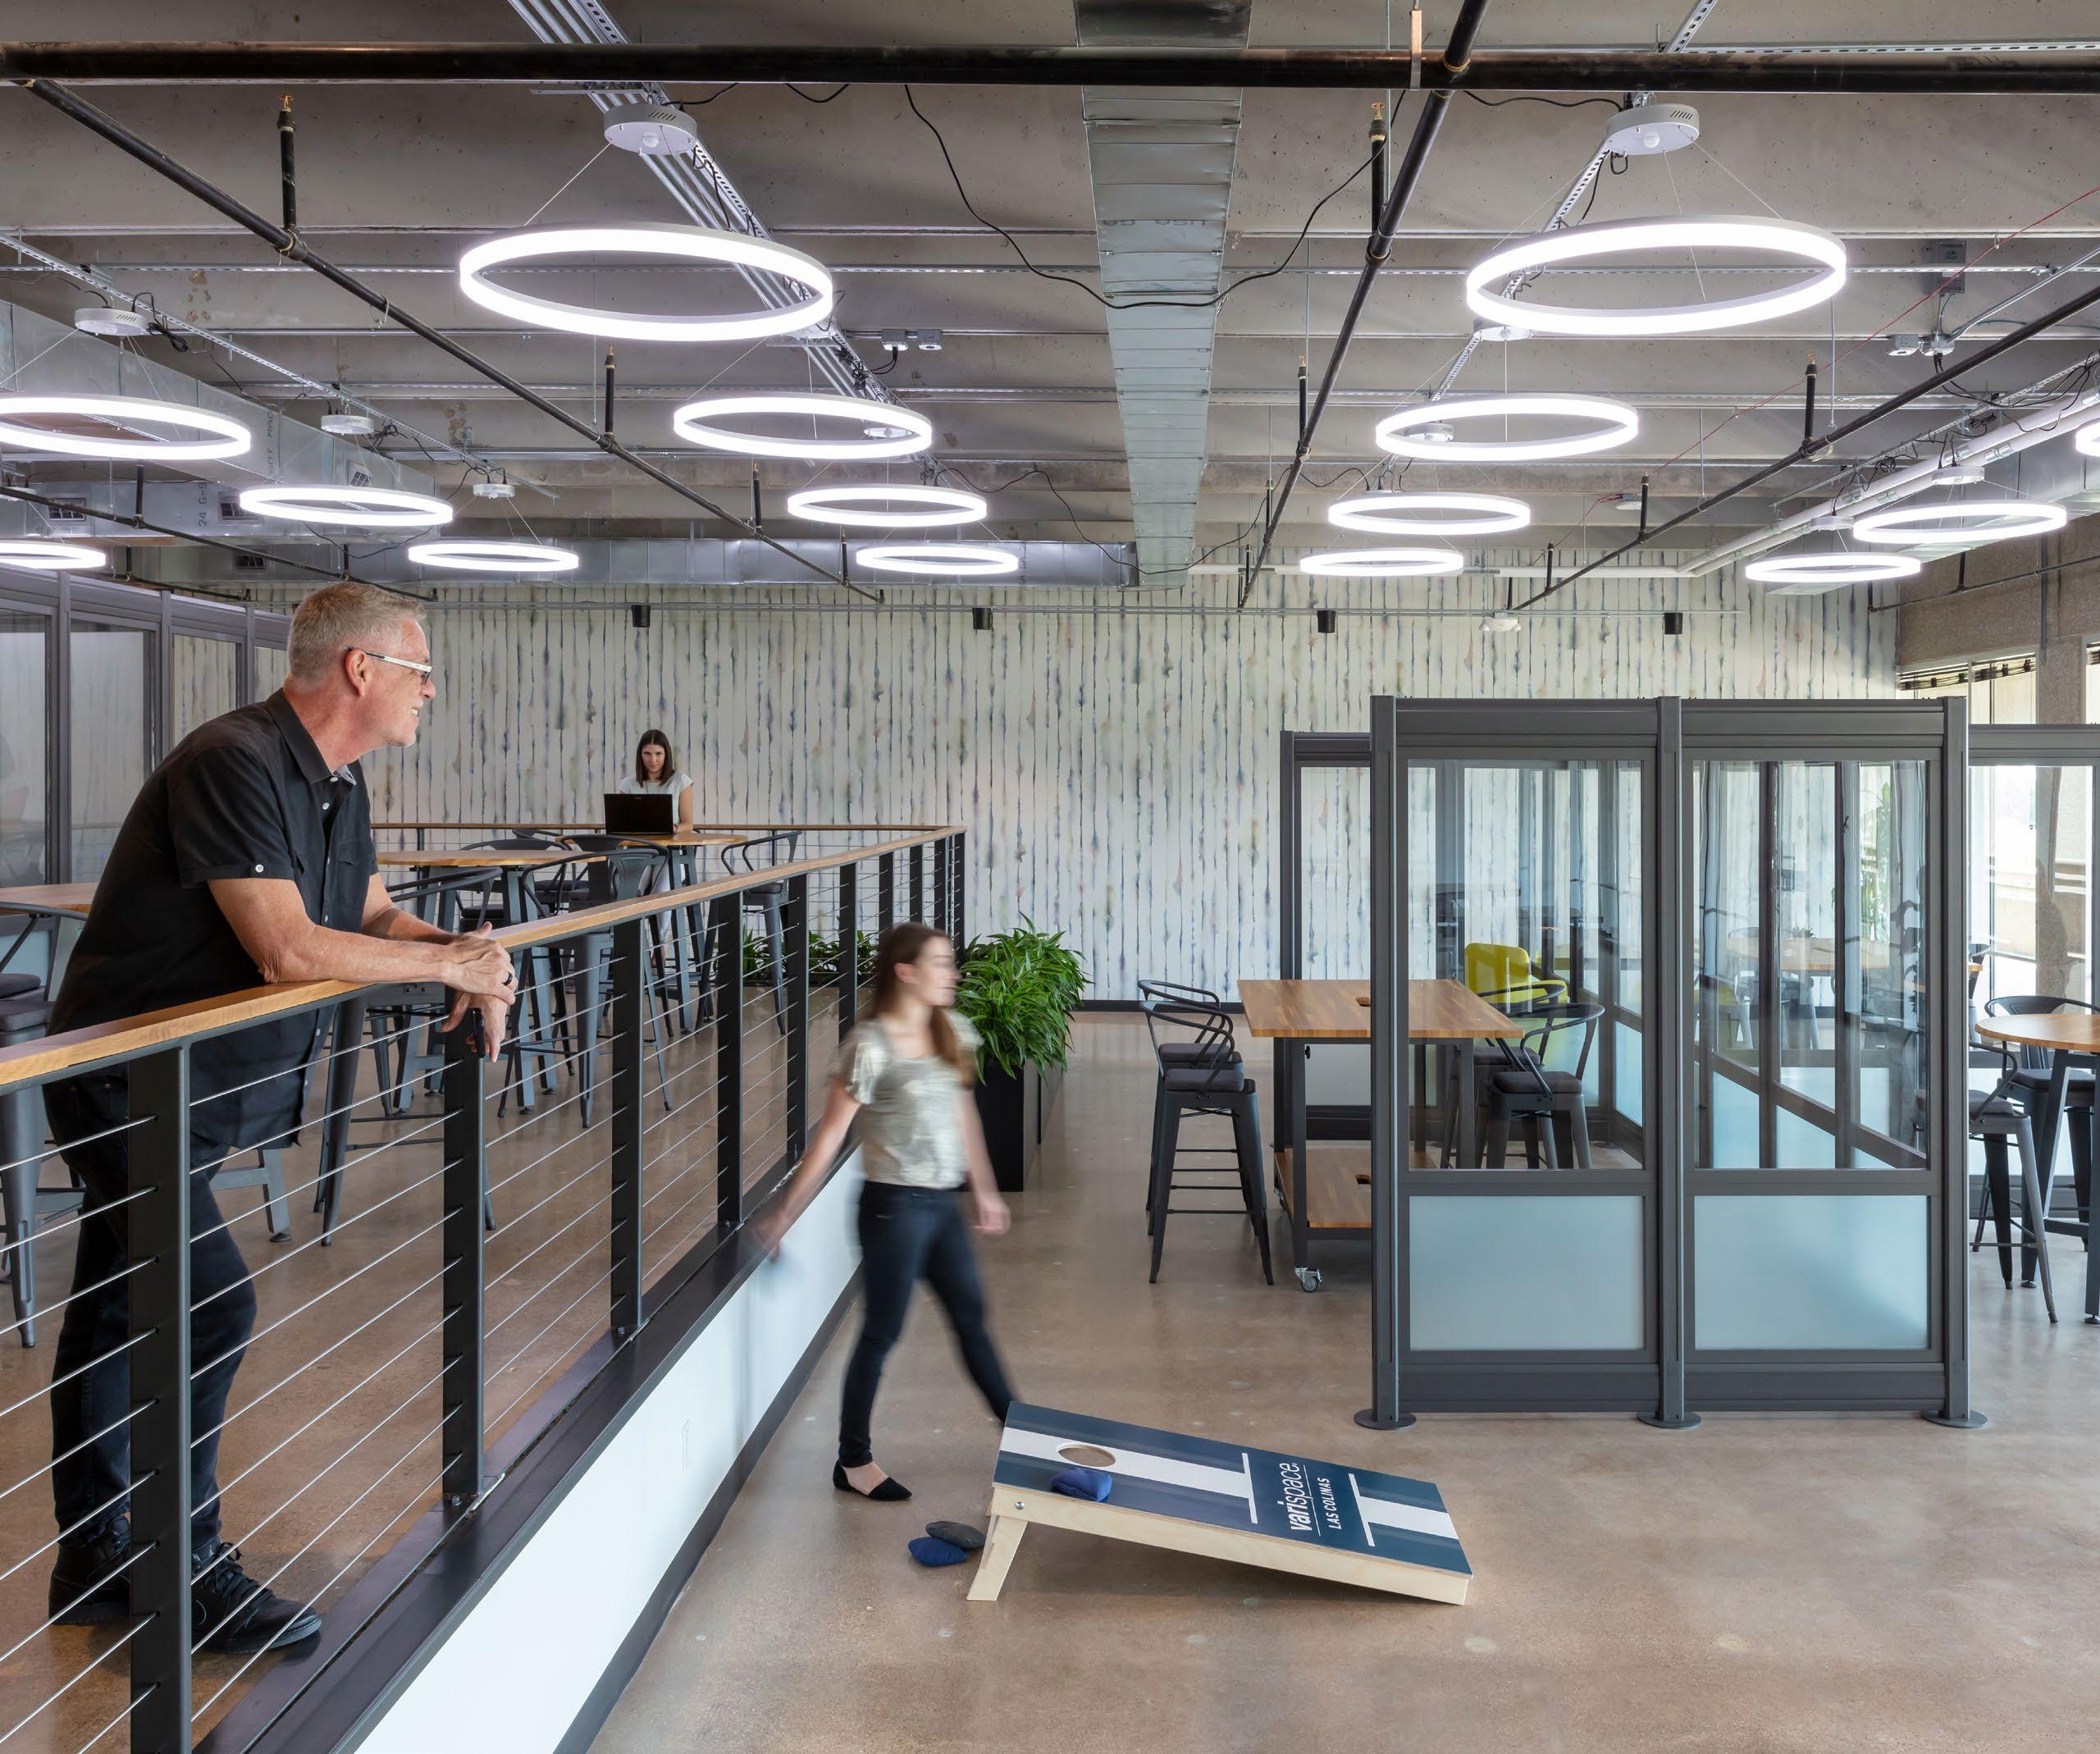
Workforce Evaluation Tool
As our clients navigate the future of the workplace, they are reevaluating how, when, and why they use their office. Hugo and Corgan’s Workplace Strategy team have developed a computational tool that assesses a client’s workforce needs by classifying employees on a spectrum of in-office resident, combination hybrid, or off-site remote worked based on employee self-assessment data. This data-driven strategy examines employee tasks, routines, flexibility preferences, collaboration styles, and management needs to inform evolving workplace solutions.
For more information on Corgan’s Workforce Evaluation Tool, please email: hugo@corgan.com
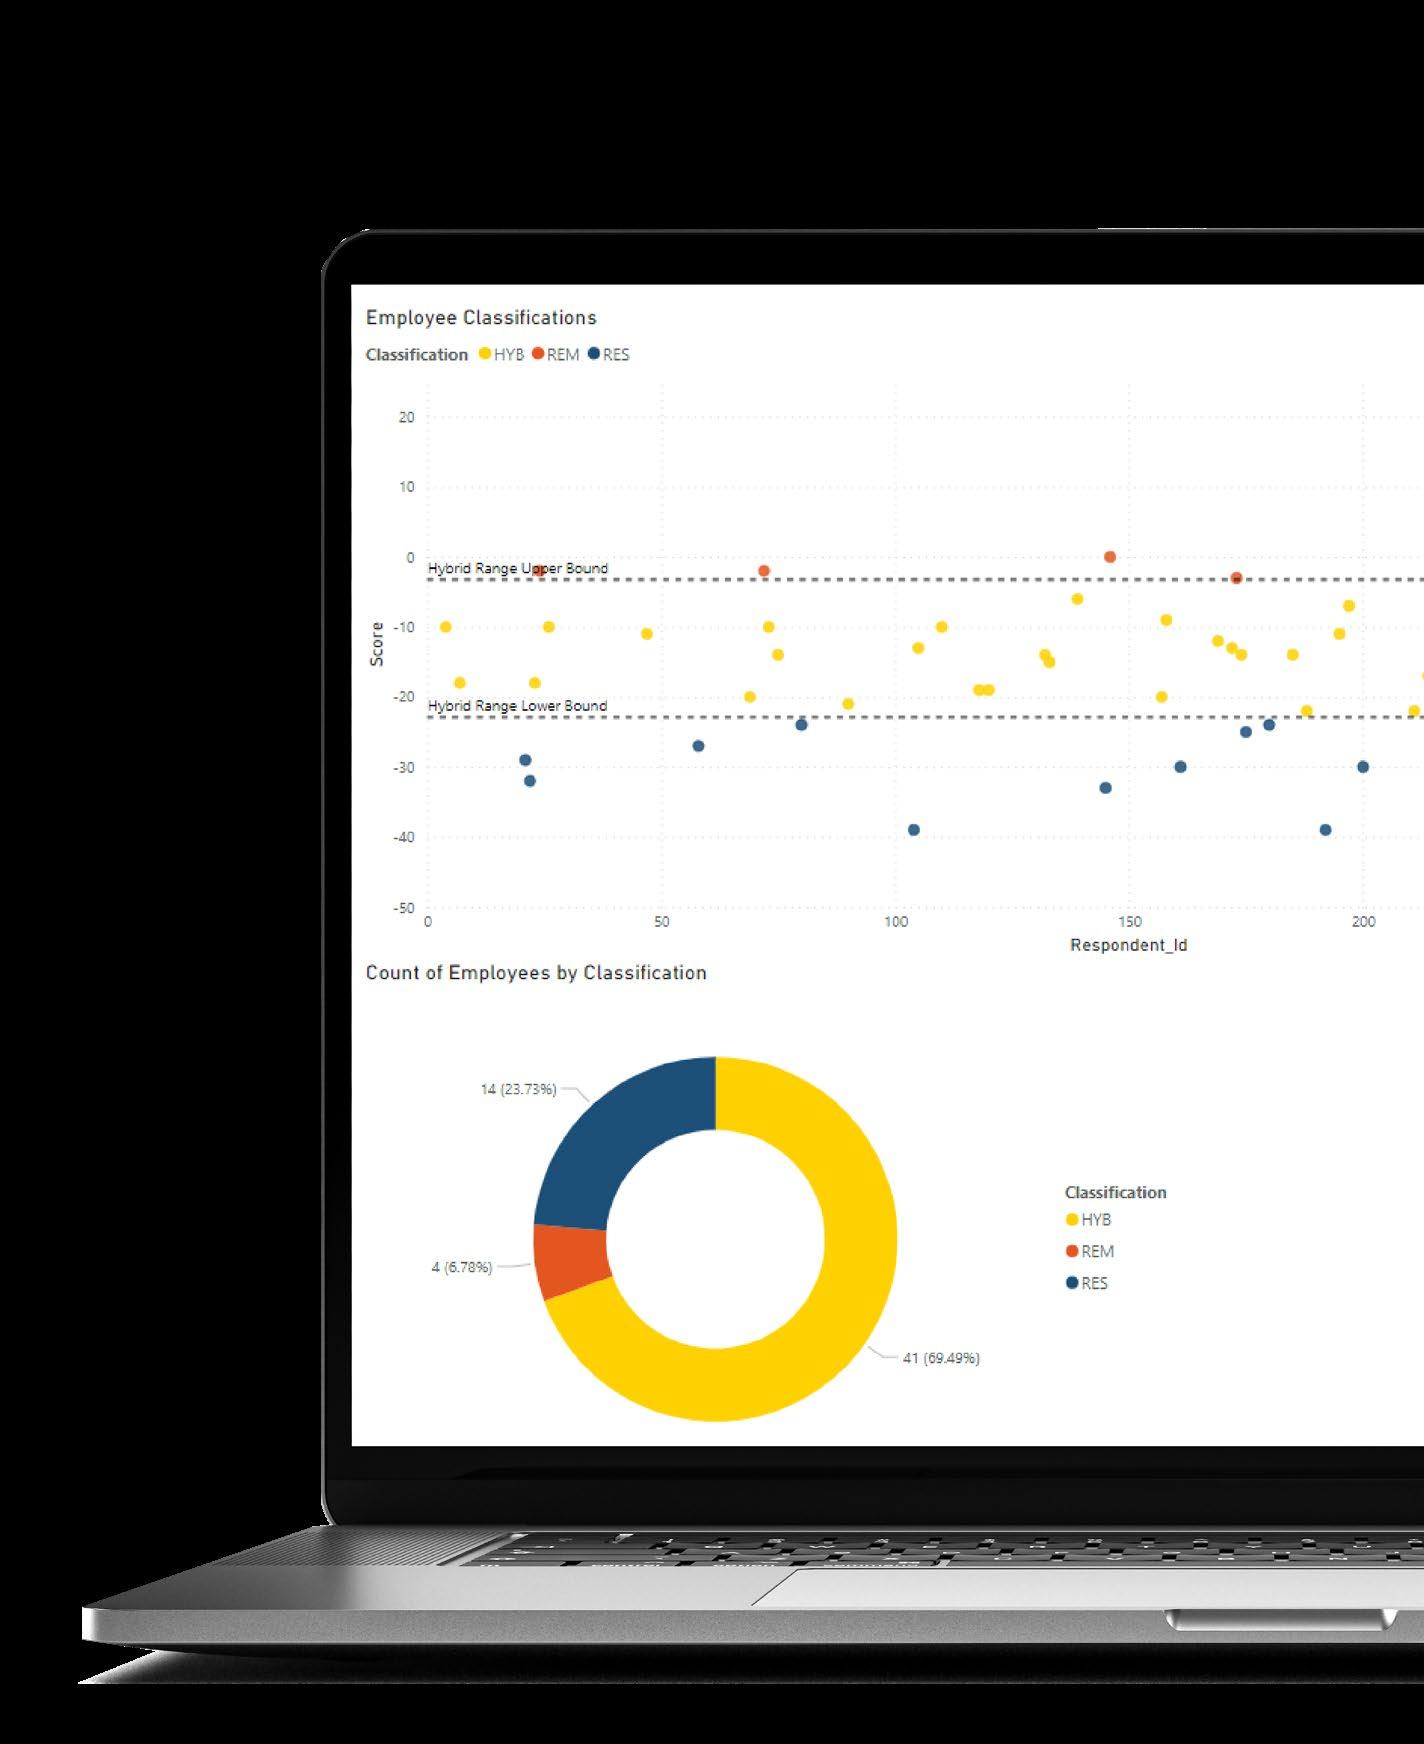


IDEA IN BRIEF
THE REALITY
Our modern-day travel experience is complex and multi-faceted, which in turn exerts a lot of energy and mental effort.
THE PROBLEM
While there are many options and services to choose from while traveling, they can feel disjointed and siloed; this can create compounding stress for passengers.
THE SOLUTION
A seamless travel experience that considers various touchpoints — inside and outside of the travel facility.

The Consolidated Travel Experience
REDUCING A PASSENGER’S MENTAL COGNITIVE LOAD
Our ability to travel long distances in relatively short periods of time relies on a tapestry of different transportation modes, services, and platforms. From booking and planning, to live updates and technology integration, the 21st century travel experience should be managed comprehensively from end-to-end to reduce any additional cognitive loads.
Using both qualitative and quantitative research methodologies, Corgan’s recent Mobility Next research findings suggest that people want more simplified and consolidated mobility experiences that reduce the amount of mental energy exerted during travel.
During in-depth interviews with recent travelers, participants reflected on their own experiences. They often reported feeling disjointed, overwhelmed, and frustrated by the lack of integration between different platforms and services, like ridesharing, flight booking, and lodging reservations.
■ “Travel is an experience to me. When you exit the door in your house, that’s when the journey starts.”
— International Traveler, in-depth interview
■ “I don’t have many travel rituals but there is a lot of preparation. When I traveled to Japan, I looked up places to visit, sites to see, and ways to get there.”
— International Traveler, in-depth interview
Additionally, a survey of 1,046 recent travelers found that 79% of participants believe a trip officially begins before they even arrive at the transportation facility. Furthermore, they believe trips can actually start from the moment they get the idea to travel, to when the flight is booked, or when they walk out the door with their luggage ― all of these moments represent potential touchpoints and opportunities for mobility companies to provide consolidated and seamless experiences.
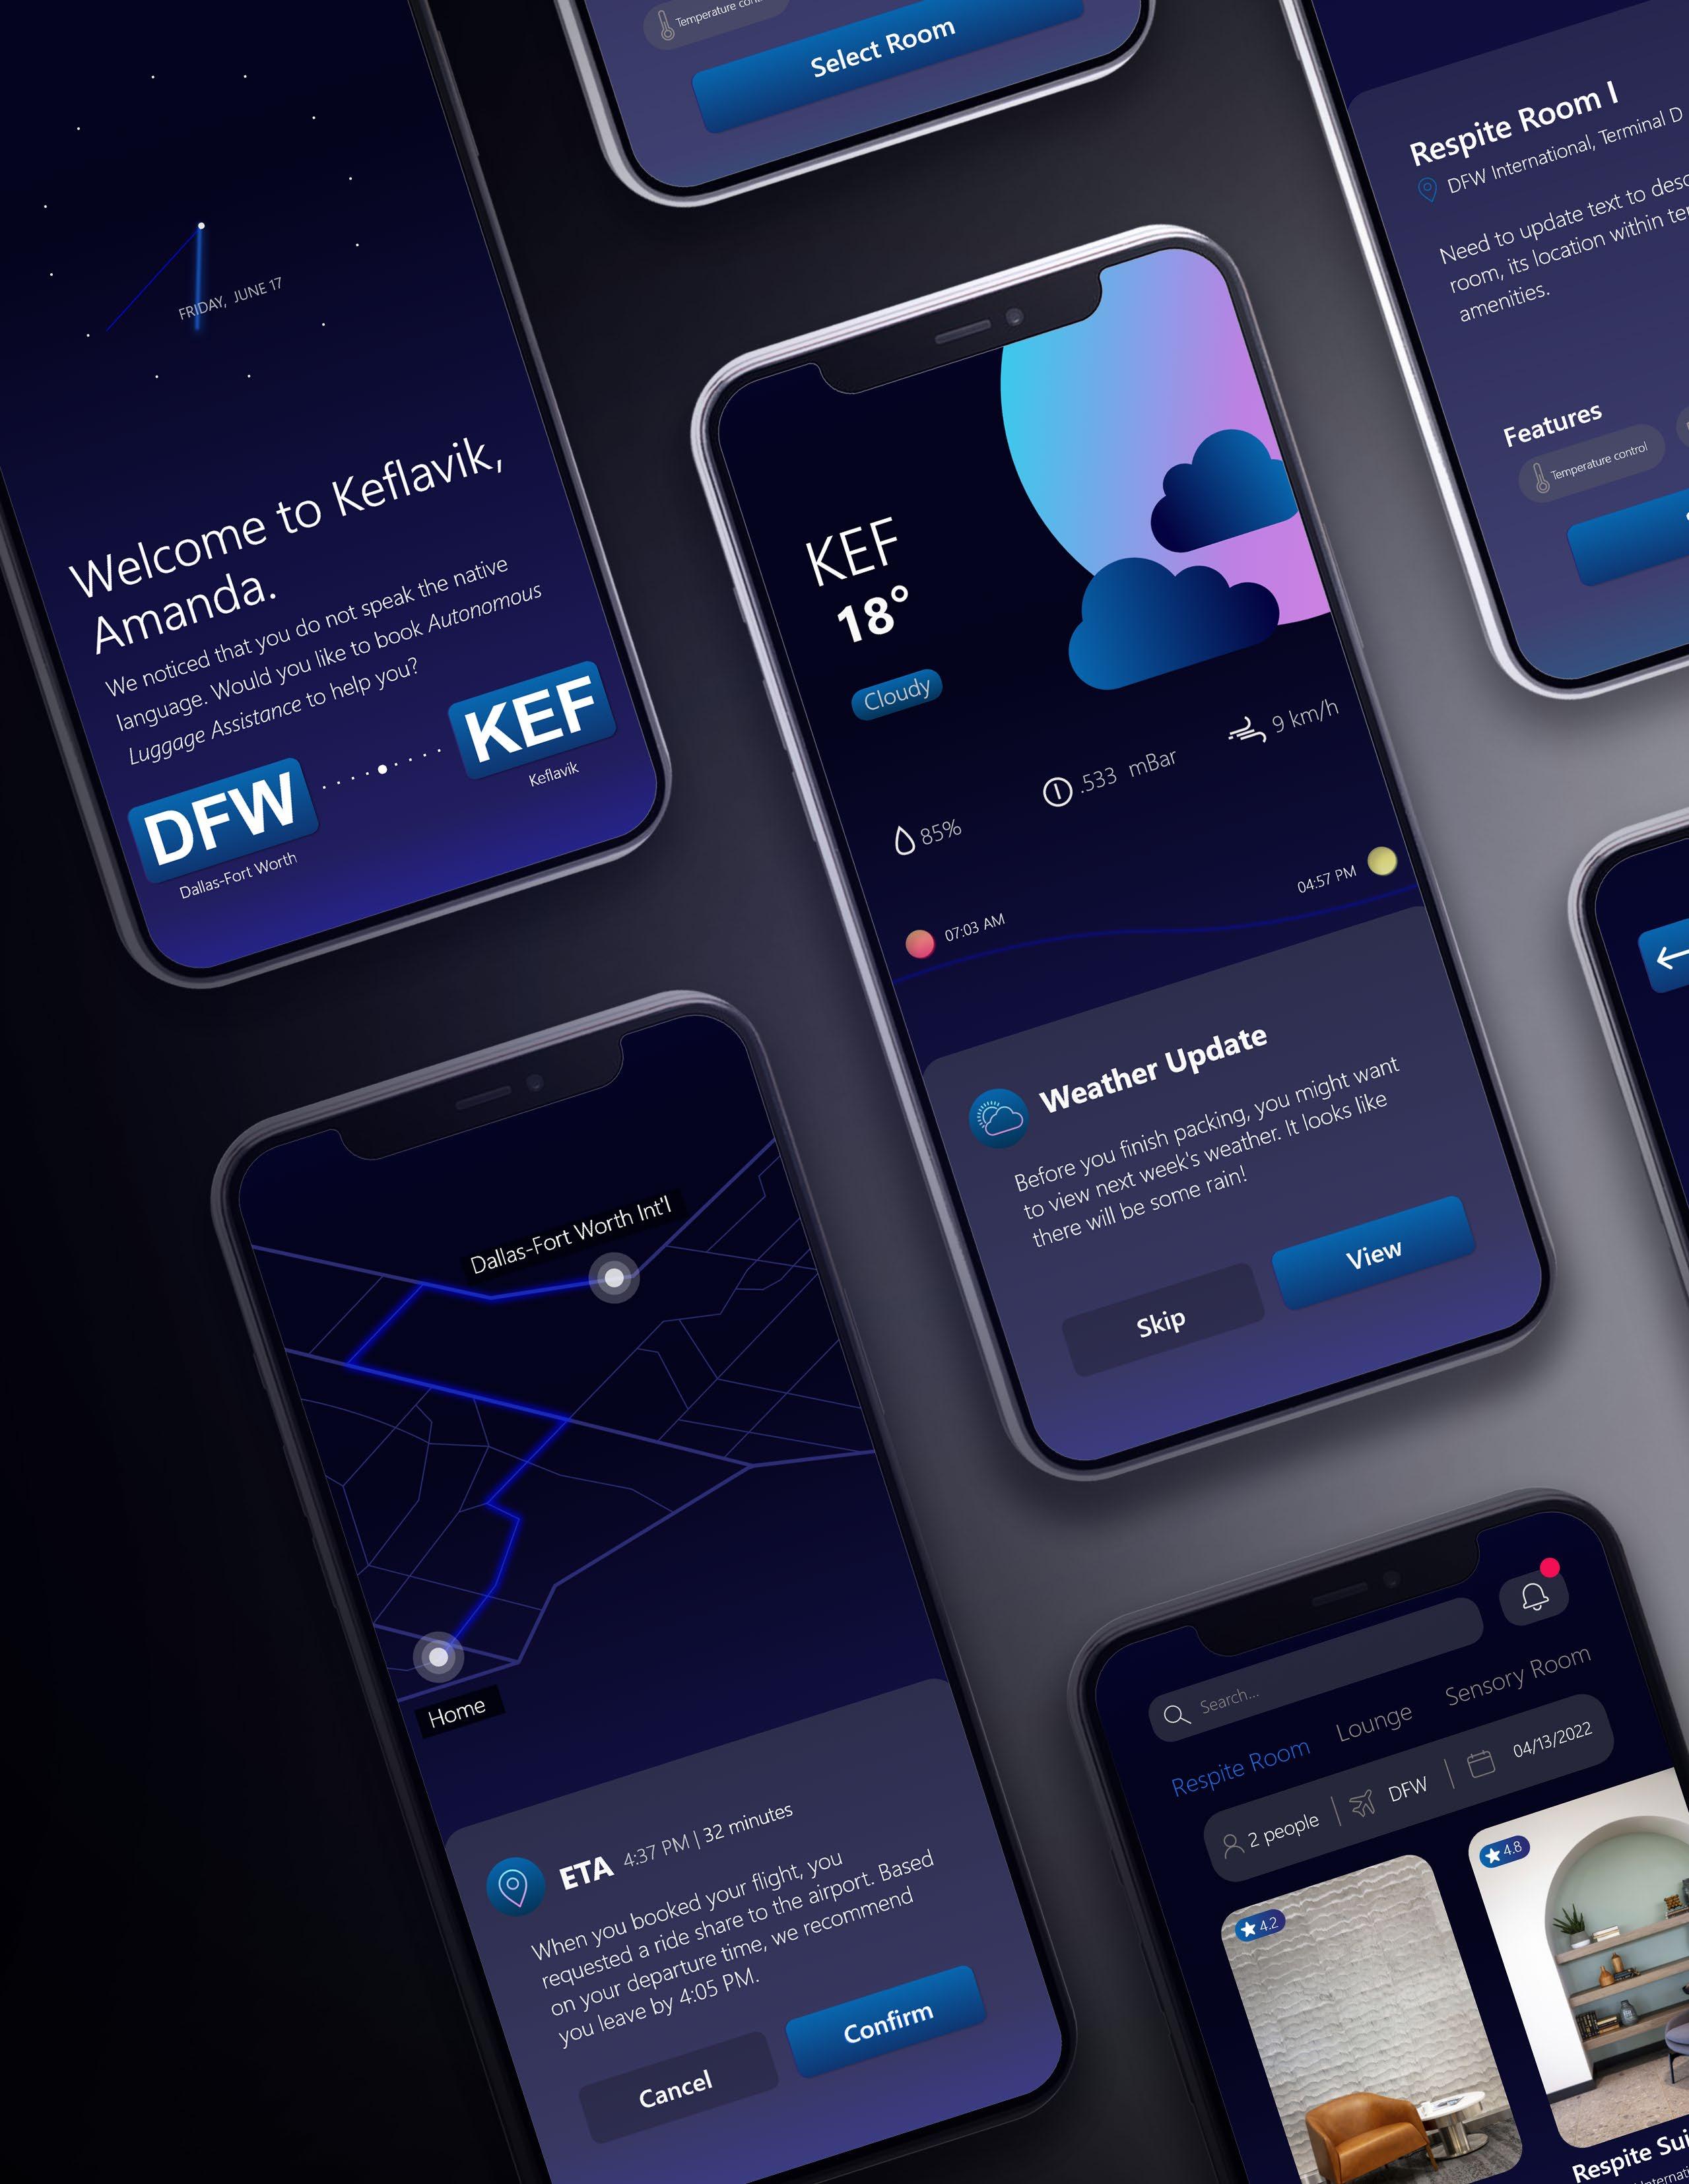
In high-stress environments, “an onslaught of new information can lead to near shutdown of your thinking capacity ― this effect is known as cognitive load.”1 Cognitive Load Theory characterizes our minds as information processing systems that can get overwhelmed when there are options and decisions that need to be made within a designated amount of time. Consolidating decision points and key experiences throughout a trip alleviates the passenger’s mental cognitive load, reducing the amount of personal energy exerted during travel.
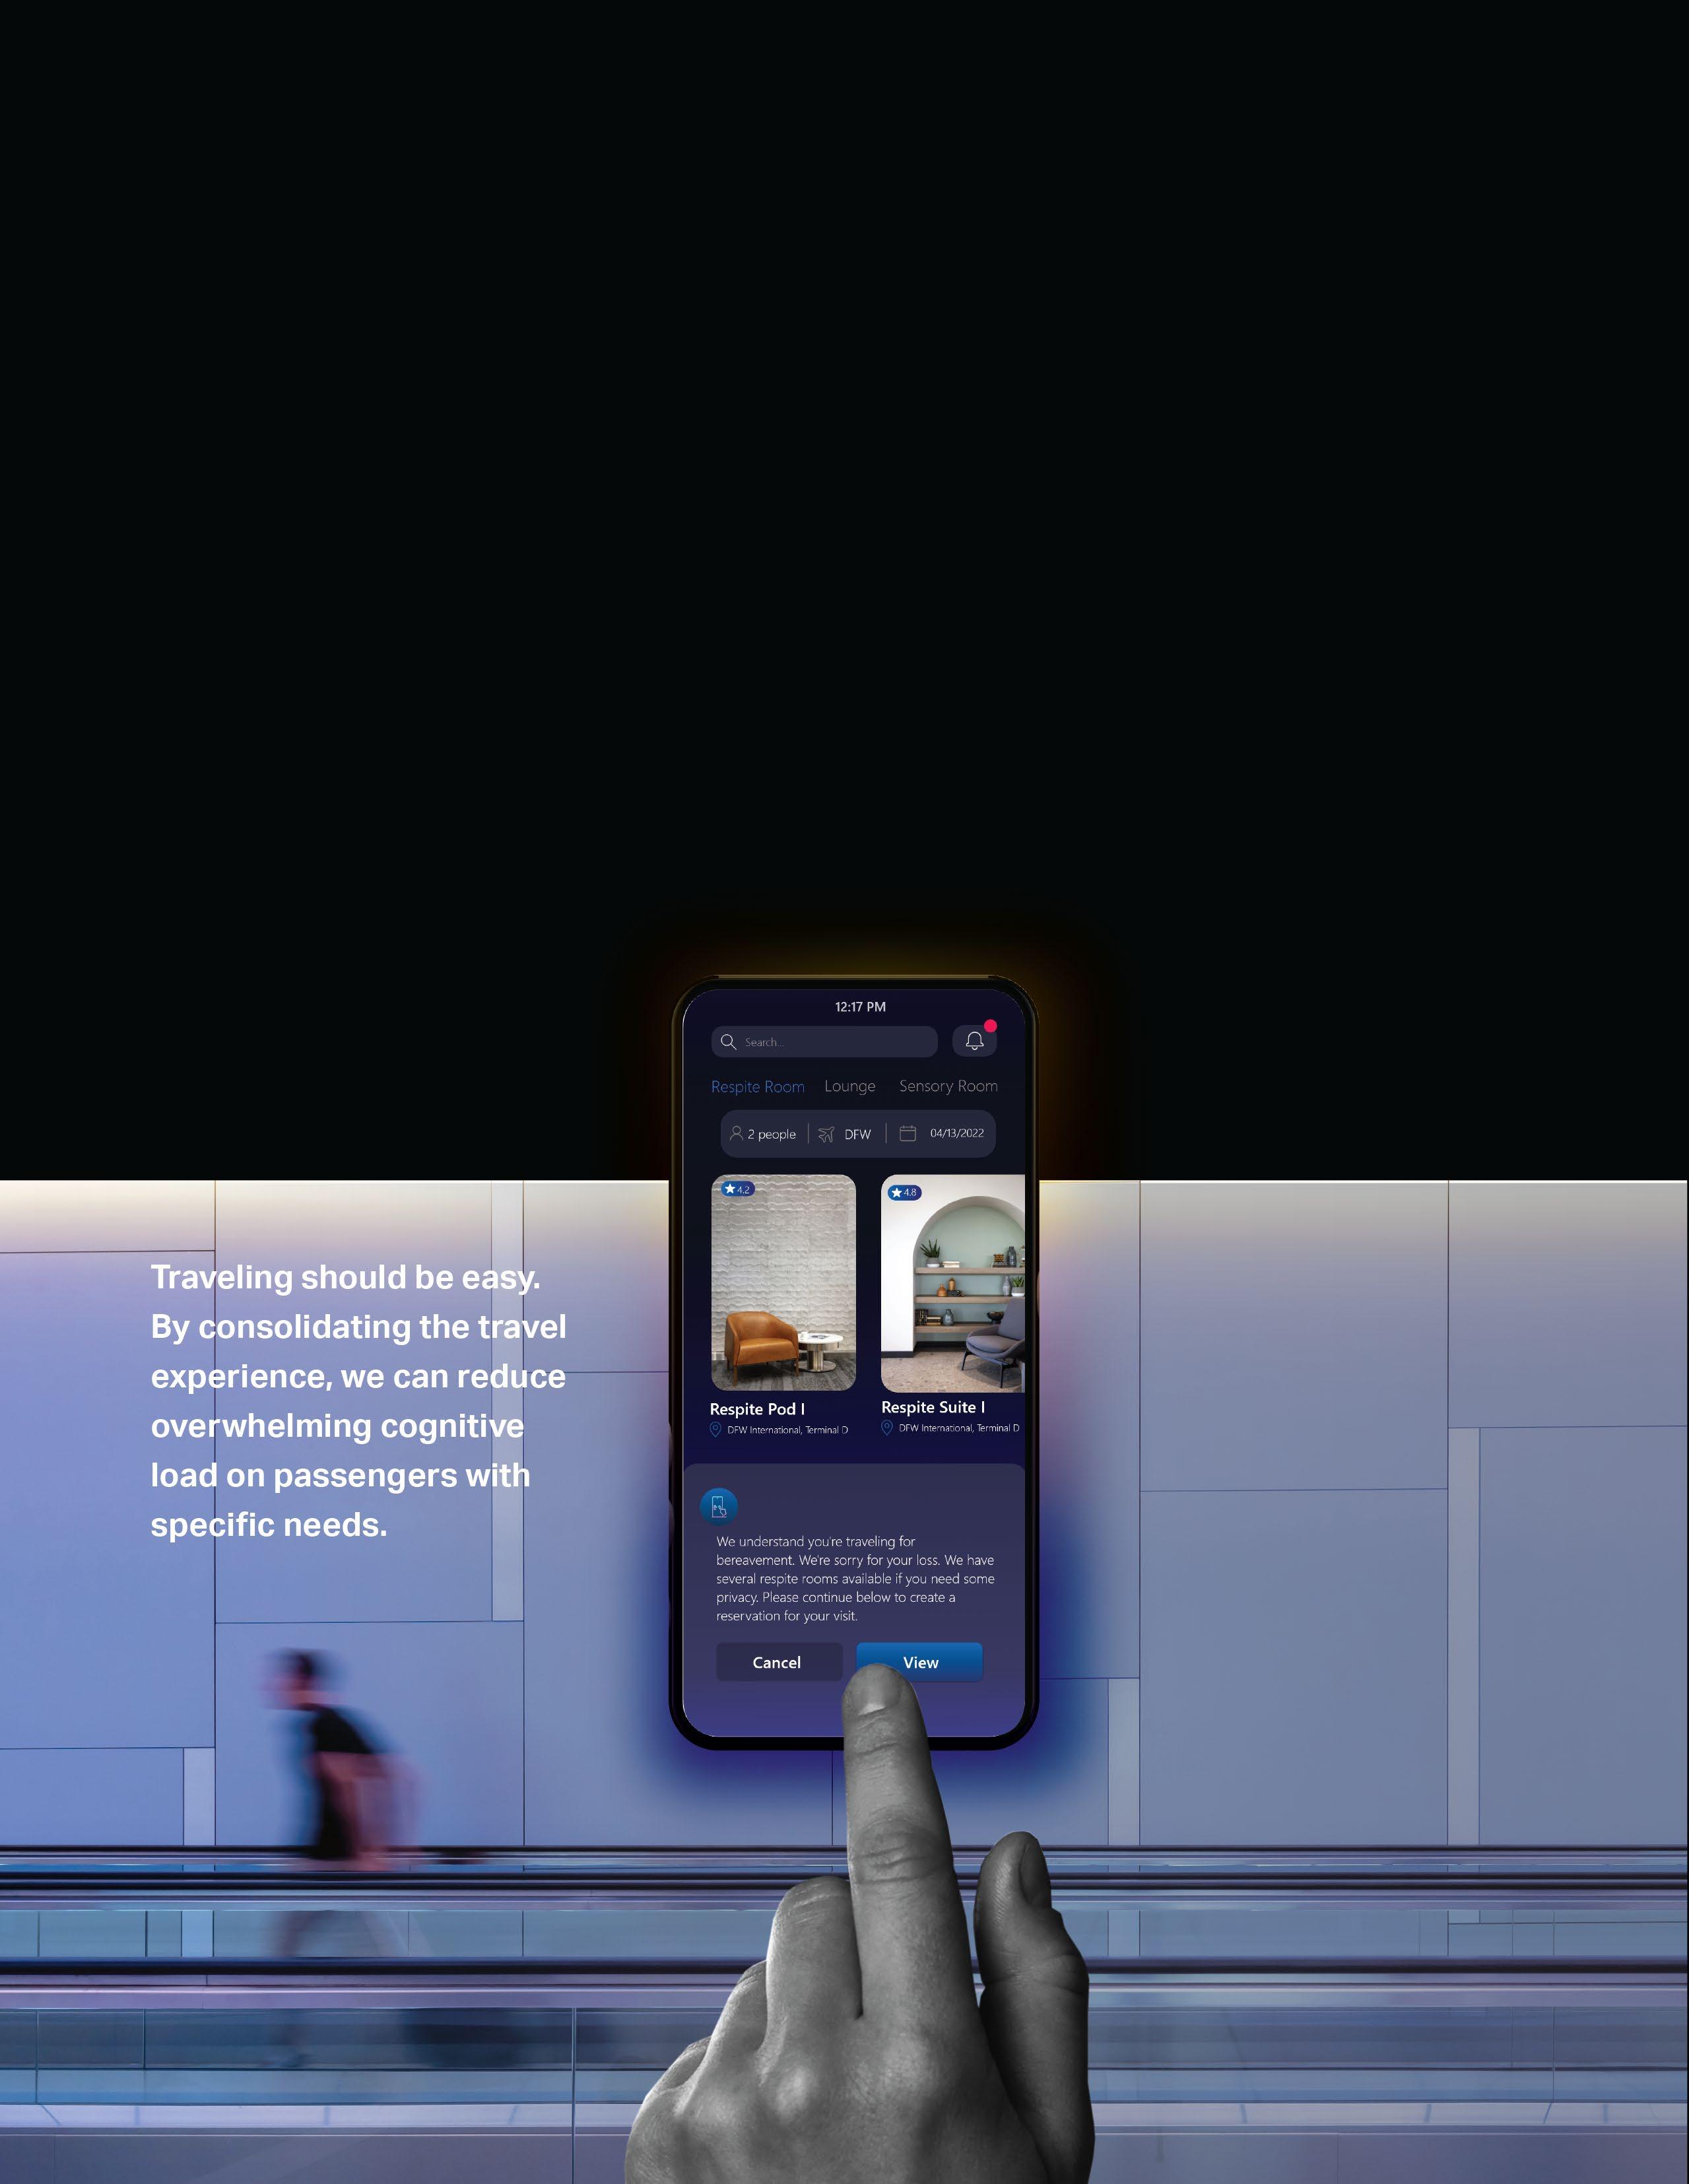
A travel experience that is comprehensively managed from endto-end means that mobility services must consider the passenger’s entire journey — not just the portion they’re responsible for. This means asking questions like, what’s the purpose of their trip in the first place? Are they possibly celebrating a major life event? Will they need to book a ridesharing service to the airport as well as their lodging? Will they speak the native language of their final destination?
In this model, multiple mobility services need to interact with and account for various touchpoints along the journey in order to provide a more human-centered mobility experience. The role of the built environment will then be to facilitate these interactions in a seamless and intuitive manner.
In addition to interactive touchpoints along the journey, it is also important to understand where and when users make decisions. For example, a traveler often selects whether or not to book a rental car before they visit the rental car company’s website or app. By identifying when and where they make these decisions, a touchpoint can be designed that accommodates their needs accordingly.
Other Potential Features
■ Seamless health information (e.g. vaccination status)
■ Shared safety waiver (e.g. to avoid filling out same form)
■ Share real-time travel status with family/friends
■ Pre-made travel checklist for first time travelers (e.g. for an international trip, you should consider purchasing a prepaid phone, international currency, local guide service, etc.)
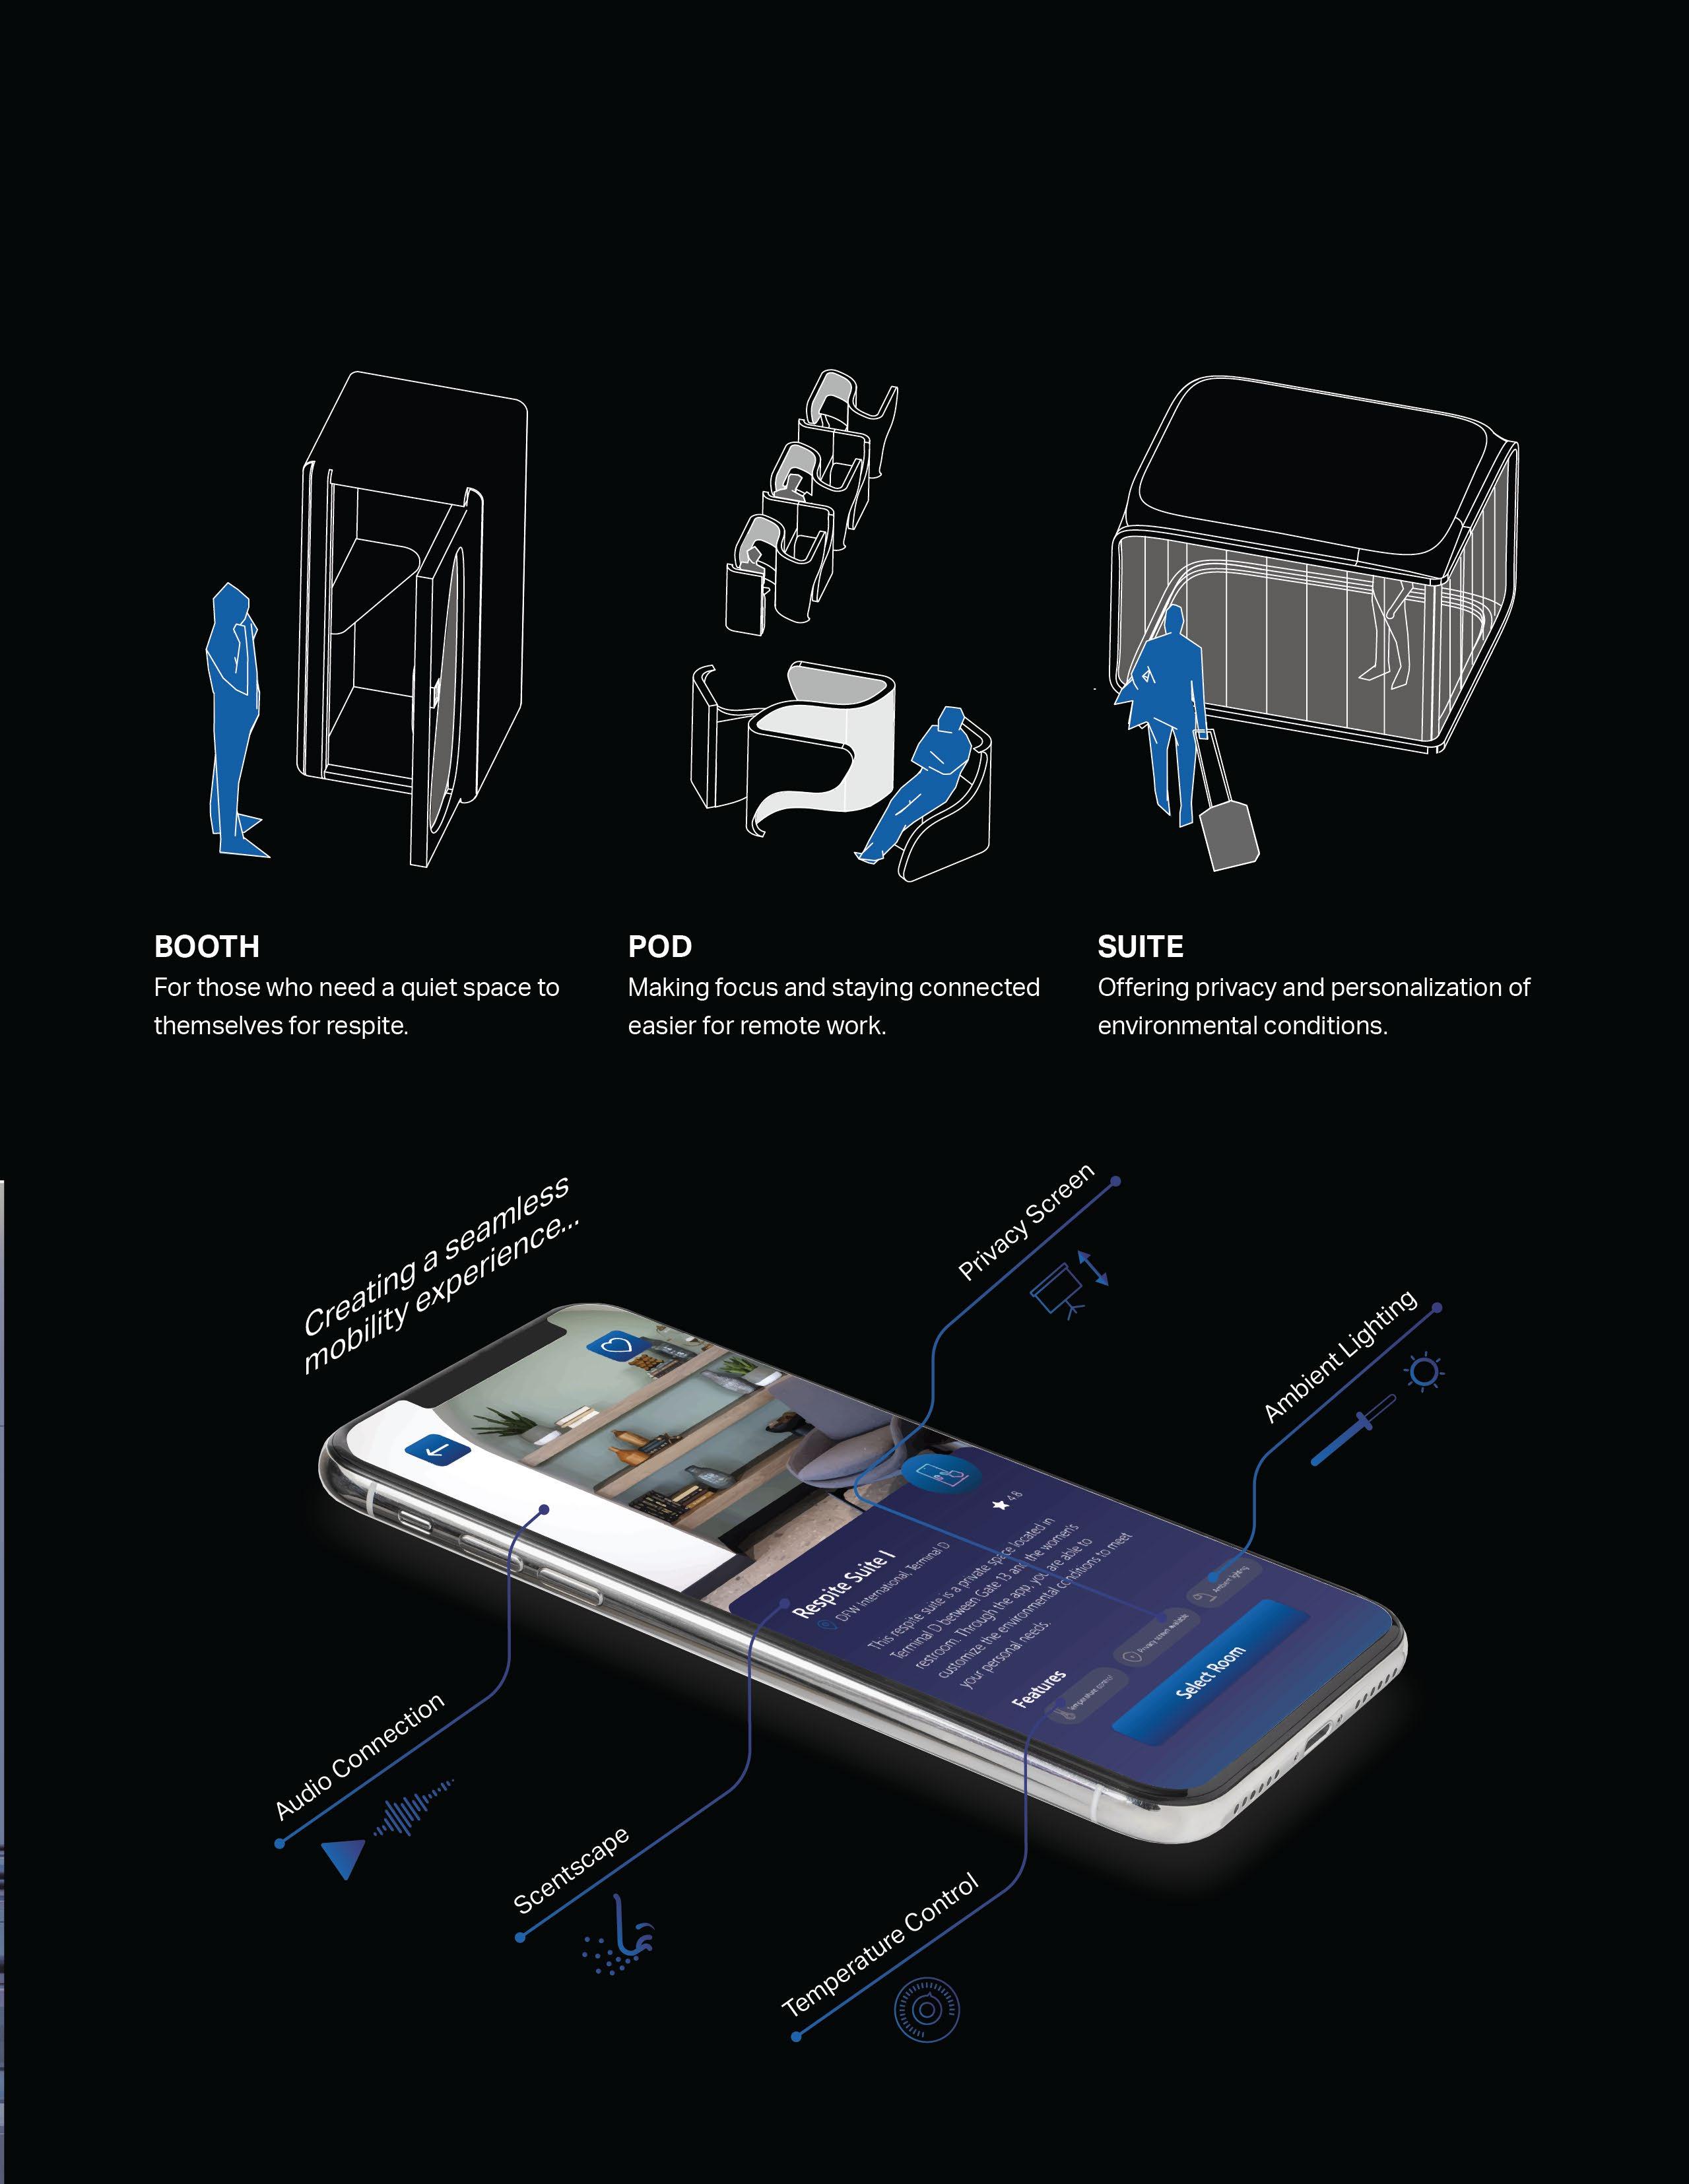
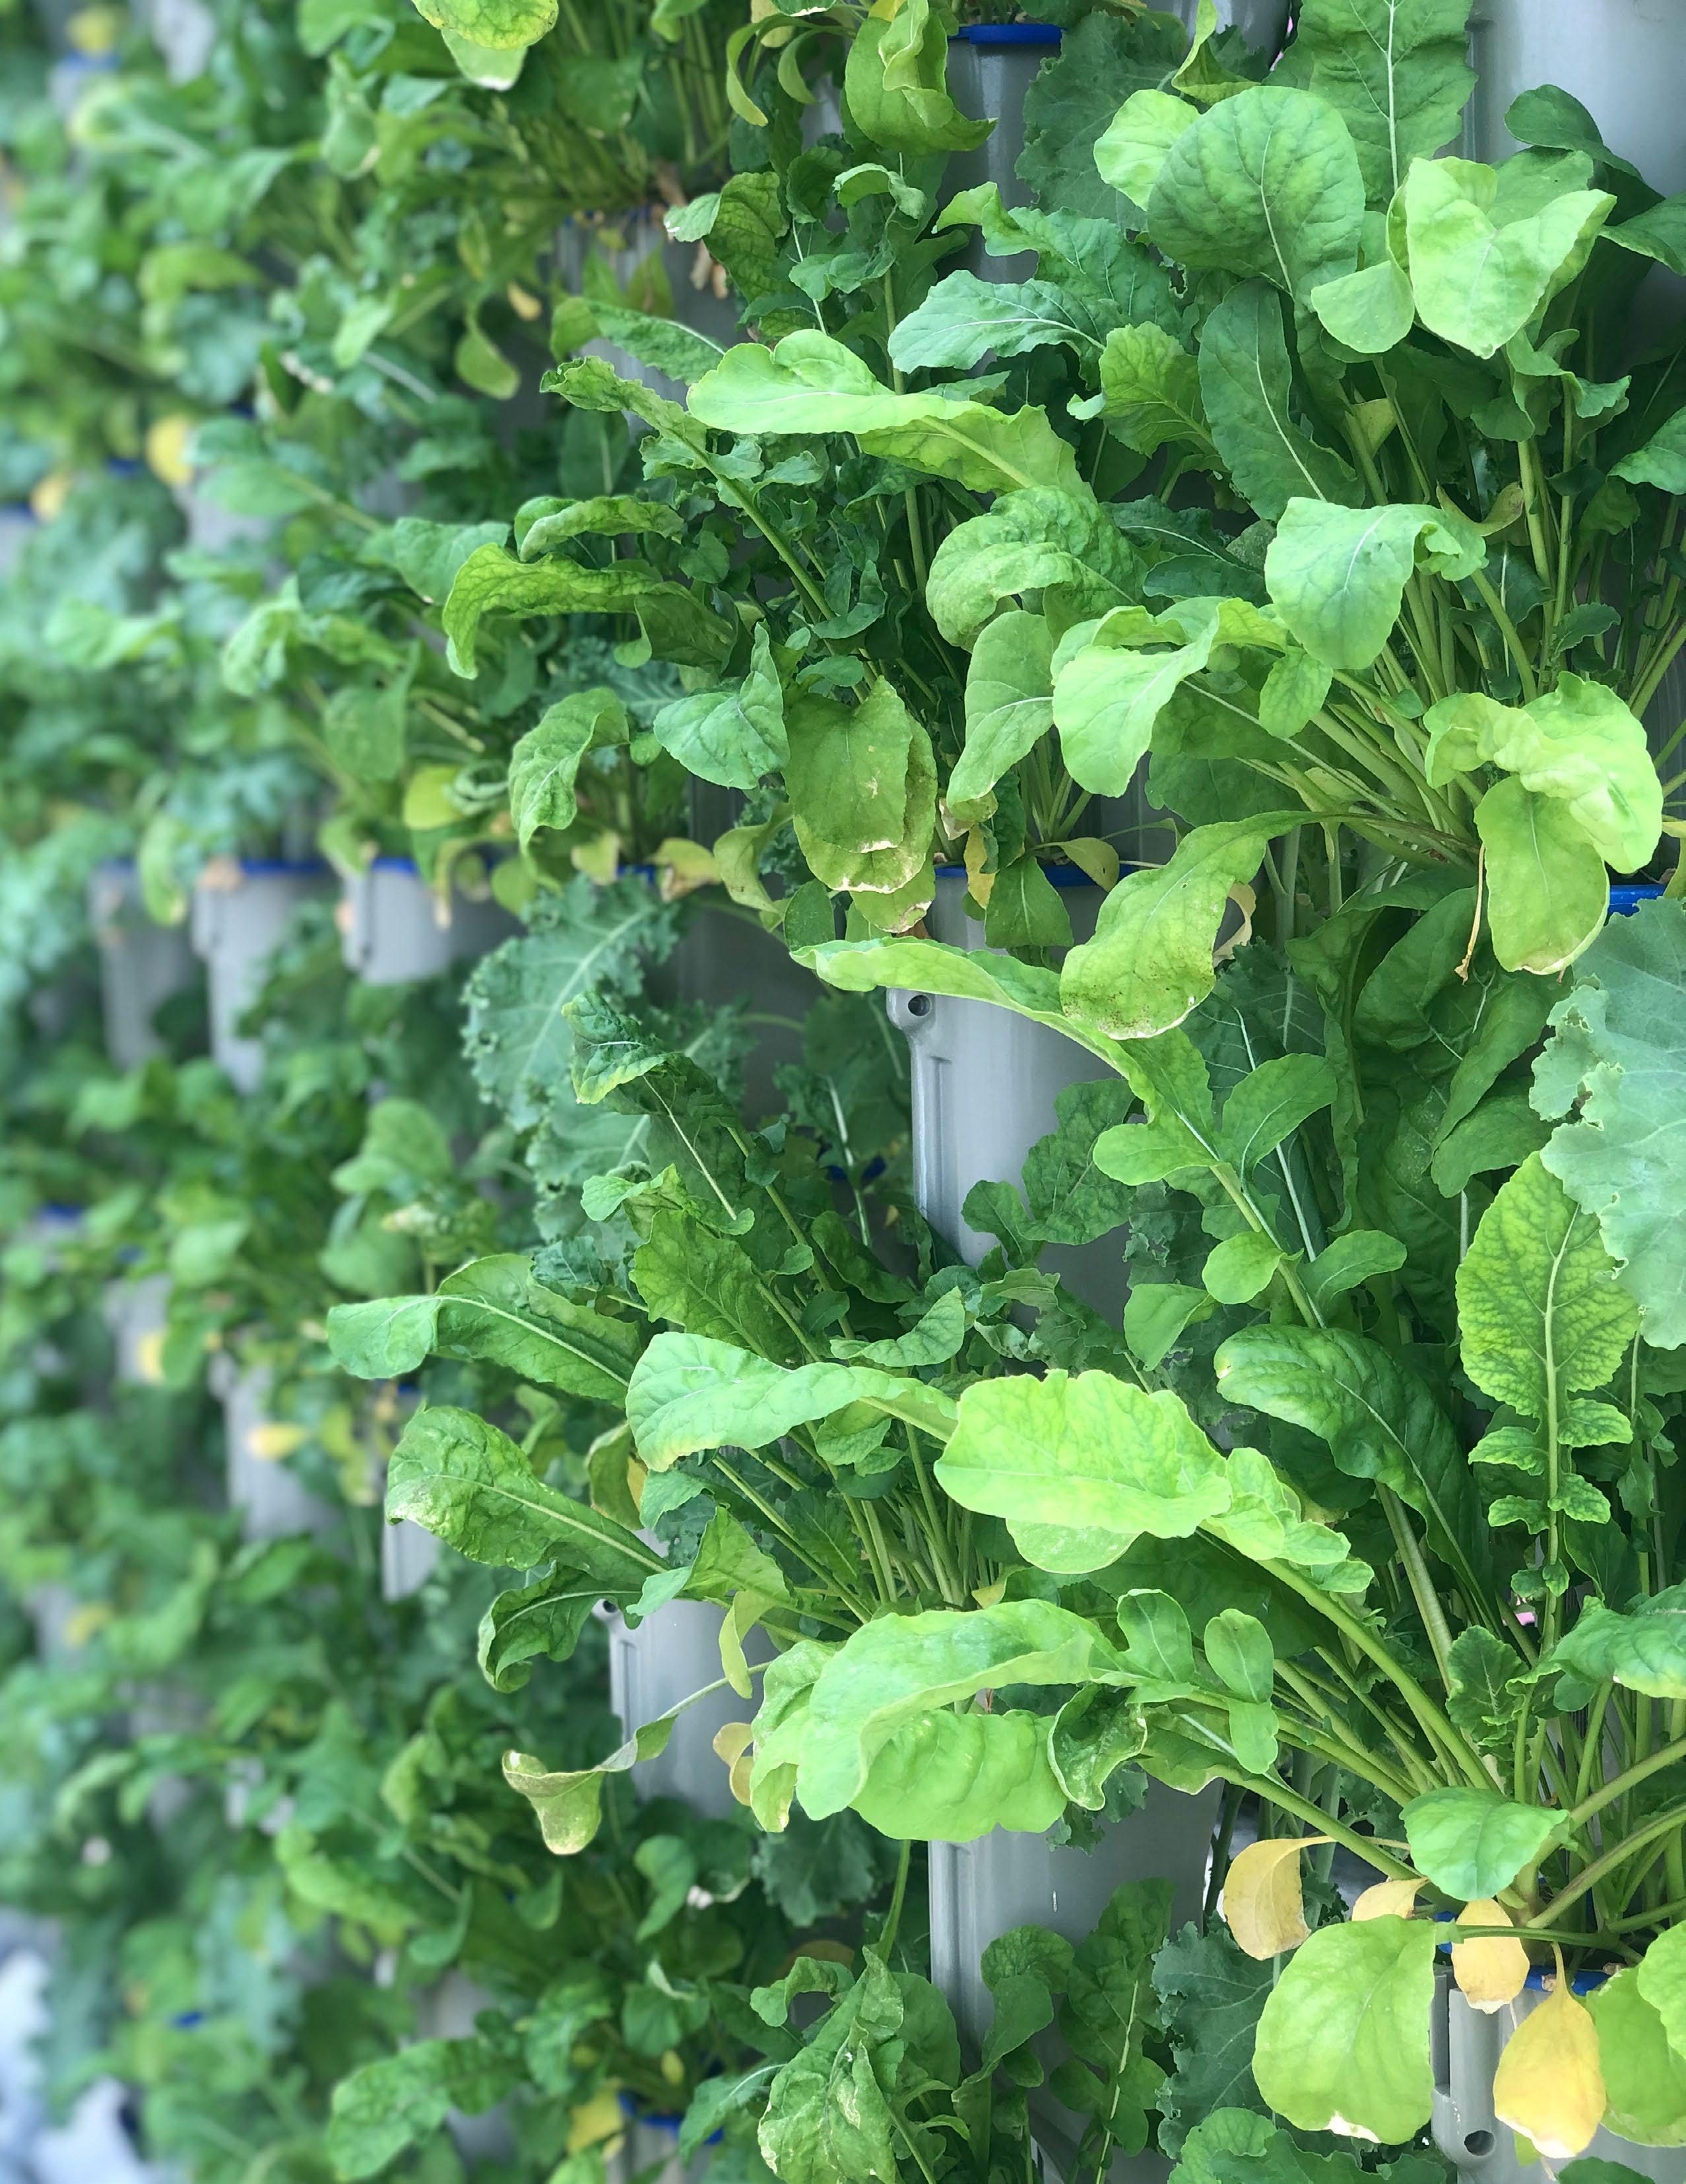
Vertical Farming
A CASE FOR ON-SITE FOOD PRODUCTION
“When we think about threats to the environment, we tend to picture cars and smokestacks, not dinner. But the truth is, our need for food poses one of the biggest dangers to the planet.”
– National Geographic1
Food is not only energy for our bodies — it is our lifeline. However, today’s food system is facing environmental and social challenges that combined are creating an unreliable food distribution system that is detrimental to our natural environment. To simultaneously sustain our population, protect the environment, and help our cities to become healthier, we need to overhaul our current food system, and create a more resilient food supply network.
OUR POPULATION IS GROWING
For starters, our global population is projected to hit 8 billion by the end of 2022.2 For perspective, it took all of human history until 1803 to reach the first billion people.2 Now, it only takes a decade or so to add another one billion people to our planet. Even when considering the recent decline in reproduction rates, people are living longer — thanks to
medical and technological advancements — creating a slow, but positive population growth. Additionally, the spread of prosperity across the world is driving demand in fresh produce — requiring more crops to feed both ourselves and the animals we eat — which is likely to double the crops we need to grow by 2050.1
FARMLAND IS HARD TO COME BY
Feeding billions of people is not the only challenge we face — we are also running out of land. Historically, to make room for more agricultural land, we have cut down forests or plowed grasslands. Globally, we have cleared an area roughly the size of South America to grow crops — and almost the size of Africa to raise livestock.1 This has caused the loss of entire ecosystems, with only 3% of earth’s natural ecosystems remaining intact as they were 500 years ago.3
Barren Land
This includes the world’s deserts, salt flats, exposed rocks, beaches, and dunes
10% of the world is covered by glaciers, while 19% is barren land — deserts, dry salt flats, beaches, sand dunes, and exposed rocks. What is left, we call ‘habitable land.’ Half of all habitable land is used for agriculture. Source: The Breakdown of Global Land Use Today4
The destruction of forests and other ecosystems undermines nature’s ability to regulate greenhouse gases in the atmosphere and protect against extreme weather, which can lead to storm surges, and desertification — both affecting the land we use for crop production.5 Removing biodiversity through deforestation also increases opportunities for animal-to-human disease transmission, and therefore increasing the number of viruses we encounter. Having just experienced the effects of a global pandemic, we may all agree this is unwelcome news.
EXTREME WEATHER EVENTS ARE INCREASING
From record snowfall to massive floods, key agricultural regions around the world are taking a hit.6
Extreme heat waves coupled with intense droughts experienced throughout the U.S. West in 2021 led California water regulators to ban thousands of farmers from using major rivers and streams for irrigation water — directly impacting more than 90% of America’s canned tomato supply and 1/3 of the world supply,6 causing a global surge in tomato pricing.
Meanwhile high heat combined with strong winds, low humidity, and lightening created conditions for devastating wildfires to breakout across the U.S. — burning more than 7.6 million acres in 2021.7 This not only decimates crops, but can also increase insurance rates for farmers — precluding newcomers by making agriculture too risky to insure and forcing others out of the industry completely, which reduces overall supply.6
The U.S. is not alone in experiencing weather extremes. The summer of 2021 brought snowfall to Brazil, damaging its coffee harvest, as well as sugar, orange, and soybean crop yields — each significantly altering world market conditions by driving down output and increasing commodity prices.6
Climate chaos not only effects the grocery store price tag — it breeds food insecurity.
FOOD INSECURITY AND URBAN FOOD DESERTS ARE ON THE RISE
Eric Schick, Co-Founder of CEED and Eden Green Technology CURIOSITY REPORT 2022
Without reliable access to affordable, nutritious food, families experience food insecurity. In 2019, overall food insecurity in the U.S. was in decline, reaching its lowest point since the 1990s — which meant that more than 35 million people overall, including 11 million children, were still food insecure.8
However, that progress was upended in 2020 by the pandemic. According to estimates by Feeding America, 42 million people (1 in 8), including 13 million children (1 in 6), experienced food insecurity in 2021.8 Food insecurity exists in both urban and rural communities and is exacerbated by poor access to supermarkets or large grocery stores, creating geographic areas known as “food deserts.” These areas lack access to transportation, forcing residents to travel inconvenient distances to buy fresh food — on average, this means traveling 1 mile in urban areas and 10 miles in rural areas.9 Food deserts are often areas that have a higher percentage of abandoned buildings, and occur in low-income communities with higher unemployment rates.10 Because of this, opening grocery stores in these areas presents investment risk as income volatility — and therefore purchasing power — is experienced on a month to month basis.
To top it all off, healthy food costs more — diets rich in fresh vegetables, fruits, and fish are on average $1.50 more expensive per day than diets that consist of less-perishable, processed foods.9 So simply making the food available in these locations isn’t enough — it also needs to be affordable.
DISTANCE FROM FOOD PRODUCTION TO CONSUMPTION IS INCREASING
“When considering how many miles food travels, you lose about $4 billion from climate, you lose about 50% of food through logistics. So by the time it’s getting to the distribution center use space, the shortfalls are huge. So we are not disrupting the distribution channel, we are transforming it.”
—
The distance an apple travels to get from the orchard to your pantry is called a “food mile”. Along the distance, this apple can change many hands — from the first-line handlers to manufacturers for stickers or packaging, then through multiple distributors along the travel route. Each time that apple changes hands, it incurs an incremental cost before reaching its final point of sale. Because of this, an apple imported to California from New Zealand is often less expensive than an apple harvested an hour outside of San Francisco,11 which again, increases food mileage.
According to the Center for Urban Education about Sustainable Agriculture (CUESA), the average U.S. meal travels 1,500 miles from farm to plate.11 Unfortunately, longdistance transportation of goods is a standard practice in the food industry and consumes a large amount of fossil fuels along the way.
Transporting food increases CO2 emissions, with road freight generating six times more CO2 emissions than shipping the food by rail,12 and 100 times more CO2 than ships carrying the same amount of freight the same distance.13 However, time critical food, such as fresh produce, cannot be transferred by rail or ship across the U.S. without a significant amount of modifications or preservatives, reducing the quality and condition of the food.
Global Food Losses and Waste Per Year
of all the world’s food is squandered, that is billion tons of wasted food at trillion USD costs
“Fresh” produce must be picked while still unripe and then sprayed en-route with ethaline gas to “ripen” before it arrives at its destination.11 Even with these adjustments, not all produce makes it safely to the retail shelves — 14% of the world’s food is lost between harvest location and retail shelf.14
FOOD WASTE IS GROWING
In the U.S. alone, 30-40% of food produced on our farms is never eaten.15 According to the FDA, wasted food is the single largest category of material placed in landfills.15 And when food is produced but unnecessarily wasted, all the resources used to grow the food — water, energy, and even transportation –are wasted as well.16
According to the EPA16, a year’s worth of food loss and waste in the U.S. represents:
■ Greenhouse gas emissions of more than 42 coal-fired plants
■ Enough water to supply more than 50 million homes
■ The amount of fertilizer used in the U.S. to grow all plantbased foods for U.S. human consumption
■ An area of agricultural land equal to both California and New York combined
of all fruits and vegetables of all fish and seafood of all cereals of all dairy products of all meat and poultry
People like to see demonstrated visual cues that a restaurant has sustainable practices:
% who would feel influenced to choose establishments that do the below
Ensure food packaging is biodegradable or recyclable
Use biodegradable paper straws instead of plastic
Make an effort to offer
or zero emission take out or deliveries
49%
Restaurant Trends in 2022. Source: Oracle, 2021.18
The carbon footprint of food waste is greater than that of the airline industry.17
In 2020 however, labor shortages were experienced throughout the supply chain — from front-line handlers to processors and even retailers. Additionally, as on-demand delivery increased, the trucking industry experienced a sharp decline in employment — exacerbating an ongoing 15-year labor shortage. Because of this, significant on-farm losses were recorded throughout 2020, and in some cases, farmers found it more financially viable to let fruit and vegetables rot on the farm than to pay overtime to a reduced harvesting staff and increased shipping fees for transport.
CONSUMER AWARENESS IS SKYROCKETING
Consumer awareness around fresh, locally grown food and its environmental impact has been on the rise for decades, with 93% of consumers making significant efforts to reduce food waste18 and 71% of consumers even more concerned about the environment than pre-pandemic.18 However, the recent rise and continued endurance of takeout brought on by the 2020 pandemic has increased awareness around delivery’s environmental impact — making consumers particularly attracted to restaurants that use support lowemission deliveries.18
This has led to a 56% increase in carbon emission labeling on food products, with some claiming that food miles are
People are also influenced by a restaurants’ broader sustainability commitments % who say these actions are important
Companies to make efforts to lower food waste
Clear labeling about the source of food and ingredients
Transparency about a company’s social responsibility commitments Companies encourage customers to bring their own cups for drink refills
%
the new calories.17 The growing concern over the climate crisis has fueled demand for plant-based products across all demographics, with mainstream consumers changing their diets to reduce their personal impact on the planet. As a result of COVID-19, more than 50% of consumers worldwide have already or are increasingly including more plant-based foods in their diets.19
SMART AGRICULTURE IS ON THE RISE
“Agriculture is among the greatest contributors to global warming, emitting more greenhouse gases than all our cars, trucks, trains, and airplanes combined — from methane released by cattle and rice farms to nitrous oxide from fertilized fields. In fact, runoff from fertilizers disrupts lakes, rivers, and coastal ecosystems across the globe.”
— National Geographic1
Farming is the largest user of our natural water supplies, accounting for 70% of all freshwater withdrawals globally.20 AI water conservation practices, however, are looking to change that by assessing the water balance, planning, and optimizing irrigation scheduling. Applying AI to traditional farming methods — like including using sensors to measure soil water — helps farmers evaluate how much water should be supplied via irrigation. Using this real-time soil analysis
combined with plant physiology and weather forecasts in a predictive model can save 40% of water consumed by traditional methods.21
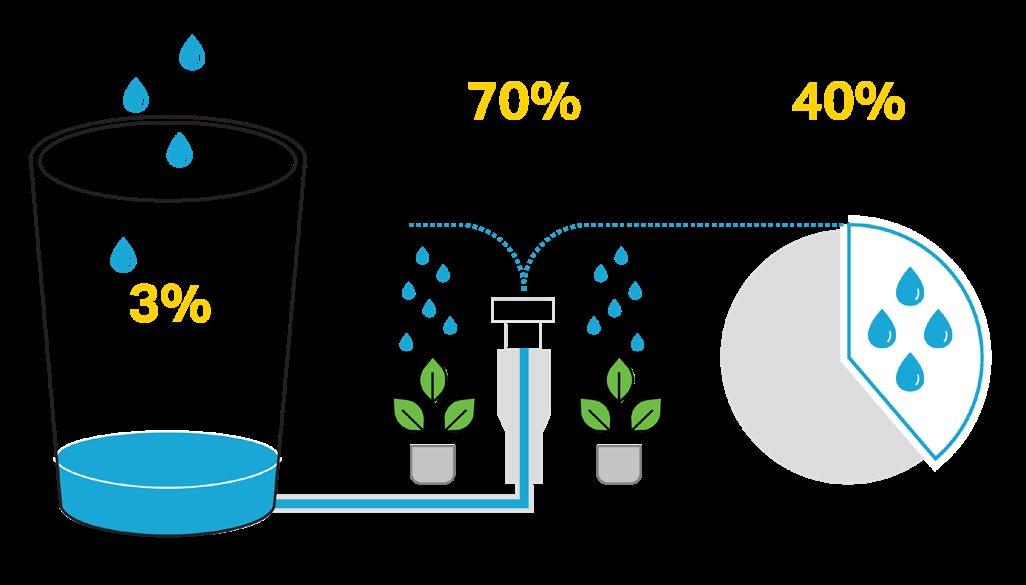
Farms have also been increasingly entering the renewable energy market in an effort to reduce exposure to economic uncertainty.
The energy to cultivate crops is a significant proportion of farmers’ production costs. When fuel prices are volatile and unpredictable, it can cut into the overall income of the farm, posing risks to the economic welfare of rural communities.22 Therefore, American farms have increasingly adopted renewable energies in the past decade, with many relying on renewable energy generation as an important part of total farm income.22
Crop and Energy Prices 1997 to 2020
Oil prices exhibit a high degree of correlation with crop prices (r = 0.78). This suggests that reducing volatility in energy prices — or, at the very least, smoothing them out — could help farmers stabilize their finances and reduce their exposure to economic uncertainty. Source: Kleinman Center for Energy Policy 22

Spot Crude Oil (rhs)
Producer Price Index (lhs)
Source: Cornell University34
THE REALITY
Our current food system is restricted by the location of farmland, and it relies on a relatively small number of conglomerates.
THE PROBLEM
Compounding factors such as growing population, limited farmland, and extreme weather are challenging us to find more sustainable ways of producing food in the 21st century.
THE SOLUTION
A distributed food system that encourages on-site food production within urban dense areas.
Finding Food Resiliency in Vertical Farming
“We need transformational change operating on processes and behaviors at all levels: individual, communities, business, institutions, and governments. We must redefine our way of life and consumption.”6
From providing quality food for a growing population to navigating the effects of climate change, ensuring a sustainable supply chain from farm to table that is safe, sustainable, and responsible is key to reaching food system resiliency.
Indoor crops previously supplied the market with year-round fresh produce, but in 2020 they became a crucial element of the global effort to ensure food security. Food disruptions spurred by the pandemic increased the investment into resilient supply chain opportunities, with investments up to $1.9 billion in indoor farming alone — tripling 2019 investment.23
Controlled Environment Agriculture (CEA), or indoor farming, has many benefits for crop production, as it relies on a highly controlled indoor environment to grow plants, rather than exposing the crops to outdoor climates. Vertical farming is exactly what it sounds like: strategically stacking layers of produce — using hydroponics, aeroponics, or aquaponics — which in some cases enables farmers to produce 350 times more food per square yard than traditional farming.24
“In an acre, we produce a million pounds of food per year. That’s the same as about 11-13 harvests per year.”
– Eric Schick, Co- Founder of CEED and Eden Green Technology
Beyond increasing food production, the stacked nature of vertical farming can provide fresh, local produce close to growing
On-site food production shortens the supply chain and decreases opportunities for disruption, creating better food safety, surety of supply and no food waste.
urban populations in an environmentally responsible and sustainable way by offering lower emissions, providing higher-nutrient produce, and drastically reducing water usage and runoff.25
Today, we are met with many challenges that have encouraged us to move towards a more resilient supply chain. Vertical farming can help us achieve that goal by:
■ Reducing Food Miles — Locating vertical farms closer to the end consumer unlocks shorter supply chains, delivery times, and reduces the overall CO2 per unit delivered. This will help us bring quality food to those who need it most.
■ Reducing Food Waste — In traditional farming, produce is lost all along the supply chain — in fields, warehouses, packaging, distribution, supermarkets, restaurants, and refrigerators. By eliminating several steps in the supply chain, vertical farming food waste is reduced to near zero.26
■ Decreasing Water Usage — By recycling the water used in the system, this process uses less water than traditional growing methods, decreasing total water usage per unit output.26
■ Increasing Food Safety — Growing, handling, preparing, packaging, and storing food all pose risks for foodborne diseases. Highly controlled indoor farming environments reduce risks by eliminating pathogens, pesticides, soil, fertilizers, and other elements from the growing process.
■ Increasing Dependability — By using a highly controlled indoor environment that can be operated 24/7, the food supply chain becomes less exposed to volatile weather patterns.
■ Increasing Opportunities for On-site Sustainability — Vertical farms are tailor made for sustainable energy production and consumption via on-site solar or wind generation.
■ Rehabilitating Existing Buildings — Vertical farms can be integrated into buildings such as skyscrapers, housed in warehouses or shipping containers, greenhouses or placed in spaces that would otherwise be unfit for farming.26 PROCESSOR DISTRIBUTOR
NO SOIL, NO SEASON, NO PROBLEM
One of the main benefits of vertical farming is eliminating soil — and therefore pesticides, fertilizer, pathogens, and bugs — from the plant growth process. This can be achieved in a few ways.
■ Aeroponics — Plants are suspended in a support structure, and the roots are periodically sprayed with a nutrient-rich water solution.
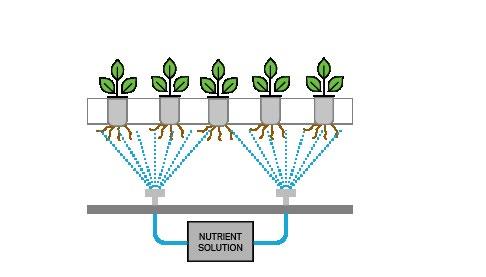
■ Hydroponics — Plants absorb nutrients through a water-based nutrient solution. The water used in the system can be minimized by being recycled and reused.
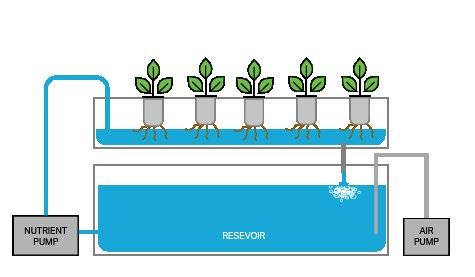
■ Aquaponics — Growing both plants and fish, the roots of the plants are provided nutrients from the waste created by the fish.
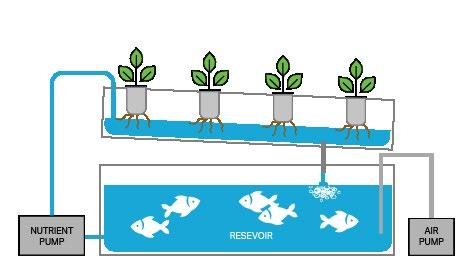
Farming without soil is not new — check out this 1977 New York Times article on hydroponic farming!
VERTICAL FARMS COME IN ALL SHAPES, SIZES, OPERATIONS, AND LOCATIONS
To succeed, vertical farming requires a delicate balance of controlled temperature, light, and humidity. And as you can imagine, there are various ways to achieve this balance. Vertical farming can not only differ in the various soilless growing methodologies but can also range from personal patio gardens to warehouses and greenhouses that produce food for entire communities.
Container Farming is a hydroponic farm operated from within a shipping container, requiring only flat, stable ground and access to power and water. Companies like Freight Farms are pioneering this quick installation method, enabling would-be farmers to start small — with one container typically producing the equivalent of 2 acres worth of produce27 — and scale up as their business model changes.
In October of 2021, the U.S. Department of Agriculture (USDA) Agricultural Research Service (ARS) launched an intensive study of Controlled Environment Agriculture (CEA) to establish data and science-based metrics and crop production standards for CEA growers, similar to those established with traditional agriculture. They have selected AmplifiedAg, Inc.™ — a company that manufactures modular and scalable vertical farms using refurbished shipping containers and advanced hydroponic systems — as its first vertical farming platform. AmplifiedAg’s flagship brand Vertical Roots is the largest hydroponic container farm in the world and currently sells its produce through more than 1,800 grocery stores and numerous distributors.28
Indoor Farming facilities produce commercial quantities of food year-round — great for feeding large communities. They are typically characterized by long rows of plants in stacked hydroponic or aeroponic trays, which rely on tens of thousands of LED lights to initiate plant photosynthesis. Because of the energy needed for lighting, climate control, water circulation, and other operations, indoor farms can consume massive amounts of energy.
Companies like Bowery Farms, Vertical Roots, Brightfarms, and many others have been leading the charge in bringing vertically farmed produce to the consumer. In fact, San Francisco company Plenty now offers its products at 17 Safeways in Northern California29 and with two decadesworth of experience, Aerofarms in Newark, NJ — the largest indoor farm in the world at 69,000 square-feet (3.5 acres) — produces food that caters both Singapore Airlines and Emirates Airlines international flights.
Corgan + HP Engineering Aquaponics HVAC System
PATENT PENDING
Corgan is collaborating with HP Engineering to explore how the systems required for hydroponics and aquaponics can function as a building system for heating and cooling, optimizing indoor air quality and provide biophilic opportunities. This Aquaponics HVAC system can be scaled to suit different building typologies such as commercial real estate, education facilities, and large healthcare and aviation campuses.
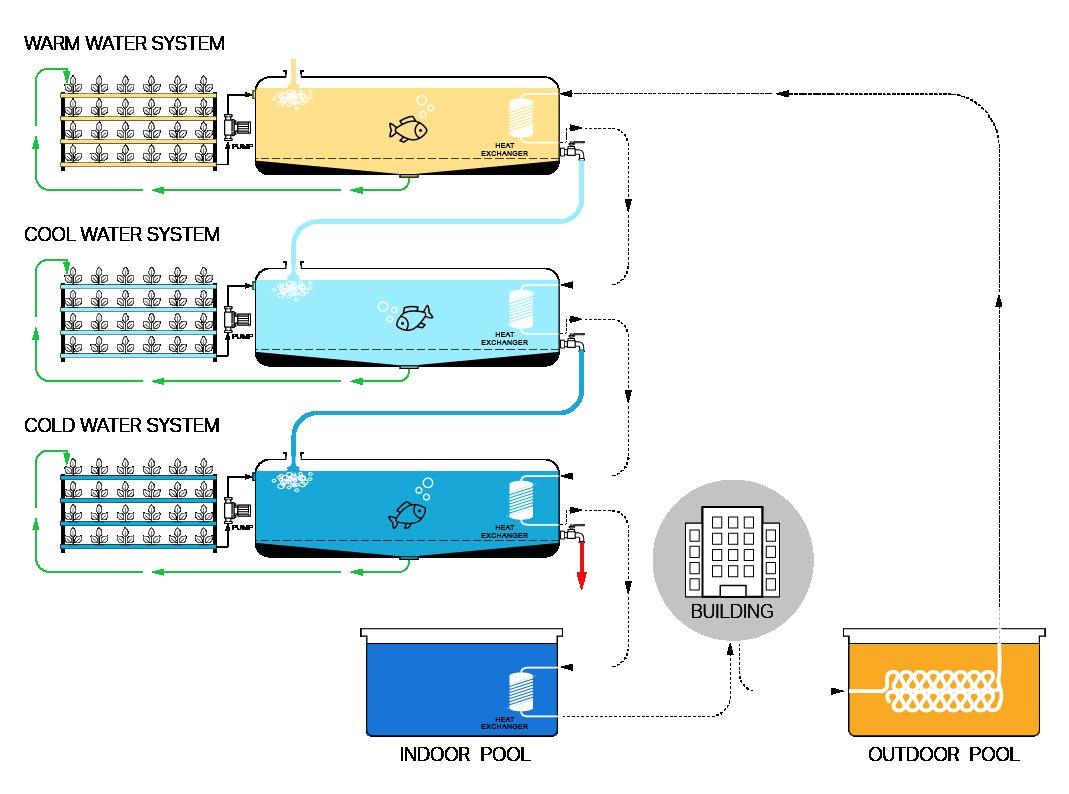
Kalera began operations outside Atlanta Georgia in April 2021, will not only have the largest-yield vertical farm in the Southeast, but will also be Georgia’s largest lettuce producer — producing 12 times as much lettuce in one year as the entire state can produce in the same amount of time. Prior to Kalera, the state would import more than 99% of its lettuce.30
Greenhouse Vertical Farming shares some similarities with indoor farming, such as scale, verticality, and quantities of produce. However, greenhouse vertical farming uses natural sunlight to grow most of their plants and only uses artificial light for seed propagation. This plays a major role in driving down operational costs — and therefore consumer product prices. To take full advantage of the sun, the plants cannot be stacked in trays, and instead rely on vertical towers that enable daylight to hit each plant. No one has perfected this design more than Eden Green Technology in Cleburne, Texas.
By combining vertical farming with hydroponic farming, Eden Green Technology’s patented vertical vine operates as a closed loop system — sending nutrient rich water to each of the individual plants on the vine, then capturing, cooling,
filtering, and recirculating the same water, with zero water waste. This means that for every Eden Green Technology facility, 18.3 million gallons of water is saved, compared to traditional agriculture. Additionally, they use strategic microclimate technology to monitor and manage the nutrient-rich water as well as the humidity, air temperature, oxygen, and CO2 levels of each individual plant tower. This very tactical approach enables them to grow more than 50 varietals with 36 plants per 18-foot-tall towers — all while using 98% less water, 99% less land, 90% less light energy, and creating zero food waste.
In 2021 the East Coast brand, Gotham Greens, installed a rooftop hydroponic farm at a Whole Foods in Brooklyn, New York. According to the press release, this is the first commercial greenhouse farm integrated into a grocery store. 29
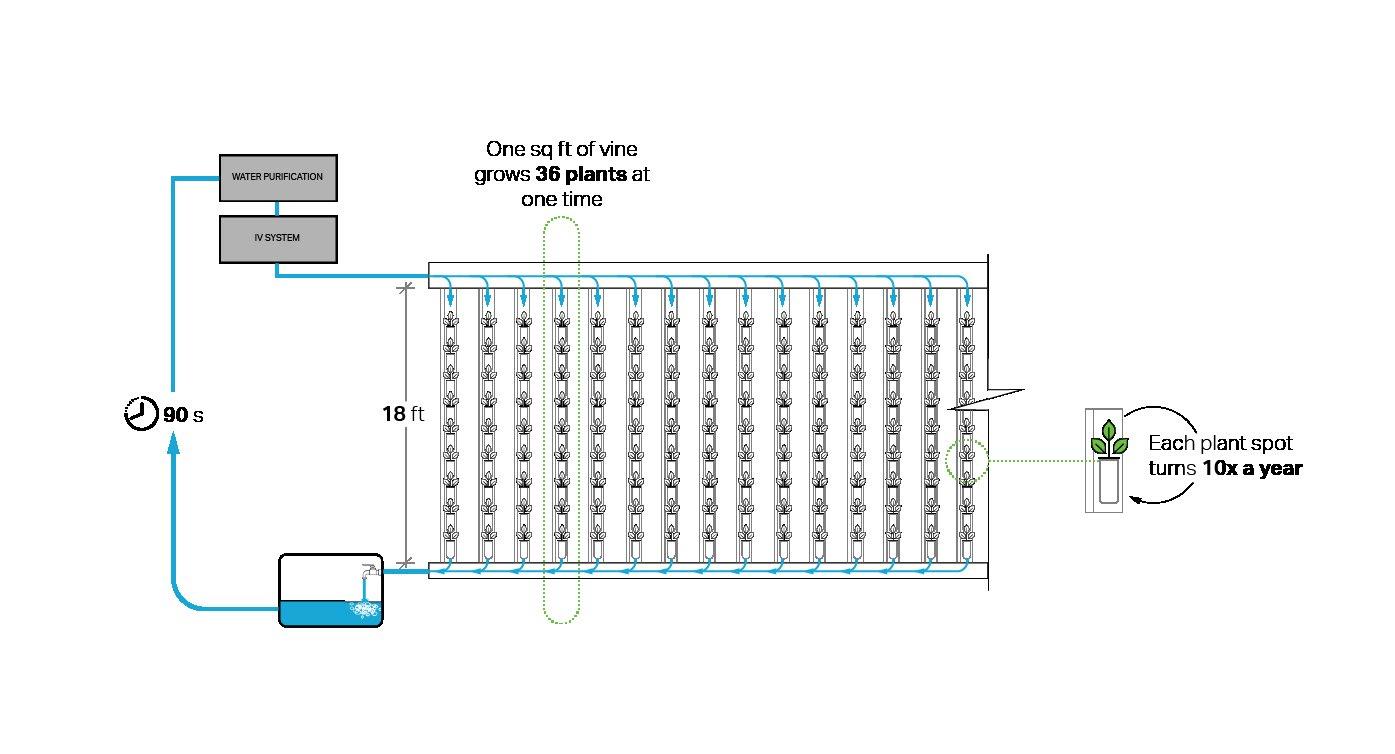

“Harvest spinach during a drought or grow arugula in a snowstorm”– which they did! During the 2021 snowstorm in Texas, Eden Green was able to remain operational for 8 days, growing food without disruption.
Vertical Farms: Coming to a City Near You
“We used to have to go to the farm. Now the farm is coming to you” — Eric Schick, Co-Founder of CEED and Eden Green Technology
To meet high production yields, vertical farms currently reside in warehouses on the edge of cities near distribution centers. If vertical farms are meant to support communities with supplemental food programs, work to eliminate food deserts, and provide opportunities for employment, they need to be located closer to where consumers buy goods. In the urban core where land to build is scarce, it’s highly possible to meet the same production demands by creating a distributed mesh network instead of one large production facility.
CREATING A NETWORK OF VERTICAL FARMS THAT WORK TOGETHER
By understanding the production needs of the community or city, the vertical farm component can be evaluated and designed to accommodate the needs of any site or building typology. For example, a vertical farm on a hospital campus may be more likely to conduct medicinal research with plants in addition to growing crops for its cafeterias and food supply. This would require a much higher rate of lighting
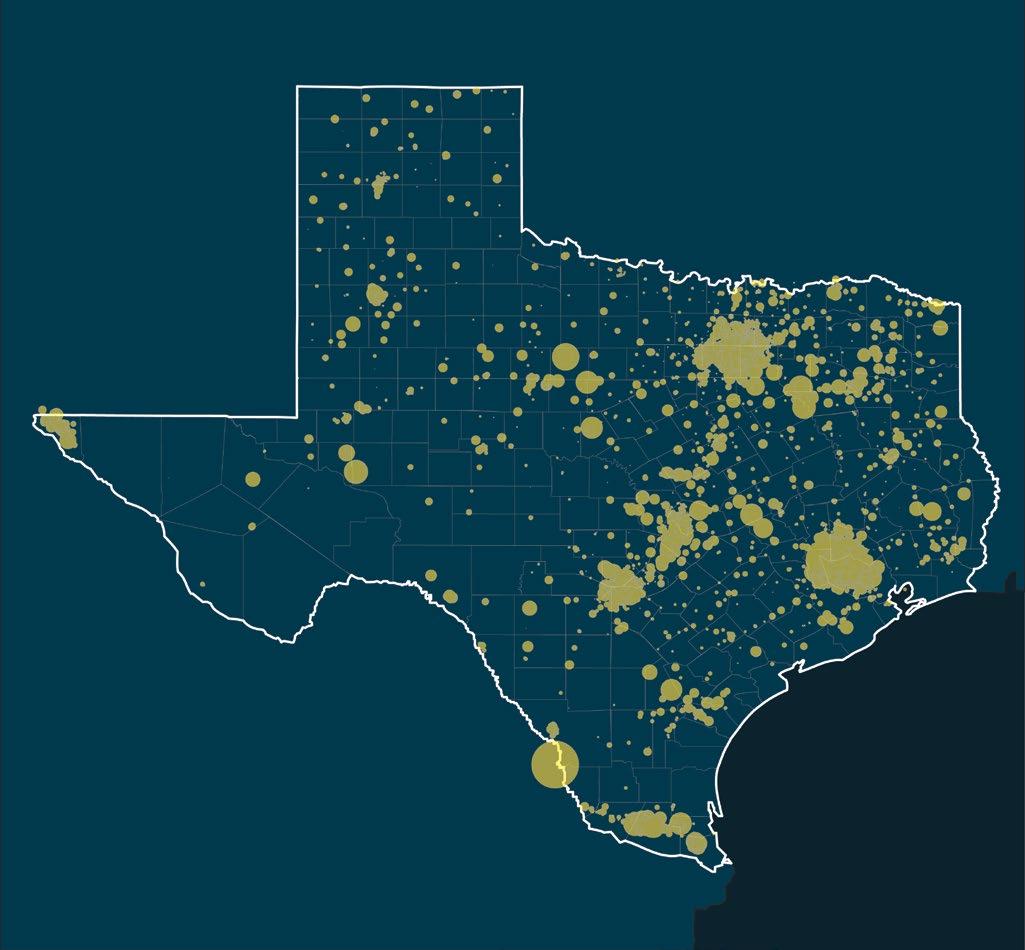
control — relying more heavily on artificial lighting — and therefore would be best suited for a basement or windowless location, increasing operational costs. On the other hand, producing food to supply an office building with surrounding restaurants and markets would need to be more adaptable to the surrounding urban environment, and would need to either be designed into a façade with correct solar orientation, or be designed on the top floors of the building to gain the maximum amount of light, and therefore decreasing operational costs. Between buildings, each farm would work as a network, growing the specific varietals needed to support the building type, and growing others for the surrounding community to share.
EXAMINING DISTRIBUTED PRODUCTION: A CASE STUDY USING TEXAS S.N.A.P. BENEFITS
To create a distributed mesh network of supporting vertical farms, Corgan used publicly available data from the Supplemental Nutrition Assistance Program (SNAP), a program that provides benefits to supplement the food
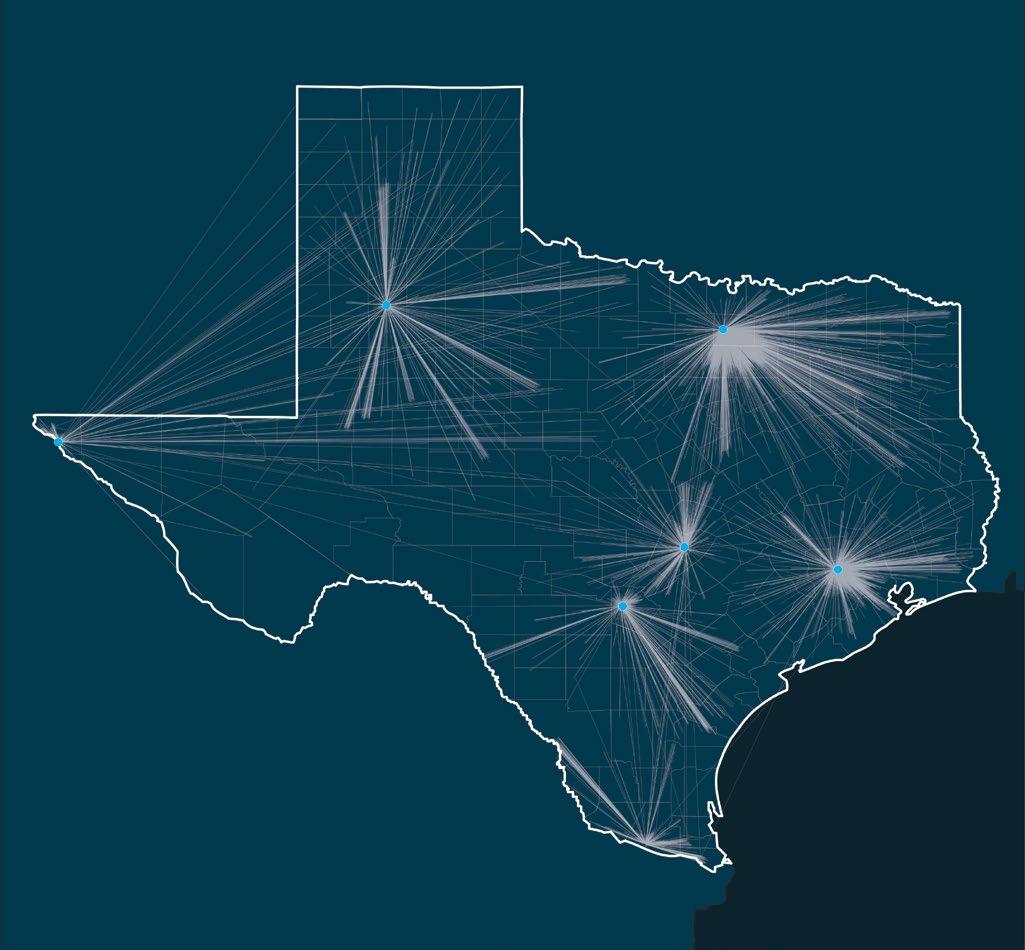
budget of families in need so they can purchase healthy food and move towards self-sufficiency. Concentrating on Texas SNAP distribution locations for education programs, this investigation uncovered opportunities to reduce overall food miles through on-site food production.
Texas is divided into eight distribution regions, with each region delivering USDA food inventory to School Food Authorities (SFA). Once a school has procured their food services order, the food gets processed through state approved processing facilities designated by the Texas Department of Agriculture. These processors are in multiple states.
With on-site vertical farms, a hypothetical food distribution network would enable each school district to operate as its own network, minimizing the distance food must travel. District farms can provide food surplus to local retailers, farmers markets and nutritional programs for profit or donation, and distributed food production sites across the state, specifically in food deserts, can provide low access populations with healthy food.
The PK-12 education ecosystem, specifically in educational institutions participating in SNAP represents a strong use case for vertical farms — either on-site or nearby a campus — to provide benefits to the community such as high quality,
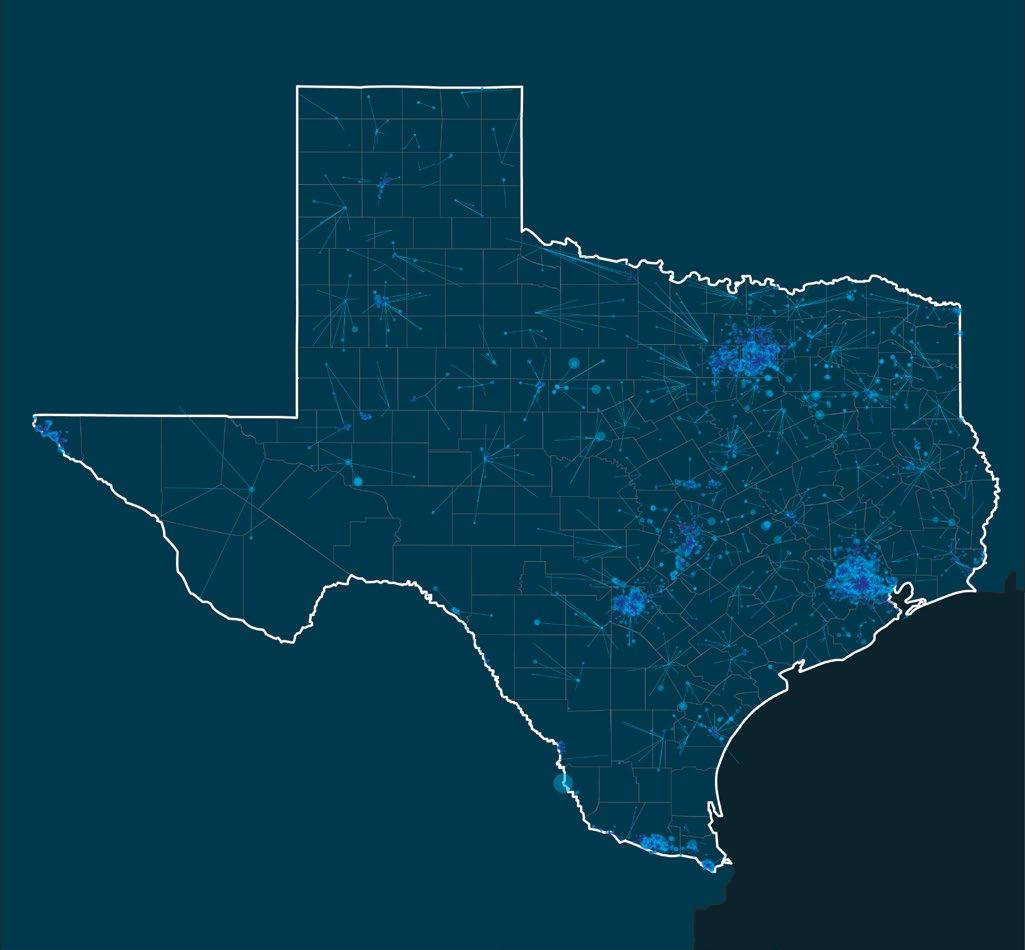
healthier choices for both students and faculty, recognizing new revenue streams for school districts by selling surplus food to local stores and restaurants, and creating food donation programs that allow students and faculty to bring surplus food home to their families.
As a part of this study, USDA, U.S. Census Bureau, SNAP reimbursement, and Farm to School data was analyzed to identify areas with high SNAP enrollment numbers and the lowest access to quality foods. Isolated sites that would benefit most from food production capabilities the most were locations where the average percentage of households lived ten miles or more away from the nearest grocery store, as well as those where the average household had fewer cars than the state average. This means that in Texas, 5,366,737 people live in low food access areas, 368,310 Texans in low access areas are receiving SNAP benefits and 218,464 households in low access areas do not have access to a vehicle.
SNAP enrollment data specifying various food categories provided an estimate of site-specific food production needs. If a vertical farm were to be built in a specific region, the model can provide estimates detailing the number of students likely needing to be served, as well as the serving days per year of fruits, vegetables, vegetable proteins, and herbs.
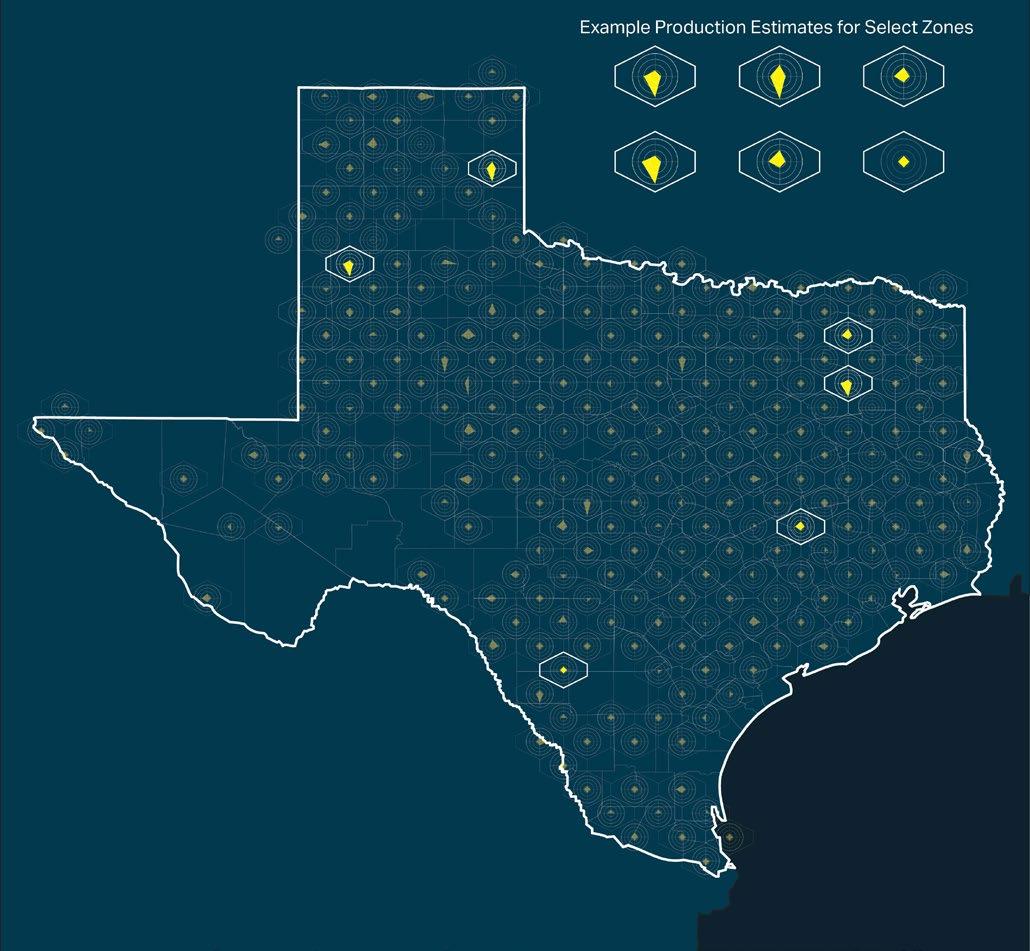
Data Driven Design: Designing an Urban Vertical Farm
To gain a better understanding of how commercial real estate can provide food for both building occupants and the surrounding community, Corgan conducted a design investigation that incorporates a greenhouse vertical farm into a typical office building. Combining site restraints and operations of a traditional office building with the operations of a vertical farm — and using estimated food production and square footage requirements derived from the Texas SNAP benefits case study, solar site analysis tools, and Eden Green’s vertical vine system — a reconfigurable parametric model was created that enables designers to iterate optimal design solutions based on site conditions.
Additionally, the design incorporated multiple community-focused amenities such as an education kitchen and a learning lab — to better understand the harvesting practices and take cooking classes — various cafés, restaurants, grocery, and space to host weekend food donation markets where surplus food can be donated to those who need it the most.
Introducing biophilic design into the workplace can positively impact both the employer and the employee experience. A recent Harvard University study noted that workers exposed to greenery throughout their working day report a 15% higher level of wellbeing, are 6% more productive, and are 15% more creative.31 Measuring enhanced productivity, well-being, and creativity in their respective settings can directly convert to cost savings for a company.32 Additionally, Corgan’s 2021 research study Workforce Blurred — which gathers insights on the workplace from incoming generations — found that 75% of respondents desire green space and access to nature as a standard workplace asset. As much of the workforce have established new working preferences driven by the pandemic, the incoming workforce listed the top three desired amenities as free (fresh) food, access to outdoor space, and a visible commitment to adopting cutting-edge green practices.33

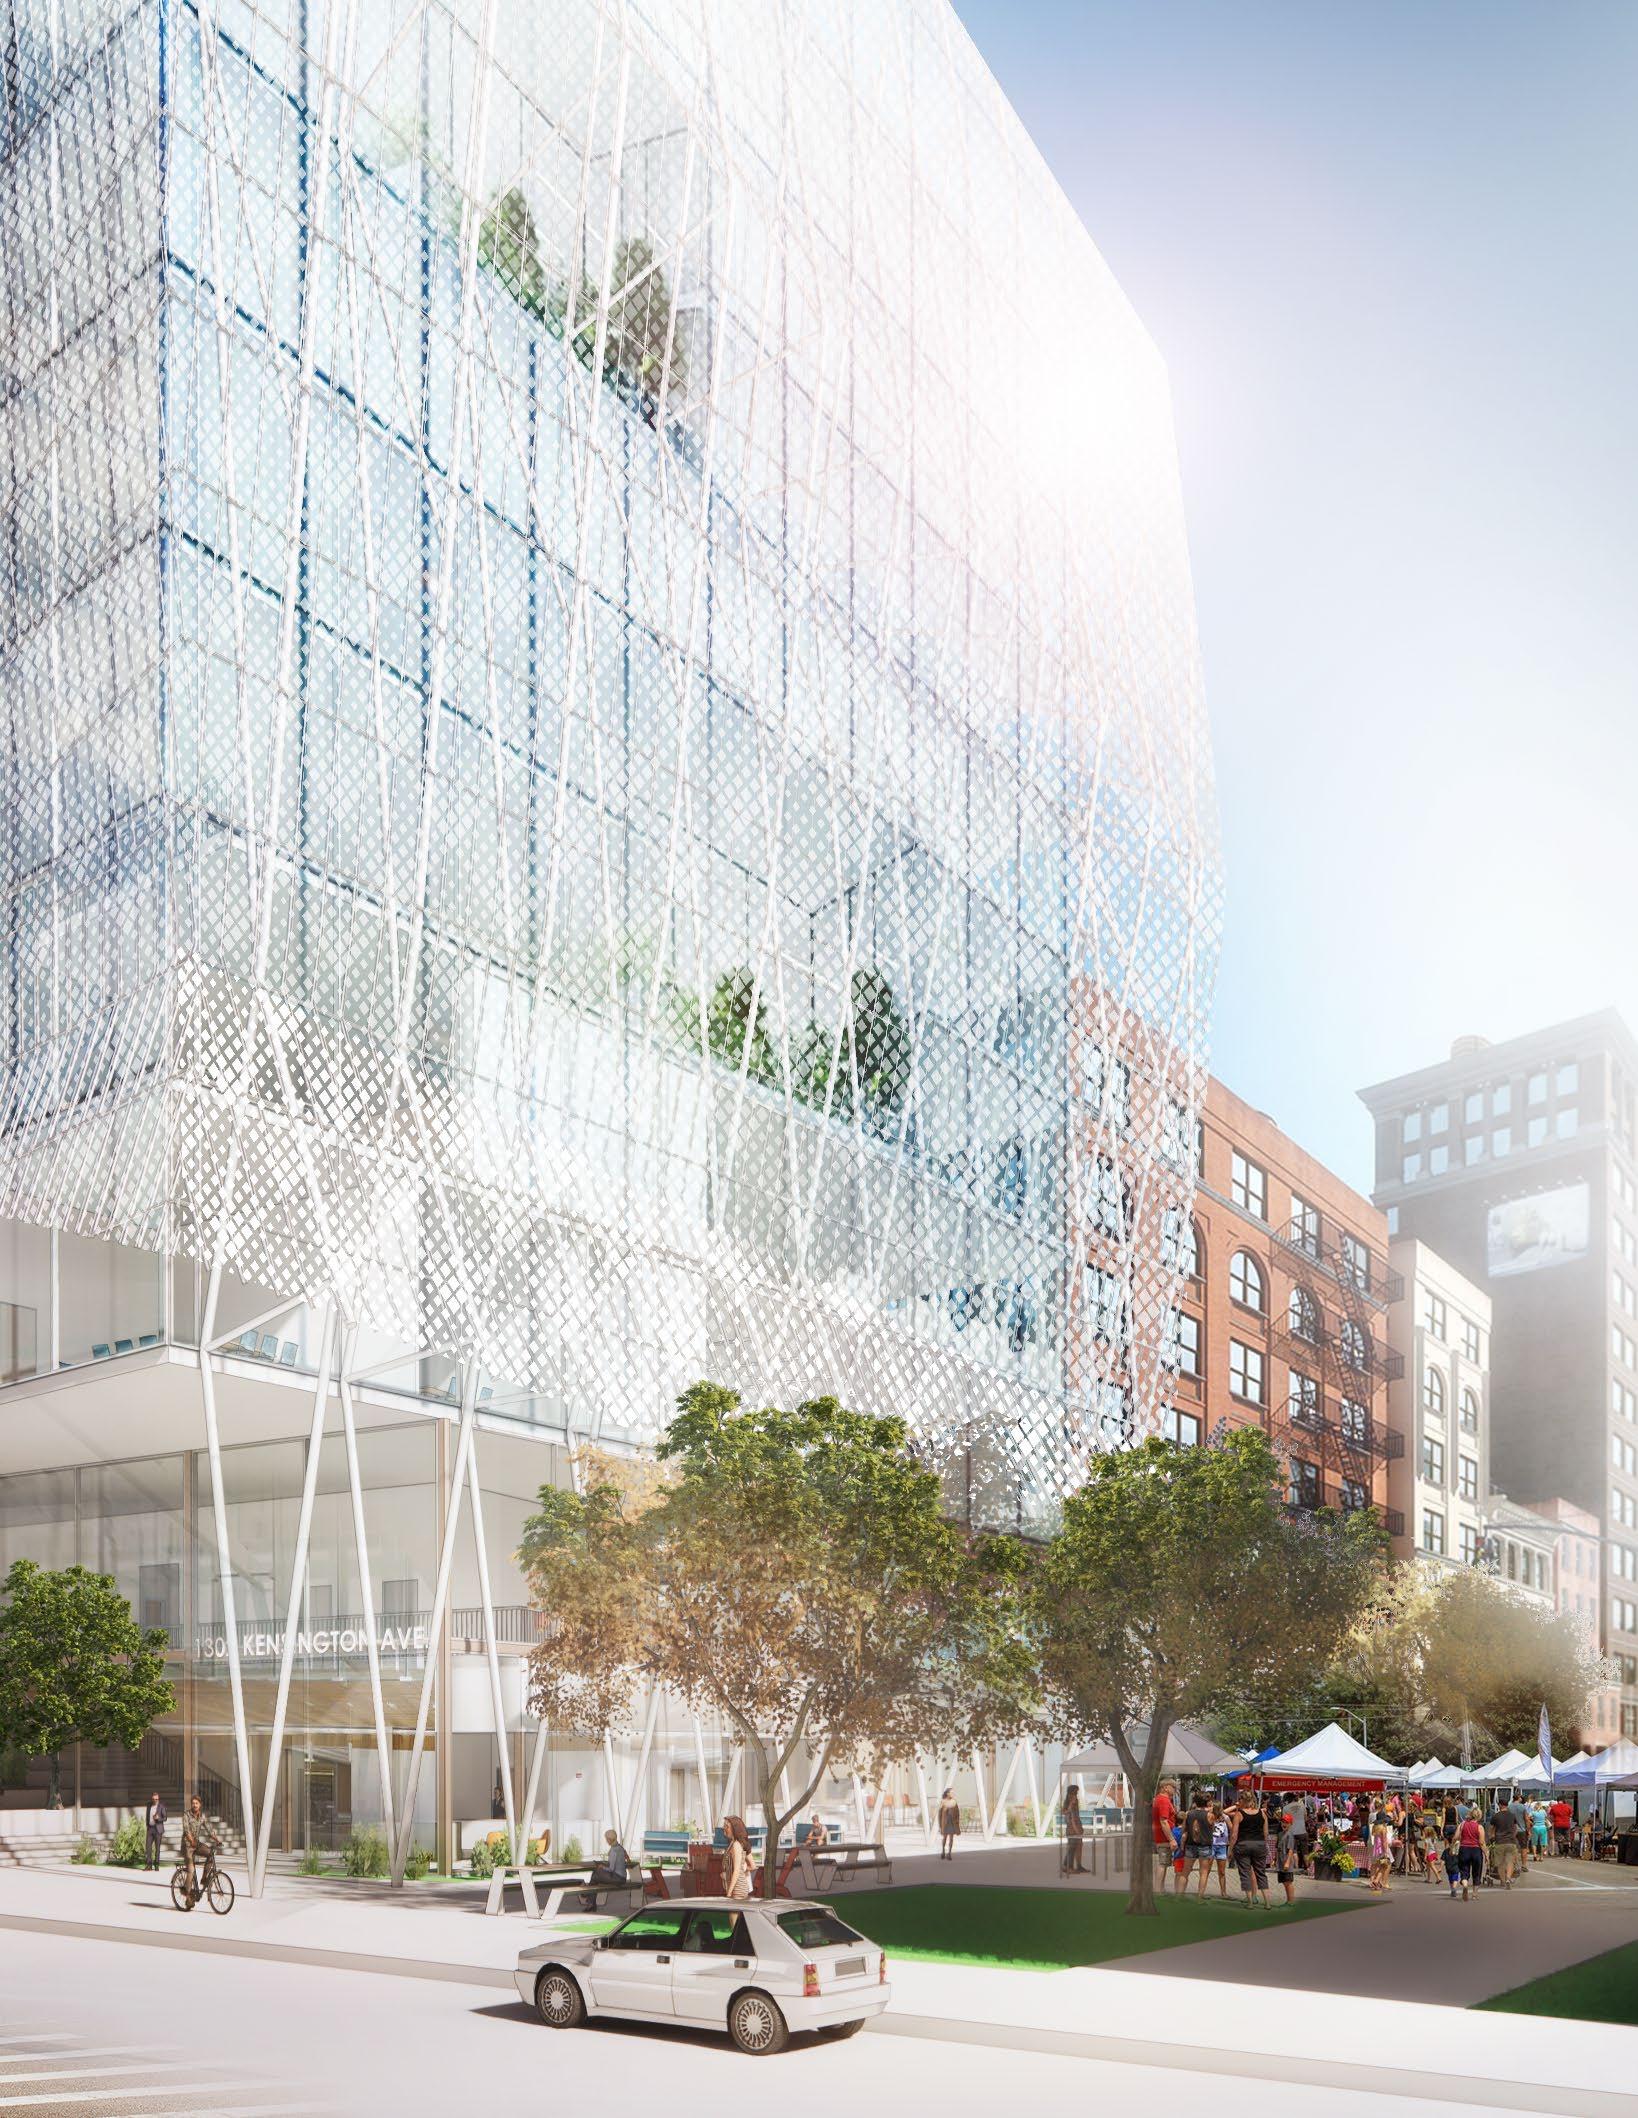
“We don’t just grow food for the community, we create jobs for the community. We also assign a portion of each harvest — nutrient dense food — to donate to the surrounding community.”
—
Eric Schick,
Co-Founder of CEED and Eden Green Technology
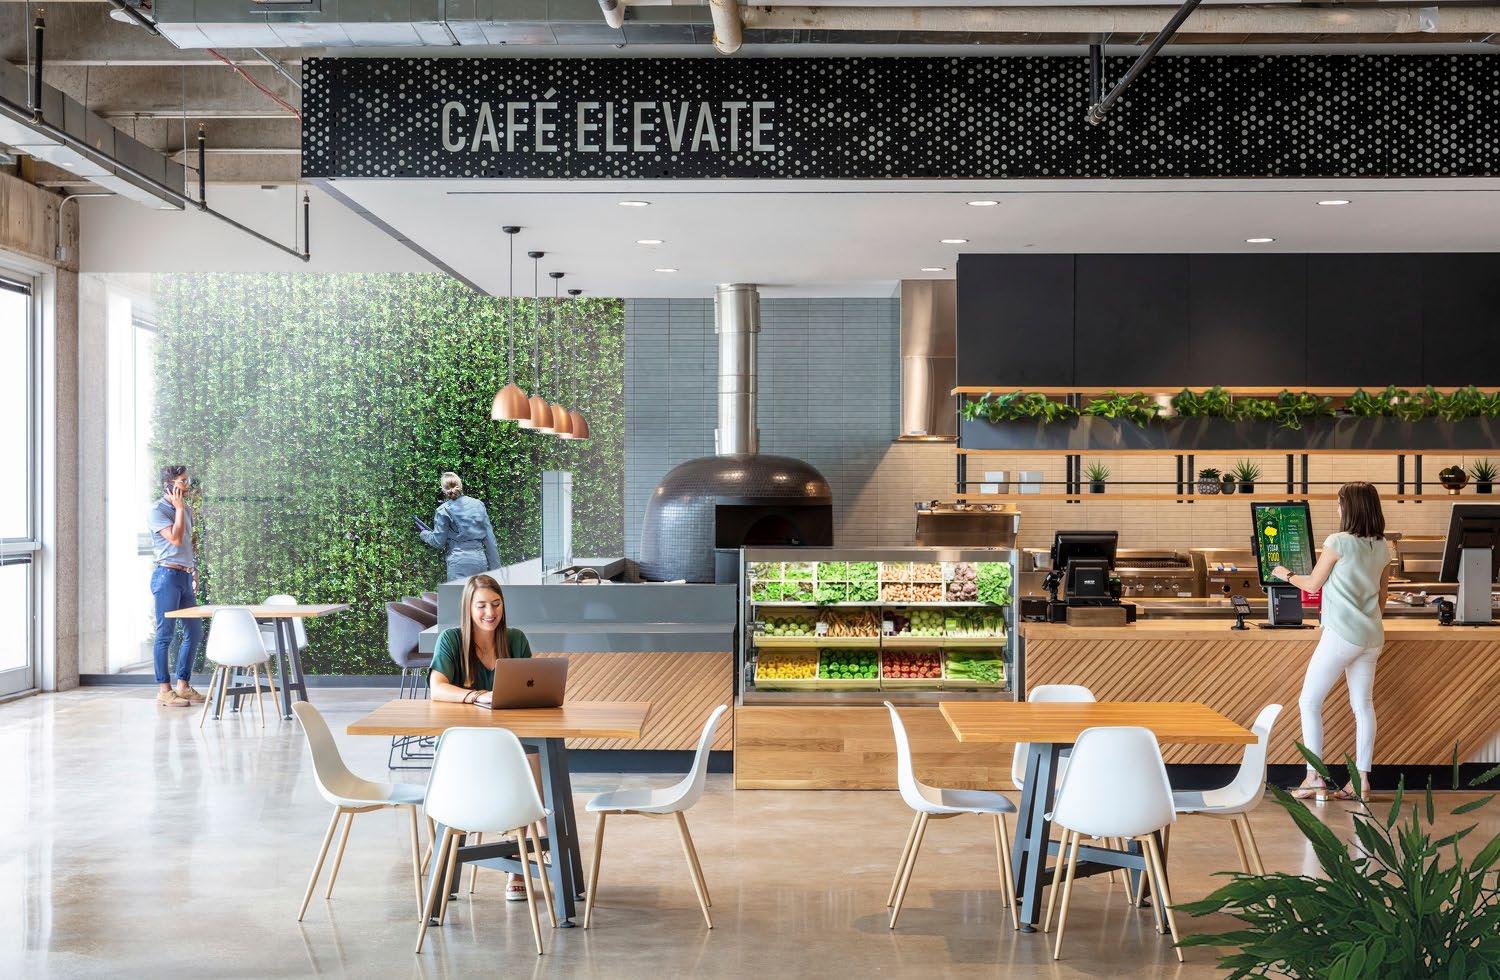
It’s true: healthy workspaces are non-negotiable. Creating an environment that promotes both physical and mental health is essential to the post-pandemic workplace. Providing fresh food cultivated and served on-site can play a big role in a company’s ability to visibly promote health for their employees, while simultaneously serving the surrounding community.
Vertical farming is a maturing industry today and will be a necessary one in the coming decades.
Considering that our buildings are built with enduring lifespans, it is essential to understand how to harmoniously introduce vertical farms into our urban environments.
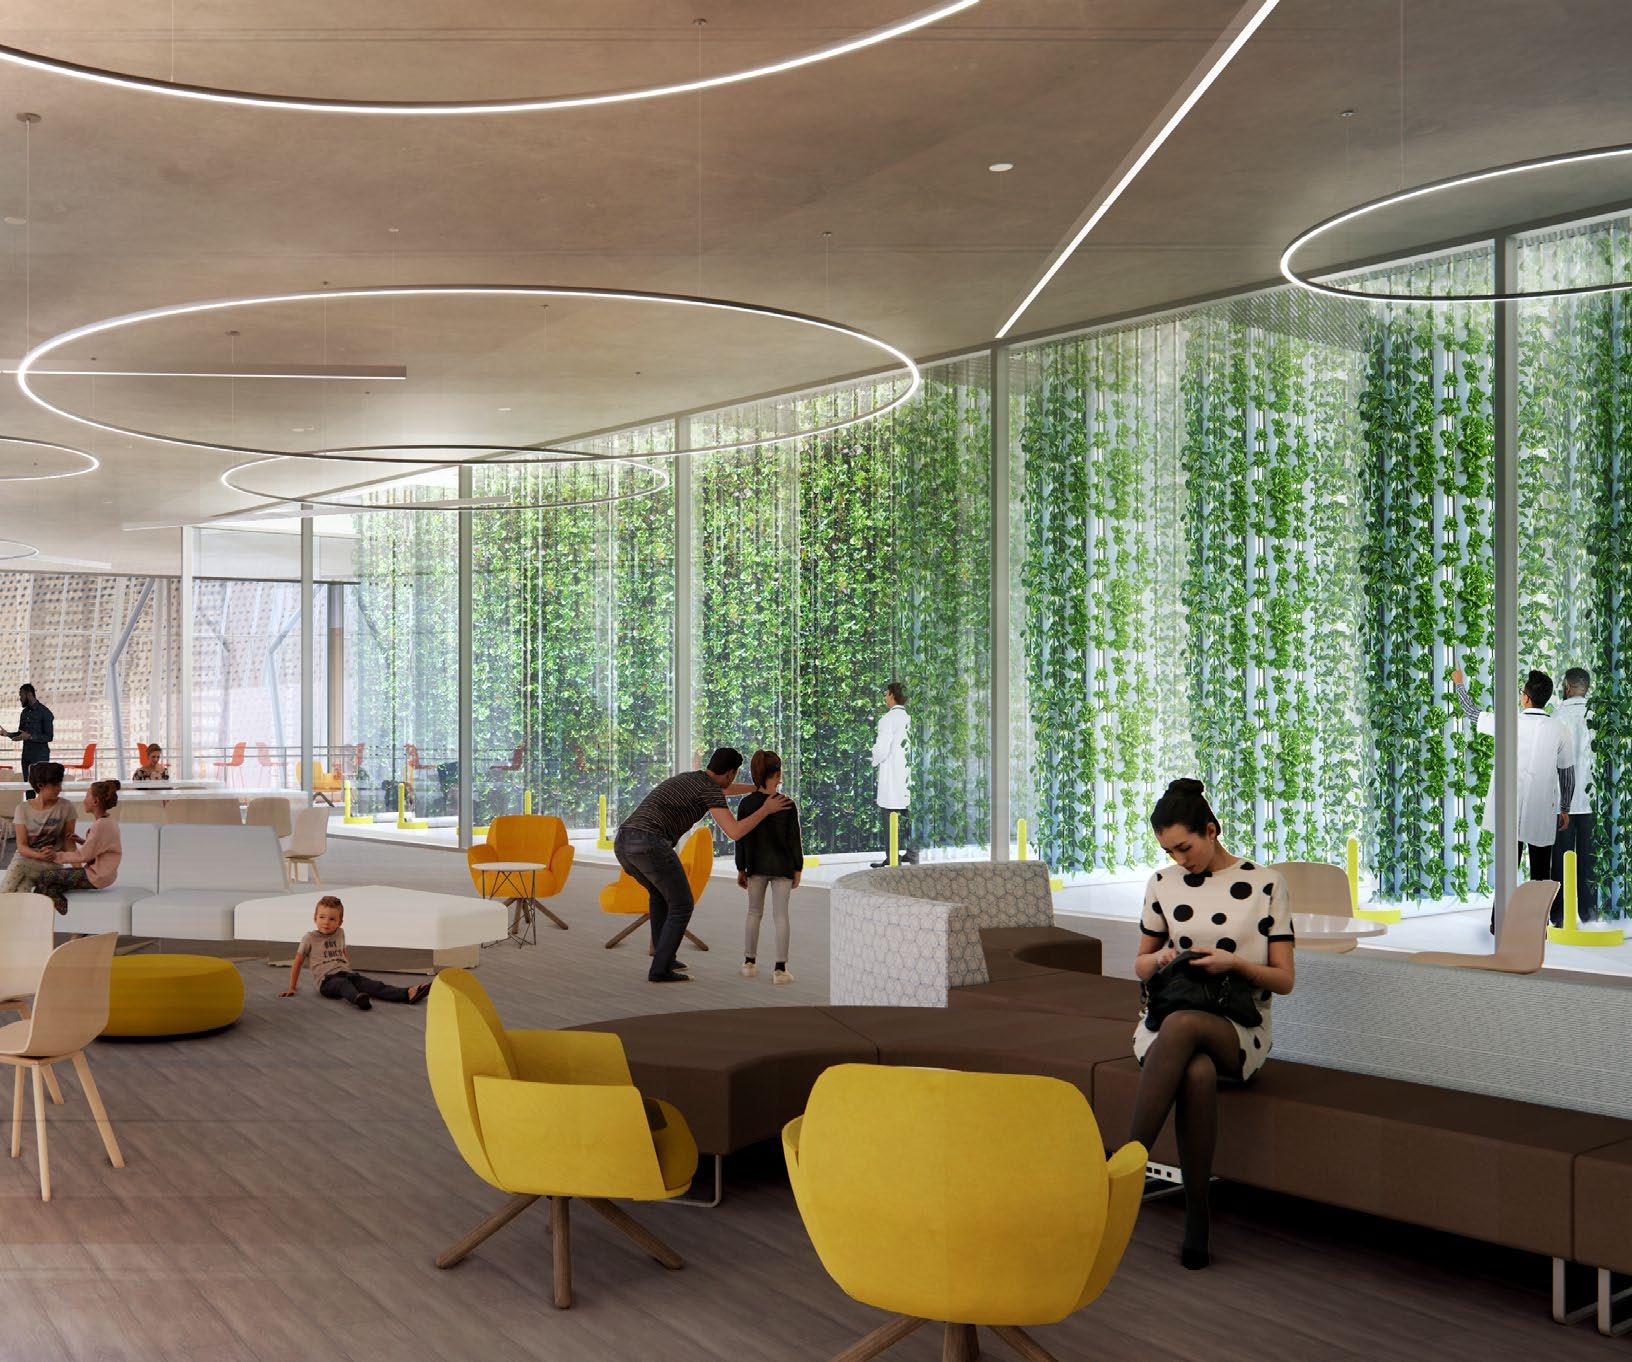
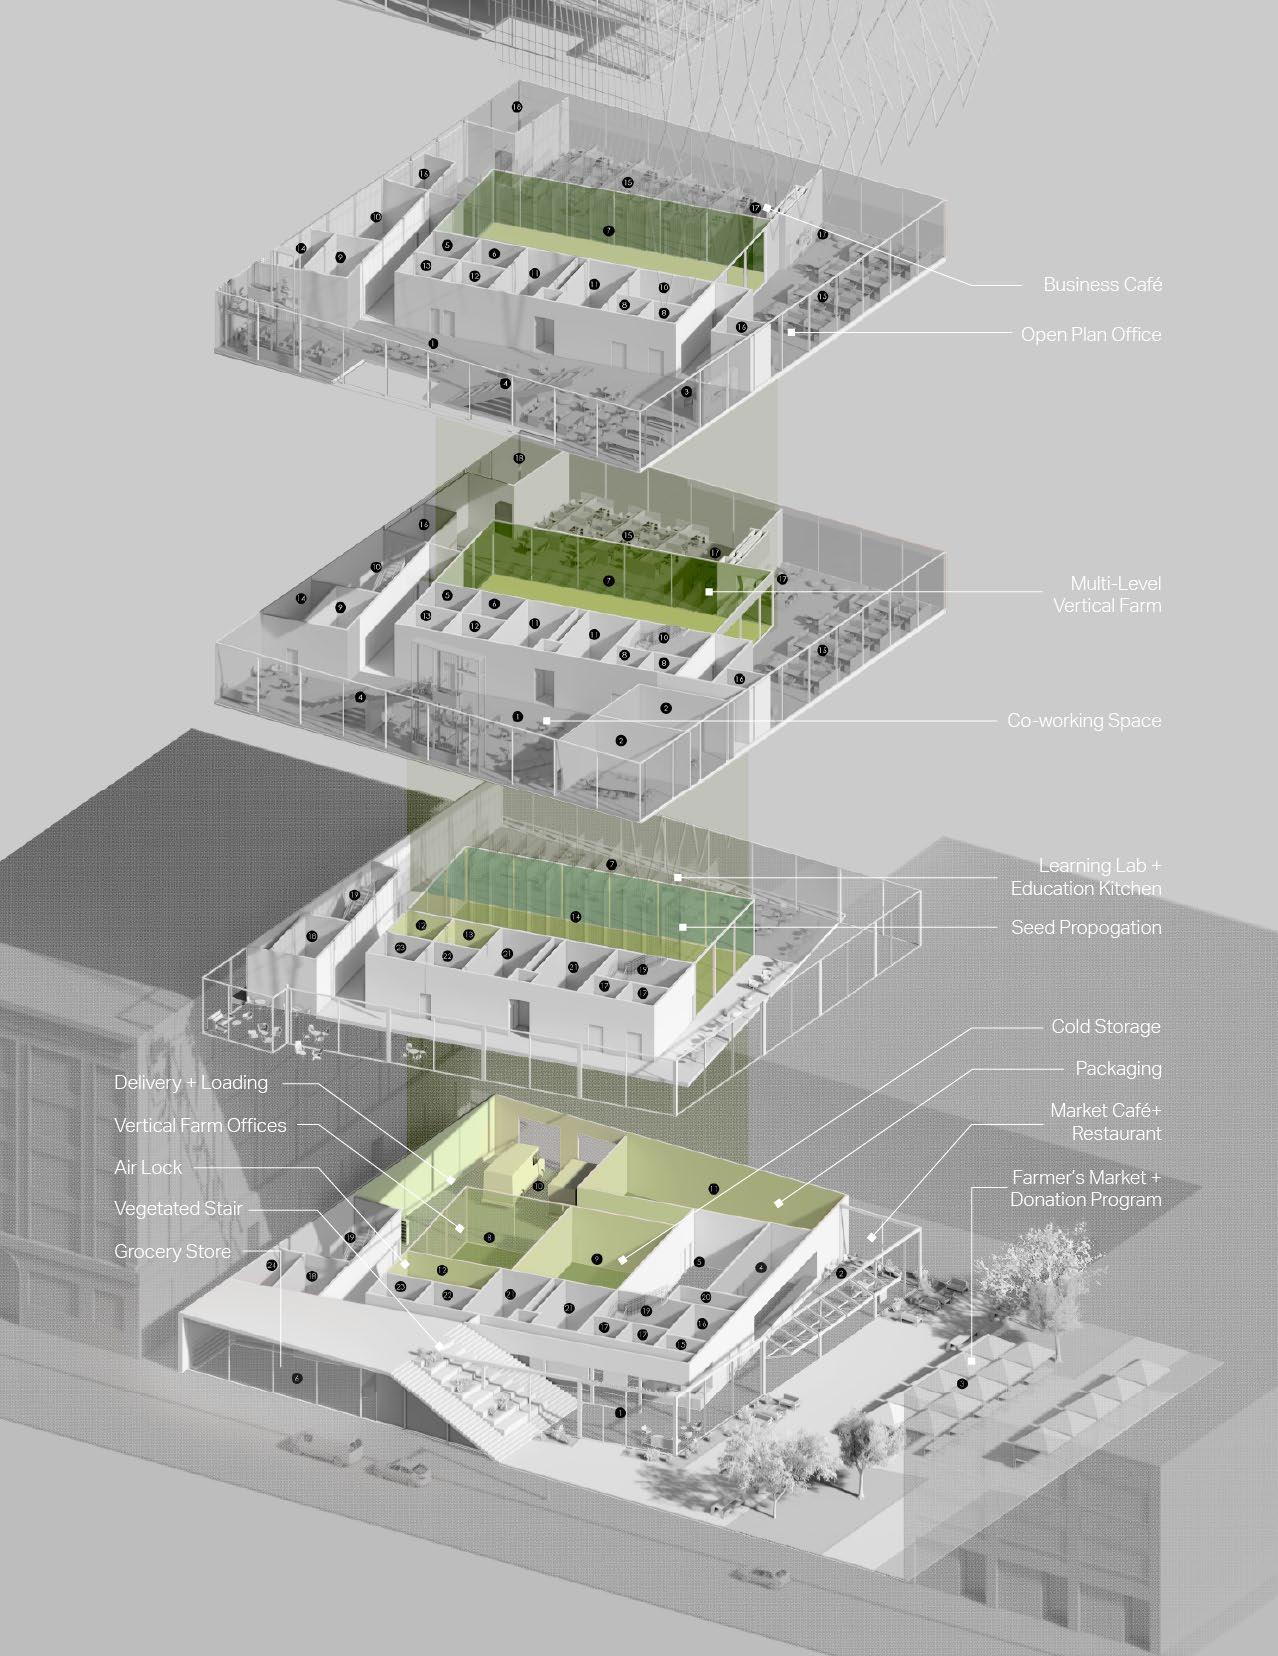

The Power is Shifting — Can You Feel It?
The pace of change is hard to feel when you’re in it – just like you can’t feel the earth spinning because you’re on it. But change is inevitable. The buildings we design are built to last 30+ years, and to reach the goals the world is aiming to achieve by 2050, we need to start changing the way we design and the impact our buildings have on the environment today. We need the ability to continue using energy for our everyday needs, while at the same time, actively limiting how much carbon we are introducing to the atmosphere in the process. We need to change our approach to design.
From our offices to our education facilities – our contribution to the built environment will have to rapdily evolve in many different ways to meet this challenge, requiring a convergence of technological, ecological, economic, political, and design innovation, all driving our power grids to become something entirely new and different.
But even the best innovations are only useful if we posess the creativity, commitment, and courage to use them — pioneering into a future we have no choice but to explore.
Throughout the Curiosity Report we explored how our industry can help decarbonize the grid and lower emissions within the built environment; we looked at where the winds of change can take us, and new ways of getting there; we imagined new ways to deliver quality food to those who need it most; we asked
“can your concrete be made with banana peels?”; we learned about batteries; we created a buzz in the office; we made electricity with our feet; we explored ideas that will truly evolve the design industry; and we learned that there is no silver bullet to get to zero — but we can instead weave each of these innovations into a tapestry of solutions.
Energy is in everything — and that’s no hyperbole. The energy transformation will impact every aspect of our lives today, so that someone else can have a clean, healthy, and sustainable future tomorrow. It’s past the time for incremental changes — it’s time for revolutionary jumps.
Simple awareness is the seed of responsibility. So, take what you have learned here, and explore further. Adapt. Pioneer. And as always, stay curious.

Our Contributors
This report is a collection of shared ideas that have been created through collaboration across Corgan and our network of subject matter experts. Thank you to all of those involved for your incredible insight, bright ideas, and willingness to jump into the future with us!
CORGAN RESEARCH TEAM
Samantha Flores, Hugo, Director
Melissa Hoelting, Hugo, Design Researcher
Kevin Sloan, Hugo, Data Strategist
Tania White, Hugo, Assistant Director
CORGAN CONTRIBUTORS + ADVISORS
Courtney Bain, Marketing, Senior Graphic Designer
Cory Dear, Commercial, Studio Design Director
Brooks Van Essen, Commercial, Architectural Intern
Mingshan Fang, Aviation, Architect
Omid Farzadpour, Data Centers, Architectural Intern
Kyle Hester, Data Centers, Project Manager
Elizabeth Pierce, Marketing, Chief Marketing Officer, Emily Strain, Interiors, Director of Workplace Strategy
Dylan Wells, Model Shop, Director
Lindsay Wilson, President
FEATURED CONTRIBUTORS
Chris Humaradjaja, Aviation, 2021 Student
Architectural Intern
Anuja Pai, Data Centers, Student Architectural Intern
Rachel Sisson, Commercial, 2021 Student Architectural Intern
Di’mond Winston, Education, 2021 Student Architectural Intern
Baoqi Xiao, Aviation, 2021 Student Architectural Intern
EXPERT CONTRIBUTORS
Cal Collier, Chief Marketing Officer, Hover Energy LLC
Chris Griffin, President & Co-Founder, Hover Energy LLC
Alex Hall, CEO, Concrete AI
Kristina Libby, Chief Marketing Officer, Hypergiant
Tom Poulos, Senior Principal, Thornton Tomasetti
Robert Otani, Principal of CORE Studio, Thornton Tomasetti
Brent Rollins, VP of Business Development, Spray-Lock Concrete Protection, LLC
Eric Schick, Co-Founder of CEED and Eden Green Technology
Harrison Tomlinson, Director of Sales, Eden Green Technology
References
Introduction
LET’S TALK ABOUT ENERGY
1. “Conversation’s Last Refuge: The Art, and Heart, of Talking about The Weather | Gabrielle Jackson.” The Guardian. Guardian News and Media, February 20, 2017. https://www.theguardian. com/commentisfree/2017/feb/20/conversations-last-refugethe-art-and-heart-of-talking-about-the-weather
2. Nesler, Clay. “How to Build Smart, Zero Carbon Buildings - and Why It Matters.” World Economic Forum, September 8, 2021. https://www.weforum.org/agenda/2021/09/how-to-build-zerocarbon-buildings/
Energy Generation
THE TESLA-EDISON MODEL
1. Kelly-Detwiler, Peter. The Energy Switch: How Companies and Customers Are Transforming the Electrical Grid and the Future of Power. Prometheus Books, 2021.
2. Waxman, Olivia B. “The Real History That Inspired the Movie ‘the Current War’.” Time. Time, October 25, 2019. https://time. com/5698700/current-war-real-history/
3. “BP Statistical Review of World Energy 2020.” Accessed January 11, 2022. https://www.bp.com/content/dam/bp/ business-sites/en/global/corporate/pdfs/energy-economics/ statistical-review/bp-stats-review-2020-full-report.pdf.
4. Gates, Bill. How to Avoid a Climate Disaster: The Solutions We Have and the Breakthroughs We Need. London: Allen Lane, 2021.
RENEWABLE GENERATION
1. Kelly-Detwiler, Peter. The Energy Switch: How Companies and Customers Are Transforming the Electrical Grid and the Future of Power. Prometheus Books, 2021.
2. “BP Statistical Review of World Energy 2020.” Accessed January 11, 2022. https://www.bp.com/content/dam/bp/ business-sites/en/global/corporate/pdfs/energy-economics/ statistical-review/bp-stats-review-2020-full-report.pdf.
ENERGY GENERATION INFOGRAPHICS
Solar
1. Kelly-Detwiler, Peter. The Energy Switch: How Companies and Customers Are Transforming the Electrical Grid and the Future of Power. Prometheus Books, 2021.
2. Solar Industry Research Data. SEIA. (n.d.). Retrieved January 6, 2022, from https://www.seia.org/solar-industry-research-data
3. Chandler, D. L. (n.d.). Shining brightly. MIT News | Massachusetts Institute of Technology. Retrieved January 6, 2022, from https:// news.mit.edu/2011/energy-scale-part3-1026.
4. Ammazzalorso, Nick, and Aaron Fowles. “Toyota Is Ready to Catch Some Rays in Plano.” Toyota USA Newsroom, February 4, 2021. https://pressroom.toyota.com/toyota-plano-solar-texasheadquarters/.
Wind
1. How do wind turbines work? Energy.gov. (n.d.). Retrieved January 6, 2022, from https://www.energy.gov/eere/wind/howdo-wind-turbines-work
2. U.S. Energy Information Administration — EIA — independent statistics and analysis. Electricity generation from wind — U.S. Energy Information Administration (EIA). (n.d.). Retrieved January 6, 2022, from https://www.eia.gov/energyexplained/ wind/electricity-generation-from-wind.php
3. Iea. (2021, November 1). Wind power — analysis. IEA. Retrieved January 6, 2022, from https://www.iea.org/reports/wind-power
4. Kelly-Detwiler, Peter. The Energy Switch: How Companies and Customers Are Transforming the Electrical Grid and the Future of Power. Prometheus Books, 2021.
Hydroelectricity
1. Status report. Status Report. (n.d.). Retrieved January 6, 2022, from https://www.hydropower.org/status-report.
2. Department of Energy. (n.d.). Retrieved January 6, 2022, from https://www.energy.gov/
3. Status report. Status Report. (n.d.). Retrieved January 6, 2022, from https://www.hydropower.org/status-report
Biofuel
1. “Biofuel Basics.” Energy.gov. Accessed January 10, 2022. https://www.energy.gov/eere/bioenergy/biofuel-basics.
2. “Biofuel.” Encyclopædia Britannica. Encyclopædia Britannica, inc. Accessed January 10, 2022. https://www.britannica.com/ technology/biofuel
3. IEA. “Bioenergy — Fuels & Technologies.” IEA. Accessed January 10, 2022. https://www.iea.org/fuels-and-technologies/ bioenergy
4. “E85 (Flex Fuel).” Alternative Fuels Data Center: E85 (Flex Fuel). Accessed January 10, 2022. https://afdc.energy.gov/fuels/ ethanol_e85.html
5. “Biofuel Facts.” biofuel.org.uk, 2010. http://biofuel.org.uk/ biofuel-facts.html.
6. “Biofuel Evolution Perspectives.” Biofuel: Production, consumption disruptions & risks on the biofuel market, September 9, 2021. https://www.enerdata.net/publications/ executive-briefing/biofuels-market-dynamics.html.
Geothermal
1. Geothermal Electricity Production Basics. NREL.gov. (n.d.). Retrieved January 6, 2022, from https://www.nrel.gov/research/ re-geo-elec-production.html
2. U.S. Energy Information Administration — EIA — independent statistics and analysis. Use of geothermal energy — U.S. Energy Information Administration (EIA). (n.d.). Retrieved January 6, 2022, from https://www.eia.gov/energyexplained/geothermal/ use-of-geothermal-energy.php
3. Electricity generation. Energy.gov. (n.d.). Retrieved January 6, 2022, from https://www.energy.gov/eere/geothermal/ electricity-generation
4. Geothermal energy factsheet. Geothermal Energy Factsheet | Center for Sustainable Systems. (n.d.). Retrieved January 6, 2022, from https://css.umich.edu/factsheets/geothermalenergy-factsheet
5. Altarock Energy. (n.d.). Retrieved January 6, 2022, from https:// www.arpa-e.energy.gov/technologies/projects/millimeterwave-technology-demonstration-geothermal-direct-energydrilling
Nuclear
1. “Nuclear Power Today .” Nuclear Power Today | Nuclear Energy — World Nuclear Association. Accessed January 10, 2022. https://world-nuclear.org/information-library/currentand-future-generation/nuclear-power-in-the-world-today.aspx
2. “U.S. Energy Information Administration — EIA — Independent Statistics and Analysis.” Nuclear explained — U.S. Energy Information Administration (EIA). Accessed January 10, 2022. https://www.eia.gov/energyexplained/nuclear/
3. Magazine, Smithsonian. “China’s Artificial Sun Just Broke a Record for Longest Sustained Nuclear Fusion.” Smithsonian. com. Smithsonian Institution, January 10, 2022. https://www. smithsonianmag.com/smart-news/chinas-artificial-sunreactor-broke-record-for-nuclear-fusion-180979336
4. “10 Big Wins for Nuclear Energy in 2021.” Energy.gov. Accessed January 10, 2022. https://www.energy.gov/ne/articles/10-bigwins-nuclear-energy-2021
5. Wagner, Gernot. “Is Nuclear Power Part of the Climate Solution?” The Wall Street Journal. Dow Jones & Company, January 7, 2022. https://www.wsj.com/articles/is-nuclear-power-part-ofthe-climate-solution-11641571176
6. “List of Commercial Nuclear Reactors.” Wikipedia. Wikimedia Foundation, January 9, 2022. https://en.wikipedia.org/wiki/ List_of_commercial_nuclear_reactors.
7. Ritchie, Hannah. “What Are the Safest and Cleanest Sources of Energy?” Our World in Data, May 5, 2021. https://ourworldindata. org/safest-sources-of-energy#:~:text=We%20see%20 massive%20differences%20in,and%2097.5%25%20 fewer%20than%20gas.
CAPTURING THE POWER THAT IS ALL AROUND US
1. Lee , Joyce, and Feng Zhao . “GWEC Global Wind Report 2021.” Global Wind Energy Council . Vestas , March 25, 2021. https:// gwec.net/wp-content/uploads/2021/03/GWEC-Global-WindReport-2021.pdf
2. Kelly-Detwiler, Peter. The Energy Switch: How Companies and Customers Are Transforming the Electrical Grid and the Future of Power. Prometheus Books, 2021.
3. Ravilious , Kate. “The Windy City: Not Just Chicago.” Physics World, October 18, 2018. https://physicsworld.com/a/thewindy-city-not-just-chicago/
4. Meyer , Andrew. “Why Having Solar Panels Doesn’t Make You ‘off the Grid.’” Swell Energy. Swell Energy , September 28, 2015. https://www.swellenergy.com/blog/why-having-solarpanels-doesn-t-make-you-off-the-grid/
5. “DOE Invests $61 Million for Smart Buildings That Accelerate Renewable Energy Adoption and Grid Resilience.” Energy. gov, October 13, 2021. https://www.energy.gov/articles/ doe-invests-61-million-smart-buildings-accelerate-renewableenergy-adoption-and-grid
6. Renewable Energy World Content Team. “World’s Longest Underground Transmission Line Will Transport Wind Energy to Germany’s Grid.” Renewable Energy World, September 7, 2021. https://www.renewableenergyworld.com/news/worldslongest-underground-transmission-line-will-transport-windenergy-to-germanys-grid/#gref
7. “Project Gigaton FAQs .” Walmart Sustainability Hub. Walmart Sustainability Hub, July 15, 2021. https://www. walmartsustainabilityhub.com/climate/project-gigaton/faqs
JOLTZ
1. “How Long It Takes 11 Big Purchases to Pay for Themselves.” Mental Floss, March 9, 2016. https://www.mentalfloss.com/ article/75525/how-long-it-takes-11-big-purchases-paythemselves.
2. Contributor, TechTarget. “What Is Piezoelectricity? — Definition from Whatis.com.” WhatIs.com. TechTarget, December 7, 2016. https://whatis.techtarget.com/definition/piezoelectricity
3. Introduction to access control (v3). Accessed January 13, 2022. https://bok.idpro.org/article/42/galley/51/download/
4. Harrop, Dr Peter. “Piezoelectric Elastic Energy Harvesting Arrives.” IDTechEx. IDTechEx, August 11, 2015. https://www. idtechex.com/en/research-article/piezoelectric-elastic-energyharvesting-arrives/8256
5. Kelly-Detwiler, Peter. The Energy Switch: How Companies and Customers Are Transforming the Electrical Grid and the Future of Power. Prometheus Books, 2021.
6. Haynes, Abel, and Instructables. “Piezoelectric Shoes: Charge Your Mobile Device by Walking!” Instructables. Instructables, September 28, 2017. https://www.instructables.com/ Piezoelectric-Shoes-Charge-Your-Mobile-Device-by-W/
Energy Storage
THE IMPORTANCE OF ENERGY STORAGE
1. Kelly-Detwiler, Peter. The Energy Switch: How Companies and Customers Are Transforming the Electrical Grid and the Future of Power. Prometheus Books, 2021.
2. “Patent FAQs.” United States Patent and Trademark Office — An Agency of the Department of Commerce, July 1, 2021. https:// www.uspto.gov/help/patent-help
3. “Primary Battery.” Primary Battery — an overview | ScienceDirect Topics. Accessed January 11, 2022. https:// www.sciencedirect.com/topics/engineering/primary-battery
4. Benson, et al. Energ. Environ. Sci. 2013, 6, 2804.
5. “Wind Map.” HINT.FM. Actcessed February 5, 2022. http://hint. fm/wind/
6. “Pumped Storage Hydropower.” Energy.gov. Accessed January 11, 2022. https://www.energy.gov/eere/water/pumped-storagehydropower
7. Frangoul, Anmar. “‘No Commercial Case for Green Hydrogen’ Yet: Siemens Energy CEO.” CNBC. CNBC, October 20, 2021. https://www.cnbc.com/2021/10/20/no-commercialcase-for-green-hydrogen-yet-siemens-energy-ceo.html
V2X PARKING GARAGE
1. Kelly-Detwiler, Peter. The Energy Switch: How Companies and Customers Are Transforming the Electrical Grid and the Future of Power. Prometheus Books, 2021.
2. Halvorson, Bengt. “Could Electricity Be the Currency of Parking Buildings in the Future?” Green Car Reports, August 1, 2020. https://www.greencarreports.com/news/1129094_ could-electricity-be-the-currency-of-parking-buildings-in-thefuture
3. “A Million Mile Battery from China Could Power Your Electric Car.” Bloomberg.com. Bloomberg. Accessed January 11, 2022. https://www.bloomberg.com/news/articles/2020-0607/a-million-mile-battery-from-china-could-power-yourelectric-car
NISSAN PAVILION
1. “Nissan Accepting Electricity as Payment for Parking.” Official Global Newsroom, July 30, 2021. https://global.nissannews. com/en/releases/200731-01-e.
EVOLVING STANDARDS + SAFETY
1. Kelly-Detwiler, Peter. The Energy Switch: How Companies and Customers Are Transforming the Electrical Grid and the Future of Power. Prometheus Books, 2021.
2. Ezer, Oren. “EV Charging Solutions Will Become an Asset, Not a Liability, to the Grid.” TechCrunch. TechCrunch, August 31, 2021. https://techcrunch.com/2021/08/31/ev-chargingsolutions-will-become-an-asset-not-a-liability-to-the-grid/?cx_ testId=6&cx_testVariant=cx_1&cx_artPos=2#cxrecs_s
Energy Distribution
THE GRID THAT POWERS US
1. “U.S. Energy Information Administration — EIA — Independent Statistics and Analysis.” U.S. electric system is made up of interconnections and balancing authorities — Today in Energy — U.S. Energy Information Administration (EIA). Accessed January 11, 2022. https://www.eia.gov/todayinenergy/detail. php?id=27152
2. Kelly-Detwiler, Peter. The Energy Switch: How Companies and Customers Are Transforming the Electrical Grid and the Future of Power. Prometheus Books, 2021.
FOOD MILES STUDY
1. “Home | Agricultural Marketing Service.” Accessed January 10, 2022. https://www.ams.usda.gov/sites/default/files/media/ Main_Highway_Report.pdf
FROM A TO B
1. “U.S. Energy Information Administration — EIA — Independent Statistics and Analysis.” Environment — U.S. Energy Information Administration (EIA) — U.S. Energy Information Administration (EIA). Accessed January 10, 2022. https://www.eia.gov/ environment/emissions/co2_vol_mass.php
THE NEW RIVIAN FRONTIER
1. “Fast Facts on Transportation Greenhouse Gas Emissions.” EPA. Environmental Protection Agency. Accessed January 11, 2022. https://www.epa.gov/greenvehicles/fast-factstransportation-greenhouse-gas-emissions
2. Annierpalmer. “Amazon’s $21 Billion Rivian Stake Is a Bet That Innovation Can Help Solve Climate Change.” CNBC. CNBC, November 13, 2021. https://www.cnbc.com/2021/11/13/ amazons-rivian-bet-furthers-its-climate-change-reductiongoals.html
3. Lora Kolodny, Annie Palmer. “Rivian Delays Won’t Affect Production of Electric Delivery Vans for Amazon.” CNBC. CNBC, July 16, 2021. https://www.cnbc.com/2021/07/16/riviandelays-wont-affect-production-amazon-delivery-vans.html
4. Domonoske, Camila. “Every Auto Startup Wants to Be the next Tesla. Why These 2 May Have a Real Shot.” NPR. NPR, November 27, 2021. https://www.npr.org/2021/11/27/1057282985/everyauto-startup-wants-to-be-the-next-tesla-why-these-2-mayhave-a-real-shot.
THE CHANGING CONSUMER EXPERIENCE
1. “Five Fifty: The Quickening.” McKinsey & Company. Accessed January 11, 2022. https://www.mckinsey.com/businessfunctions/strategy-and-corporate-finance/our-insights/fivefifty-the-quickening.
2. “Global E-Commerce Outlook 2021.” CBRE. Accessed January 11, 2022. https://www.cbre.com/research-and-reports/GlobalE-commerce-Outlook-2021
3. “U.S. Industrial MarketBeat Reports: United States.” Cushman & Wakefield. Accessed January 11, 2022. https://www. cushmanwakefield.com/en/united-states/insights/usmarketbeats/us-industrial-marketbeat
4. Syed M. Zubair Bokhari. “Category: Supply Chain Trends and Issues.” Supply Chain News: Demand for Warehouse Space to Remain Strong, More Automation is Coming, Says State of Logistics Report. Accessed January 11, 2022. https://www. scdigest.com/ontarget/20-07-07_trends_in_warehousing_ state_of_logistics_report.php?cid=1697
5. “Industrial Delivers: Logistics Steps into the Spotlight.” Accessed January 11, 2022. https://s3.us-east-1.amazonaws. com/hines-assets/documents/Industrial-Delivers_LogisticsSteps-into-the-Spotlight-web.pdf.
MICRO-FULFILLMENT CENTERS
1. Dolan, Shelagh. “The Challenges of Last Mile Delivery Logistics and the Tech Solutions Cutting Costs in the Final Mile.” Business Insider. Business Insider, January 11, 2022. https:// www.businessinsider.com/last-mile-delivery-shippingexplained?IR=T
2. Halldórsson, Árni, and Jessica Wehner. “Last-Mile Logistics Fulfilment: A Framework for Energy Efficiency.” Research in Transportation Business & Management. Elsevier, April 24, 2020. https://www.sciencedirect.com/science/article/pii/ S2210539520300511
3. Kickham, Victoria. “For Warehouse Robotics, the Dock Is the Final Frontier.” DC Velocity RSS. DC Velocity, March 19, 2020. https://www.dcvelocity.com/articles/45181-forwarehouse-robotics-the-dock-is-the-final-frontier
4. “Industrial Delivers: Logistics Steps into the Spotlight.” Accessed January 11, 2022. https://s3.us-east-1.amazonaws. com/hines-assets/documents/Industrial-Delivers_LogisticsSteps-into-the-Spotlight-web.pdf
PRIORITIZING THE HOSPITAL GRID
1. “U.S. Energy Information Administration — EIA — Independent Statistics and Analysis.” Energy Characteristics and Energy Consumed in Large Hospital Buildings in the United States in 2007. Accessed January 11, 2022. https://www.eia.gov/ consumption/commercial/reports/2007/large-hospital.php.
2. Kumar, Nirupama Prakash. “Industry Voices-How Microgrids Can Keep Healthcare Facilities Open during Grid Outages.” FierceHealthcare, February 19, 2020. https://www. fiercehealthcare.com/hospitals-health-systems/industryvoices-how-microgrids-can-keep-healthcare-facilities-openduring
3. “Coronavirus (COVID-19) Pandemic: Work ... — | Fema.gov.” Accessed January 11, 2022. https://www.fema.gov/sites/ default/files/2020-09/fema_policy_104-009-19_PA-eligibilitypolicy-covid.pdf
4. “Healthy Energy: Creating Outage-Resilient Hospital Facilities — Blogs.” Healthcare Facilities Today. Accessed January 11, 2022. https://www.healthcarefacilitiestoday.com/ posts/Healthy-energy-Creating-outage-resilient-hospitalfacilities--12497
5. “The February 2021 Cold Weather Outages in Texas and the South Central United States: FERC, NERC and Regional Entity Staff Report.” Federal Energy Regulatory Commission, December 8, 2021. https://www.ferc.gov/media/february2021-cold-weather-outages-texas-and-south-central-unitedstates-ferc-nerc-and
6. Maddox, Will, and D Magazine. “Hospitals Aren’t Guaranteed Power during Forced Blackouts. Here’s Why.” D Magazine, February 21, 2021. https://www.dmagazine.com/healthcarebusiness/2021/02/hospitals-arent-guaranteed-power-duringforced-blackouts-heres-why/
7. Clark, Meagan. “Aging US Power Grid Blacks out More than Any Other Developed Nation.” International Business Times, December 5, 2015. https://www.ibtimes.com/aging-us-powergrid-blacks-out-more-any-other-developed-nation-1631086
8. “The Smart Grid — Department of Energy.” Accessed January 11, 2022. https://www.energy.gov/sites/prod/files/oeprod/ DocumentsandMedia/DOE_SG_Book_Single_Pages%281%29. pdf
9. “Community Lifelines.” FEMA.gov. Accessed January 11, 2022. https://www.fema.gov/fact-sheet/community-lifelines
10. “Microgrids in Hospitals Minimize Threats of Electrical Outages.” Microgrid Knowledge, July 27, 2020. https:// microgridknowledge.com/microgrids-in-hospitals/
Energy Use(r)
THE ENERGY WE USE
1. Ritchie, Hannah, and Max Roser. “Energy Mix.” Our World in Data, November 28, 2020. https://ourworldindata.org/energy-mix
2. Illumination, Duke Energy |. “How You Helped Save 1 Billion Kilowatt-Hours.” illumination, February 13, 2017. https://illumination.duke-energy.com/articles/how-youhelped-save-1-billion-kilowatt-hours
3. Kelly-Detwiler, Peter. The Energy Switch: How Companies and Customers Are Transforming the Electrical Grid and the Future of Power. Prometheus Books, 2021.
4. Ritchie, Hannah, and Max Roser. “Energy Mix.” Our World in Data, November 28, 2020. https://ourworldindata.org/energy-mix.
5. “BP Statistical Review of World Energy 2020.” Accessed January 11, 2022. https://www.bp.com/content/dam/bp/ business-sites/en/global/corporate/pdfs/energy-economics/ statistical-review/bp-stats-review-2020-full-report.pdf.
ZERO TO (BE A) HERO
1. Gates, Bill. How to Avoid a Climate Disaster: The Solutions We Have and the Breakthroughs We Need. London: Allen Lane, 2021.
2. “Why the Building Sector?” Architecture 2030. Accessed December 15, 2021. https://architecture2030.org/why-thebuilding-sector/.
3. “What’s the Difference between Net Zero and Zero Energy? — Part 2.” Rushing, April 7, 2020. https://rushingco.com/whatsthe-difference-between-net-zero-and-zero-energy-part-2/
4. “Carbon Dioxide Emissions from Electricity.” Carbon Dioxide Emissions From Electricity — World Nuclear Association, May 2021. https://www.world-nuclear.org/information-library/ energy-and-the-environment/carbon-dioxide-emissions-fromelectricity.aspx
5. “Embodied vs Operational Carbon — Spot — Blog.” SPOT, August 26, 2020. https://spot.ul.com/blog/embodied-vsoperational-carbon/
6. Fisher , Richard, and Javier Hirschfeld. “Concrete: The Material That’s ‘Too Vast to Imagine’.” BBC Future. BBC, June 28, 2021. https://www.bbc.com/future/article/20210628-concrete-thematerial-that-defines-our-age
7. Walkley , Brant. “Sustainable Cement: The Simple Switch That Could Massively Cut Global Carbon Emissions.” World Economic Forum, August 27, 2020. https://www.weforum.org/ agenda/2020/08/sustainable-cement-carbon-emissionssustainable-development
8. Hobley, Anthony Robert, and Dinah Mcleod. “A Net-Zero World Needs Zero-Carbon Concrete. Here’s How to Do It.” World Economic Forum, July 13, 2021. https://www.weforum.org/ agenda/2021/07/a-net-zero-world-needs-net-zero-concrete/
9. Henrion, Lucca, Volker Sick , Victor C. Li, and Duo Zhang. “Bendable Concrete and Other CO2-Infused Cement Mixes Could Dramatically Cut Global Emissions.” World Economic Forum, February 25, 2021. https://www.weforum.org/ agenda/2021/02/bendable-concrete-and-other-co2-infusedcement-mixes-could-dramatically-cut-global-emissions
10. Pak, Anthony. “Embodied Carbon: Key Considerations for Key Materials.” Canadian Architect, November 2, 2020. https://www. canadianarchitect.com/embodied-carbon-key-considerationsfor-key-materials/
LAYING THE FOUNDATION DIAGRAM
1. TR Construction Omaha. “The Three Gorges Dam.” TR Concrete Construction, October 20, 2020. https:// trconcreteconstructionomaha.com/the-three-gorges-dam/.
2. “Hoover Dam.” Bureau of Reclamation, March 12, 2015. https:// www.usbr.gov/lc/hooverdam/faqs/damfaqs.html
3. “U.S. Interstate Highway System Fast Facts.” American Road & Transportation Builders Association, n.d.
4. Pritchett, Amy. “Hartsfield-Jackson Atlanta International Airport.” New Georgia Encyclopedia, last modified Nov 15, 2021. https://www.georgiaencyclopedia.org/articles/businesseconomy/hartsfield-jackson-atlanta-international-airport/
5. Greer, W. Charles, Subash Reddy Kuchikulla, Kathryn Masters, and John Rone. “Design, Construction and Maintenance of Concrete Pavements at the World’s Busiest Airport .” In Proceedings of the Ninth International Conference on the Bearing Capacity of Roads, Railways and Airfields, 25-27 June 2013, Trondheim, Norway: Bearing Capacity of RAODS, Railways and Airfield. London: CRC Press, 2009.
6. “Katl - Hartsfield - Jackson Atlanta International Airport.” AirNav, December 30, 2021. http://www.airnav.com/airport/atl
7. Huntsman, Scott R. “Design and Construction of the Lake Borgne Surge Barrier in Response to Hurricane Katrina.” Concord, CA: Shaw Environmental & Infrastructure Group , n.d.
8. “Willis Tower.” skyscraperpage.com. Accessed January 12, 2022. https://skyscraperpage.com/cities/?buildingID=5#:~:t ext=Height%20to%20width%20ratio%20is,17%2C500%20 tons%20of%20mechanical%20equipment
9. Fead, Kelley. “The Hows, Whats, and Wows of Willis Tower: A Guide for Teachers.” Chicago: U.S. Equities Realty, 2009.
10. “The Salk Institute ... a Triumph in Concrete.” Concrete Construction, April 1, 1967. https://www.concreteconstruction. net/projects/commercial-industrial/the-salk-institute-atriumph-in-concrete_o
THE OFFICE BUZZ
1. “Law of Conservation of Energy.” Law of conservation of energy — Energy Education. Accessed January 11, 2022. https:// energyeducation.ca/encyclopedia/Law_of_conservation_of_ energy.
2. Kossek, Ellen Ernst, Matthew Perrigino, and Alyson Gounden Rock. “From Ideal Workers to Ideal Work for All: A 50-Year Review Integrating Careers and Work-Family Research with a Future Research Agenda.” Journal of Vocational Behavior. Academic Press, October 29, 2020. https://www.sciencedirect. com/science/article/pii/S0001879120301299
3. “Employee Exhaustion: The Hartford Survey Finds Widening Gap In Burnout Rates Of Women And Men; Burned-Out U.S. Workers More Likely To Seek New Jobs.” The Hartford, September 13, 2021. https://newsroom.thehartford.com/ newsroom-home/news-releases/news-releases-details/2021/ Employee-Exhaustion-The-Hartford-Survey-Finds-WideningGap-In-Burnout-Rates-Of-Women-And-Men-Burned-Out-U.S.Workers-More-Likely-To-Seek-New-Jobs/default.aspx
4. Kelly, Jack. “Indeed Study Shows That Worker Burnout Is at Frighteningly High Levels: Here Is What You Need to Do Now.” Forbes. Forbes Magazine, December 10, 2021. https://www. forbes.com/sites/jackkelly/2021/04/05/indeed-study-showsthat-worker-burnout-is-at-frighteningly-high-levels-here-iswhat-you-need-to-do-now/?sh=74deec4d23bb
5. Kelly, John. “Dictionary.com’s 2021 Word of the Year Is ...” Dictionary.com. Dictionary.com, December 6, 2021. https:// www.dictionary.com/e/word-of-the-year/.
6. The New York Times. “The Big Question: Is the World of Work Forever Changed?” The New York Times. The New York Times, December 8, 2021. https://www.nytimes.com/2021/12/08/ special-series/pandemic-future-work-lifestyle. html?searchResultPosition=9
THE CONSOLIDATED TRAVEL EXPERIENCE
1. “Cognitive Load Theory: Explaining Our Fight for Focus.” BBC Worklife. BBC. Accessed January 11, 2022. https://www. bbc.com/worklife/article/20201103-cognitive-load-theoryexplaining-our-fight-for-focus.
VERTICAL FARMING
1. Foley , Jonathan. “A Five-Step Plan to Feed the World.” Feeding 9 Billion — National Geographic, 2015. https://www. nationalgeographic.com/foodfeatures/feeding-9-billion/
2. Desjardins, Jeff, ed. “Population Boom: Charting How We Got to Nearly 8 Billion People.” World Economic Forum, December 1, 2021. https://www.weforum.org/agenda/2021/12/worldpopulation-history/
3. Plumptre, Andrew. “Just 3% of Earth’s Land Ecosystems Remain Intact — but We Can Change That.” The Conversation, April 15, 2019. https://theconversation.com/just-3-ofearths-land-ecosystems-remain-intact-but-we-can-changethat-158587
4. Ritchie, Hannah, and Max Roser. “The Breakdown of Global Land Use Today .” Our World in Data. Oxford, September 2019. https://ourworldindata.org/land-use.
5. Kapoor, Kanupriya. “Climate Change and Biodiversity Loss Must Be Tackled Together — Report.” Reuters. Thomson Reuters, June 10, 2021. https://www.reuters.com/business/ environment/climate-change-biodiversity-loss-must-betackled-together-report-2021-06-10/
6. Branford, Sue, and Glenn Scherer. “A World of Hurt: 2021 Climate Disasters Raise Alarm over Food Security.” Mongabay Environmental News, August 4, 2021. https://news.mongabay. com/2021/08/a-world-of-hurt-2021-climate-disasters-raisealarm-over-food-security/
7. Wollerton, Megan. “What to Know about This Year’s Raging Wildfires.” CNET. CNET, December 22, 2021. https://www.cnet. com/home/energy-and-utilities/what-to-know-about-thisyears-raging-wildfires/
8. Hake , Monica, Adam Dewey , Emily Engelhard , Mark Strayer, Sena Dawes , Tom Summerfelt , and Craig Gundersen. “The Impact of the Coronavirus on Food Insecurity in 2020 & 2021 .” Feeding America . Feeding America , March 2021. https://www.feedingamerica.org/sites/default/ files/2021-03/National%20Projections%20Brief_3.9.2021_0. pdf
9. “Exploring America’s Food Deserts.” The Annie E. Casey Foundation. The Annie E. Casey Foundation, February 13, 2021. https://www.aecf.org/blog/exploring-americas-fooddeserts.
10. Charles, Amber. “Food Deserts: Causes, Effects, and Solutions.” Healthline. Healthline Media, June 14, 2021. https://www. healthline.com/nutrition/food-deserts#causes
11. “How Far Does Your Food Travel to Get to Your Plate?” CUESA. Center for Urban Education about Sustainable Agriculture , February 5, 2018. https://cuesa.org/learn/how-far-does-yourfood-travel-get-your-plate
12. Nicolai, Folkert. “Rail Freight Produces 6 Times Less CO2 Than Truck.” RailFreight.com. ProMedia Group , December 24, 2021. https://www.railfreight.com/policy/2020/01/08/railfreight-produces-6-times-less-co2-than-truck/?gdpr=deny
13. Greene , Suzanne. “Freight Transportation.” MIT Climate Portal, September 4, 2020. https://climate.mit.edu/explainers/freighttransportation
14. “FAO: 14% of the World’s Food Is Lost between Harvest and Retail.” Global Agriculture , October 16, 2019. https://www. globalagriculture.org/whats-new/news/en/33821.html
15. “Food Loss and Waste .” U.S. Food and Drug Administration. FDA, November 19, 2n.d.. https://www.fda.gov/food/ consumers/food-loss-and-waste
16. “Food Waste Research .” EPA. Environmental Protection Agency, November 30, 2021. https://www.epa.gov/landresearch/food-waste-research
17. Helm, Janet. “Top Food Trends for 2022 .” U.S.News Health U.S. News , December 21, 2021. https://health.usnews.com/ health-news/blogs/eat-run/slideshows/top-food-trends-for2022?slide=2.
18. “Restaurant Trends in 2022.” Oracle, 2021. https://www.oracle. com/industries/food-beverage/restaurant-trends/?utm_ source=convertkit&utm_medium=email&utm_campaign=Inn ovators%2BTop%2BTen%2B-%2BDecember%2B20th%2C% 2B2021+-+7231448
19. Green, Elizabeth. “Honing in on Planetary Health: Suppliers’ Insights on 2022 ‘Shared Planet’ Trend.” Food Ingredients 1st . CNS Media., December 6, 2021. https://www. foodingredientsfirst.com/news/honing-in-on-planetary-healthsuppliers-share-insights-on-2022-shared-planet-trend.html
20. “Water in Agriculture.” World Bank. World Bank Group Water Global Practice , May 8, 2020. https://www.worldbank.org/en/ topic/water-in-agriculture#1
21. Lefkowitz |, Melanie. “Smart Irrigation Model Predicts Rainfall to Conserve Water.” Cornell Chronicle. Cornell University , July 16, 2019. https://news.cornell.edu/stories/2019/07/smartirrigation-model-predicts-rainfall-conserve-water
22. Krishnamurthy, Anuj. “Can Renewable Energy Benefit American Agriculture?” Kleinman Center for Energy Policy. University of Pennsylvania , December 11, 2020. https://kleinmanenergy. upenn.edu/news-insights/can-renewable-energy-benefitamerican-agriculture/
23. Food Institute. “A Primer on Vertical Farming as the Industry Gains Steam.” HortiBiz. Food Institute , June 15, 2021. https:// www.hortibiz.com/newsitem/?tx_news_pi1%5Bnews%5D=416 75&cHash=9310f26673e691caa626fdff4ae5754e#:~:text=Ac cording%20to%20PitchBook%20data%2C%20nearly,the%20 company%20at%20%242.3%20billion.
24. “Vertical Farming: How Plant Factories Stack up against Field Agriculture.” Association of Equipment Manufacturers , March 31, 2020. https://www.aem.org/news/vertical-farming-howplant-factories-stack-up-against-field-agriculture.
25. Federman, Sarah, Jim Pantaleo, Paul E. Hadinger, Amitkumar Patel, Leah Hammond, Melanie Bennett, Ben Weaver, et al. “Vertical Farming for the Future.” USDA. U.S. Department of Agriculture , October 25, 2021. https://www.usda.gov/media/ blog/2018/08/14/vertical-farming-future.
26. “What Is Vertical Farming? Everything You Should Know About This Innovation .” Eden Green Technology (blog), August 7, 2020. https://www.edengreen.com/blog-collection/whatis-vertical-farming?utm_source=social+media+post&utm_ medium=facebook&utm_campaign=blog+posts&utm_content =vertical+farming+article
27. Sporrer, Alyssa. “Want Your Own Farm? This One Comes in a Shipping Container.” FreightWaves, September 29, 2021. https://www.freightwaves.com/news/ want-your-own-farm-this-one-comes-in-a-shippingcontainer#:~:text=How%20much%20food%20can%20 one,many%20times%20versus%20a%20field
28. Press. “USDA Ars Selects Amplifiedag as Its First Vertical Farming Platform; Launches CEA Study to Develop New Industry Standards.” Food Industry Executive, October 20, 2021. https://foodindustryexecutive.com/2021/10/usda-arsselects-amplifiedag-as-its-first-vertical-farming-platformlaunches-cea-study-to-develop-new-industry-standards/.
29. Klein, Jesse. “What News from 3 Top Vertical Farm Players Means for 2022.” Greenbiz, December 23, 2021. https://www. greenbiz.com/article/what-news-3-top-vertical-farm-playersmeans-2022.
30. Zuidema, Teake. “Vertical Farms Are Finally Branching Out.” Popular Science, November 22, 2021. https://www.popsci.com/ science/vertical-farms-energy-use-photos/
31. Browning , Bill, and Sir Cary Cooper . “The Global Impact of Biophilic Design in the Workplace .” Global Human Spaces Accessed December 30, 2021. http://interfaceinc.scene7. com/is/content/InterfaceInc/Interface/EMEA/eCatalogs/ Brochures/Human%20Spaces%20report/English/ec_euglobalhumanspacesreport-enpdf.pdf.
32. “The Economics of Biophilia.” Terrapin Home — Terrapin Bright Green, May 1, 2014. https://www.terrapinbrightgreen.com/ reports/the-economics-of-biophilia/
33. Roundtable, Silverado. “Post-Pandemic Workplace: Bright, Light, and Plant Filled, New White Paper Finds.” Cision PR Newswire , January 27, 2021. https:// www.prnewswire.com/news-releases/post-pandemicworkplace-bright-light-and-plant-filled-new-white-paperfinds-301216079.html