Input to your Strategy for Adapting to Challenges Feel free to pass on to friends and clients wanting independent economic commentary ISSN: 2703-2825 Sign up for free at www.tonyalexander.nz
Thursday 4 August 2022
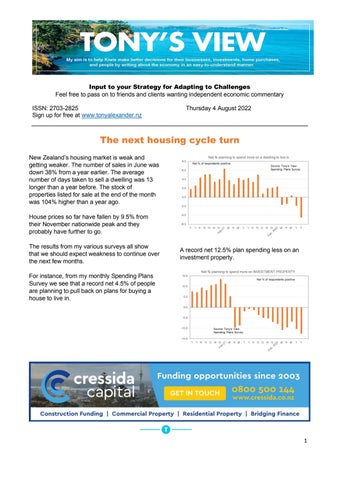
The next housing cycle turn New Zealand’s housing market is weak and getting weaker. The number of sales in June was down 38% from a year earlier. The average number of days taken to sell a dwelling was 13 longer than a year before. The stock of properties listed for sale at the end of the month was 104% higher than a year ago. House prices so far have fallen by 9.5% from their November nationwide peak and they probably have further to go. The results from my various surveys all show that we should expect weakness to continue over the next few months.
A record net 12.5% plan spending less on an investment property.
For instance, from my monthly Spending Plans Survey we see that a record net 4.5% of people are planning to pull back on plans for buying a house to live in.
1
From the monthly survey of property investors which I run with Crockers Property Management we have a gross 24% saying they are thinking about buying another property. This is consistent with the run of lower intentions established since April.
A net 51% say that fewer people are showing up at auctions and a net 47% say that fewer are showing up at open homes. It all looks pretty grim, especially in the context of From my monthly survey of mortgage advisers with mortgages.co.nz we can see a net 7% saying they are seeing fewer first home buyers looking for advice and a net 44% saying they are getting fewer enquiries from investors. And from my monthly survey of residential real estate agents undertaken with REINZ we can see a net 66% say prices are falling in their areas.
• • • • • •
near record low levels of business and consumer confidence, above average mortgage rates, the biggest hike in the cost of living since 1990, net migration outflows, collapsing developers, and a soon to start collapse in the number of consents being issued for new dwellings to be built.
But what if we looked at the market from a different perspective? What if instead of saying what is the outlook, we were to ask this.
Page | 2
When will the buyers return? I have a view that the buyers will start coming out of the shadows before the end of the year and sufficient numbers will re-engage with the housing market through 2023 to produce price rises averaging maybe 5%+ for the calendar year, rising sales, and an eventual pullback in the stock of listings. How can I justify what sounds like a positive view when for the moment things all point in the other direction? A key driver is the state of the labour market. Job opportunities abound, people know that if they get laid off they will be able to find another job elsewhere quite quickly. That means very few people will be fearful of not being able to service their mortgage. But it also means the usual shutting the doors on all thoughts of buying a house by those who have not already done so (including upgraded accommodation) has not happened. The buyers are still there – but in the shadows.
As the light grey line, we however see a surge in observations that people are worried about high interest rates. That is very important because it is looking more and more like fixed mortgage rates have peaked for all but perhaps the one year term. The cost to banks of borrowing money to lend fixed for periods of 2-5 years has fallen 0.5% 0.8% since mid-June. Bank margins for three year lending are now almost above average and scope may soon exist for a round of cuts as we saw one month back for the two year fixed term.
One gauge of labour market strength can be garnered from my monthly survey of real estate agents with REINZ. This graph says a lot. It shows two of the factors which agents can report that buyers are worried about. Shown as the light blue line we see no upward trend in observations that people are worried about their jobs.
Central banks currently are raising their cash rates rapidly not so much to crunch their
Page | 3
economies because they are already being slammed by a cost of living crisis. I have noted previously that a 7.3% hike in the cost of living in New Zealand hits 100% of households. Rising mortgage rates affect only one-third and for many of them the dollars involved will be small.
Interest rate predictions and vendor behaviour aside, there are other signs of things getting set to turn within the next 6-9 months which I can glean from my surveys. From my monthly survey of real estate agents with REINZ we can see that the extent to which agents are reporting worsening numbers at open homes is easing.
Monetary policy is not as effective as a large cost of living hit in restraining consumer spending. Central banks are raising interest rates to reestablish their lost credibility. They are achieving success and when they feel they have regained sufficient respect they will start adjusting interest rates to better reflect the prospects for inflation in their economies. The financial markets are pricing in at least two rate cuts in the United States before the end of 2023 and that is the sort of thing which heavily influences fixed interest rates in New Zealand for two years and beyond. The upshot is this. At some point probably before the end of the year worries about rising interest rates will fall. When that happens, a condition will be established for buyers to step forward and more actively peruse the rising stock of listings. But reduced interest rate fears won’t be enough. We will also need vendor capitulation. This is the situation where those looking to sell their properties give up all hope of achieving a price remotely close to what they could have got last year. They want to get on with their lives so decide to meet the market. There are tendrils of that at the moment, but nothing yet substantive enough to allow one to say that we are fully in the endgame for this period of house price declines. But we are getting close.
This does not mean that more people are showing up. It means the deterioration is slowing. It is akin to having fallen in the water, hit the bottom, and now rising to the surface (you’re still drowning). Sometime after that you’ll be breaking through into the air. The graph for attendance at auctions is showing a similar less bad trend. So too is the one for observations of interest by first home buyers.
Page | 4
ARE YOU NOTICING MORE OR FEWER FIRST HOME BUYERS IN THE MARKET? 80 Source: REINZ & Tony Alexander Real Estate Survey
60
reporting more first home buyers looking for advice.
40 20 0 -20 -40
Net % more
-60 -80
Note also the decrease in the number of agents reporting seeing investors selling. To repeat my comment from April last year. There is no wave of investors selling.
Credit crunch easing Another factor contributing to my view of the conditions being set for the market to turn is the easing of the credit crunch. We are probably never going back to the ease of access to home buying credit which existed in the three decades before alterations to the Credit Contracts and Consumer Finance Act which were effective from December 1 last year. But the degree of credit tightness is on an easing path.
And is it that FOOP is turning?
Then we get some interesting results also from my monthly survey of mortgage advisers with mortgages.co.nz for which I deliberately did not present the graphs when I mentioned them on the first page above. Advisers are almost
Mortgage advisers report that lenders are perceived as becoming more willing to advance funds.
Residential property investors in my survey with Crockers Property Management report reduced degrees of difficulty getting finance.
Page | 5
The buyers have not gone. They have simply taken two or three steps back from the line into the shadows. They will-re-emerge in numbers down the track. My best guess? Housing market reports heading into Christmas will be of a quite different tone to those you are reading now.
We can see the shift in the credit crunch also in official data gathered by the Reserve Bank showing the proportion of new bank lending to borrowers with less than a 20% deposit. The proportion hit a low of just 5.1% in March but is now back at 7.8%.
And what does this imply for house prices in 2023? They will rise between 5% and 10% because 80% of what is happening in the real estate market at the moment is not a structural shift. The absence of a flood of vendors tells us that once the huddled, job safe, buyers return, listings will quickly decline again, FOMO will return, and prices will climb anew, but not like they did before. Why? Because of higher average interest rates and structural reduced credit availability. Oh, and one final thing to keep in mind regarding prices. Market prices are going down, but construction costs are going up. A natural level of support for prices is being created and it is probably not far from where the market is now.
As yet there is no slam dunk case for saying things are improving, or that they will definitely improve by some particular timeframe such as before Christmas, Easter, mid-2023 or whatever. No-one can deliver that level of accuracy. And as yet I am unwilling to coin the wording I used from some 15 or so months ago – namely that we back then had entered the endgame for the prices boom.
And finally, consider this quirk. Once average house prices have fallen by another 5.5% to sit 15% down from their November 2021 peak, according to the Reserve Bank house prices in New Zealand will no longer be unsustainable and representing a threat to the financial system. We will be able to run a headline reading this “Reserve Bank feels house prices are now sustainable”. We are 5.5% away from official endorsement of NZ house prices.
But the tendrils are indicating things becoming less bad underneath the headlines of prices falling. Prices have further to go down, but the endgame for this period of price decline is approaching. My suspicion is that when the turn comes it could be quite sudden because of this economic cycle’s unique labour market strength.
Page | 6
If I were a borrower, what would I do? Nothing I write here or anywhere else in this publication is intended to be personal advice. You should discuss your financing options with a professional.
Recession worries dominating The big statistics piece for NZ this week was the labour market report yesterday and it showed that there has been no jobs growth in our economy for three quarters. But that is not because demand is weak – it is lack of supply of people. However, the unemployment rate rose from 3.2% to 3.3% to be where it was three quarters back.
These numbers are weaker than expected and they are the things which eventually influence wages growth. In that regard the wage growth data which eventually will feed through into more inflation would had to have been very strong to cause a new bout of the heeby jeebies in the financial markets.
The case is not able to be made that wages growth is excessive and a special threat to inflation – keeping in mind that wages growth lags the state of the labour market by some distance. So, we cannot look at the data and say there is no inflation risk. There is, and that is one reason why the Reserve Bank will take the official cash rate from 2.5% to a probable peak this cycle of 3.5%. In fact, the much-watched alternative private sector wages inflation gauge from the Quarterly Employment survey rose to an annual growth rate of 7% in the June quarter from 5.3% in the March quarter. This is above the peak rate of increase ahead of the GFC of 5.6% and more than enough to make the Reserve Bank continue to try and get the unemployment rate up.
But they weren’t. The experimental Labour Cost Index measure which I track did increase in the quarter to an annual growth rate of 5.1% from 4.8% in the March quarter and 3.4% a year ago. Wages growth has definitely accelerated. But this quarter’s 1.4% rise was about the same as 1.3% last quarter, giving an annualised pace of just over 5.5% which was the peak ahead of the GFC. In Australia this week the central bank raised its cash rate by 0.5% for the third month in a row. But they mentioned that future rises would be data dependent and that was a new piece of
Page | 7
information not seen before recently in their accompanying statements. Because of that the markets across the Tasman have pared back their expectations for monetary policy tightening there. The same thing has been happening in an on and off again fashion in the United States. The net result has been that the benchmark US ten year government bond yield has ended the past week near 2.74% compared with 2.77% last week and a peak of about 3.4% in mid-June. It is back in June that bank wholesale borrowing costs peaked in New Zealand and since then rates have fallen away about 0.9% or so. This has caused banks to start paring back their fixed mortgage rates slightly – with more to come once they pull back from the attempts to win business with expensive cashback deals.
In response to these declines in funding costs banks have started to cut their fixed lending rates.
The two year swap rate at which NZ banks borrow funds to lend to you and I at a fixed rate for two years has fallen to 3.69% from 3.95% last week and a peak near 4.5% in the middle of June. The five year swap rate has fallen to near 3.46% from 3.72% last week and a mid-June peak also near 4.5%.
My current expectation for the one-year fixed mortgage rate in August each year is shown in the first column of the table below. I focus on that rate because there are many people who have fixed one-year repeatedly since 2009 and the strategy has worked very well. The second column shows what the one-year rate will average over the next 2-, 3-, 4-, and 5year periods. The last column shows the current
Page | 8
If I were a borrower, what would I do?
best 2 – 5 year fixed rates charged by the lenders I track.
2022 2023 2024 2025 2026
Forecast Rolling 1 year average rate rates 4.95 5.75 5.35 4.75 5.15 4.25 4.93 4.00 4.74
Current fixed averages 4.95 5.39 5.69 6.05 6.19
1 yr 2 yr 3 yr 4 yr 5 yr
I would fix one year. To see the interest rates currently charged by major lenders go to www.mortgages.co.nz
If these forecasts prove correct (I’d give that a 10% probability), rolling one-year fixed will deliver an average rate for the next two years of 5.35%, three years 5.15%, four years 4.93%, and five years 4.74%.
Page | 9
Links to publications Tony’s
View
Spending
Plans
Survey
Tony’s View Business Survey
mortgages.co.nz & Tony Mortgage Advisors Survey
Alexander
Tony Alexander Regional Property Report
Tony’s Thoughts Vlog Crockers & Tony Alexander Investor Insights REINZ & Tony Alexander Real Estate Survey Investing Insights
Oneroof weekly column Handling high interest rates Handling staff shortages Handling high cost of living To enquire about advertising in or sponsorship of Tony Alexander publications email me at tony@tonyalexander.nz This publication has been provided for general information only. Although every effort has been made to ensure this publication is accurate the contents should not be relied upon or used as a basis for entering into any products described in this publication. To the extent that any information or recommendations in this publication constitute financial advice, they do not take into account any person’s particular financial situation or goals. We strongly recommend readers seek independent legal/financial advice prior to acting in relation to any of the matters discussed in this publication. No person involved in this publication accepts any liability for any loss or damage whatsoever which may directly or indirectly result from any advice, opinion, information, representation, or omission, whether negligent or otherwise, contained in this publication.