20 minute read
From Building Simulation Software to Ontology Language: Using a Calibrated HVAC Model as the Core of a Digital Twin Platform


Adalberto Guerra Cabrera1 , Graham Darroch2 and Dereje Workie3
Research and Development Integrated Environmental Solutions Limited, Glasgow, United Kingdom E-mail: 1adalberto.cabrera@iesve.com 2graham.darroch@iesve.com 3dereje.workie@iesve.com
Advertisement
Integrated analytics and control applications, such as monitoring-based commissioning, Automated Fault Detection and Diagnostics (AFDD), Predictive Maintenance (PdM), Measurement and Verification (M&V), operational optimisation and demand response, can benefit from the use of building energy simulation (BES) models as virtual testbeds for the evaluation of control strategies and improved energy performance assessments. Hence, the ideal Digital Twin Platform (DTP) solution should enable cross-domain information exchange between virtual and physical assets. However, no solution aiming to integrate a BES model using a standardised convention was found.
This paper introduces a Python-based tool that maps the components and variables contained in the Apache Data Model (ADM) to BRICK entities and relationships. The script allows an IES-VE model to be exported as a BRICK model, giving applications access to simulated variables with the same query language as the one used in their existing domains. Two examples where IES-VE models with various systems, equipment and variables being exported as BRICK models are presented. Future research considers a similar solution for other ontology languages such as Project Haystack and RealEstateCore.
Keywords BRICK, IES-VE, Ontology, Standard, Project Haystack, Smart Buildings.
I INTRODUCTION In 2017, building stock accounted for 36% of the energy used globally and was responsible for 39% of the total CO2 emissions [1]. In the UK, buildingrelated industries accounted for 20% of the total annual greenhouse gas emissions in 2018 [2]. The country has set the goal of achieving an 80% reduction in greenhouse gas (GHG) emissions by 2050 against a 1990 baseline [3]. It has been shownthat adequate hardware across the building, including submetering, sensors, actuators, and integrated analytics and control software, can save energy by influencing user behaviour, operations optimisation and uncovering inefficiencies onlydetected when combining multiple data sources [4]. Lawrence Berkeley National Laboratory (LBNL) documented energy analytics enabled primary energy savings ranging from 12 to 30% [5]. Analytics solutions include monitoring-based commissioning [6], Automated Fault Detection and Diagnostics (AFDD) [7], Predictive Maintenance (PdM)[8], Measurement and Verification (M&V)[9], operational optimisation, demand response electricity supply [10], among others. Building energy simulation (BES) can support these analytics-based solutions through baseline modelling for energy-saving estimations in M&V [9], enabling quantitative model-based AFFD [7], and model-based PdM [8]. Additionally, building energy simulation can be used as a virtual testbed for the evaluation of individual [11] and grid [12] level operational optimisation and demand response strategies. Finally, research shows that cross-domain information, e.g. the integration of simulated and metered datasets, is essential for building energy performance assessment [13]. Hence, there is a growing effort for seamlessly integrating building simulated data into the analytics domain. These solutions can be packaged into Digital
Twin Platform (DTP) solutions which can be cloudbased, e.g. Azure Digital Twins [14] or edge-based, e.g. Volttron [15]. In order to support a cost-effective real-world and virtual assets integration, it is necessary to ensure that physical and virtual assets have a similar vocabulary and structure, e.g. that all Building Management System (BMS) points have a corresponding model variable. It was identified that there was a lack of research in this field, as a result, this paper explores a solution for translating building energy simulation model variables to an ontology language typically used for classifying BMS points, heating, ventilation, and air conditioning (HVAC) equipment and spaces within a building. The following section briefly describes the Apache Data Model (ADM)architecture, followed by an overview of standard ontologies. The proposed solution is to export a subset of theADM variables as a standard ontology model andpresentstwo examples of IES-VE models that were exported as BRICK models. Finally, a conclusion of the approach is discussed in conjunction with the future research directions.
II APACHE DATA MODEL The IES-VE is a BES software composed of several modules intended for advanced analysis. These modules support geometry creation, profile modulation management, natural ventilation assessments, solar radiation analysis, thermal templates and HVAC network modelling. Altogether, provide a holistic overview of the performance of a virtual building. When an IES-VE model of an actual building asset includes accurate information about the geometry, actual building fabric properties, real internal gains, a HVAC network that reflects the actual systems - with the error between simulated and measured data being minimised, and its uncertainty being acceptable - we say that it has been calibrated. The IES-VE software allows users to export all the information from a model into an Apache data model (ADM) file. The ADM contains information required to run a simulation and has been conceived for co-simulation with third-party integrations via a Python-based library. Figure 1 shows the information contained in the ADM.
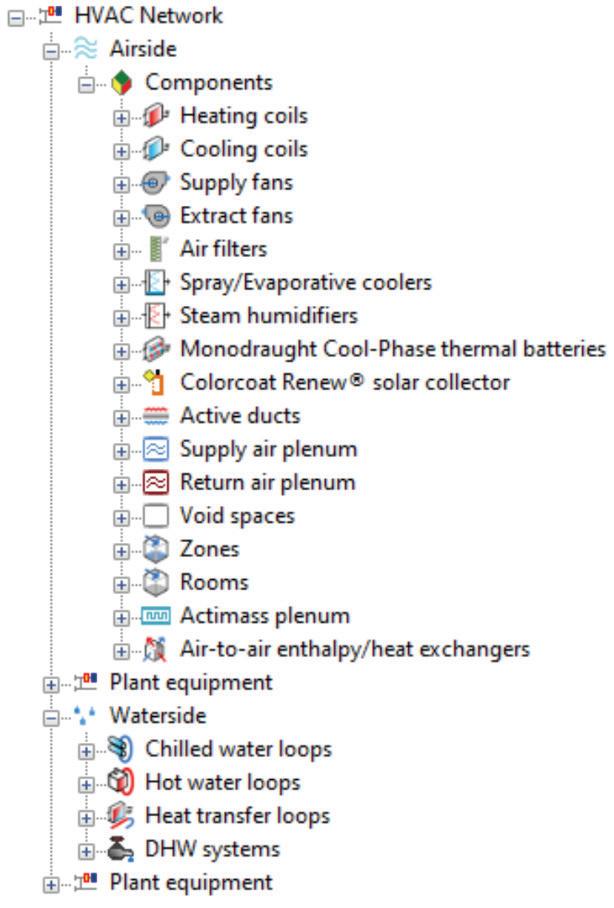
Fig. 1: The ADM contains critical simulation information contained in the IES-VE model. The HVAC network is modelled using components (coils, heat sources, water loops, etc.) linked to variables (temperature, airflow, modulation, etc.) and HVAC zones through well-defined relationships.At a high level, components are divided into airside, waterside and plant equipment. Figure 2 shows the sub-categories of components for each category.
Fig. 2: The HVAC network architecture in the ADM. Building spaces can be conditioned or unconditioned, where a group of conditioned spaces is known as a “HVAC zone”. Each room and component contain a comprehensive set of variables available upon request before starting the cosimulation job. Model variables are classified into read and write. Read variables are outputs from the simulation, and examples are air temperature, relative humidity, comfort metrics, heating and cooling loads, and CO2 concentration. On the other hand, write variables include internal gains breakdown, number of people, setpoints, and HVAC controller variables.
III STANDARD ONTOLOGIES During the design, construction and commissioning stages of the building life-cycle, a Building Information Model (BIM) focuses on the 3D aspect of the building assets enabling functionality like clash detection, 3D visualisation, and gamification, among other benefits. Examples of formats in this category include the Industry Foundation Class (IFC) and
green building XML (gbXML). However, Structured BIM formats lack descriptions of how the constituent equipment and points work together, have limited query mechanisms and cannot be extended by users. These drawbacks restrict their use during the operations, maintenance and audit stages of the building life-cycle. Recent literature reviews and surveys from the industry show that, during the operational phase, each asset-building represents a unique challenge in terms of available data, business model, goals, type of building assets and budget. Unstructured (schemaless) models are more suitable due to their flexibility, ability to describe relationships across components of any nature and the possibility of data integration. Figure 3 shows a building metadata life-cycle and the commonly used open BIM formats for each stage.
Fig. 3: Building metadata life-cycle and standard ontologies commonly used. Adapted from [16]. Standard ontologies have emerged to promote the implementation of a single vocabulary and access to multiple sources of data. In general, an ontology ensures that any application can interact with any equipment and device without having to deal directly with their underlying communication protocol, e.g. BACnet [17], LonWorks [18], Modbus [19], Niagara [20], web APIs, etc.; or the physical location of the data source, e.g. cloud or edge platforms.
The ideal ontology should have the following characteristics:
• Represents “things” in buildings. A “thing” could be a physical, virtual or logical asset.
• Represents relationships between things.
• Extensible classification of things.
• Portability and consistency.
• Relationships and classifications should be generalisable to new situations.
• Support implementing advanced control and analytics applications (FDD, supervisory control, energy optimisation, etc.).
• Includes actors relevant for the business model.
There is a growing number of standardised schemes. Notable tagging schemes include BASont [21], Smart Appliances Reference (SAREF) [22] and RealEstateCore (REC) [23]. Full building ontologies examples are Project Haystack [24], BRICK schema [25], ASHRAE Standard 223P [26] and Quantum ontology [27]. In addition, Microsoft introduced the Digital Twin Developer Language (DTDL) for Azure Digital Twins [28]. Despite DTDL not being an ontology itself, it is capable of adapting to an existing one. Documentation for importing from IFC, REC and BRICK models is available [29]. Using a standard ontology model as the core for data integration alongside analytics and visualisation is a recommended practice for Digital Twin Platform (DTP) as it allows holistic system integration, enabling what we know as a Smart Building. The following section briefly presents the main characteristics of each of the full ontologies that are already available for public use.

a) RealEstateCore (REC)
Developed by Real Estate companies from Northern Europe in 2019, REC is an OWL 2 Web Ontology Language for smart buildings integration. It describes buildings using the BuildingStructure, BuildingStructureComponent, VirtualComponent, Premises, StoreyLevel and Room entities and describes HVAC components and point using the Device, Sensor and Actuator entities. REC introduces the concept of Agents, where people, organisations, groups, and any stakeholder related to the buildings’ assets can be included as part of the model. Also, the VirtualComponent is an entity that can be used to identify a simulated variable. REC features modularity, highly customisable and free to use under the MIT license. REC allows imports from existing IFC and BRICK models.
b) Project Haystack V4
Project Haystack was developed by industry actors in 2014. Haystack uses a series of tags (individual or composite) to describe entities, relationships, and hierarchies. Haystack tags can be categorised in markers (e.g. zone, temp, sensor), value (date:2018-01-01), and reference (e.g. id:HC00001). The relationship between tags isexpressed using special reference tags that link a point to a piece of equipment (equipRef), to a specific space (spaceRef), equipment to a site (siteRef), and a site to a weather station (weatherStationRef), among many others. Haystack is considered a flexible and humaninterpretable ontology, however it is a limited machine-readable format [30].
c) BRICK Schema
BRICK is specialised in technical assets such as systems (HVAC, lighting safety, electrical, gas), building locations (spaces, floors, outdoors), points
(sensor, command, setpoints, status) and the relationships between them. BRICK takes advantage of the Resource Description Framework (RDF). The schema is based on triplets with descriptive tags using the subject-predicate-object RDF standard. A triplet can describe a point, equipment, location or resource. BRICKentities are organised in classes with expected tags and relationships. Tags are derived from the entities, and they can be combined to create higher-level entities, e.g. all entities with the tag: Air, tag: Temperature, tag: Sensor and tag: Point will be instantiated as members of the brick: Air_Temperature_Sensor class. The relationships between entities are specified as isLocationOf, controls, hasPart, hasPoint, and feeds. Inverse relationships, tags and tagsets are also includedand can be generated automatically using the provided BRICK schema package [31]. A BRICK model can be deployed in a BRICK server linked to an RDF database and queried using the “SPARQL” language. It is also possible to embed within the model entity (e.g. a sensor) a pointer to the location of historic time-series data using unique IDs of the sensor. Similarly, BACnet object IDs can be used to access current BMS values in the BMS controllers. Bespoke specifications on how to read and write data from data sources can be included in a BRICK server in the form of connectors, i.e. protocol specifications. Hence, queries across all buildings in a portfolio become possible. For example:
• List all fan coils currently on.
• List all spaces that have no occupants and are being supplied with external fresh air.
Documented drawbacks of the BRICK schema are the limited ability to create custom tags and relationships and the relatively high effort to create the BRICK models in the first place [30]. The following section documents the steps to enable the export of an IES-VE model in the form of an ADM file which is then exported as a BRICK model. We chose the BRICK schema due to the amount of available documentation and tools online. However, the conversion approach should be applicable to other full building ontologies, specially REC and Project Haystack.
IV PROPOSED SOLUTION The solution in this work assumes that knowledge embedded in any IES-VE calibrated model can be used to create a BRICK model with zero or minimal intervention. The benefits of this solution are that:
• It enables access to read and write model variables with queries, effectively turning the calibrated model into a virtual testbed. • For new buildings, it provides the initial
BRICK model that can be used as reference for the tagging of the real assets (e.g. equipment and points), reducing its adoption barriers and making the process less error-prone and more efficient.
Figure 4 shows a sample architecture that integrates real and virtual assets in the context of a simple Digital Twin Platform (DTP). Elements in blue show the features required to achieve the model export: (1) a points list of model variables that are relevant for the applications, (2) a calibrated model in the form of ADM and (3) Apache to BRICK script. Notice that it is possible to export all variables from the ADM; however, we prefer to avoid the export of model variables that are not relevant. Besides, it is more often the case that a subset of variables, and not all of them, are relevant for any given scenario.
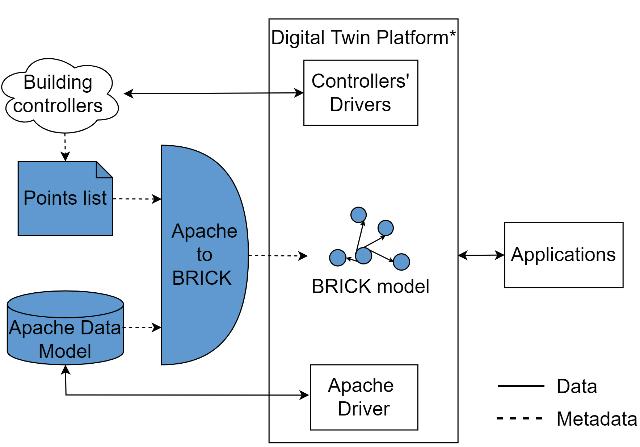
Fig. 4: Apache to BRICK solution architecture. Elements in blue show the elements required to achieve the model export. As described in the diagram, the Apache to BRICK script uses the knowledge from the ADM to map the points lists using BRICK identities. The current version uses BRICK ontology version 1.0.3. The script is written in Python, as the support libraries for BRICK and the ADM are available in this language. In the following subsection, examples of the mapping for components, equipment and relationships are presented.
a) Components
In the ADM, components are represented with a combination of two to four letters followed by six digits, creating unique IDs e.g. HC000001. The letters represent the type of component, e.g. HC is a heating coil, which in BRICK is defined as a Heating_Coil. Table 1 shows more examples of component mapping between ADM and BRICK.
Table 1: Examples of Apache to BRICK component
Component ID BRICK equipment
HC****** Heating_Coil
CC****** Cooling_Coil
SF****** Supply_Fan
HWDL****** Hot_Water_System
PR****** AHU
CD****** Condenser
IN****** Outside_Air_Damper A HVAC component in the ADM is called “multiplex”, it does not have a BRICK equivalent. A multiplex does not represent any physical component, it is used to group components that are part of a single HVAC zone. However, we use the multiplex information to assign the subset list of components that feed each HVAC zone.
b) Points
The ADM has a list of more than 1,200 read variables and several write variables. These were mapped to their closest BRICK point equivalent. Table 2 shows an example of the point mapping.
Table 2: Example of Apache variables to BRICK points
Apache Variable BRICK point
airTemperature Room_Temperature_Sens or roomCO2Concentration CO2_Sensor Fig. 5: Relationships map between Apache HVAC and BRICK relationships. V CASE STUDIES Two case studies are presented in this example. One is a simple two-room model with a simple HVAC network and the second example corresponds to a calibrated model of an office building located in France.

a) Simple Two-room Model
The model contains a HVAC system with an air handling unit (AHU) with constant air volume (CAV) feeding two HVAC zones with terminal reheat coils. Figure 6 shows the simple geometry of the model and Figure 7 is a graphic representation of the HVAC model in the IES-VE software. The model is then exported as an ADM file.
boilersLeavingTempera ture boilersEnteringTempera ture

primaryTargetSupplyTe mperature Leaving_Water_Temperat ure_Sensor Entering_Water_Temperat ure_Sensor Supply_Water_Temperatu re_Setpoint
It is worth mentioning that not all variables have a BRICK point equivalent, and they have to be expressed as custom entities. An example is a COP (efficiency) variable, available in various components that exchange heat from the water to air substances.
c) Relationships
Finally, relationships between spaces, air side, water side, and plant equipment components are represented as described in Figure 5.
Fig. 6: Simple two-room case study.
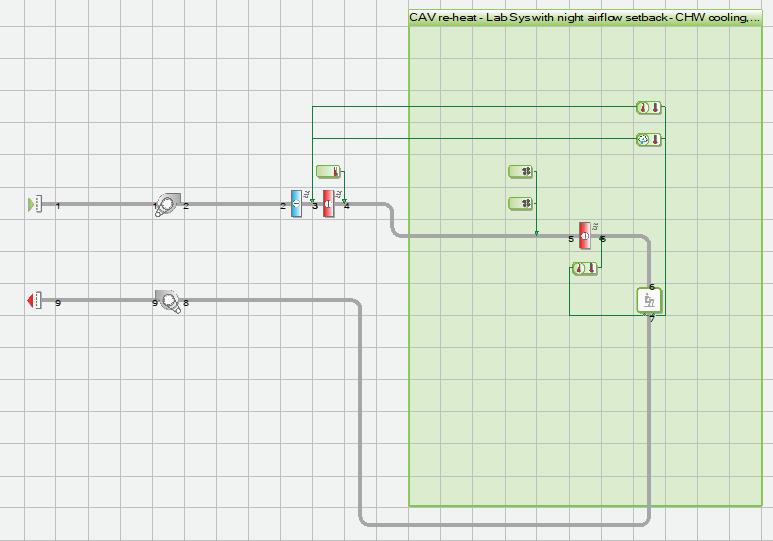
Fig. 7: The Airside HVAC network of the simple tworoom model. The list of points includes the variables described in Table 3. Only variables from the Space and Air side are selected for simplicity.
Table 3: Point list of the two-zone model
Level ID Variable
HVAC Component
HVAC Component
HVAC Component SF000330 airflow power EF001301 airflow power HC002832 sensibleLoad
HVAC Component CC000780 totalLoad
Space RM000000
numberOfPeople roomCO2Concentration airTemperature lightingGain Using the Apache to BRICK script, the resulting model is presented in Figure 8.

Fig. 8: BRICK network of the simple two-room model. After the model is expanded, e.g. inverse relationships and tags are automatically added, the model is ready for queries directly from any application able to execute SPARQL queries. Figure 9 shows an example of a query that links the number of people in a given space (in reality, it would be a motion sensor) with the AHU supply fans that feed this space.
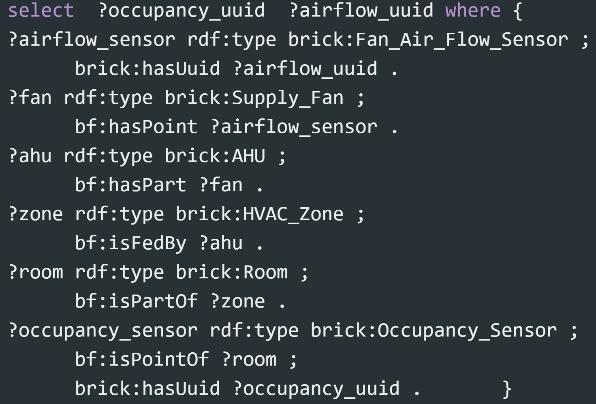
Fig. 9: SPARQL query example. An unoccupied space that is being fed with fresh air representsan energy-saving opportunity.Figure 10 shows an example of a plot that uses the result of the previous query to highlight energy saving opportunities in the IES-VE model. The query would be identical in the real building, provided that the IESVE model represents the actual building.

Fig. 10: Example plot from variables resulted from a query.
b) Complex Office Building Model
An IES-VE model representing an office building in France was tested. The model has 1120 rooms and 1974 HVAC components across 45 systems. A highlevel view of the air side network is displayed in Figure 11. 120 variables from the air side and room level were deemed as relevant. The resulting BRICK model is presented in Figure 12. Notice that the network has been extended to cover the inverse relationships.
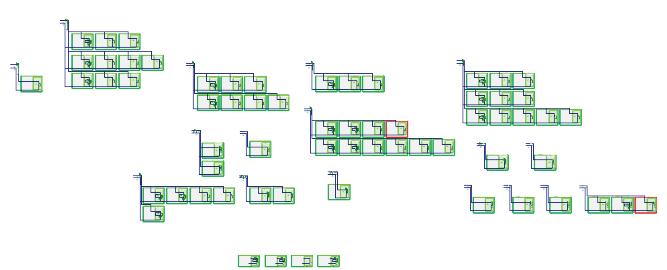
Fig. 11: Air side HVAC network in the IES-VE model.

Fig. 12: Air side BRICK network of the office building model. VICONCLUSIONS This paper introduces a script that exports an IES-VE model in the form of an Apache Data Model into a BRICK model with no intervention. We identified only two instances of variables with no direct mapping between the Apache and BRICK ontologies, suggesting that the process can be achieved with minimal supervision.
Two model examples are provided; one is a simple two-space building with a simple AHU. We also show a sample query for fault detection using simulated data. A second example is a complex office building in France. In the future, a similar approach for other ontology languages, such as Project Haystack and RealEstatecore, will be explored.
VIIACKNOWLEDGEMENTS This paper has received funding from the Innovate UK funded project eDigiT2Life. We thank Patrick Beguery and his team at Schneider Electric in Grenoble for providing the IES-VE model for the case study.Also, we thank Ricardo Filho and Erin O’Brien for reviewing this work.
REFERENCES [1] International Energy Agency and the United Nations Environment Programme, “2018 Global Status Report -Towards a zero-emission, efficient and resilient buildings and construction sector,” International Energy Agency (IEA) for the Global Alliance for Buildings and Construction (GlobalABC), 2018. Accessed: Jul. 03, 2021. [Online]. Available: https://www.worldgbc.org/news-media/2018global-status-report-towards-zero-emissionefficient-and-resilient-buildings-and
[2] Office for National Statistics, “Atmospheric emissions: greenhouse gases by industry and gas - Office for National Statistics.” https://www.ons.gov.uk/economy/environment alaccounts/datasets/ukenvironmentalaccountsat mosphericemissionsgreenhousegasemissionsby economicsectorandgasunitedkingdom (accessed Jul. 03, 2021).
[3] The Institute for Government, “The Climate Change Act (2008),” United Kingdom, 2010. Accessed: Jul. 03, 2021. [Online]. Available: https://www.instituteforgovernment.org.uk/sites /default/files/climate_change_act.pdf
[4] Z. (John) Zhai and A. Salazar, “Assessing the implications of submetering with energy analytics to building energy savings,” Energy Built Environ., vol. 1, no. 1, pp. 27–35, Jan. 2020, doi: 10.1016/j.enbenv.2019.08.002.
[5] J. Granderson, “Building Energy Information Systems: State of the Technology and User Case Studies,” p. 86.
[6] E. Mills, “Monitoring Based Commissioning: Benchmarking Analysis of 24 UC/CSU/IOU Projects,” Jul. 2009, Accessed: Jul. 03, 2021. [Online]. Available: https://escholarship.org/uc/item/06t5w9mg
[7] W. Kim and S. Katipamula, “A review of fault detection and diagnostics methods for building systems,” Sci. Technol. Built Environ., vol. 24, no. 1, pp. 3–21, Jan. 2018, doi: 10.1080/23744731.2017.1318008.
[8] N. Cauchi, K. Macek, and A. Abate, “Modelbased predictive maintenance in building automation systems with user discomfort,” Energy, vol. 138, pp. 306–315, Nov. 2017, doi: 10.1016/j.energy.2017.07.104.
[9] M.-T. Ke, C.-H. Yeh, and J.-T. Jian, “Analysis of building energy consumption parameters and energy savings measurement and verification by applying eQUEST software,” Energy Build., vol. 61, pp. 100–107, Jun. 2013, doi: 10.1016/j.enbuild.2013.02.012.
[10] S. Zhou, Z. Wu, J. Li, and X. Zhang, “Real-time Energy Control Approach for Smart Home Energy Management System,” Electr. Power Compon. Syst., vol. 42, no. 3–4, pp. 315–326, Mar. 2014, doi: 10.1080/15325008.2013.862322.
[11] C. D. Corbin et al., “Transactive Control of Commercial Building HVAC Systems,” PNNL-26083, 1406830, Dec. 2016. doi: 10.2172/1406830.
[12] K. Orehounig, R. Evins, and V. Dorer, “Integration of decentralized energy systems in neighbourhoods using the energy hub approach,” Appl. Energy, vol. 154, pp. 277–289,
Sep.
2015, 10.1016/j.apenergy.2015.04.114. doi:
[13] S. Hu, J. Wang, C. Hoare, Y. Li, P. Pauwels, and J. O’Donnell, “Building energy performance assessment using linked data and cross-domain semantic reasoning,” Autom. Constr., vol. 124, p. 103580, Apr. 2021, doi: 10.1016/j.autcon.2021.103580.
[14] Microsoft Corporation, “Azure Digital Twins Documentation - Tutorials, API Reference.” https://docs.microsoft.com/en-us/azure/digitaltwins/ (accessed Jul. 03, 2021).
[15] S. Katipamula, J. Haack, G. Hernandez, B. Akyol, and J. Hagerman, “VOLTTRON: An Open-Source Software Platform of the Future,” IEEE Electrification Mag., vol. 4, no. 4, pp. 15–22, Dec. 2016, doi: 10.1109/MELE.2016.2614178.
[16] G. Fierro et al., “Interactive Metadata Integration with Brick,” in Proceedings of the 7th ACM International Conference on Systems for Energy-Efficient Buildings, Cities, and Transportation, Virtual Event Japan, Nov. 2020, pp. 344–345. doi: 10.1145/3408308.3431125.
[17] The American Society of Heating, Refrigerating and Air-Conditioning Engineers, “Standard 135-2020 -- BACnet -- A Data Communication Protocol for Building Automation and Control Networks (ANSI Approved),” 2020, Accessed: Jul. 01, 2021. [Online]. Available: https://www.techstreet.com/ashrae/standards/as hrae-135-2020?product_id=2191852
[18] Echelon Corporation, “Introduction to the LonWorks Platform,” p. 98, 2009.
[19] Modbus Organization, “Modbus Specifications and Implementation Guides.” https://www.modbus.org/specs.php (accessed Jul. 01, 2021).
[20] Tridium, Inc, “Networking and IT Guide,” 2006. https://docplayer.net/17972259-Technicaldocument-niagara-ax-networking-and-it-guideoctober-9-2006.html (accessed Jul. 01, 2021).
[21] J. Ploennigs, B. Hensel, H. Dibowski, and K. Kabitzsch, “BASont - A modular, adaptive building automation system ontology,” in IECON 2012 -38th Annual Conference on IEEE Industrial Electronics Society, Oct. 2012, pp. 4827–4833. doi: 10.1109/IECON.2012.6389583.
[22] F. T. H. den Hartog, L. M. Daniele, and J. B. M. Roes, “Study on Semantic Assets for Smart Appliances Interoperability : D-S1: FIRST INTERIM REPORT,” 2014, Accessed: Jul. 01, 2021. [Online]. Available: https://repository.tno.nl/islandora/object/uuid% 3A4b094d36-a2d1-4f2f-bef1-0034711e9d8c
[23] K. Hammar, E. O. Wallin, P. Karlberg, and D. Hälleberg, “The RealEstateCore Ontology,” in The Semantic Web – ISWC 2019, vol. 11779, C. Ghidini, O. Hartig, M. Maleshkova, V. Svátek, I. Cruz, A. Hogan, J. Song, M. Lefrançois, and F. Gandon, Eds. Cham: Springer International Publishing, 2019, pp. 130–145. doi: 10.1007/978-3-030-30796-7_9.
[24] J. J. “Jack” M. Gowan, “Project Haystack Data Standards,” in Energy and Analytics, River Publishers, 2015.
[25] G. Fierro et al., “Formalizing Tag-Based Metadata With the Brick Ontology,” Front. Built Environ., vol. 6, p. 558034, Sep. 2020, doi: 10.3389/fbuil.2020.558034.
[26] “ASHRAE’s BACnet Committee, Project Haystack and Brick Schema Collaborating to Provide Unified Data Semantic Modeling Solution | ashrae.org.” https://www.ashrae.org/about/news/2018/ashra e-s-bacnet-committee-project-haystack-andbrick-schema-collaborating-to-provide-unifieddata-semantic-modeling-solution (accessed Jun. 30, 2021).
[27] “Quantum: The Digital Twin Standard for Buildings.” http://www.automatedbuildings.com/news/feb2 1/articles/passivelogic/210127124501passivelo gic.html (accessed Jun. 30, 2021).
[28] Azure/opendigitaltwins-dtdl. Microsoft Azure, 2021. Accessed: Jan. 03, 2021. [Online]. Available: https://github.com/Azure/opendigitaltwins-dtdl
[29] Microsoft Corporation, “Converting ontologies - Azure Digital Twins.” https://docs.microsoft.com/en-us/azure/digitaltwins/concepts-ontologies-convert (accessed Jul. 01, 2021).
[30] S. Mishra et al., “Unified architecture for datadriven metadata tagging of building automation systems,” Autom. Constr., vol. 120, p. 103411, Dec. 2020, doi: 10.1016/j.autcon.2020.103411.
[31] “brickschema package — brickschema documentation.” https://brickschema.readthedocs.io/en/latest/so urce/brickschema.html (accessed Jul. 01, 2021).


