Madagascar Protected Area Outlook 2024

A Conservation Assessment of Terrestrial Protected Areas in Madagascar
The views expressed in this publication do not necessarily reflect those of each or any participating Madagascar Protected Area consortium partner, author, or editor.
The Madagascar Protected Area consortium partners and authors are pleased to acknowledge the support of Conservation Allies who provided technical support and organized the “Protected Areas in Peril Forum” from July 1–5, 2024 that helped guide and produce this publication.
Published by: Madagascar Protected Area consortium partners, Antananarivo, Madagascar.
Authors: Madagascar Protected Area Consortium Partners composed of: Fondation pour les Aires Protégées et la Biodiversité de Madagascar (FAPBM), Ministère de l’Environnement et du Développement Durable (MEDD), Madagascar National Parks (MNP), Antrema Miray (AMI), ASITY Madagascar, Association Analasoa, Association FAMELONA, Association Fanamby, Association Fosa, Association MIARO, Association Mitsinjo, Association TAMIA, Association VIHY, Centre Universitaire Régional de la SAVA (CURSA), Direction Régionale de l’Environnement et du Développement Durable Atsimo-Andrefana, Association Environnementale pour la Recherche, l’Éducation, la Conservation et le Développement Durable (E-RECODEV), Fikambanana Bongolava Maitso (FBM), Groupe d’Etude et de Recherche sur les Primates de Madagascar (GERP), Lemur Conservation Foundadtion (LCF), IMPACT Madagascar, Madagascar Biodiversity Partnership (MBP), Madagascar Wildlife Conservation (MWC), Madagasikara Voakajy (MAVOA), Ny Tanintsika, Planet Madagascar, Razan’ny Vohibola, SADABE, University of Antananarivo Plant Biology and Ecology (MBEV), and VOI Tahindraha.
Editors: Solofo Rakotoarisoa, Tombo Casimir Aly, Aubin Andriajaona, Rostant Andriamalala, Tiana Andriamanana, Solonantenaina Andriamparany, Jean Hervé Bakarizafy, Rodriguez Tertius Belalahy, Angélique Razafindrazoary Decampe, Emeline, Hortensia Bezara Hosnah, Cyprien Miandrimananana, Christain Nasoavina, Edgar Rabevao, Narcisse Rahajanirina, Liva Raharijaona, Marco Raherison, Manitra Rajaonarison, Andriamihaja Rado Rakotondrabe, Mahefatiana Ralisata, Faly Nambinina Ranaivoarisoa, Voahirana Randriamamonjy, Randriamialisoa, Jean Claude Raniaina, Faly Harisoa Rasoanaivo, Charles Rasolondravoavy, Bako Harisoa Ravaomanalina, Mialisoa Lucile Raveloarimalala, Julie Hanta Razafimanahaka, Soary Tahafe, Angelo Tianarifidy, Alain Mario Tony, and Jorlin Tsaralaza Tsiavahananahary.
Copyright: © 2024 Madagascar Protected Area Consortium Partners
Reproduction of this publication for educational or other non-commercial purposes is authorized without prior written permission provided the source is fully Acknowledged.
Citation: Rakotoarisoa, S., Aly, T.C., Andriajaona, A., Andriamalala, R., Andriamanana, T., Andriamparany, S., Bakarizafy, J.H., Belalahy, R.T., Decampe, A.R., Emeline, Hosnah, H.B., Miandrimananana, C., Nasoavina, C., Rabevao, E., Rahajanirina, N., Raharijaona, L., Raherison, M., Rajaonarison, M., Rakotondrabe, A.R., Ralisata, M., Ranaivoarisoa, F.N., Randriamamonjy, V., Randriamialisoa, Raniaina, J.C., Rasoanaivo, F.H., Rasolondravoavy, C., Ravaomanalina, B.H., Raveloarimalala, M.L., Razafimanahaka, J.H., Tahafe, S., Tianarifidy, A., Tony, A.M., and Tsiavahananahary, J.T., eds. (2024). Madagascar Protected Area Outlook 2024: A conservation assessment of terrestrial Protected Areas in Madagascar. Antananarivo, Madagascar. 72 pp.
ISBN-13: 978-0-982761 -4
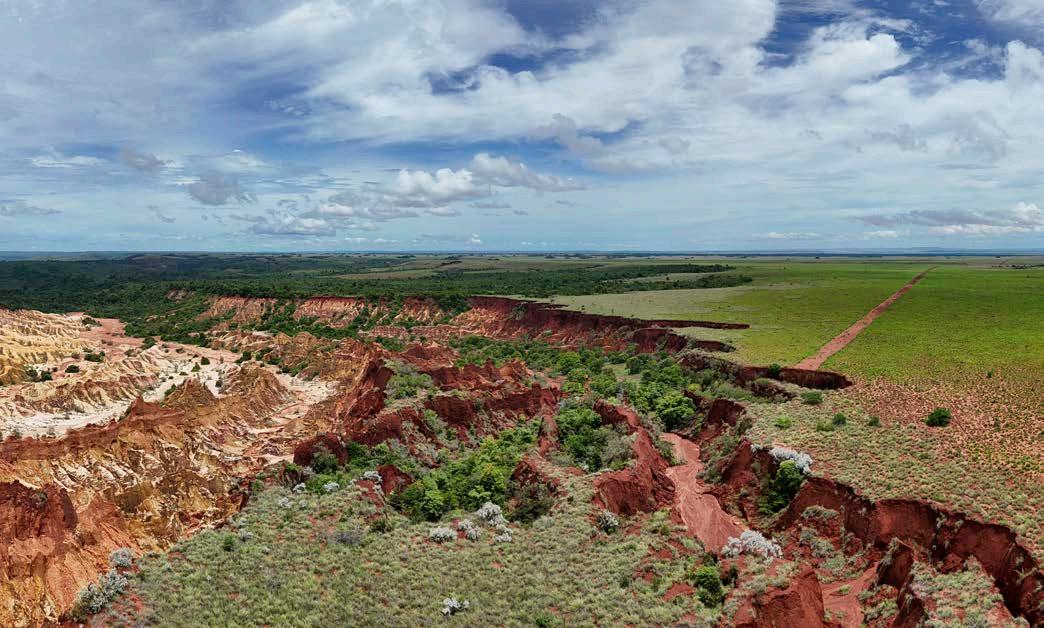
Cover photo: © Conservation Allies
Layout by: Staci Weber
Printed by: Fondation pour les Aires Protégées et la Biodiversité de Madagascar (FAPBM)
Email: mail@fapbm.org or solofo@conservationallies.org
Website: www.fapbm.org
This publication has been made possible by funding from Conservation Allies and Fondation pour les Aires Protégées et la Biodiversité de Madagascar.


Executive Summary
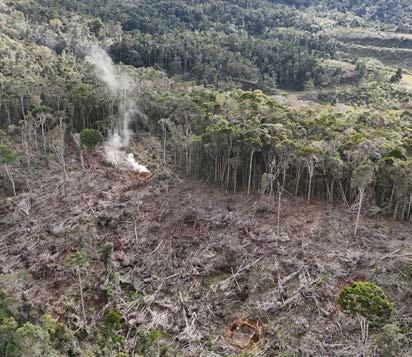
This report is the first of its kind in Madagascar and presents a detailed analysis of the loss of forest cover across all terrestrial Protected Areas in the country.
Forest cover loss is the most important indicator of the effectiveness of management, as well as potential threats and endangerment of Protected Areas in Madagascar at a time when the international community seeks to reduce deforestation, mitigate climate change, and meet global biodiversity targets.
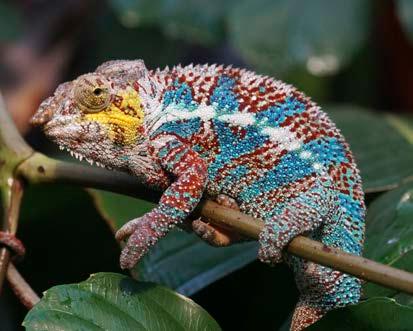
Although one of the poorest nations, Madagascar has the greatest concentration of biologically unique and endemic flora and fauna on Earth.
Having been isolated for 80+ million years, Madagascar’s biodiversity is truly
remarkable and represents a wildlife treasure for the planet.
Considering the extraordinary concentration of endemic species in Madagascar, the ability to conserve our Protected Areas is critical for global biodiversity and for the success of conservation more broadly across the tropics, where biodiversity matters most.
By focusing on the forest cover losses (or lack of) we can provide a comparable measure of protective effort effectiveness across all 109 terrestrial Protected Areas and thus rank their endangerment to prioritize areas in need of additional urgent protective actions.
We analyzed Global Forest Watch open-source forest loss data from 2001 to 2023 to assess and project deforestation impacts and trends across all terrestrial Protected Areas. Through an innovative approach of ranking forest cover loss during fiveyear periods and the last three years we were able to identify trends in changing forest cover and highlight conservation priorities.

Today, the 109 terrestrial Protected Areas analyzed in Madagascar cover 11.9 % (7 million hectares) of the country but, due to illegal deforestation, they have already lost almost half of their original forest cover as of 31 December 2023.
The surviving 3.48 million hectares of primary forest inside Protected Areas represent just 5.9% of the country —an area smaller than the size of Switzerland.

The results of this analysis helped establish a four-tier Protected Area threat classification system based on the projected survival of natural forest within each Protected Area in the short to long term, and so gauge urgency to instigate additional conservation actions:
CR Critically Endangered
All primary forests potentially lost within 10 years.
thirteen Protected areas are classified as Critically Endangered, having an extraordinary high rate of forest loss at over 2% a year across two decades, indicating that their intact primary forests will likely be entirely destroyed within 10 years. These 13 Protected Areas are in critical need of immediate conservation intervention as, on average, they have already lost over 70% of their original forest cover.
EN Endangered
All primary forests potentially lost within 25 years.
VU Vulnerable
All primary forests potentially lost within 40 years.
A further 17 Protected areas are classified as Endangered with a high probability of losing all primary forest within 25 years. These 17 Protected Areas have an average deforestation rate across two decades of 1 - <2% a year and have already lost over 50% of their original forest cover.
A further 19 Protected areas are classified as Vulnerable with increasing annual forest loss of 0.5-<1% a year. They are projected to lose all primary forest within 50 years and, on average, have already lost almost 50% of their original forest cover.
LC Least Concern
Stable and long-term manageable threats.
The ranking of average forest cover loss during 5-year periods since 2003 shows that 55% of Madagascar’s Protected Areas have stable or relatively low annual average forest losses , thus considered Least Concern, although they continue to require conservation efforts.
u nfortunately, 45% of Madagascar’s terrestrial Protected Areas are presently considered threatened with serious to extreme forest loss that impacts the survival of primary forests in the next 10–40 years.
More generally, total forest cover loss over the entire history of the Protected Areas has shown that 47% of Madagascar’s Protected Areas have already lost over 50% of their natural forest cover. Of these Protected Areas, 22 have lost >75% of their forest. As an example, the 168,541 hectare ranobe PK32 has lost 72% of its forest cover since being declared a Protected Area in 2007.
Overall, our assessment shows a concerning deterioration in forest cover inside Protected Areas from 2017 to 2023 as compared to
the prior 16 years. And the overall outlook for Madagascar’s Protected Areas in the coming years is deeply worrying.
We hope this Conservation Outlook will serve to inform international donors and conservation stakeholders that Madagascar’s unique and wonderful Protected Areas are in urgent need of additional, targeted support and that Malagasy conservation entities stand ready to collaborate and address threats.
The stakes for global biodiversity and avoiding extinction could not be greater than those facing Madagascar.

Résumé opérationnel
Ce rapport est le premier du genre à Madagascar et présente une analyse détaillée de la perte de couverture forestière dans toutes les aires protégées terrestres du pays.
La perte de couverture forestière est l’indicateur le plus important de l’efficacité de la gestion, ainsi que des menaces potentielles et de la mise en danger des aires protégées à Madagascar à un moment où la communauté internationale cherche à réduire la déforestation, à atténuer le changement climatique et à atteindre les objectifs mondiaux en matière de biodiversité.
Bien qu’étant l’un des pays les plus pauvres, Madagascar possède la plus grande concentration de flore et de faune endémiques et uniques sur le plan biologique sur Terre. Ayant été isolée pendant plus de 80 millions d’années, la biodiversité de Madagascar est vraiment remarquable et représente un trésor faunique pour la planète.
Compte tenu de l’extraordinaire concentration d’espèces endémiques à Madagascar, la capacité à conserver nos aires protégées est essentielle pour la biodiversité mondiale et pour le succès de la conservation plus largement dans les tropiques, où la biodiversité compte le plus.
En nous concentrant sur les pertes de couverture forestière (ou leur absence), nous pouvons fournir une mesure comparable de l’efficacité des efforts de protection dans les 109 aires protégées terrestres et ainsi classer leur catégorie de menace afin de prioriser les zones nécessitant des mesures de protection supplémentaires et urgentes.
Nous avons analysé les données open source de Global Forest Watch sur la perte de forêt de 2001 à 2023 pour évaluer et projeter les impacts et les tendances de la déforestation dans toutes les aires protégées terrestres. Grâce à une approche innovante de classement de la perte de couverture forestière sur des périodes de cinq (5) ans et au cours des trois (3) dernières années, nous avons pu identifier les tendances de l’évolution de la couverture forestière et mettre en évidence les priorités de conservation.
Aujourd’hui, les 109 aires protégées terrestres de Madagascar analysées, couvrent 11,9 % (7 millions d’hectares) du pays mais, en raison des activités d’exploitation forestière illégale, elles ont déjà perdu près de la moitié de leur couverture forestière d’origine jusqu’au 31 décembre 2023.
Les 3,48 millions d’hectares de forêt primaire survivants à l’intérieur des aires protégées ne représentent plus que 5,9 % du pays
—une superficie plus petite que la taille de la Suisse.
Les résultats ont permis d’établir un système de classification des menaces à quatre niveaux pour les aires protégées, basé sur la survie prévue de la forêt naturelle
DC En Danger Critique
Toutes les forêts primaires potentiellement perdues dans les 10 ans.
DA En Danger
Toutes les forêts primaires potentiellement perdues dans les 25 ans.
VU Vulnérable
Toutes les forêts primaires potentiellement perdues dans les 40 ans.
dans chaque aire protégée à court et à long terme, et ainsi d’évaluer l’urgence de lancer des actions de conservation supplémentaires:
Parmi les aires protégées les plus menacées, 13 sont classées comme En Danger Critique, avec une accélération de la perte annuelle de la couverture forestière supérieure à 2 %, un taux moyen annuel de déforestation pendant deux décennies indiquant que les forêts primaires intactes disparaîtront probablement d’ici 10 ans. Ces AP ont un besoin urgent d’interventions de conservation immédiates et, en moyenne, les 13 aires protégées ont déjà perdu plus de 70 % de leur couverture forestière primaire.
Les 17 autres AP sont classées En Danger avec une forte probabilité de perdre toute leur forêt primaire dans les 25 ans à venir, avec un taux moyen annuel de déforestation compris entre 1 et 2 % sur deux décennies et ont déjà perdu en moyenne plus de 50 % de leur couverture forestière primaire.
Les 19 autres AP sont classées comme Vulnérables avec des pertes de la couverture forestières moyennes annuelles croissantes de 0,5 à 1 % et devraient perdre toute leur forêt primaire d’ici 50 ans et qui ont déjà perdu en moyenne plus de 50 % de leur couverture forestière originelle.
PM Préoccupation Mineure
Menaces stables et gérables à long terme.
Le classement de la perte moyenne de couverture forestière sur des périodes de 5 ans depuis 2003 montre que 55 % des aires protégées de Madagascar ont des pertes forestières moyennes annuelles stables ou relativement faibles , donc considérées comme de Préoccupation Mineure, bien qu’elles continuent de nécessiter des efforts de conservation.
Malheureusement, 45 % des AP terrestres de Madagascar sont actuellement considérées comme menacées par une perte forestière grave qui a un impact sur la survie de la forêt primaire dans les 10 à 40 prochaines années.
Plus généralement, la perte totale de couverture forestière au cours de toute l’histoire des aires protégées a montré que 47 % des aires protégées de Madagascar ont déjà perdu plus de 50 % de leur couverture forestière naturelle. Parmi ces AP, 22 ont perdu plus de 75 % de leur couverture forestière . À titre d’exemple, ranobe PK32, d’une superficie de 168 541 hectares, a perdu 72 % de sa couverture forestière depuis qu’il a été déclaré aire protégée en 2007.
Dans l’ensemble, notre évaluation montre une détérioration inquiétante de la couverture forestière à l’intérieur des aires protégées de 2017 à 2023 par rapport aux 16 années précédentes. Et les perspectives
générales pour les aires protégées de Madagascar dans les années à venir sont profondément inquiétantes.
Nous espérons que ces Perspectives de conservation serviront à informer les donateurs internationaux et les acteurs de la conservation que les aires protégées uniques et merveilleuses de Madagascar ont un besoin urgent d’un soutien supplémentaire et ciblé et que les entités de conservation malgaches sont prêtes à collaborer et à faire face aux menaces.
Les enjeux pour la biodiversité mondiale et la lutte contre l’extinction ne pourraient être plus grands que ceux auxquels Madagascar est confronté.
Famintinana
ity tatitra ity no voalohany amin’ny fanadihadiana amin’ny antsipiriany mikasika ny fahaverezan’ny rakotrala manerana ny Faritra Arovana an-tanety eto Madagasikara.
Ny fahapotehan’ny ala, ny fisian’ny tsindry ao anatin’ny Faritra Arovana dia famantarana lehibe amin’ny fahombiazana na tsia eo amin’ny fitantanana, indrindra amin’izao vaninandro itadiavan’ny fianakaviambe iraisam-pirenena hampihenana ny fandripahana ala, hanalefahana ny fiovaovan’ny toetr’andro, ary ny hahatratrana ny tanjon’ny fiarovana ny zavamanan’aina maneran-tany izao.
Na dia voasokajy ho isan’ireo firenena mahantra indrindra aza i Madagasikara, dia manana zavaboahary tsy manam-paharoa manerantany. i zany dia vokatry ny fitokana-moniny nandritra ny 80 tapitrisa taona mahery.
Noho ny fisian’ireo karazam-biby sy zavamaniry maro be tsy fahita afa-tsy eto Madagasikara, dia zava-dehibe ny fahaiza-mitantana sy fikarakarana ireo faritra arovana ao aminy ho an’ny zavamananaina isan-karazany maneran-tany sy ho an’ny
fahombiazana amin’ny fiarovana aty amin’ny tany mafana tropikaly, izay tena zava-dehibe indrindra ho an’ny zavamananaina.
Ny fahaverezan’ny rakotrala (na ny tsy fisiany) dia fomba iray ahafahana mandrefy ny fahombiazana na tsia ireo ezaka amin’ny fiarovana ireo Faritra Arovana an-tanety eto madagasikara. izany koa dia ahafahana manasokajy azy ireo ho amin’ny laharampahamehana ho isan’ireo faritra mila hetsika fiarovana maika.
Ny fampiasana sy fikirakirana ireo angon-drakitra mikasika ny fahaverezan’ny ala tamin’ny alàlan’ny « Global Forest Watch » nanomboka ny taona 2001 ka hatramin’ny 2023 no nahafahana nanombana ny fiantraikan’ny fandripahana ala sy ny fironana manerana ny faritra arovana an-tanety rehetra. Ny fampiasana tekinolojia sy fomba fiasa vaovao amin’ny alalan’ny fanisana ny faharipahan’ny ala nandritra ny 5 sy ny 3 taona farany dia nahafahana namaritra ny fironan’ny fivoaran’ny rakotrala mba hanasongadinana ireo laharam-pahamehana amin’ny fiarovana.
Amin’izao fotoana izao, ireo Faritra arovana an-tanety miisa 109 izay nanaovana fanadihadiana dia mandrakotra ny 11,9% (7 tapitrisa hektara) ny velaran’i madagasikara. Saingy noho ny fitrandrahana tsy ara-dalàna, dia efa very ny antsasaky ny ala tany am-boalohany hatramin’ny faha 31 Desambra 2023 teo.
Ny 3,48 tapitrisa hektara sisa tavela anefa dia tsy mandrakotra afa-tsy ny
5,9% monja ny velaran’i Madagasikara
—izay kely noho ny haben’i firenena Soisa.
Ny vokatra azo tamin’ny fanadihadiana dia nahafahana nametraka rafitra fanasokajiana ny Faritra Arovana. Misy ambaratonga efatra izany sokajy izany izay mifototra amin’ny vinavinan’ny fahaveloman’ny ala voajanahary
ao anatin’ny Faritra arovana tsirairay ao anatin’ny fotoana fohy sy fotoana maharitra. izany dia nahafahana nametraka laharam-pahamehana sy paikady amin’ny hetsika fiarovana fanampiny:
TI Tena Tandindomin-doza Indrindra
Ny ala voajanahary rehetra mety ho ringana ao anatin’ny 10 taona.
Amin’ireo Faritra Arovana dia 13 no voasokajy Tena Tandindomin-doza Indrindra ary manana tahan’ny faharipahan’ny ala miohatra ny 2% isan-taona tao anatin’ny roapolo taona farany. izany dia midika fa mety ho ringana ao anatin’ny 10 taona ny ala ao aminy. ireo faritra arovana ireo dia tena mila fandraisana andraikitra farak’iizay malaky amin’ny fiarovana. marihina fa maherin’ny ny 70%-n’ny rakotrala voajanahary ao amin’ireo faritra ireo dia efa ringana avokoa.
TD Tandindomin-doza
Ny ala voajanahary rehetra mety ho ringana ao anatin’ny 25 taona.
MA Marefo
Ny ala voajanahary rehetra mety ho ringana ao anatin’ny 40 taona.
Ny 17 hafa indray no sokajiana ho Tandindomin-doza ka heverina mety ho ringana ny ala fototra rehetra ao anatin’ny 25 taona manaraka. Teo anelanelan’ny 1 ka hatramin’ny 2% isan-taonany tahan’ny faharipahan’ny ala tao anatin’ny roapolo taona farany ary amin’ny ankapobeny dia efa ripaka ny 50%n’ny rakotrala tany am-boalohany.
Ny 19 amin’ireo faritra arovana indray no voasokajy ho Marefo izay manana tahan’ny faharipahan’ala eo anelanelan’ny 0,5 ka hatramin’ny 1% isan-taona. v inavinaina ho ringana ny ala fototra rehetra ao anatin’ny 50 taona ary amin’ny ankapobeny dia efa 50% ny rakotrala tany am-boalohany no efa ringana.
KF Kely Fanahiana
Faritra marin-toerana tsy dia misy ahiana fa voafehy ny tsindry.
Ny salan’isan’ny fahapotehan’ny ala isaky ny 5 taona nanomboka tamin’ny taona 2003 dia mampiseho fa ny 55%-n’ny Faritra arovana eto Madagasikara dia manana salan’isa faharipahan’ny ala isan-taona tsy dia miova sady ambany , ka voasokajy ho Kely fanahiana, na dia mbola mitaky ezaka amin’ny fiarovana aza.
i ndrisy anefa, fa ny 45%-n’ny faritra arovana an-tanety eto Madagasikara amin’izao fotoana izao dia ahiana ho ringana ny ala ao aminy ao anatin’ny 10 ka hatamin’ny 40 taona ho avy.
Amin’ny ankapobeny, nandritra izay fotoana rehetra nisian’ny ny faritra arovana izay, dia heverina fa ny 47% amin’izy ireo no efa very rakotrala miohatra ny 50%. Ny 22 amin’izy ireo kosa no efa maherin’ny 75% ny tahan’ny fahaverezan’ny rakotrala. Ohatra, r anobe PK32, hatramin’ny nanambarana azy ho Faritra Arovana tamin’ny taona 2007 dia 72%-n’ny velaran’ny rakotrala tany amboalohany (168,541 ha) no efa ringana.
Ny tombana izay nataonay dia mampiseho ny fitombon’ny fahasimban’ny ala tao anatin’ny faritra arovana nanomboka ny taona 2017 ka hatramin’ny 2023 raha oharina tamin’ny 16 taona teo aloha. Noho izany dia tena mampanahy tanteraka ny ho avin’ny faritra arovana eto Madagasikara.
Manantena izahay fa ity “Conservation Outlook” ity dia hampahafantatra ireo Mpamatsy vola iraisam-pirenena sy ireo mpiara-miombon’antoka amin’ny fiarovana ny tontolo iainana fa mila fanohanana fanampiny ary maika ireo Faritra Arovana izay mampiavaka an’i Madagasikara ary koa ny fahavononan’ireo sampana Mpiaro ny tontolo iainana amin’ny fiatrehana ireo tsindry.
Mino izahay fa tsy ho atao ambanin-javatra raha oharina amin’ny fiarovana ny zavaboahary maneran-tany ny eto Madagasikara.
Madagascar Protected Area Consortium Partners
aSity madagascar https://asity-madagascar.org/
Association Analasoa https://www.conservationallies.org/ partners/analasoa/
association antrema miray (ami)
association Environnementale pour la recherche, l’Éducation, la conservation et le Développement Durable (E-rEcODEv)
Page Facebook: association E-rEcoDev
association FamELONa https://famelona.mg/
Association Fanamby https://association-fanamby.org/
Association Fosa https://www.fosa.mg/fr/
association miarO https://www.miaro-natiora.com/
Association Mitsinjo
association tamia
https://associationmitsinjo.wordpress.com/
viHy https://vihy.mg/ université de la Sava (uSava) https://web.facebook.com/p/ universit%c3%a9-de-la-Sava-officiel
Direction régionale de l’Environnement et du Développement Durable (DrEDD) Atsimo-Andrefana
Fikambanana Bongolava Maitso (FBM)
Fondation pour les Aires Protégées et la Biodiversité de Madagascar (FAPBM)
Groupe d’Etude et de recherche sur les Primates de madagascar (GErP)
https://www.environnement.mg/
https://www.bongolavamaitso.mg/
https://www.fapbm.org
http://www.gerp.mg/
imPact madagascar https://impactmadagascar.org/
Madagascar Biodiversity Partnership (MBP) https://madagascarpartnership.org/
Madagascar National Parks (MNP)
Madagascar Wildlife Conservation (MWC)
madagasikara voakajy (mavOa)
Ny Tanintsika
https://www.parcs-madagascar.com/
http://www.madagascar-wildlifeconservation.org/
https://www.madagasikara-voakajy.org/
https://www.nytanintsika.org/en/
Planet Madagascar http://www.planetmadagascar.org/
razan’ny vohibola
https://web.facebook.com/razanyvohibola
SaDaBE https://sadabe.org/
university of antananarivo, Biologie et Ecologie végétale (mBEv)
vOi tahindraha
https://mbev.univ-antananarivo.mg

Introduction
Much like the isolated, ancient, and densely forested islands of Hawaii and New Zealand, human colonization in Madagascar only occurred within the last two millennia. And, within the space of less than 1,000 years, the vast majority of its forests steadily disappeared together with its extraordinary and evolutionarily unique wildlife.
u nlike Hawaii and New Zealand, Madagascar counts on extremely limited financial resources to protect some of the planet’s most unique biodiversity restricted to forests. Arguably, Madagascar is exponentially more important for biodiversity conservation than any other island on earth and comparable in its priority with entire continents.
Given the global importance of Madagascar’s biodiversity and the challenges this nation faces, the Outlook partners wanted to undertake a nationwide quantitative assessment of the state of native forests that almost every endemic species depends upon.
With open source high-quality satellite data on changing forest cover of the tropics gathered by several satellite constellations, together with excellent new tools to assess that information, such as Global Forest Watch (www.globalforestwatch.org ), we present our assessment of deforestation trends as well as
the short and long term conservation prospects across all terrestrial Protected Areas in Madagascar.
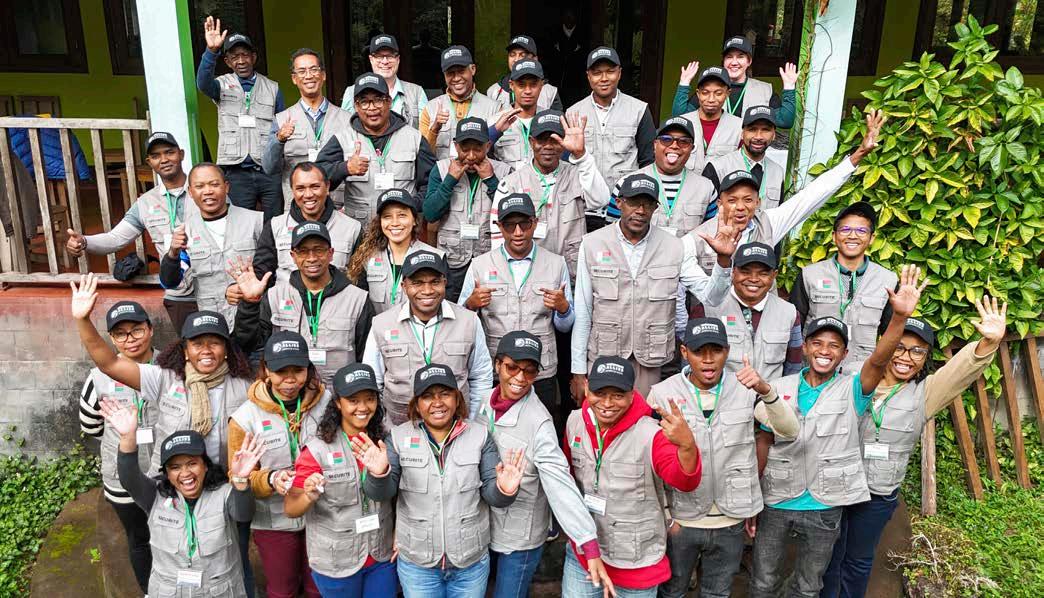
We then convened the “ Protected Areas in Peril Forum ” from July 1–5, 2024 held in Andasibe, Madagascar with 40 Protected Area experts, including PA managers, NGO directors and donors thanks to the support of Conservation Allies, FAPBM and others. This forum discussed the issues facing the majority of Protected Areas in Madagascar, exchanged experiences and solutions as well as provide feedback that helped guide and produce this publication.
We hope this Outlook serves as an indicator of the effectiveness of efforts to save the most threatened Protected Areas at a time when the international community is seeking measurable progress towards avoiding extinction and reaching biodiversity targets, such as the Post 2020 Global Biodiversity Framework.
We excluded Madagascar’s Marine Protected Areas primarily in this report because it is not possible to independently assess threats using remote sensing. importantly though, there is not a single iucN threatened species that is endemic and restricted to Madagascar’s neritic marine zone, making the biodiversity conservation value of marine areas negligible compared to terrestrial areas.
History of Deforestation in Madagascar
Summary of deforestation in Madagascar:
Approximately 98.02% (57.5 million hectares) of Madagascar was forested. See Annex.
Pre-human colonization
Estimated 27% of Madagascar is forested (Harper et al., 2007).
Human colonization
Madagascar’s interior was colonized within the last 1,300 years.

1950s
2023: just 9.7% of Madagascar’s primary forest cover remains.
1960
Estimated 21% of Madagascar is forest (Guichon, 1960).
Only 11.82% of Madagascar’s primary forest cover remains while 52.6 million hectares of forest have been lost, which is equivalent to over 88% of the original primary forest lost.
2000
2023
9.7% of Madagascar’s primary forest cover remains (2001–2023 = 19% of primary forest lost [1,100,000 hectares]).
Overview of the history of forest loss in Madagascar
A comprehensive understanding of Madagascar’s historical forest and woodland cover, and its subsequent reduction, is of paramount importance. it fundamentally informs our perception of the magnitude of forest loss, the gravity of the situation, and, consequently, the urgency of current conservation initiatives.
We, Malagasy authors of this Outlook, have reviewed and assessed publications advocating the theory of vast C4 grassland savannas that dominated the Malagasy Central Highlands when humans first colonized the island around 600 A.D.
We hereby categorically dismiss those theories that are largely purported by non-Malagasy researchers, and firmly believe the malagasy central Highlands was a vast wooded and forest landscape when humans first colonized the region. The Annex in this Outlook explains this conclusion in more detail.
Perrier de la Bâthie (1921, 1936) and Humbert (1927, 1949, 1955) stated that forests covered almost all of Madagascar before human settlement. Deforestation advanced from around 600 A.D. when indonesian settlers began establishing swidden fields in the lush and cooler highland climes of Madagascar (Gade, 1996).
the first attempt to estimate the forest coverage was by Guichon (1960) based on aerial photos taken between 1950 and 1957. in 1985, the first reliable estimation of deforestation in Madagascar was possible due to a combination of aerial photography taken after 1950 and satellite imagery data available from 1972 on. The results demonstrated that 111,000 ha of eastern rainforest coverage
disappeared annually over 35 years (Green & Sussman, 1990). Further analysis of aerial photos and Landsat sensing images indicates that almost 40% of forest cover disappeared between the 1950s and 2000 (Harper et al., 2007). The most recent deforestation estimate showed 44% forest loss between 1953 and 2014 (vieilledent et al., 2018).

Figure 1: The estimated rate of forest loss (red dotted line) across Madagascar using known historical and modern-day forest cover points. Deforestation of the cooler, moist highlands started approximately 600 A.D. with the first evidence of indonesian settlers having swidden fields (Gade 1996).

Figure 2: Approximate distribution of ecoregions and forest types in Madagascar divided along climatic ecoregions with forest types: the moist forest in the East (dark green), the dry forest in the West (bright green), the spiny forest in the South (pale green), and the mangroves on the West coast (blue). Map adapted from vieilledent et al. (2018).
Drivers of deforestation
The principal drivers of deforestation in Madagascar are:
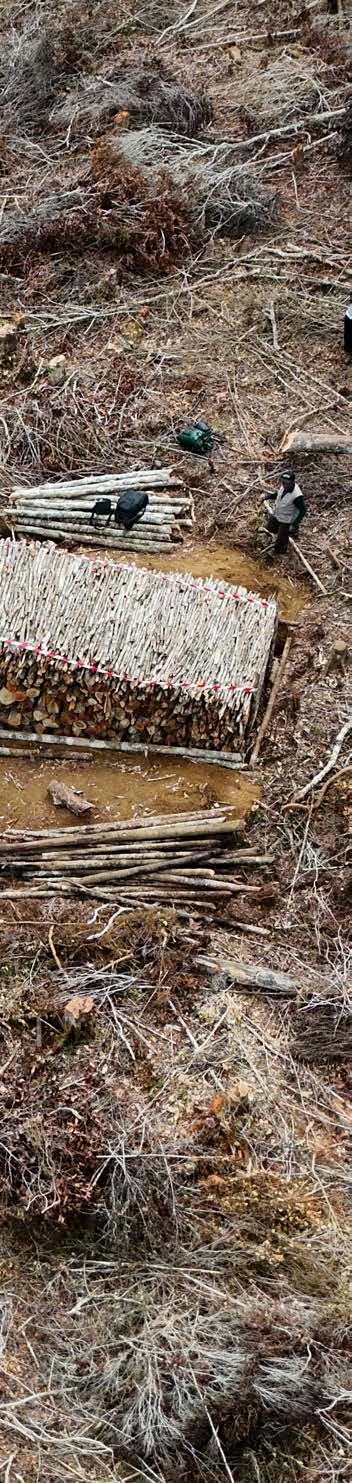
1. Slash-and-burn (tavy) to expand areas under agricultural cultivation or pasturelands.
2. Firewood and charcoal production for household energy.
3. Illegal logging for precious timber (rosewood, palisander, and ebony).
A combination of factors exacerbates deforestation drivers in Madagascar:
1. Agrarian society as the primary livelihood for >85% of its population.
2. High levels of poverty with >74% of the population living below the international poverty line (Naidoo & Loot, 2020).
3. High population growth at >2.4% increase a year (population 29.6 million in 2022).
4. Inadequate enforcement of Protected Areas resulting in illegal deforestation (over the last decade an average >41,000 ha forest lost in PAs per year).
Unfortunately these drivers of deforestation have been accelerating in Madagascar, contributing to increasing rates of forest losses, decade on decade.
History of Protected Areas in Madagascar
The first Protected Areas in Madagascar were established in 1927 by the French colonial authorities, with 10 réserves Naturelles intégrales ( r N i ) covering 433,372 hectares (Andriamampianina, 1987). Over the following seven decades, an additional 35 Protected Areas were established at an average rate of five parks and reserves per decade.
A pivotal moment occurred at the iuc N World Parks c ongress in 2003 when the President of Madagascar announced to triple the total surface of Protected Areas in Madagascar from 1.7 to 6 million hectares. From 2003 to 2015, there was a 160% increase, when 67 new terrestrial Protected Areas were created in Madagascar.
Today, there are 123 Protected Areas covering 11.9% of Madagascar’s land surface. These Protected Areas are managed by Madagascar National Parks (MNP), the Ministry of Environment and Sustainable Development ( m EDD) and dozens of different national and international NGOs.
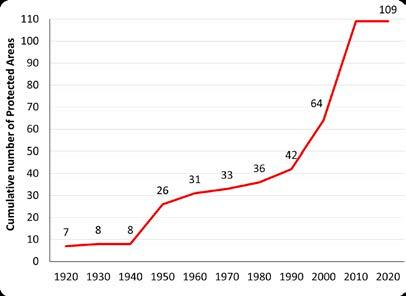
Figure 3: Cumulative number of Protected Areas established in Madagascar per decade. The first 7 Protected Areas were established almost 100 years ago, while there have been no new Protected Areas in almost a decade.
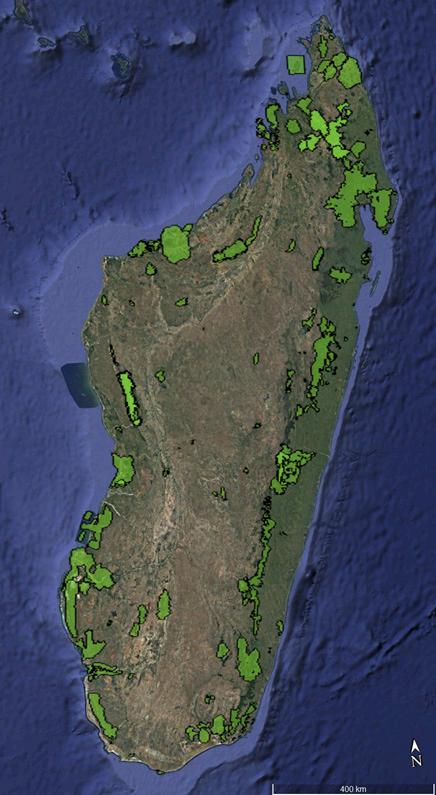
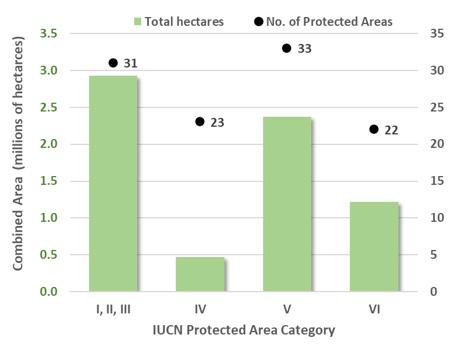
Figure 5: The distribution of combined area and number of 109 iucN terrestrial Protected area categories for terrestrial protected areas across Madagascar. the strictest protection categories of i,ii, and iii are grouped as one because there are only two sites each in category i and iii i: Strict Nature reserve, ii: National Park, iii: Natural monument or Feature, iv: Habitat/Species m anagement a rea, v: Harmonious Landscape, and vi: Protected areas with Sustainable use of Natural resources.

Figure 6: Distribution of 109 terrestrial Protected Areas across madagascar with color code to show the iucN Protected area category assigned. Several sites (5) lacking a specific category were assigned to the lowest protection category vi
Figure 4: Map of Protected Areas across Madagascar in 2024.
Conservation Outlook Objective
This Conservation Outlook aims to establish a quantitative baseline on the successes and challenges of protecting the forests and biodiversity of Madagascar’s terrestrial Protected areas. it is well established that some Protected Areas are facing rising deforestation threats in recent years. Our objective is to present a comparable analysis of the state of forest cover for all terrestrial PAs and recommend potential future management strategies.

Conservation Outlook Methodology
Outlook data
in order to achieve the Outlook Objectives, we compiled and analyzed public datasets from the following sources:
1) Protected Area polygons and data were obtained from the Madagascar Protected Areas website (https:// protectedareas.mg/ ) and the World Database on Protected Areas website (https://www.protectedplanet. net/). We used arcGiS to calculate the surface area of each terrestrial Protected Area. The surface unit used for this study is the hectare (ha).
2) Global Forest Watch forest loss data (https://www. globalforestwatch.org/) was used to analyze deforestation for each site. The data used for the analysis of tree cover loss are based on satellite data available between 2001 and 2023. To avoid overestimation or underestimation of tree cover, we followed the recommendation of rafanoharana et al. (2023). For this, the tree cover densities used for humid forests were set between 50% and 75%, 10% for dry spiny forests (in the south and southwest), and 30% for the remainder (dry forests and woodlands in the highlands). The data source credit is as follows: “Hansen/UMD/Google/USGS/NASA, accessed through Global Forest Watch” and citation is Hansen et al. (2013).
Global Forest Watch offers comprehensive, global, and annually updated data on forest changes. it is regarded as one of the best sources for mapping deforestation, with its high spatial resolution and wide application across sectors such as government, academia, and civil society. As methodologies and satellite technology improve, there will be occasional inconsistencies, but the overall trend is toward better accuracy and more detailed detection of forest loss. Awareness of these changes is crucial for correctly interpreting and using the data.
Hansen et al. (2013) summarize the evolution and improvements in tree cover loss data. The key improvements include enhanced algorithms, better satellite data (e.g., Landsat 8), and increased satellite coverage, allowing for more accurate detection of forest loss, especially smaller disturbances. However, these advancements have introduced some inconsistencies in the data over time. The article provides guidelines for analyzing trends and suggests using 3-year moving averages to account for these inconsistencies. Future updates, such as the new algorithm version 2.0, aim to improve the consistency of historical data while addressing challenges like distinguishing between different types of forest loss.
Despite occasional inconsistencies, Global Forest Watch data remains the most valuable and easily accessible resource for conservationists to understand global deforestation trends.
We only assessed terrestrial Protected Areas because forest cover change is the only reliable and transparent means to achieve the Outlook objectives and ensure effective comparable analysis across all Protected Areas. Therefore, marine PAs or those with
>95% of their surface area in the sea or water have been removed from the assessment (see Table 1).
Protected
Area Name Status (according to UNEP-WCMC 2024)
Ambodivahibe 2009 Marine Protected Area (MPA)
Andreba 2012 Wetland Protected Area
Ankarea 2011 MPA
Ankivonjy 2010 MPA
Bombetoka Belemboka 2015 Mangrove Protected Area
Nosivolo river Proposed Inland Waters Protected Area
Nosy Antsoha Proposed MPA
Nosy Hara 2011 MPA
Nosy Tanihely 2011 MPA
Nosy ve androka 2011 MPA
ranobe Bay 2011 MPA
Soariake 2008 MPA
velondriake 2006 MPA
Table 1: List of Protected Areas which are not included in the Outlook assessment.
After eliminating marine and freshwater Protected Areas, we established 109 terrestrial Protected Areas which were assessed and are presented in this Outlook.
Historic forest cover Assessment
it was crucial to undertake a detailed assessment of the literature and evidence on the original, pre-human vegetative composition of Madagascar to ensure our understanding of the extent of forest cover versus natural grassland, and therefore the degree to which anthropogenic activities have transformed the island. This extensive assessment, “Ancient or Anthropogenic: the myth of natural grasslands in Madagascar ” is found in the Annex of this Outlook.
Furthermore, to accurately assess the original forest cover of each Protected Area we used Google Earth Pro to map areas where the existence of forests was unlikely (the sea, lakes, rivers, and exposed rocky areas). The total surface area of each Protected Area was then assessed to separate natural forest areas, while excluding non-forest areas. in that way forest losses were only calculated from the originally forested areas, thus avoiding non-anthropogenic forest loss in our calculations.
We also established the extent of forest cover at the date of creation of each individual Protected Area. Global Forest Watch historical forest cover data provided an accurate figure for areas created after the year 2000 onwards (61% of all Protected Areas), while we extrapolated forest cover to provide estimates for areas created prior to the year 2000.
Protected Area Outlook assessment in order to show the state of forest cover within each Protected Area and determine deforestation trends projected into the future, we established robust criteria that would analyze our extensive annual forest loss dataset and provide meaningful data interpretation. The results of the criteria then enabled a Threat category to be assigned to each Protected Area.
The Protected Area Outlook assessments also compile additional information on each site such as the organizations responsible for or assisting in the protection and management of each Protected a rea. However, those data did not influence the assessment, which is strictly based on forest loss data.
Threat categories:
We assigned the following four categories to assess the threats to each Protected Area and to help project the likelihood of retaining existing natural forest cover over the coming decades:
CR Critically Endangered
The Protected Area is at grave risk and urgently requires serious conservation intervention in order to save it over the short term (within 10 years) or else the Protected Area may be lost completely. This status is triggered when alarming forest cover losses average exceed 2% per annum over two decades and the past three years.
EN Endangered
The Protected Area is seriously threatened and/or showing signs of major ecological deterioration and requires significant additional conservation measures in order to maintain and/or restore it over the medium term (within 25 years). This status is triggered when high forest cover losses average between >1 to 2% per annum over two decades and the past three years.
VU Vulnerable
The Protected Area is threatened and/or showing signs of ecological deterioration and requires additional conservation attention in order to stop and recover forest loss over the long term (within 50 years). This status is triggered when moderate forest cover losses average between 0.5 to 1% per annum over two decades and the past three years.
LC Least Concern
The Protected Area is either relatively stable or recovering thanks to effective conservation measures and is likely to be maintained in the foreseeable future, provided that current conservation measures are maintained. This status is assigned when low forest cover losses average less than 0.5 per annum over two decades and the past three years.
Endang ered CR Vulnerable End d Critically VU Least Concer n LC
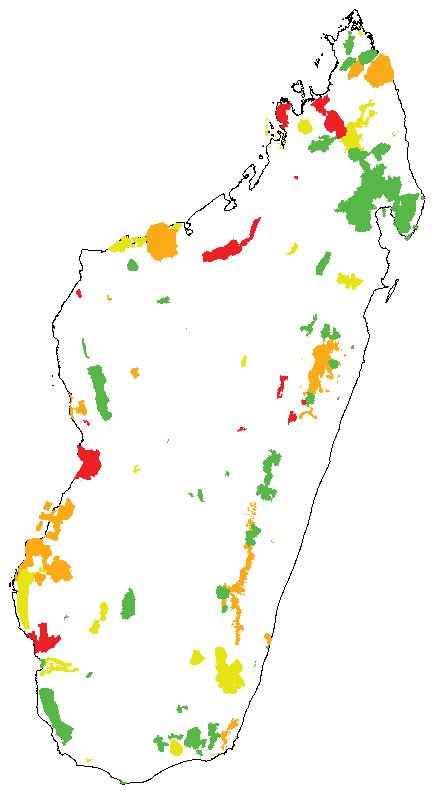
Figure 7: Categories of Protected Areas according to the importance of threats.
Outlook analysis:
We undertook the following analysis in order to allocate a Threat category:
1. Total Forest Cover (TFC) loss compared present-day forest cover to the original forest cover (pre-human).
2. Conservation Outlook (CO) is assessed by ranking Forest Cover Loss (FCL) averages across the 5-year periods of 2004–2007, 2008–2013, 2014–2018, and 2019–2023, plus the 2021–2023 average FCL to weight trends and provide an Outlook to establish Protected Area priorities.
Review process
Following analysis of the data, a range of knowledge-holders were informed and invited to take part in the consultation process to assess the results and provide recommendations. The reviewers included:
█ iucN members in madagascar
█ Malagasy Conservation nongovernmental organizations
█ Protected Area managers and stakeholders
█ Government authorities
An early draft of the Outlook was presented and discussed at the Parks in Peril Conservation Forum held in Andasibe in July 2024 with over 23 NGOs and other entities and experts in Protected Area management. Their feedback was incorporated into this Outlook.
This consultation process was indispensable to making this Protected Area Outlook Assessment as accurate and up-to-date as possible and focused on the most pressing issues for terrestrial Protected Areas in Madagascar.

█ Between 2014–2023, forest cover loss accelerated to a rate greater than 1 football pitch in size per minute for ten years.
Protected Area Outlook Results
Outlook Summary Facts and Figures
Deforestation across Madagascar:
█ 58.7 million ha of terrestrial land area in Madagascar.
█ Pre-human: 57.5 million ha (98.02%) of Madagascar was dominated by forest.
█ By 2000, 69.8% of total forest cover (40.1 million ha) had been lost in Madagascar.
█ By 2023, 78.4% of total forest cover (45.1 million ha) had been lost in Madagascar.
█ Between 2014–2023, 3.4 million ha of total forest cover was lost (an area greater than the size of Belgium), equivalent to 326,890 ha per year.
█ Between 2014–2023, 1.1 million ha of humid primary forest was lost.
█ Today, 12.4 million ha of forest cover survives in Madagascar. Of that, only 5.7 million ha of primary forest cover survives.
█ Today, 39% (2.2 million ha) of primary forests are unprotected, but these are largely fragmented.
Deforestation in Protected Areas:
█ 11.9% of Madagascar’s land is within the 109 Protected Areas (6,999,081 ha).
█ 95.8% of the 109 Protected Areas were originally forested (pre-human).
█ 37.9% of forest lost in Protected Areas by 2010 (2.73 million ha of forest lost).
█ 48.1% of forest lost in Protected Areas by 2023 (3.48 million ha of forest lost).
█ 9.3% of forest lost in Protected Areas in the past decade (354,759 ha).
█ 1% average annual forest loss inside all Protected Areas over the past 10 years.
█ 4 Protected Areas have lost more than 50% of their forests since 2001 (Ranobe PK32, Mangabe-Ranomena-Sahasarotra, Ampasindava, Mahialambo).
█ 30 Protected Areas have lost more than 20% of their forests since 2001.
█ 17 Protected Areas have seen worse deforestation since 2015 (more than 20% of forest loss).
Total Forest Cover (TFC) Changes Across Madagascar
To assess any forest losses within Protected Areas we also need to compare within the general context of forest losses in Madagascar. With a land surface area of 58.7 million hectares, Madagascar is slightly larger than the area of France. Extrapolating original, pre-human forest cover across
the entire terrestrial area of the country, Madagascar had an estimated 57.5 million hectares of forest around 700 A.D, with 98.02% of the island dominated by forest ecosystems.
By the time the first Protected areas were established in Madagascar in 1927, the majority of the cooler and moist highlands had been colonized and deforested, while a greater extent of forests survived in the eastern rainforests and lowlands.
By 2000, the first accurate satellite forest cover assessment showed that only 30.2% of the original forest cover survived in Madagascar. From 2001 to 2023, an additional five million ha were lost. Even more alarmingly, 3.4 million ha of total forest cover was lost (an area greater than the size of Belgium) in the last decade. The deforestation rate is equivalent to 2.4% per year (326,890 ha). During the same period, approximately one-third (1.1 million ha) of humid primary forest was lost.
Today, almost two-thirds of intact primary forests are restricted to 109 Protected Areas, while one-third (2.2 million ha) are unprotected but heavily fragmented. Future research will focus on the location of these unprotected forests, but a tentative review shows that the majority are in the buffer zones of Protected Areas.
Without decisive actions to mitigate deforestation, we project that >95% of total forest cover will be lost or heavily degraded and fragmented within the next 3–4 decades.
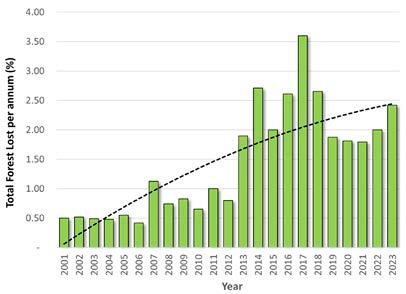
Figure 8: Percentage of annual total forest cover loss across Madagascar between 2001–2023 representing the combined loss of 4.92 million hectares of forest. a polynomial trendline shows a significant increase in deforestation, especially in the past decade (data: Global Forest Watch, 2024).
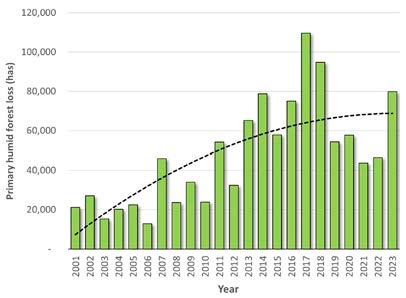
Figure 9: Annual humid primary forest loss in hectares across Madagascar between 2001–2023, with humid forest making up 22% of total tree cover loss in the same time period (data: Global Forest Watch, 2024).
Recent Forest Cover Change Across Madagascar’s Protected Areas
A total of 11.9% of Madagascar’s land area (6,999,081 ha) is protected by 109 Protected Areas.
These Protected Areas were originally estimated to be 95.8% forested (pre-human colonization), but by 2010 these Protected Areas had already lost 37.9% of their forest cover (2.73 million ha) and by 2023, 48.1% of their forests had been lost (3.48 million ha of forest lost).
u nfortunately, 9.3% of Protected a rea forest cover has been lost over just the last decade (354,759 ha lost from 2014–2023) at an average rate of 1% forest loss per year. Alarmingly, 17 Protected Areas have seen accelerating deforestation since 2015 with more than 20% of forest cover lost in less than a decade. Four Protected Areas have lost more than 50% of their forests since 2001 (ranobe PK32, mangabe-ranomenaSahasarotra, ampasindava, mahialambo).
Projections indicate over half of all forest cover in Protected Areas will be destroyed by 2026.
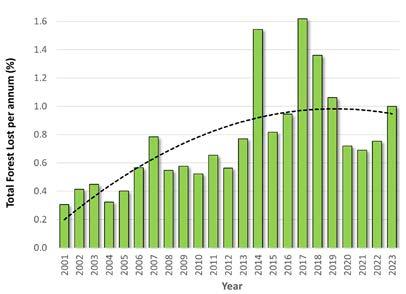
Figure 10: Percentage of tree cover loss within 109 terrestrial Protected Areas between 2001 and 2023 with a polynomial trendline showing a three-fold progressive increase in deforestation inside Protected Areas across the last 23 years (data: Global Forest Watch, 2024).
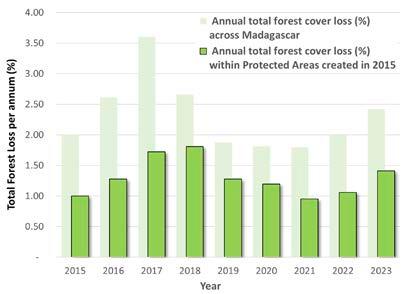
Figure 11: Annual proportion of tree cover lost from 2015 to 2023 within the 45 terrestrial Protected Areas created in 2015 (in dark green) compared to annual average forest cover loss across Madagascar (in pale green). This demonstrates an approximately 50% lower deforestation rate in newly created Protected Areas (data: Global Forest Watch, 2024).
A comparison between forest loss in newly created (2015) Protected Areas compared to the deforestation rate across
all of Madagascar aimed to assess if the creation of Protected Areas can stop or reduce the pressures on forests. Figure 11 shows that consistently the deforestation rate is 50% lower in new Protected Areas than for madagascar as a whole. However, after ten years since the creation of the 45 new Protected Areas, the deforestation rate remains above 1% forest lost a year in this areas.
Present-day Forest Cover in Terrestrial Protected Areas
We assessed the present-day extent of forest coverage across all 109 Protected Areas, excluding non-forest areas, such as open water and rocky outcrops. This is for natural forest cover as of 1st January 2024, but deforestation may have taken place many years before the establishment of the Protected area. However, it is important to establish the present-day extent of natural forest cover within each Protected Area to assess both its importance for conservation and just how perilous future deforestation could impact this site. This can also be valuable for potential restoration efforts as Protected Areas can still be recovered, although preventing further primary forest loss is absolutely critical.
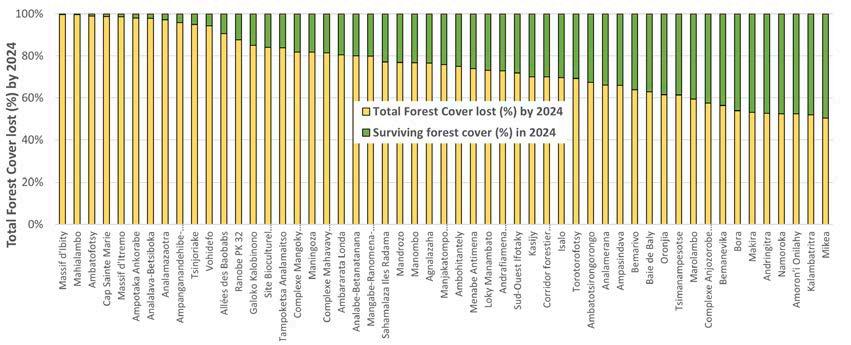
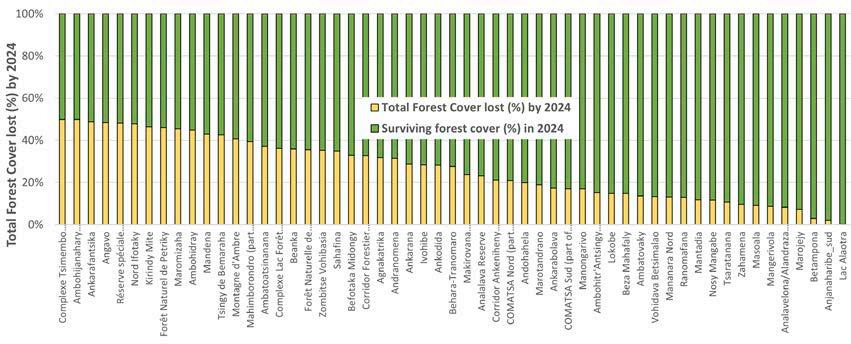
Figure 12 and 13: Shows stacked proportion of total forest cover lost (yellow) and extant forest cover by 1st January 2024 (Data: Global Forest Watch, 2024).

The extent of natural forest cover loss in Protected Areas is alarming as almost 50% of all natural forest cover inside Protected areas has been lost to-date. in summary:
█ Almost half of the Protected Areas (53) have lost more than 50% of forest cover. Collectively 2.65 million hectares of forest has been deforested inside those Protected Areas.
█ One quarter of the Protected Areas (27) have less than 25% of surviving forest cover. Collectively they have lost over 1.04 million hectares of forest.
█ A total of 3.48 million hectares of forest cover, representing 49.7% of all forest in terrestrial Protected Areas, has been lost.
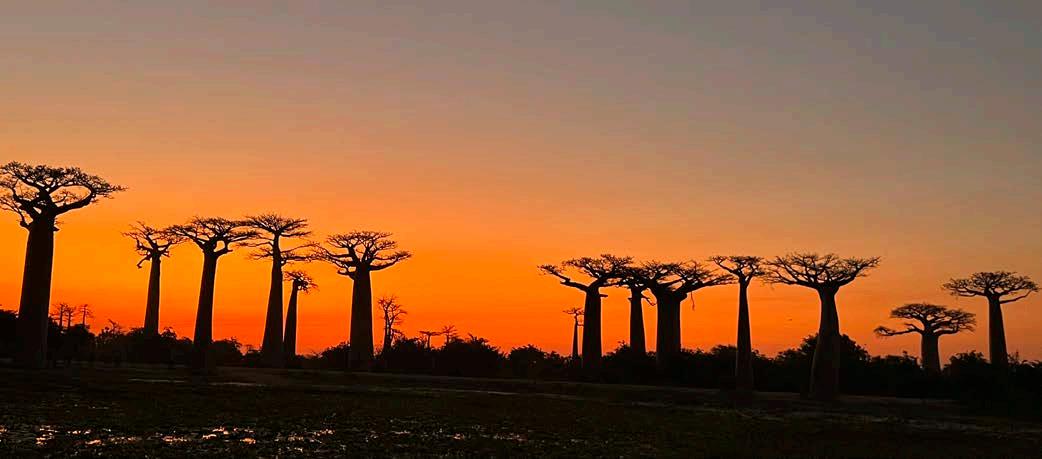
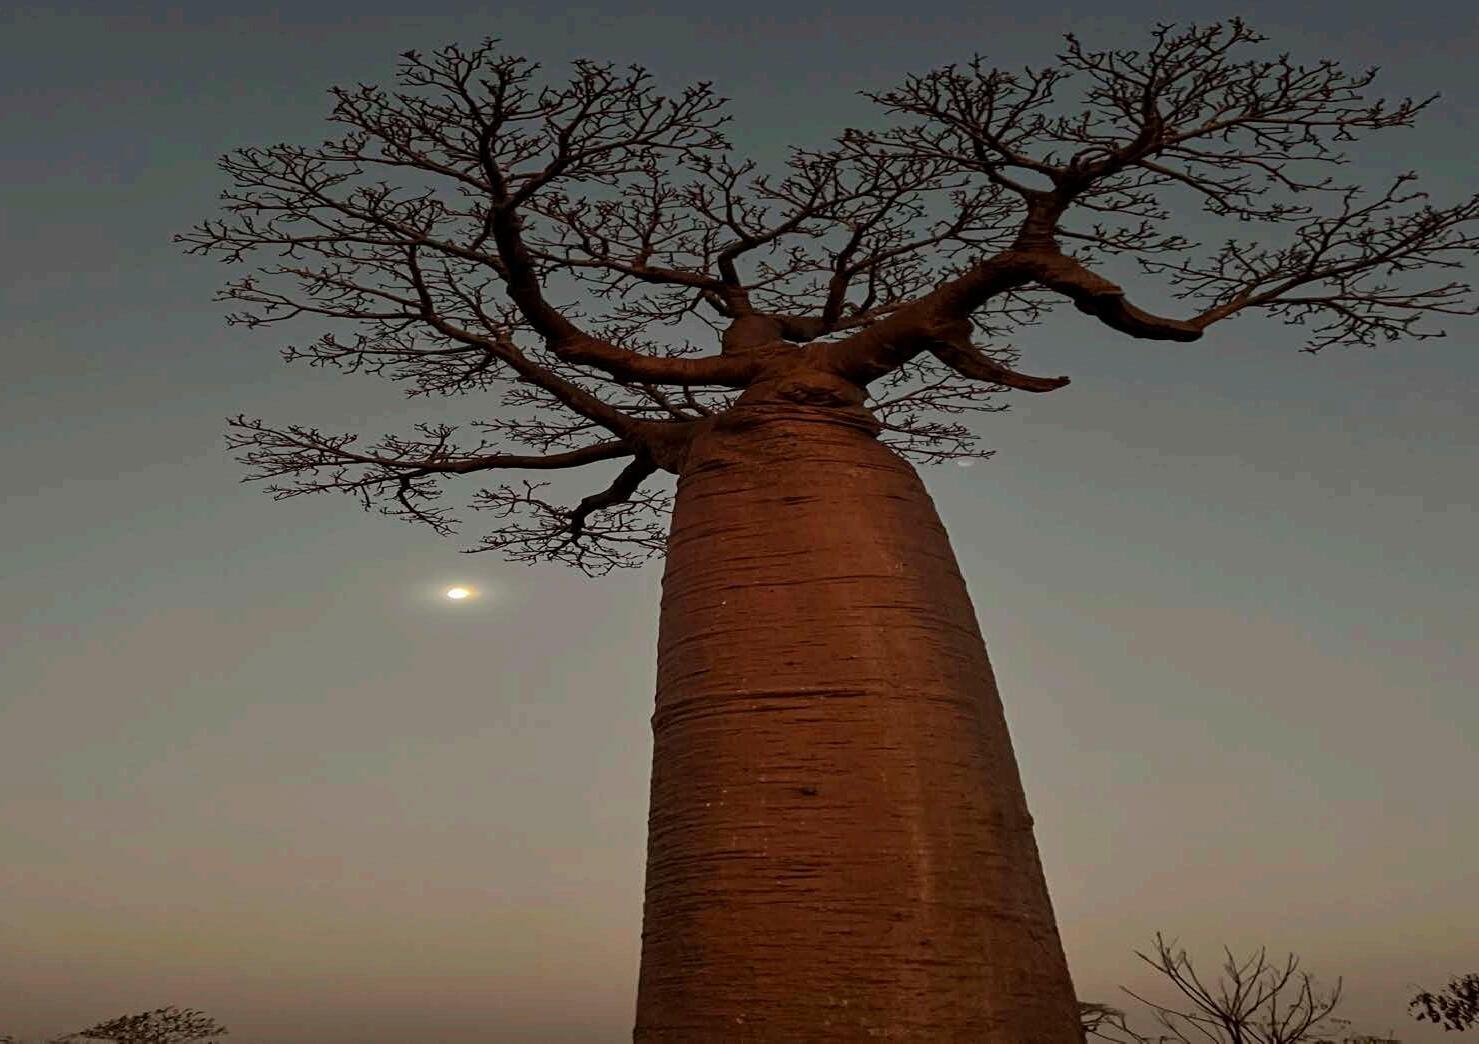
As an example, Allée des Baobabs Protected Area has lost 91% of its original forest cover. it has had high annual average deforestation rates of 6.7% and 2.0% between 2004–2008
Terrestrial
and 2009–2013, respectively. Fortunately, deforestation completely stopped at Allée des Baobabs from 2019 onwards and major restoration efforts have begun.
Deforestation inside Protected Areas has collectively emitted an estimated 1.734 Gt CO 2 into the atmosphere, equivalent to approximately 50% of the annual CO2 emissions of the European u nion. While CO2 emissions are an extremely concerning impact of forest loss, this also represents a potential opportunity for support to reforest and restore areas and offset emissions from other countries. But caution is needed, as ongoing deforestation remains extremely high and must be reduced and stopped before any restoration benefits truly have a globally significant impact.
Seven Protected areas established in 2015 had already lost over 95% of their original forest cover, so these sites are considered to be questionable from the perspective of viable biodiversity conservation and ecological functionality.
PA Name area (Ha) Established Forest Cover Lostprior to establishment and 2023
table 2: Seven Protected areas established in 2015 with >95% Forest cover Lost at the time of declaration and to-date.
Conservation Outlook for Each Protected Area
Ensuring a bright future for m adagascar’s Protected Areas is vital for maintaining ecological balance and ensuring the survival of the island’s incredible and unique terrestrial biodiversity.
CR Critically Endangered
Through the analysis of each Protected Area, we explore the probable trends in deforestation and habitat degradation in order to assess future conservation priorities using the Conservation Outlook criteria (detailed in methodology). The results also enabled us to allocate a threat category:
Alarming forest losses (>2% per annum) indicating that intact primary forests will likely vanish within 10 years.
EN Endangered
Significant forest losses (>1 to 2% per annum) and/or deterioration indicating a high probability of losing intact primary forest within 25 years.
VU Vulnerable
increasing annual forest losses (>0.5 to 1% per annum) and projected to lose intact primary forest within 50 years.
LC Least Concern
Limited to no forest losses (0 to 0.5% per annum) and considered stable forest cover.

While some areas show signs of successful management and conservation, others reveal the urgent need for targeted interventions. By highlighting the current status of these sites and their challenges, we aim to foster a greater understanding of the
ongoing deforestation and the critical role of effective conservation strategies. A summary of the most Threatened Protected areas (critically Endangered, Endangered and vulnerable) are presented in Table 3
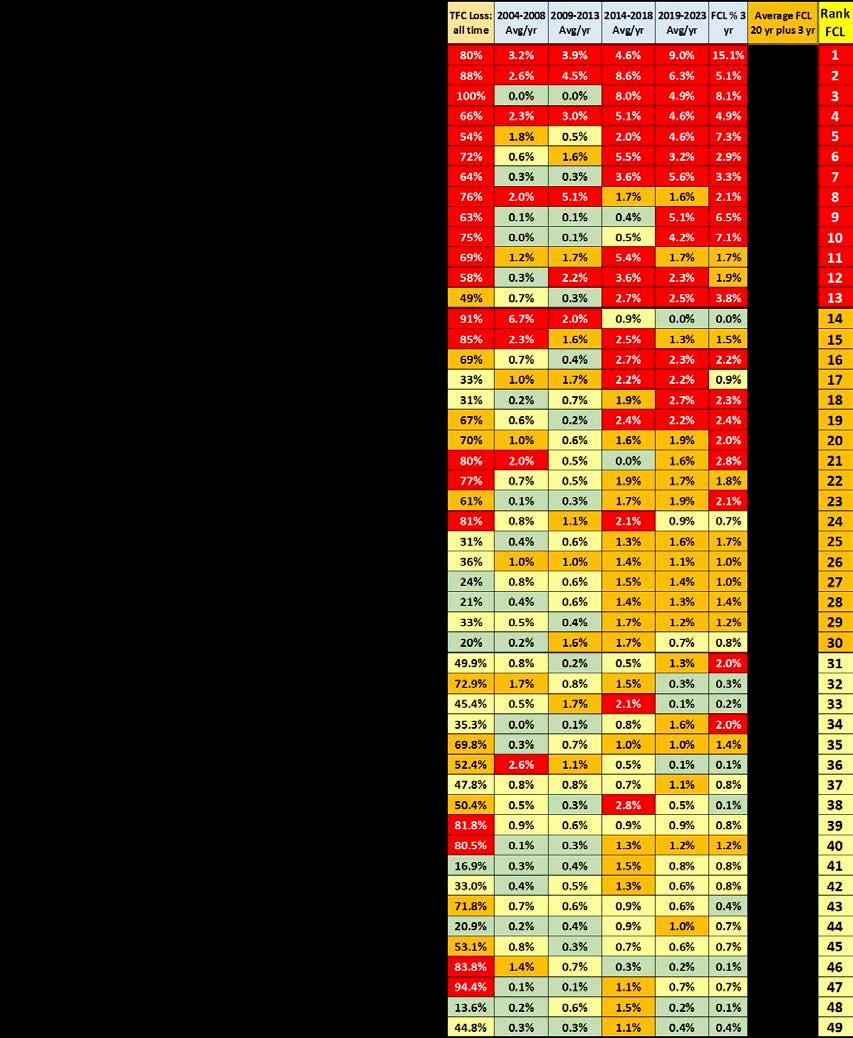
table 3: Summary of key data related to 49 critically Endangered, Endangered and vulnerable Protected areas including ranking according to average Forest cover Loss in five year periods from 2004–2023 and average annual deforestation rates from the past three years.
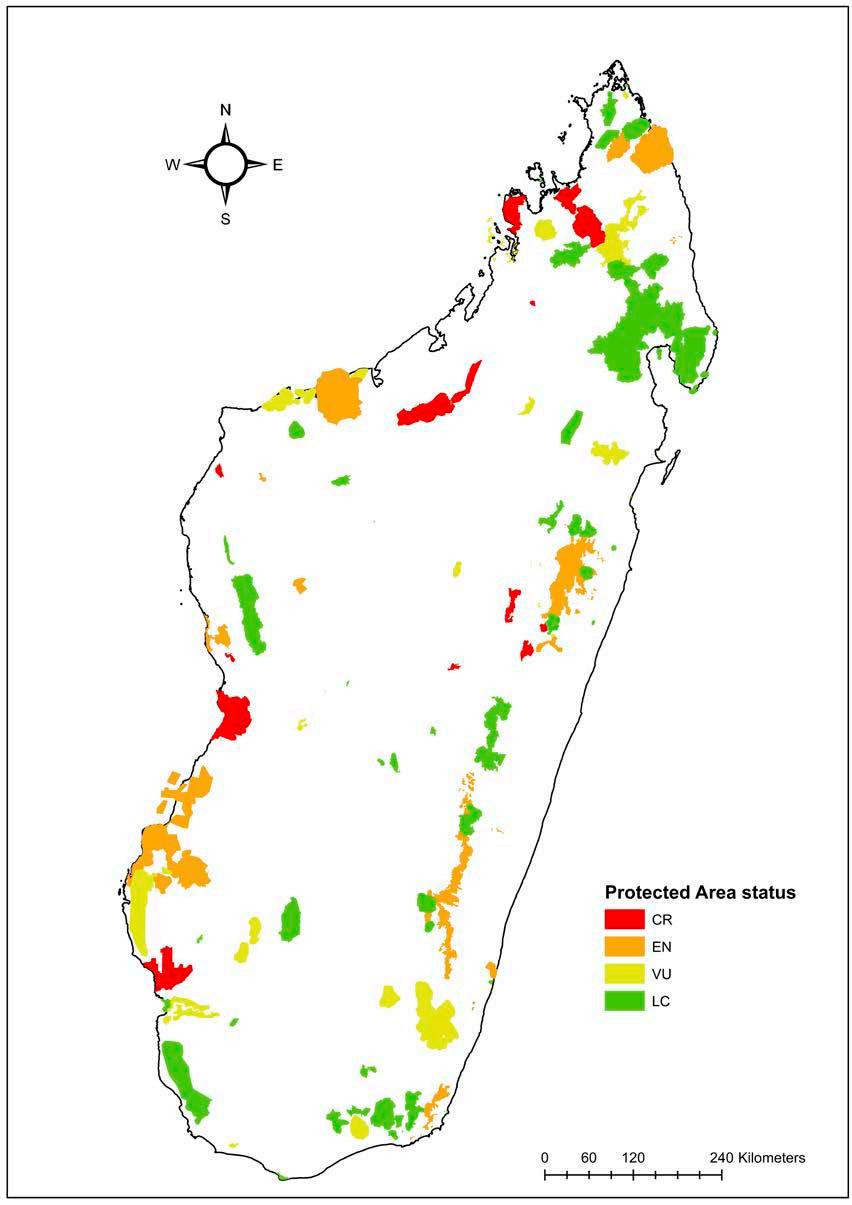
Figure 14: Map showing all terrestrial Protected Areas shaded by the color corresponding to their Protected Area threatened status from critically Endangered (red), Endangered (orange), vulnerable (light-green) and Least Concern (green).
Critically Endangered Protected Areas in Madagascar
Thirteen sites or 12% of all terrestrial Protected Areas (776,981 ha) were classified as c ritically Endangered ( cr ). t hese sites have experienced an annual average forest loss exceeding 2% per annum (the average across 13 sites was 3.3%) while, on average, less than 30% of original forest cover survives (>70% of original forest cover has already been destroyed). Since being designated as Protected Areas (including 5 Protected Areas declared in 2015), average forest losses have been lower at 48%, with six Protected Areas having experienced combined forest cover losses exceeding 50%.
These 13 Protected Areas are composed of a combination of iucN categories, however two globally important National Parks- Baie de Baly and Ankarafantsika—are considered cr and of particular concern as deforestation rates have accelerated in recent years.
more than 30% of cr sites fall under category v of the iucN classification (harmonious landscapes), where some human activities such as agriculture and traditional practices are permitted under controlled conditions and specific zones. This may explain their cr status, as many are newly designated Protected Areas (since 2015), where human activities were previously uncontrolled. However, almost all these sites continue to decline, even after gaining protected status.

Figure 15: thirteen critically Endangered Protected areas ordered by the >2% average annual Forest cover Loss percentage between 2004-2023 (red dotted line) and bar chart showing the Total Forest Cover loss at each Protected area with corresponding fills: red (critically Endangered), orange (Endangered), yellow (vulnerable) and green (Least Concern).
There are three Protected Areas—MangabeRanomena-Sahasarotra, Ranobe PK32, and Mahialambo established between 2007–2015, that stand out as extremely concerning and ranked as the top three most threatened Protected Areas in Madagascar and probably some of the most threatened protected areas on earth. it is possible that these three Protected Areas will lose all ecologically-functional, intact forest within the next three years. ranobe PK32 is particularly complicated as it lacks a manager after WWF, who created the site, withdrew as the manager.
Endangered Protected Areas in Madagascar
A total of 17 terrestrial Protected Areas were classified as Endangered (EN) because of annual average forest loss between >1 and 2% per annum (the average across 17 sites was 1.3%) while, on average, less than 47% of original forest cover survives (>50% of original forest cover has already been destroyed). Over half (9) of the 17 Protected
areas were declared in 2015, but since declaration have seen an average 0.4% increase in annual Forest Cover Loss over the prior decade. Endangered Protected areas cover over 1.98 million hectares, representing 28% of the entire area of all Protected Areas in Madagascar.
Nine sites have lost more than 60% of their total forest cover. Allée des Baobabs has lost 90.8% of natural forest cover, although this was almost entirely prior to being declared a Protected area in 2015. Since then, allée des Baobabs is an excellent example of a conservation success story with almost zero forest loss since declaration with an intense community program preventing fires, restoring forests (especially Baobabs), and locally operated ecotourism.
Of the Endangered Pas, more than 41% are classified as category v (harmonious landscape), where human activities are permitted under control. categories iv and vi are also well represented (17% and 23%). Three sites are classified as strict Protected areas ( iuc N c ategory i , ii and iii ), being Tsaratanana National Park, Kirindy Mitea and Allée des Baobabs.

table 4: Summary of key data related to Endangered Protected areas prioritized by total Forest cover Loss—all time, for each Protected Area.

Figure 16: Seventeen Endangered Protected areas ordered by the >1–2% average annual Forest cover Loss percentage between 2004–2023 (orange dotted line) and bar chart showing the total forest cover loss at each Protected area with corresponding color fills: red (critically Endangered), orange (Endangered), yellow (vulnerable) and green (Least Concern).
Vulnerable Protected Areas in Madagascar
A total of 19 terrestrial Protected Areas were classified as vulnerable (vu) because of annual average forest loss between >0.5–1% per annum (the average across 19 sites was 0.75%). vulnerable Protected Areas cover 1.49 million hectares, representing 21% of the area of all Protected Areas in Madagascar.
Most of these Protected Areas have experienced significant deforestation in the past with, on average, less than 46% of original forest cover surviving across the 19 sites (>50% of original forest cover has already been destroyed). Ten Protected Areas have lost more than 50% of their initial tree cover by 2003, which is alarming. Only three Protected Areas have experienced less than 25% tree cover loss: cOmatSa Nord, Manongarivo, and Ambatovaky.
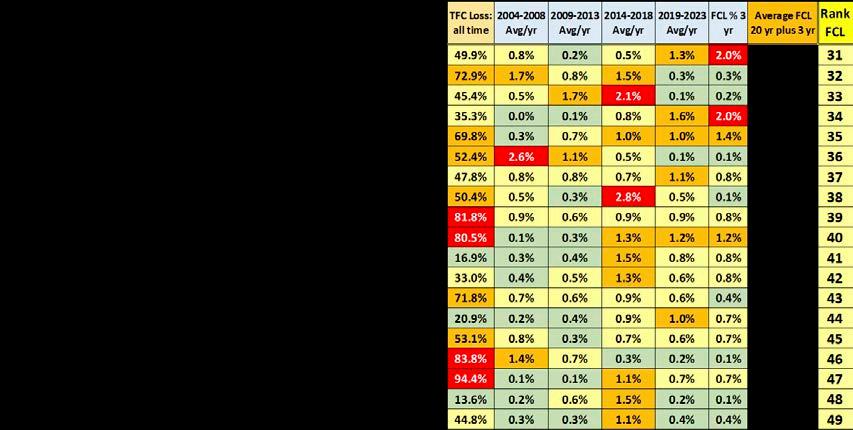
table 5: Summary of key data related to vulnerable Protected areas prioritized by total Forest cover Loss—all time, for each Protected Area.
Seven of the 19 Protected a reas were declared in 2015, but since declaration those sites have had an average 0.7% increase in annual Forest Cover Loss over the prior decade (2004–2013). in the past ten years, nine sites have recorded an annual average
tree cover loss of more than 1%, while only two sites have lost less than 0.5% (Amoron’i Onilahy and Tampoketsa- Analamaitso). This category includes four National Parks (midongy atsimo, Sahamalaza iles radama, mikea Forest, and Zombitse-vohibasia).

Figure 17: Nineteen vulnerable Protected areas ordered by the bar chart showing total Forest cover Loss at each Protected area with corresponding color fills: red (critically Endangered), orange (Endangered), yellow (vulnerable) and green (Least Concern), plus the 1 to <0.5% average annual Forest Cover Loss percentage between 2004–2023 (yellow dotted line).
Least Concern Protected Areas in Madagascar
A total of 60 terrestrial Protected Areas, the majority (55%) of all Protected Areas were classified as Least Concern (LC) because annual average forest loss over the past two decades is below <0.5% per annum (the average across 60 sites was 0.16% per annum). Least Concern Protected Areas cover 2.74 million hectares, representing 39% of the area of all Protected Areas in Madagascar.
A total of 20 Least Concern sites (33%) have lost more than 50% of their initial tree cover. Only 10 Least Concern Protected Areas have lost more than 90% of all forest cover, which is of concern, except that deforestation has now abated. Since being declared Protected Areas, 18 sites have lost more than 10% of their tree cover, with 7 of them exceeding 50% loss.
Almost all Least Concern Protected Areas have seen a stable or decreasing average annual forest cover loss over the last 20 years, with the exception of Mandena, which has seen an increase in deforestation in recent years.
importantly, 18 Least concern sites have not experienced any deforestation in the last ten years. The majority (31.6%) of PAs in this category are classified as iucN category ii (national park), which can be attributed to the regular presence of national park agents and restrictions on human activities. c ategory v is also well represented (30%), indicating successful management of Protected Areas with local populations. A further 19 Least Concern sites have experienced less than 0.05% forest loss over the past 20 years.

Figure 18: Sixty vulnerable Protected areas showing total Forest cover Loss at each Protected area with corresponding color fills: red (critically Endangered), orange (Endangered), yellow (vulnerable) and green (Least concern), plus the <0.5% average annual Forest Cover Loss percentage between 2004–2023 (green line).
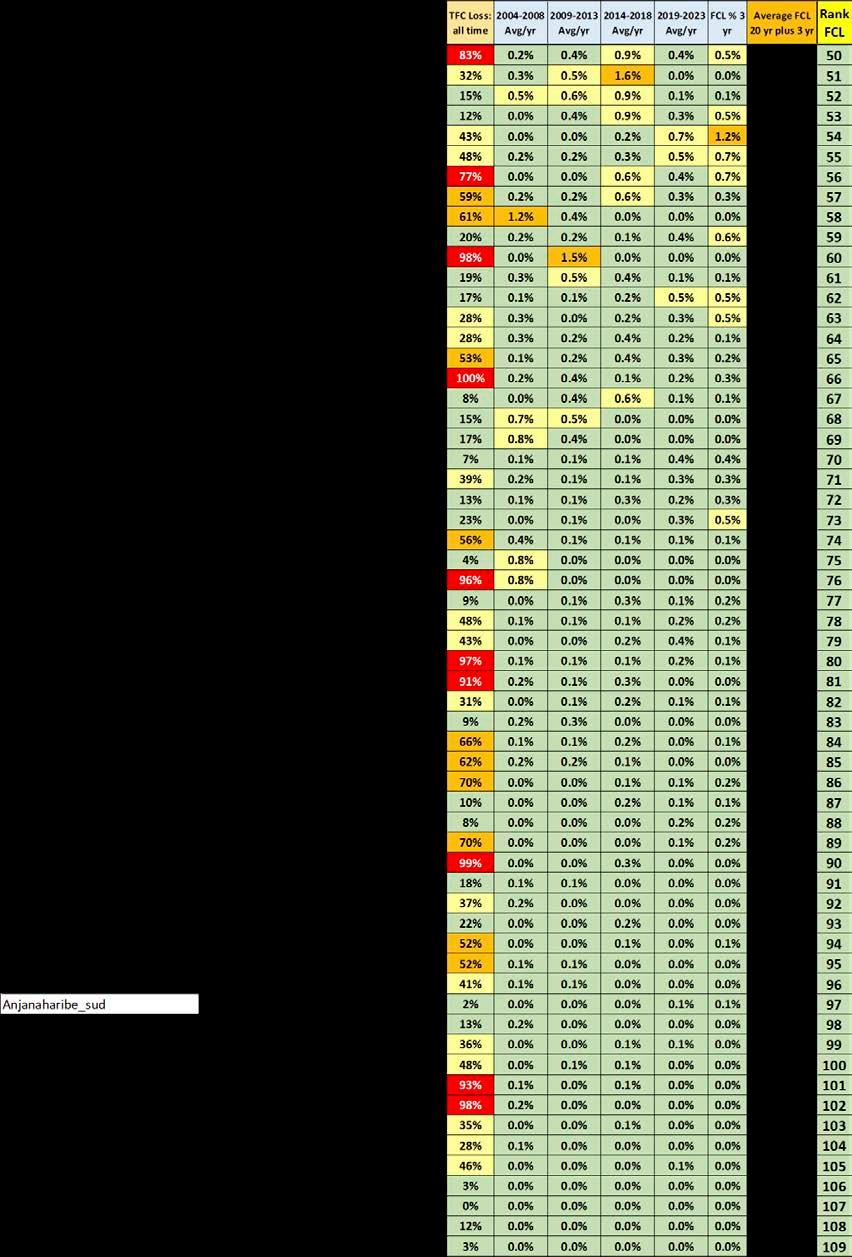
table 6: Summary of key data related to Least concern Protected areas including ranking according to average Forest cover Loss in five year periods from 2004-2023 and deforestation rates from the past three years.
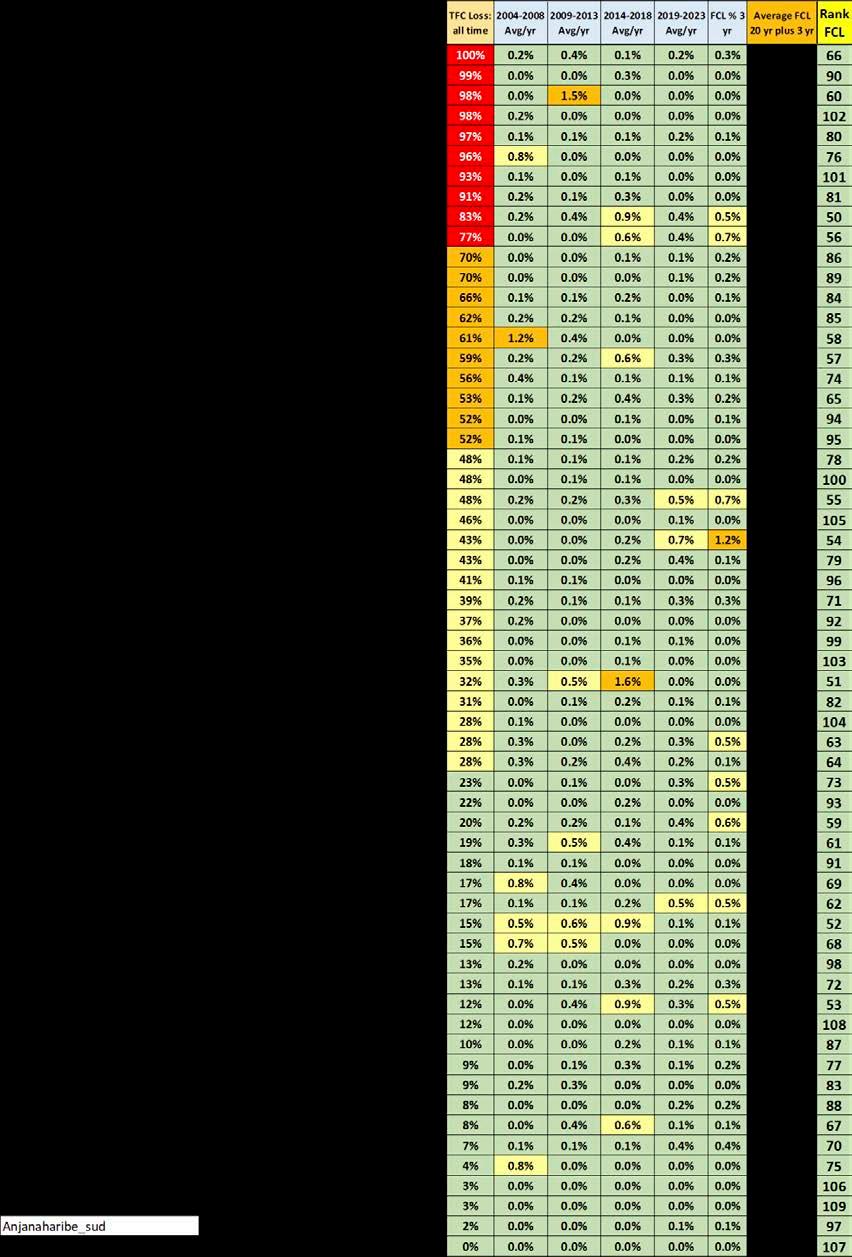
table 7: Summary of key data related to Least concern Protected areas prioritized by total Forest cover Loss—all time, at each Protected Area.
Summary of Priority Protected Areas Requiring
Conservation Intervention
Applying average annual forest cover loss across five periods together with Total Forest Cover loss within each Protected Area has enabled a transparent and replicable Protected area threatened classification system (cr, EN, vu, Lc) that can clearly identify Protected Areas in Madagascar in need of additional protection efforts.
To be clear, all Protected Areas are important to protect, but with limited resources for conservation the need to prioritize additional funds for Protected Areas should consider critically Endangered and Endangered Protected Areas as an imperative for future support.
While the majority of Protected Areas are Least Concern,
the most threatened Protected areas (cr, EN, vu) represent over 61% of the total area (4.25 million ha) under protection, highlighting the significant scale
of issues facing Madagascar.
CR Critically Endangered
For Critically Endangered Protected Areas we draw special attention to mangabe-ranomena- Sahasarotra, mahialambo, ampasindava, Baie de Baly, ranobe PK 32 (an orphan site with mining interests), menabe antimena, and Ankarafantsika (the latter two are threatened by illegal activities from large migrant populations).
EN Endangered
For Endangered Protected areas, eight sites have experienced significant forest cover losses in recent years with uncontrolled destructive activities. Of those, four are of particular concern: Tsaratanana National Park, AnalabeBetanatanana, Bongalava, and Manombo Protected Areas.
VU Vulnerable
For Vulnerable Protected Areas, while forest cover loss over the past two decades are a concern, the majority of sites have seen declining deforestation rates which is positive and thanks to improved governance and protection. three vulnerable Protected areas are presently experiencing escalating forest cover losses and are of particular concern: ambohijanahary, Zombitse vohibasia, and Loky Manambato.
LC Least Concern
For Least Concern Protected Areas, these sites are generally less exposed to deforestation over the past two decades, which can be attributed to good governance and effective protection strategies, despite significant losses of their initial forest cover that predates their protective declaration.
Priorities by Forest Type in Madagascar
Humid forest comprises 54% of the areas under protection (3.78 million ha), while Dry forest comprises 39% (2.15 million ha) and Spiny forest comprises 15% (1.06 million ha) of Protected Areas in Madagascar. When total Forest Cover Loss is compared across forest types, they are remarkably similar with between 13.8–16.7% lost in each forest type.

A review of the Threat category broken down by forest type highlights that dry forests (33 Protected Areas) are proportionally the most threatened habitat type with >60% having a t hreat category ( cr , EN, vu) conversely, two-thirds of Spiny forest Protected Areas (15 Protected Areas) are Least c oncern. r anobe PK32 is an outlier being critically Endangered, primarily because it lacks a manager responsible for the area coupled with major mining interests in this area. Humid forest (61 Protected Areas or 56% of all Protected Areas) has an 11–15% distribution of sites across Threatened categories with 61% being Least Concern.
These results appear consistent with global deforestation trends across habitats, whereby dry forests are more prone to destruction by large-scale fires. t hey are also often overlooked, with attention focusing on humid and wet tropical forests that are more biodiverse despite the high levels of endemism in dry forests.


Figure 19: Proportion of Protected Areas by forest type that are allocated a threatened category.
Protected Area Case Studies
Critically Endangered
Ankarafantsika National Park
Ankarafantsika National Park is emblematic of the challenges facing Critically Endangered Protected areas where accelerating human activities within the park and slow-to-scale-up conservation measures rapidly exacerbated habitat degradation. through a detailed analysis, we will explore the ecological significance of this site and the urgent need for immediate conservation action.
Established in 1927, and quickly approaching its 100th annivarsary, Ankarafantsika National Park is managed by Madagascar National Parks and is one of the most threatened National Parks in Madagascar. Ankarafantsika has lost 48.8% of its 136,700 ha forest cover until 2023. What places it in the cr category is that, in just 10 years (2013–2023), it has lost >30% of its forest, with an average annual loss rate of 2.7%. The last three years have seen an even worse annual loss rate of 3.8%. Notably, 2016 recorded the fifth highest loss of forest cover ever, with 4.9% of the remaining tree cover destroyed. Since 2001, 33,500 ha of tree cover has been lost, leaving less than half of the intact forest cover remaining in Ankarafantsika NP.
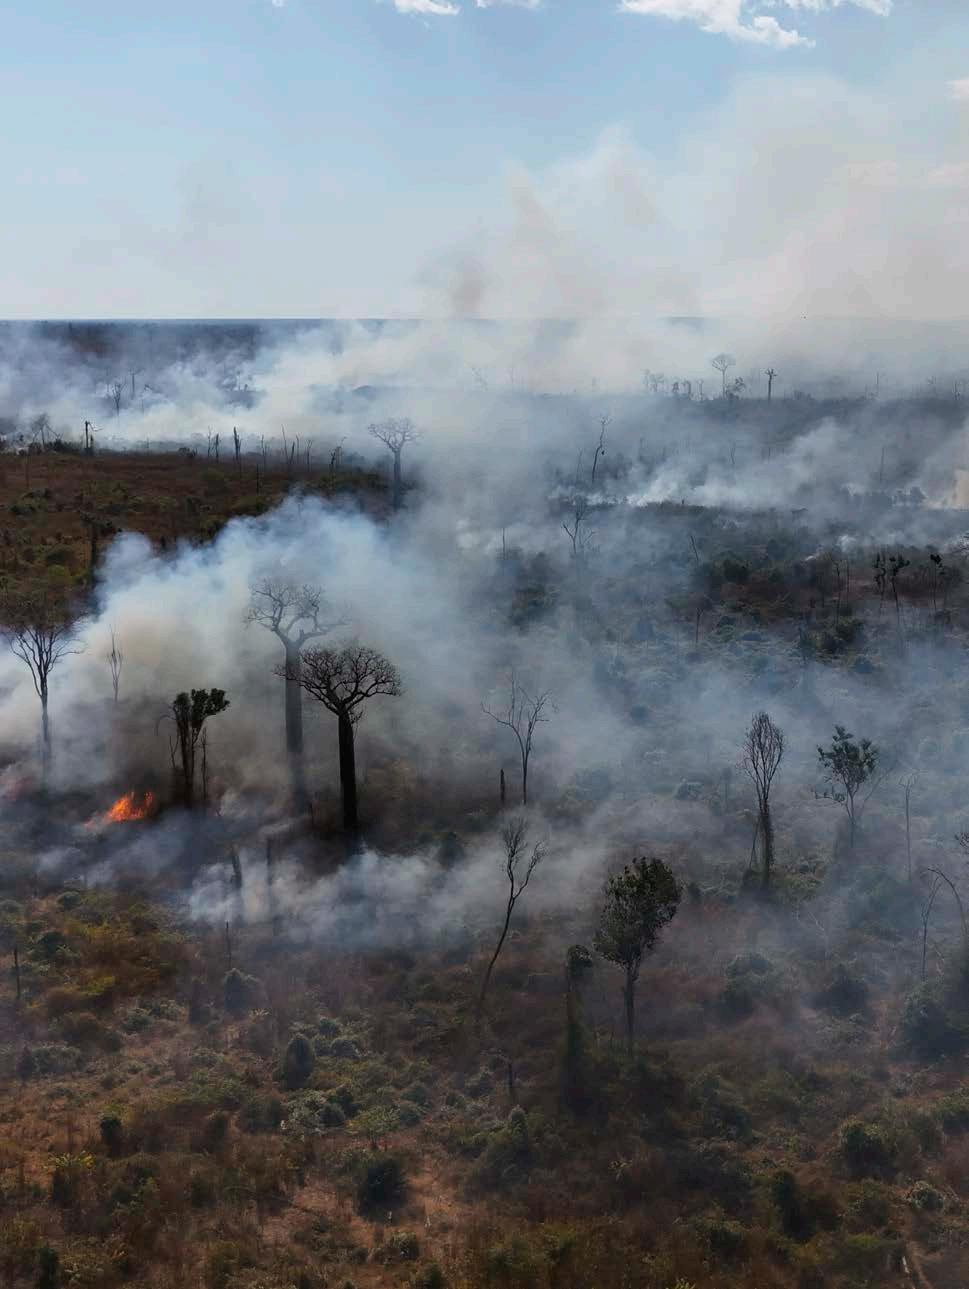
it is important to note that 53.7% of this forest cover loss (18,011 ha) has been attributed to fires since 2001, with significant fires occurring in 2019 and 2021. many of these areas have likely suffered due to selective logging, charcoaling, and other activities that degrade the park’s integrity, making them highly susceptible to fires. many fires are occurring in already deforested areas, burning non-native grasses but encroaching on surrounding native forests. Addressing the root causes that allow forest fires to thrive—such as habitat degradation—is critical to preventing further losses and enabling degraded forests to recover.
The greatest deforestation in Ankarafantsika has been linked to waves of migrants from southern Madagascar since the early 2000s, whose main livelihood activities include slash-and-burn cultivation (hatsake) and charcoaling for Mahajanga and surrounding towns. They initially destroyed forests outside the park, and upon realizing that there were no forests left outside, they began targeting the forests within the National Park. Additionally, local populations who previously respected the National Park are being influenced to engage in similar activities as protective measures were not in place and there were no repercussions for illegal activities in the park.
Ankarafantsika plays a crucial role as the sole water reservoir for irrigating Madagascar’s second rice granary, Marovoay. The loss of forest cover will undoubtedly lead to an unprecedented economic and social crisis in the region.
Endangered
Corridor Ambositra Vondrozo
Endangered Protected areas serve as critical indicators of biodiversity loss, reflecting environments where deforestation has led to significant declines in tree cover, surpassing an average over 10% per decade. This case study examines the 313,284 ha corridor Forestier ambositra-vondrozo (cOFav), where anthropogenic pressures have led to alarming rates of deforestation. By investigating the underlying causes and impacts of tree cover loss in this area, we aim to shed light on potential conservation strategies and highlight the importance of protecting these vulnerable ecosystems.
cOFav is located in the southern part of madagascar’s central Highlands and consists of middle-altitude humid forest and is managed by Ny Tanintsika and conservation international. this protected area is both economically and ecologically significant. it serves as a water source for several major rivers that irrigate rice fields and cash crops (coffee, vanilla, cloves) with numerous wetlands formed by rivers, lakes, and swamps. The Protected Area also provides substantial electrical energy through the ranomafana hydroelectric power.
this Protected area has lost 32.8% (102,740 ha) of its initial cover until 2023. Since achieving Protected Area status in 2015, it has lost 13.5% of its forest cover, with an average annual loss rate of 1.5%. The maximum loss of forest cover occurred in 2018, when 3.3% (7,341 ha) was lost. this Protected area is classified as iucN category v (harmonious landscape), meaning that local populations live within the Protected Area and engage in various activities. However, due to its large size and many access points, controlling unsustainable community activities is challenging.
The primary causes of ongoing deforestation are attributed to human activities, including shifting cultivation (tavy), illegal timber collection, and charcoaling. Although the loss of initial forest cover may not be significant compared to other cases, the trend of increasing annual loss rates poses a risk of future forest cover losses, justifying its status as Endangered.
Vulnerable
Maromizaha
the vulnerable category encompasses sites that, while still facing threats, demonstrate a range of more limited deforestation impacts. This case study will examine the 2,133 ha Maromizaha Protected Area, where historical deforestation has occurred but recent conservation efforts show promise. We will analyze the factors contributing to tree cover loss and the effectiveness of current management practices, providing insights into the potential for recovery and long-term sustainability of this key area.
maromizaha serves as a prime example of significant improvement in terms of protection. As of 2023, it has lost over 45% of its initial forest cover, including 24% from 2000 to 2023. Two major peaks in deforestation were observed in 2013 and 2014, during which the site lost more than 8.9% (135 ha) of its forest cover. The primary drivers of this loss are the lack of control and human activities such as charcoaling, slash-and-burn cultivation (tavy), gold mining, and uncontrolled timber collection. However, since obtaining its Protected area status in 2015, deforestation has begun to decrease, recording an annual loss of less than 0.1%, especially since 2019 (close to 0% in 2019 and 2022).
This improvement coincided with the awarding of a delegation contract from Groupe d’Étude et de recherche sur les Primates de madagascar (GErP) to manage maromizaha. Since 2019, surveillance and patrol missions have been reinforced through the establishment of guardhouses, patrol agents, and mixed brigade missions. Simultaneously, income-generating activities have been developed with the communities living in the Protected Area. These efforts have led to Maromizaha being classified as vulnerable, a significant improvement from more threatened categories (cr or EN). However, this site still requires significant conservation support as threats around the area persist.
Least Concern
Analavelona Sacred Forest
While classified as Least concern, some sites within this category could potentially face an increase in deforestation challenges, impacting their ecological integrity. this case study will focus on analavelona Sacred Forest, which represents a paradox of conservation success amidst ongoing threats. By examining the dynamics of tree cover loss and conservation strategies in place, we aim to understand how effective management can lead to positive outcomes even in areas under pressure, showcasing the resilience of ecosystems when supported by sustainable practices.
the 4,417 ha analavelona Forest is managed by the viHy association. it is the only humid forest recorded in the dry climate of southwestern Madagascar. The forest is home to diverse fauna and flora, including many rare and locally endemic species, and it serves as the source of numerous springs that irrigate significant areas of rice fields in surrounding regions. The forest has long been considered sacred by the local Bara tribe, led by leaders known as Lonaky.
initially, the management of this forest was solely under the Lonaky, but they now co-manage it with the viHy association, which has contributed to its successful preservation. as of 2023, only 8.3% of its initial forest coverage has been lost. However, in recent years, external pressures have begun to undermine the Lonaky’s influence, increasingly threatening the forest. Over the past decade, nearly 1% of the forest coverage has been lost, with a peak loss of 0.5% (20 ha) occurring in 2023.
the most significant threat to the site comes from fires, as the forest is surrounded by savannah. Every year, cattle farmers set fires to maintain fodder grasses at the forest’s edge, gradually encroaching upon it. additionally, the influx of migrants from afar undermines the local culture, negatively impacting the sacredness of the forest and its traditional conservation practices. Least Concern Protected Areas require close attention as the previous good management could change, primarily due to climate change impacting food production in the area. Consequently, people are increasingly turning to intact forests to improve their incomes.
Outlook Conclusions
Madagascar’s 109 terrestrial Protected Areas encompass the last remaining intact and ecologically functioning forest habitat. in the past two decades, almost all unprotected intact forest cover has been heavily fragmented or largely destroyed.
The stakes could not be higher. Madagascar’s incredible flora and fauna represent the highest levels of uniqueness on earth following over 80 million years of isolation and devoid of humans until the past millennia. Today, a potential tsunami of biodiversity extinction is threatening this island with the sole protector being Madagascar’s intact Protected Area system.
Our ability to protect these areas and their biodiversity is a true litmus test and example for conservation worldwide. This Outlook, produced by Malagasy environmental entities and conservationists, hopes to illustrate what Protected Areas are succeeding and what areas need attention so that international conservation supporters and donors can rally together to save these precious and priceless areas now.
We are alarmed that critical aspects of Protected Area management and protection, such as effective enforcement, sufficient staffing, and general management effectiveness, are often lacking in the most
Threatened sites. A survey of 28 Protected Area managers highlighted the desperate need for funding to address serious financial shortfalls in implementing Protected Area management plans.
Over the past decade or so, conservation entities have shifted from direct protective actions towards greater involvement and funding of community development initiatives in a bid to enhance “sustainability” and gain support for Protected Areas. While we lack adequate evidence, this trend of funding communities instead or to the detriment of direct protection may have unfortunately contributed to a rise in deforestation.
The evidence provided by this Outlook justifies a greater commitment is needed to implement enforcement of Protected Areas together with other initiatives involving local communities. Furthermore, what environmental financial resources are available, should be mobilized in the short term to greatly enhance protective measures in the most Threatened Protected Areas in order to not only safeguard Madagascar’s biodiversity but ultimately alleviate poverty and ensure long-term prosperous livelihoods and a productive national economy.
Overall, the 2024 Madagascar Protected Areas Outlook creates a baseline for annually monitoring Madagascar’s terrestrial Protected Areas and re-evaluating progress towards zero deforestation and safeguarding the world’s most precious and irreplaceable places and biodiversity.
Outlook Recommendations
With the majority of Madagascar’s Protected Area coverage considered at imminent risk and threatened ( c ritically Endangered, Endangered and vulnerable) we are facing a crisis.
it is imperative to save forests inside Protected areas. Strategic action and urgent protective measures are urgently needed. The challenges facing each Protected Area are unique and solutions require gumption and freeborn operations, but overall we provide five recommendations to help address the crisis:
1. Protected Area managers need to strengthen protective measures to combat illegal logging and forest clearance inside Protected Areas. Actions can include:
a. Clear boundary demarcation signs and markers socialized with the community.
b. regular patrolling of boundaries using tools like Global Forest Watch to respond to daily deforestation and fire alerts.
c. Protect forest agents and community patrollers by joint mixed brigades composed of law enforcement agents and officers (e.g. Gendarmerie, Police, military, DrEDD, etc.) with Protected area staff to ensure safety and security comes first and enforcement actions will be safe for patrollers.
d. For the most threatened Pas, consider strategically located ranger stations or Command posts (e.g. major access points or where threats are greatest) for patrollers.
2. implement and strengthen legal frameworks such as the code of Protected Areas (COAP) and increase judiciary collaboration (Protected Area managers with prosecutors, judges, lawyers) so that environmental crimes are not taken lightly and the legal system helps deter future environmental crimes.
3. Least concern Protected areas with significant original forest cover lost are ideal sites for major restoration and climate mitigation projects, whereby existing intact forest is not threatened and reforestation can employ local people to recover these important sites.
4. Encourage international donors and supporters to step-up funding for Protected Area managers to enforce protection actions, prioritizing the most Threatened sites.
5. Finally, it is important to constantly monitor forest cover changes and fires inside each Protected Areas. Tools like Global Forest Watch are becoming more accurate and powerful to help Protected Area Managers direct forest agents.
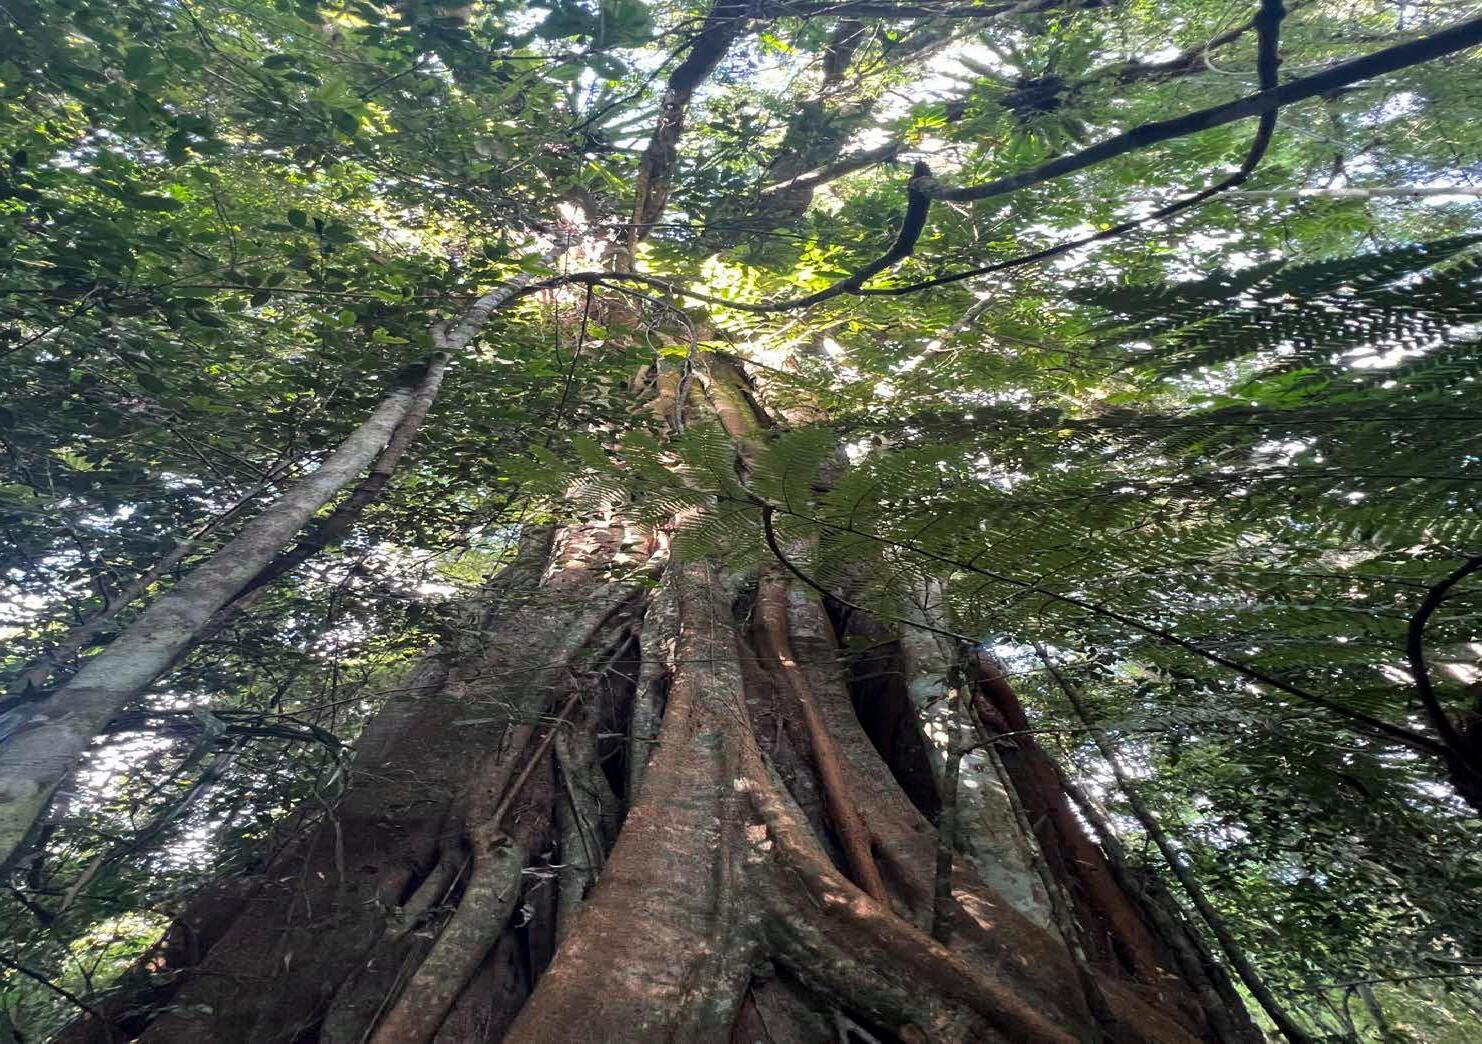
As implementers of conservation action in Madagascar, we must reevaluate our conservation strategies. Some approaches have proven insufficient as highlighted in this Protected Area Outlook.
Conservation efforts must be intensified, innovative solutions developed, and substantial resources allocated to preserve and restore Madagascar's invaluable ecosystems before it is too late.
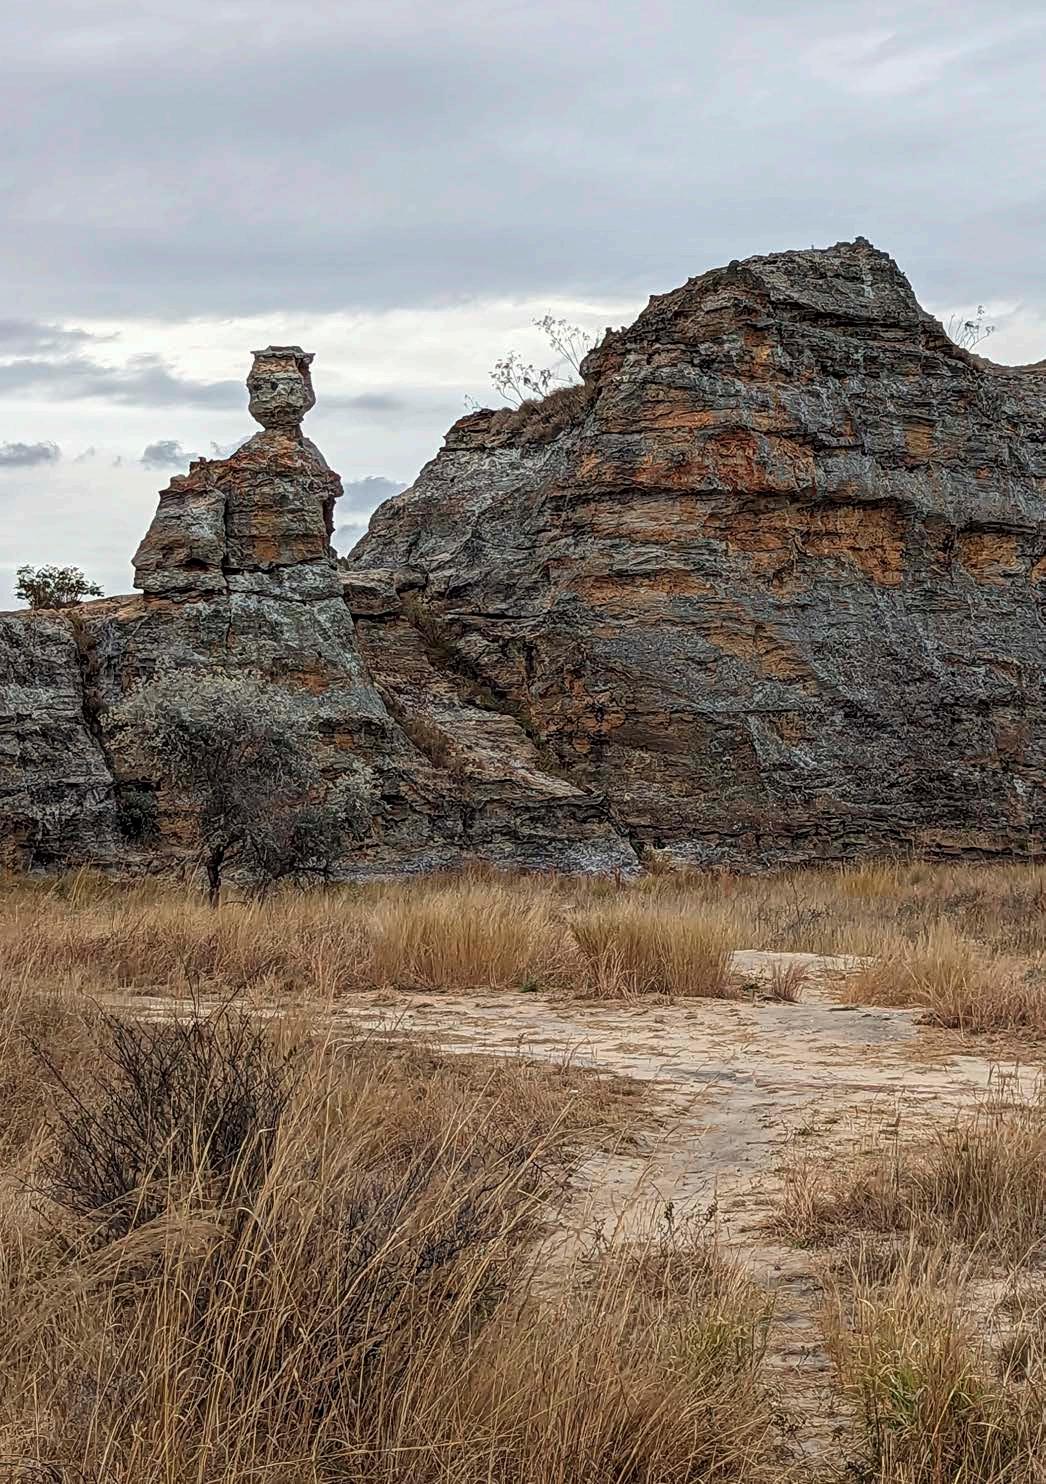

Annex A Ancient or Anthropogenic: The Myth of Natural Grasslands in Madagascar
Editors : Solofo Rakotoarisoa, Tombo Casimir Aly, Aubin Andriajaona, Rostant Andriamalala, Tiana Andriamanana, Solonantenaina Andriamparany, Jean H Bakarizafy, Rodriguez T Belalahy, Angélique Razafindrazoary Decampe, Cyprien Miandrimananana, Edgar Rabevao,Narcisse Rahajanirina, Liva Raharijaona, Emeline, Mahefatiana Ralisata, Christain Nasoavina, Marco Raherison, Andriamihaja Rado Rakotondrabe, Faly N Ranaivoarisoa, Mialy Randria, Voahirana Randriamamonjy, Jean C Raniaina, Faly H Rasoanaivo, Charles Rasolondravoavy, Bako H Ravaomanalina, Mialisoa L Raveloarimalala, Julie H Razafimanahaka, Soary Tahafe, Alain M Tony, Angelo Tianarifidy, and Jorlin Tsiavahananahary.
The degree to which anthropogenic activities have transformed the original, pre-human vegetative composition of Madagascar’s terrestrial ecosystems has increasingly been debated (Bond et al., 2008; Gillson et al., 2023; McConnell & Kull, 2014a, 2014b; myers et al., 2000; Schwitzer et al. 2014; joseph & Seymour, 2024). Early French botanists (Perrier de la Bâthie 1921, 1936; Humbert 1927, 1949, 1955) postulated that forests covered nearly all of Madagascar before the arrival of humans approximately 2,000 years ago. More recently, theories have shifted to center on the conjecture that Madagascar’s largest ecoregion, the malagasy central Highlands (mcH) was dominated by grassland habitat prior to human settlement of the island (Bond et al., 2008; Joseph et al., 2021).
Today, almost 90% of Madagascar is dominated by open “C4” grassland ecosystems (Bond et al., 2008; joseph & Seymour, 2020) that are similar to continental African grasslands. But are these grasslands natural? Should they be protected? and should we stop major efforts to reforest grasslands in the malagasy central Highlands?
r esolution of this debate is crucial for appropriate, functional conservation to be implemented in Madagascar. And while our review of the evidence and conclusions will not close this debate, it is vital to consider the presence or absence of grasslands when we consider original, pre-human vegetative cover as well as present-day forest cover loss.
Grasses (Poaceae family) include over 11,500 species found worldwide, are primarily wind-pollinated, and occur in all habitat types. While best known from open areas, like tropical savannas, there is a high diversity of grasses from woodlands and forest habitats that have speciated to adapt to various microhabitats, such as treefall gaps, landslides, and floodplains. However, for open grassland with C 4 shade-intolerant grass species to dominate landscapes there must be ecological drivers to suppress woody encroachment, such as grazing pressure, fires, and climatic extremes (charlesDominique et al., 2018).
The well-established ecological succession premise is that woody vegetation, such as forest and woodland, is the climax vegetation type across tropical terrestrial landscapes (Gibson & Brown, 1985). Likewise, grasslands are early successional habitats that are replaced by trees over time. However, environmental disturbances and various abiotic and biotic conditions can sustain grasslands.
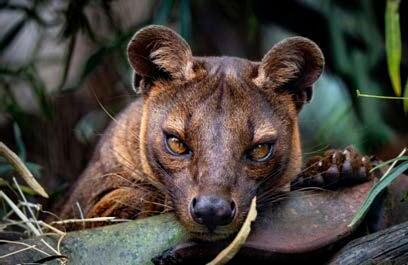
Abiotic factors
Abiotic conditions are important drivers to sustain grassland ecosystems. For example, grasslands prosper in environments with little or sporadic precipitation, low temperatures, high elevations, or extreme topography that cannot sustain soils (Wang et al., 2022).
Madagascar has benefited from millions of years of relative geological stability (no volcanic or major technic activity) while the island is geographically located in the “goldilocks” tropical wet zone with prevailing moisture-laden winds providing seasonal rains across the entire country, especially the highlands.
the mcH has a stable subtropical climate with good seasonal rainfall (generally over 700 to 1600 mm per annum) that is ideal for trees. These climatic conditions are estimated to have dominated Madagascar during the current Holocene interglacial period that has lasted 11,700 years—long before the human colonization of the mcH that took place from approximately 600 A.D. Madagascar is devoid of high mountains (>3,000 meters) and even the driest areas of southwest Madagascar are covered in dense and unique Spiny forest that has adapted to harsh conditions.
Lastly, the potential for natural fires from lightning strikes to sustain grasslands was assessed. the mcH region has the lowest density of lightning strikes in Madagascar with approximately 12 strikes per km2 per year versus the western dry forests with upwards of 64 strikes per km2 per year (https://interactive-lightning-map.vaisala.com/). However, lightning strikes in the highlands are seasonal with rains during the monsoon season, so the chances of large-scale grassland fires igniting
are at a frequency that would not sustain grasslands. instead, nearly 95–99% of fires in the mcH are started by humans (Kull, 2003). Furthermore, intact dry forests of Madagascar that have a much higher density of lightning strikes are largely fire-resistant whereby fires expand where forests have been degraded from anthropogenic activities.
i mportantly, abiotic factors across the malagasy central Highlands cannot sustain grasslands and actually highly suitable for woody vegetation.
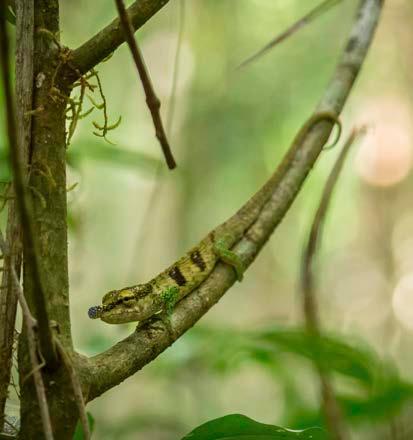
Biotic factors
While abiotic factors are important drivers of grassland ecosystems, the presence of herbivore grazers as ecosystem engineers is critical to sustaining and even expanding grasslands. joseph & Seymour (2020, 2022) assessed the mixed-feeding and obligate grazing guilds of Madagascar and then compared them to grassland guilds of continental Africa. Only three species were potentially obligate grazers that could suppress woody species via intense grazing and/or trampling.
We discuss each here:
1. Malagasy highland pygmy hippopotamus (Hippopotamus madagascariensis) was the largest megaherbivore on the island and known from the central Highlands. Some researchers argued that hippos maintained mcH grasslands prior to human arrival. However, new findings by crowley et al. (2023) and others show that the hippos were not dedicated grazers anywhere on the island. They both browsed and grazed in relatively moist habitats with their diet likely including fruit and foliage, herbs, and both C3 grasses (typically grasses in woodland) and C 4 (typically savanna grasses). Their C4 consumption was higher in relatively wet habitats, but not from grasslands. The hippos’ physiology, particularly their bunodont teeth, was typical for browsers and frugivores rather than grazers, therefore hippos would unlikely suppress woody vegetation. Crowley et al. (2023) also noted if Madagascar was largely forested when ancestral hippos first colonized the island, this could explain their dwarfism as a smaller body size would have been selectively advantageous for hippos that had been adapted to feeding in more open habitats on mainland Africa. Lastly, M. madagascariensis converged morphologically with the more terrestrial, forest-adapted pygmy hippos of Western Africa Choeropsis liberiensis (browsers). t h e ancestral c o mmon Hippo to madagascariensis is a specialist grazer relying heavily on C4 foods.
2. Elephant bird ( Aepyornis hildebrandti) is considered to be associated with woodland and scrubland habitats and was not a C 4 open grassland grazing specialist (Joseph & Seymour, 2022). rather, like the South american rhea, which prefers legumes and other dicots, but also eats seeds, fruits, small vertebrates, invertebrates and tall grasses.
3.
Malagasy Giant Tortoise (Aldabrachelys gigantea) or its close relative would have dominated Madagascar and been one of the first prey items for early humans arriving in Madagascar. Giant tortoises are proven ecosystem engineers on the Galapagos islands, trampling vegetation and suppressing woody vegetation (Gibbs et al., 2020). The species can also occur at high population densities in Aldabra island where surveys found densities of up to 12 individuals per hectare (Gibbs et al., 2020). Giant tortoises are frugivores,mixed-feeding browsers, and grazers with a diverse diet including C3/C4 vegetation and tree fruits that they disperse. At high population densities, giant tortoises can temporarily suppress woody vegetation (Gibbs et al., 2020) but they are vulnerable to significant mortality events from fires which allows trees to then reassert dominance in landscapes. Also during unusually wet periods with an abundance of understory vegetation, tree seedlings can thrive and reassert dominance of potential grassland landscapes.
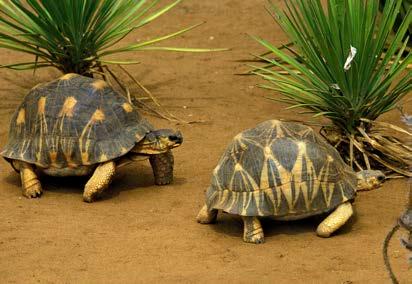
Even if all three of these species were collectively browsing and grazing in the mcH, isotopic analyses have repeatedly refuted dedicated, or even primary, C4 grass consumption by hippos and other herbivorous vertebrates (Crowley et al., 2021; Crowley & Godfrey, 2013; Godfrey & Crowley, 2016; Hansford & turvey, 2022; Hixon et al., 2021).
Missing evidence of ancient grasslands in Madagascar
Madagascar is an ancient island roughly 88 million years old with evolutionary highly distinct biodiversity found across all habitats. However, this is a glaringly obvious lack of endemic fauna that are grassland specialists (or even grassland compatible) which would support the natural presence of grassy biomes. Moreover, despite anthropogenic actions and introduced zebu-sustaining C4 grassy biomes in Madagascar today, mcH grasslands are totally dominated by three fire-adapted, non-endemic grass species (Loudetia simplex, Trachypogon spicatus, and Schizachyrium sanguineum; Joseph, et al., 2023).
Overall
Evidence demonstrates that when the first human colonists arrived in the Malagasy central Highlands that this biome was totally dominated by forests and woodlands. The idea that the region was covered in trees is also from historical evidence from recent centuries that showed the extent of forest in this region was far higher than present-day.
it is likely that during glacial periods conditions were more likely to be suitable for savannas to exist in the mcH and hence the presence of some relict C4 species. However, there is evidence to show that fire and grazing did not establish grasslands over ecological and evolutionary timescales in Madagascar.
The accurate and comprehensive understanding of Madagascar’s historical forest and woodland cover and its subsequent reduction is of paramount importance. i t fundamentally alters our perception of the magnitude of forest loss, the gravity of the situation, and, consequently, the urgency of current conservation initiatives.
The implications of this revised understanding are far-reaching:
█ Ecological impact: the loss of over 90% of forests and wooded areas has and will continue to result in a profound loss of biodiversity including unprecedented endemic species extinctions, wide-reaching habitat fragmentation, and catastrophic disruption to ecological processes.
█ Climate impact: The extensive deforestation of Madagascar’s forests will continue to contribute significantly to regional climate change and increased carbon emissions.
█ Socioeconomic impact: understanding the true extent of forest loss provides crucial context for addressing the socioeconomic drivers of deforestation and developing sustainable alternatives for local communities.
After reviewing the evidence proposed by advocates of grassland habitats in Madagascar, we categorically dismiss those theories and support the idea that the Malagasy Central Highlands were 98% forested when humans first colonized the island.
Outlook References and Bibliography
a ndriamampianina, j . (1987). Statut des parcs et réserves de madagascar. in r a mittermeier, L.H. rakotovao, v randrianasolo, E.j. Sterling, & D.Devitre (Eds.), Priorités en Matière de Conservation des Espèces à Madagascar (pp. 27–30), iucN, Gland, Switzerland.
Bond, W.j , Silander jr, j a , ranaivonasy, j , & ratsirarson, j (2008). The antiquity of Madagascar’s grasslands and the rise of C4 grassy biomes. Journal of Biogeography , 35 , 1743–1758. https://doi. org/10.1111/j.1365-2699.2008.01923.x
chang, c c & tur ner, B.L. (2019). Ecological succession in a changing world. Journal of Ecology, 107(2), 503–509.
Charles-Dominique, T., Midgley, G.F., Tomlinson, K.W., & Bond, W.J. (2108). Steal the light: shade vs fire adapted vegetation in forest-savana mosaics. New Phytologist, 218, 1419–1429.
c rowley, B.E. & Godfrey, L. r . (2013). Why all those spines? Anachronistic defences in the Didiereoideae against now extinct lemurs. South African Journal of Science, 109(1/2), 7. http://dx.doi. org/10.1590/sajs.2013/1346
crowley, B.E., Godfrey, L.r., Hansford, j.P., & Samonds, K.E. (2021). Seeing the forest for the trees-and the grasses: revisiting the evidence for grazer-maintained grasslands in Madagascar’s Central Highlands. Proceedings of the Royal Society B., 288 , 20201785. https://doi.org/10.1098/rspb.2020.1785
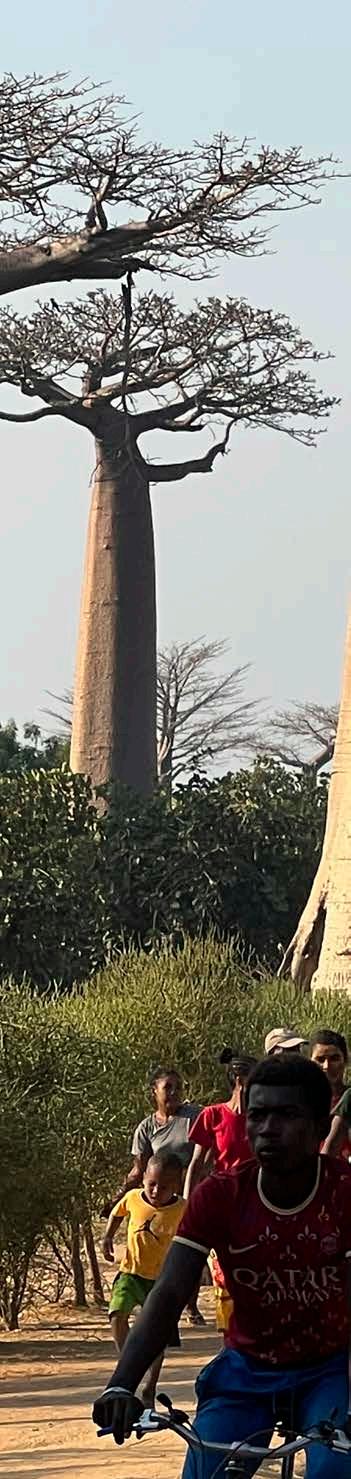
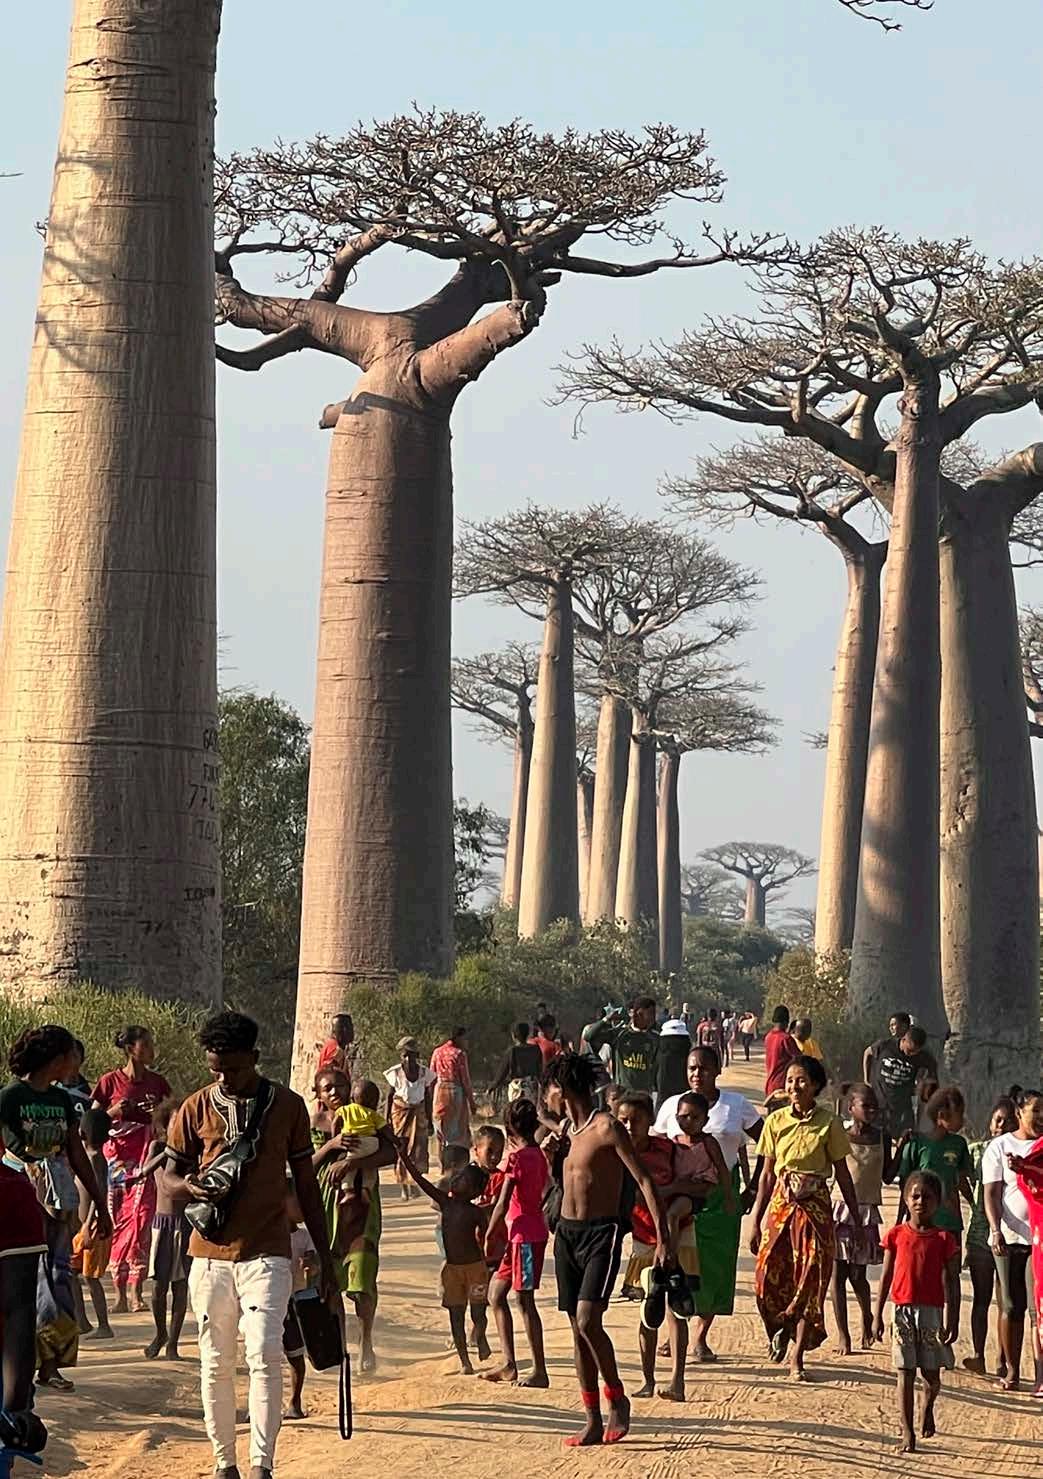
crowley, B.E., Godfrey, L. r., & Samonds, K.E. (2023). What can hippopotamus isotopes tell us about past distributions of C4 grassy biomes on Madagascar? Plants People Planet , 5 (6), 997–1010. https://doi.org/10.1002/ppp3.10402
Eklund, j., jones, j., räsänen, m., Geldmann, j ., j okinen, a -P., Pellegrini, a ., r akotobe, D., rakotonarivo, O.S., toivonen, t., & Balmford, a (2022). Elevated fires during cOviD-19 lockdown and the vulnerability of protected areas. Nature Sustainability , 5 , 1–7. https://doi.org/10.1038/ s41893-022-00884-x
Gade, D.W. (1996). Deforestation and its effects in Highland madagascar. Mountain Research and Development, 16(2), 101–116.
Gibbs, j.P., cayot, L.j., & tapia, W. (Eds.). (2020). Galapagos Giant Tortoises. Academic Press.
Gibson, c .W.D. & Brown, v.K. (1985). Plant succession: Theory and applications. Progress in Physical Geography: Earth and Environment, 9 (4), 473–493. https://doi. org/10.1177/030913338500900401
Gillson, L., r azanatsoa, E., r azafimanantsoa, a.H.i., v irah-Sawmy, m., & Ekblom, a. (2023). The role of palaeoecology in reconciling biodiversity conservation, livelihoods and carbon storage in Madagascar. Frontiers in Conservation Science , 4, 1286459. https://doi.org/10.3389/ fcosc.2023.1286459
Godfrey, L. r . & c rowley, B.E. (2016). Madagascar’s ephemeral palaeo-grazer guild: Who ate the ancient C4 grasses? Proceedings of the Royal Society B., 283, 20160360. https://doi. org/10.1098/rspb.2016.0360
Green, m. & Sussman, r. (1990). Deforestation history of the eastern rain forests of Madagascar from satellite images. Science, 248, 212–215.
Guichon, a. (1960). La superficie des formations forestières de Madagascar. Revue Forestière Française, 6, 408–411.
Hansen, m c .P. v., Potapov, r ., m oore, m ., Hancher, S. a ., turubanova, a ., tyukavina, D., thau, S.v., Stehman, S.j., Goetz, t.r., Loveland, a., Kommareddy, a., Egorov, chini, L., justice, c .O., & townshend, j r .G. (2013). Highresolution global maps of 21 st-century forest cover change. Science, 342, 850–853. Data available on-line from: http://earthenginepartners.appspot.com/science-2013-global-forest Accessed through Global Forest Watch on 12/11/2024. www.globalforestwatch.org
Hansford, j.P. & turvey, S.t (2022). Dietary isotopes of Madagascar’s extinct megafauna reveal Holocene browsing and grazing guilds. Biology Letters, 18, 20220094. https://doi.org/10.1098/ rsbl.2022.0094
Harper, G.j., Steininger, m.K., tucker, c.j., juhn, D., & Hawkins, F. (2007). Fifty years of deforestation and forest fragmentation in Madagascar. Environmental Conservation, 34(4), 325–333.
Hixon, S.W., Douglass, K.G., c rowley, B.E., r a kotozafy, L. m a , c l ark, G., a n derson, a , Haberle, S., r anaivoarisoa, j .F., Buckley, m ., Fidiarisoa, S., mbola, B., & Kennet, D.j. (2021). Late Holocene spread of pastoralism coincides with megafauna extinction on Madagascar. Proceedings of the Royal Society B, 288, 20210204. https://doi. org/10.1098/rspb.2021.1204
Humbert, H. (1927). Principaux aspects de la végétation à Madagascar: La destruction d’une flore insulaire par le feu. Mémoires de l’Académie Malgache, Fascicule v.
Humbert, H. (1949). La dégradation des sols à Madagascar. Mémoires de l’Institut de Recherche Scientifique de Madagascar, vol D1, N°1 : 33–52.
Humbert, H. (1955). Les territoires phytogéographiques de Madagascar: Leur cartographie. Année Biologique, 31, 439–448.
joseph, G.S., rakotoarivelo, a r., & Seymour, c .L. (2021). How expansive were m alagasy c e ntral Highland forests, ericoids, woodlands and grasslands? A multidisciplinary approach to a conservation conundrum. Biological Conservation, 261 , 109282. https://doi. org/10.1016/j.biocon.2021.109282
joseph, G.S., rakotoarivelo, a r., & Seymour, C.L. (2023). A review of Madagascar’s derived grasslands following anthropogenic fires may threaten food security. Plants People Planet, 3, 1–12. https://doi.org/10.1002/ppp3.10408
j oseph, G.S. & Seymour, c .L. (2020). Madagascan highlands: originally woodland and forest containing endemic grasses, not grazing-adapted grassland. Proceedings of the Royal Society B, 287 , 20201956. http://dx.doi. org/10.1098/rspb.2020.1956
j oseph, G.S. & Seymour, c .L. (2022). a re Madagascar’s obligate grazing-lawns ancient and evolved with endemic herbivores, or recently selected by introduced cattle? Biology Letters, 18, 20220212. https://doi.org/10.1098/rsbl.2022.0212
j oseph, G.S. & Seymour, c .L. (2024). Commentary: The role of palaeoecology in reconciling biodiversity conservation, livelihoods, and carbon storage in Madagascar. Frontiers in Conservation Science , 5, 1389498. https://doi. org/10.3389/fcosc.2024.1389498
Kull, C.A. (2003). Fire and the management of highland vegetation. i n S. Goodman & j . Benstead (Eds.), Natural History of Madagascar, pp. 153–157, university of chicago Press.
McConnell, W.J. & Kull, C.A. (2014a). Deforestation in Madagascar: Debates over the island’s forest cover and challenges of measuring forest cover. in i r. Scales (Ed.), Conservation and Environmental Management in Madagascar (pp. 67–104), routledge.
McConnell, W.J. & Kull, C.A. (2014b). Protecting lemurs: Madagascar’s Forests. Science, 344 (6182), 358. https://doi.org/10.1126/ science.344.6182.358a
moat, j. & Smith, P. (2007). atlas of the vegetation of madagascar. royal Botanic Gardens Kew.
m yers, N., m ittermeier, r . a ., m ittermeier, C.G., da Fonseca, G.A.B., & Kent, J. (2000). Biodiversity hotspots for conservation priorities. Nature, 403, 853–859.
Naidoo, K. & Loot, C. (2020). Madagascar. Energy and the poor: unpacking the investment case for clean energy. uN capital Development Fund (uNcDF). https://www.undp.org/sites/g/ files/zskgke326/files/publications/uNDP-uNcDFmadagascar-Energy-and-the-Poor.pdf
Perrier de la Bâthie, H. (1921). La végétation Malgache. Annales du Musée Colonial de Marseille, 3(9), 1–266.
Perrier de la Bâthie, H. (1936). Biogéographie des plantes de Madagascar. Société d’Editions Géographiques, Maritimes et Coloniales.
r afanoharana, S. c ., a ndrianambinina, F.O.D., rasamuel, H.a., Weaber, P.O., Ganzhorn, j u., & Wilmé, L. (2023). Tree canopy density thresholds for improved forests cover estimation in protected areas of Madagascar. Environmental Research Communications , 5 , 071003. https:// doi.org/10.1088/2515-7620/ace87f
r ichard, a . (2022) t he sloth lemur’s song: Madagascar from the deep past to the uncertain present. university of chicago Press.
Schwitzer, c., mittermeier, r a., johnson, S.E., Donati, G., irwin, m., Peacock, H., ratsimbazafy, j., razafindramanana, j., Louis jr., E.E., chikhi, L., colquhoun, i c , tinsman, j , Dolch, r , LaFleur, m ., Nash, S., Patel, E., r andrianambinina, B., r asolofoharivelo, t., & Wright, P. c . (2014). Averting lemur extinctions amid Madagascar’s political crisis. Science, 343, 842–843.
vieilledent, G., Grinand, c , rakotomalala, F.a , r anaivosoa, r ., r akotoarijaona, j - r ., a llnutt, T., & Achard, F. (2018). Combining global tree cover loss data with historical forest cover maps to look at six decades of deforestation and forest fragmentation in Madagascar. Biological Conservation , 222 , 189–197. https://doi. org/10.1016/j.biocon.2018.04.008
Wang, y , Liu, B., Zhao, j , ye, c , Wei, L., Sun, J., Chu, C., & Lee, T.M. (2022). Global patterns and abiotic drivers of ecosystem multifunctionality in dominant natural ecosystems. Environment International, 168, 107480. https:// doi.org/10.1016/j.envint.2022.107480
Weaber, P.O., r afanoharana, S. c ., r asamuel, H.a., & Wilmé, L. (2019). Parks and reserves in Madagascar: Managing biodiversity for a sustainable future. in a.N. Bakar & m.N. Suratman (Eds.), Protected areas, national parks and sustainable future https://doi.org/10.5772/ intechopen.85348
u NEP-W cmc (2024). Protected area profile for velondriake from the World Database on Protected Areas, November 2024. Available at: www.protectedplanet.net
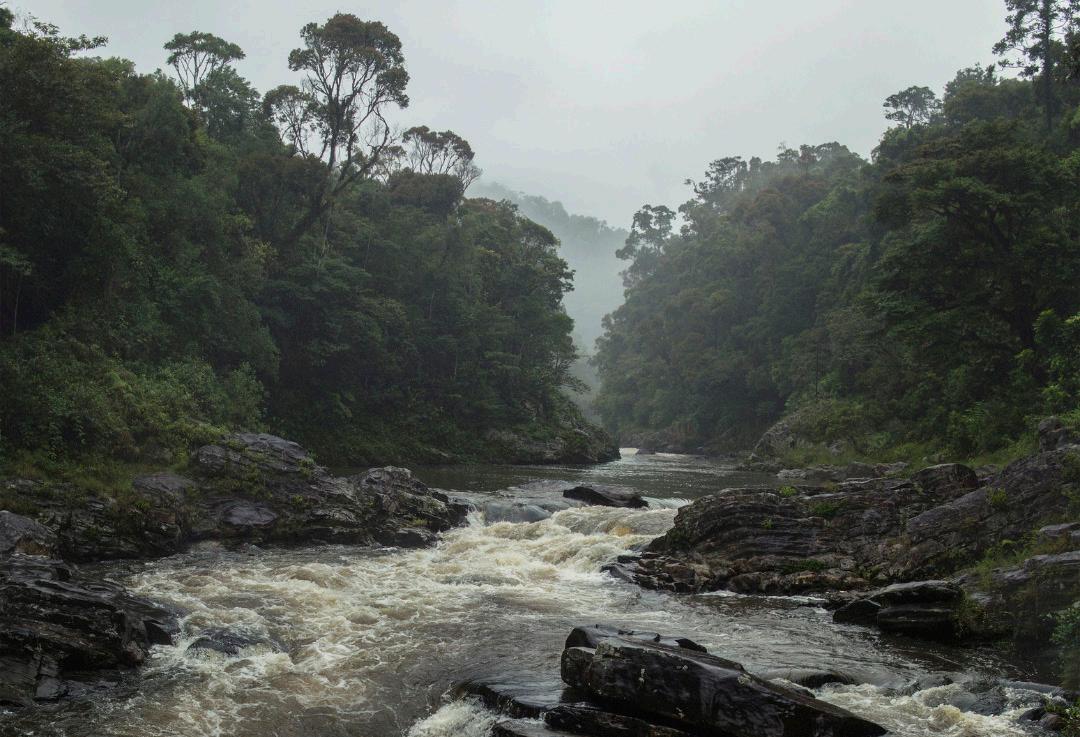
Madagascar Protected Area consortium partners:


Published by: Madagascar Protected Area consortium partners
Supported by: