September 2025
Sally Ayuk, MS Transportation Equity Senior Research Fellow

September 2025
Sally Ayuk, MS Transportation Equity Senior Research Fellow


Place-based factors play a major role in shaping social inequalities. The places or locations where people live, work, and spend their free time directly impact their health, well-being, and opportunities. 1,2,3 A key part of this story is the role of “third places,” informal, welcoming spaces outside of the home (the “first place”) and the workplace (the “second place”). 4 Parks, libraries, coffee shops, gyms, and other gathering spots allow people to connect, build relationships, and strengthen social networks. These spaces are not just leisure spots; they offer access to essential services, support mental health, and foster a sense of belonging, especially for historically marginalized groups. 5,6,7,8
Yet, access to third places is not evenly distributed. For individuals facing economic hardship, the lack of nearby community spaces can make it challenging to establish social connections or maintain mental and physical well-being. Transportation is a critical link between people and these spaces. 9 When third places are not within walking distance for residents, access to a car or reliable public transit becomes essential. Transportation inequities, rooted in historical and racial injustice, often prevent low-income communities and communities of color from reaching these vital spaces.
1 Entwisle, B. (2007). Putting people into place. Demography, 44(4), 687-703.
2 Lobao, L. M., Hooks, G., & Tickamyer, A. R. (2007). Advancing the sociology of spatial inequality. The sociology of spatial inequality, 1-28.
3 Galster, G., & Sharkey, P. (2017). Spatial foundations of inequality: A conceptual model and empirical overview. RSF: The Russell Sage Foundation Journal of the Social Sciences, 3(2), 1-33.
4 Sociologist Ray Oldenburg first coined the term “third places” in his 1999 book The Great Good Place, describing these spaces as essential for community life and individual well-being.
5 Oldenburg, R. (1999). The great good place: Cafes, coffee shops, bookstores, bars, hair salons, and other hangouts at the heart of a community. Da Capo Press.
6 Low, S. (2020). Places to feel at home: The important role of third spaces.
7 Small, M. L. (2006). Neighborhood institutions as resource brokers: Childcare centers, interorganizational ties, and resource access among the poor. Social Problems, 53(2), 274-292.
8 Walton, E. (2014). Vital places: facilitators of behavioral and social health mechanisms in low-income neighborhoods. Social Science & Medicine, 122, 1-12.
9 Erickson, L. D., Call, V. R., & Brown, R. B. (2012). SOS—satisfied or stuck, why older rural residents stay put: Aging in place or stuck in place in rural Utah. Rural Sociology, 77(3), 408-434.
The COVID-19 pandemic and the rise of virtual spaces have further complicated matters, prompting many to retreat from public life altogether. However, investing in public and alternative transportation like biking, walking and micromobility; thoughtful urban planning; and public health initiatives prioritizing access to third places is more important than ever. These efforts are crucial for fostering strong social ties, reducing health disparities, and connecting people from diverse backgrounds and neighborhoods.
This report focuses on transportation disparities in three of the largest majority-Black cities in the U.S.—Detroit, Michigan (Midwest); Philadelphia, Pennsylvania (Northeast); and Houston, Texas (Southwest)—highlighting how challenges such as limited public transit options and car dependency restrict access to third places and, in turn, impact residents’ mental health.10 These cities were selected for their significant Black populations and regional diversity, offering a comparative lens on how geography, transportation systems, and urban development shape health and social outcomes. While the focus is on these three cities, the challenges they illustrate are common nationwide, offering insights applicable to other communities facing similar infrastructure and access issues. When cities ensure equitable transportation and access to third places, they strengthen social ties, support mental health, and build more resilient communities. This report highlights the barriers and outlines policy paths toward more just and inclusive cities.
10 Estimated percent of all people who were Black or African American, between 2018-2022. PolicyMap, https://plcy.mp/2yhF7BFw (based on data from Census; Accessed 19 December 2024).
Some third places are free as shown in Table 1. The “Free and Publicly Available” category encompasses spaces that are generally open to the public without charge and are often supported by public funds or community organizations. Others require a small payment. The “Affordable” category comprises spaces that typically require a modest fee, purchase, or membership but are still relatively accessible to a broad range of socioeconomic groups. Lastly, the third category comes with high price tags. The “Expensive” category encompasses spaces where access often entails significant costs, thereby making them less accessible to low- and moderate-income residents. This classification illustrates how financial barriers can shape who can access various third places and the social benefits they offer. Most people rely on ‘Affordable’ third places like barbershops and cafés for everyday needs, while ‘Expensive’ places require higher costs and are used less frequently.
Category
Free and Publicly Available
Examples of Third Places
Community centers, gardens, libraries, parks, picnic sites, places of worship, playgrounds, sports fields, trailheads
Affordable Art centers, automobile clubs, barbershops, bars, beaches, beauty salons, bookstores, bowling centers, café, campgrounds, food courts, garden centers, ice skating rinks, laundries, mall marker places, museums, pool halls, pubs, restaurants, shopping centers, tennis courts, theatres, zoos
Expensive
Amusement parks, aquariums, casinos, cinemas, dancing, golf courses, golf range, nightlife, theme parks, wild animal parks, wineries
Note: The free and publicly available categories are assumed to be free in all three cities (Detroit, Philadelphia, and Houston).
Based on the categorization of third places as shown in Figure 1, the distribution by cost is as follows:
• Detroit: 48% free and publicly available, 37% affordable, and 15% expensive. Nearly half of Detroit’s third places are free and publicly available, suggesting greater accessibility for lower-income residents. Cities with a higher share of free and publicly available third places (e.g., Detroit) offer more accessible social spaces.
• Philadelphia: 38% free and publicly available, 46% affordable, 16% expensive. Philadelphia has a more balanced distribution, with the largest share in the affordable cost category.
• Houston: 31% free and publicly available, 50% affordable, 19% expensive. Houston has the highest proportion of expensive third places (19%) among the three cities, potentially signaling economic stratification in social spaces. In contrast, cities with a greater share of expensive third places (e.g., Houston) may face challenges in ensuring inclusive social spaces for all income levels.
FREE AND PUBLICLY AVAILABLE
Churches are the anchor in all three cities, at 76% of free third places in Detroit, 59% in Philadelphia, and 69% in Houston.
Parks come next at 13% in Detroit, 21% in Philadelphia, and 17% in Houston.
Libraries round out the top three, with 7% in Detroit and Houston, and 15% in Philadelphia.
Barbershops lead in Detroit and Houston at 35%, with Philadelphia slightly lower at 26%.
Restaurants follow with 26% in Detroit, 23% in Philadelphia, and 22% in Houston.
Bookstores and bars rank third at 8% in Detroit, Bookstores at 11% in Philadelphia, and Shopping Centers at 9% in Houston.
Nightlife dominates Detroit at 72%, Philadelphia at 60%, and Houston at 58%
Dancing comes next at 14% in Detroit, 27% in Philadelphia, and 24% in Houston.
Cinemas trail behind at 5% in Detroit, 6% in Philadelphia, and 8% in Houston.
• Detroit has the highest share of census tracts without third places (17%), which could indicate social isolation in some neighborhoods.
• Philadelphia has the best spatial distribution, with only 10% of tracts lacking third places.
• Despite having the largest number of third places, 13% of tracts in Houston have no third places, likely due to its sprawling geography.
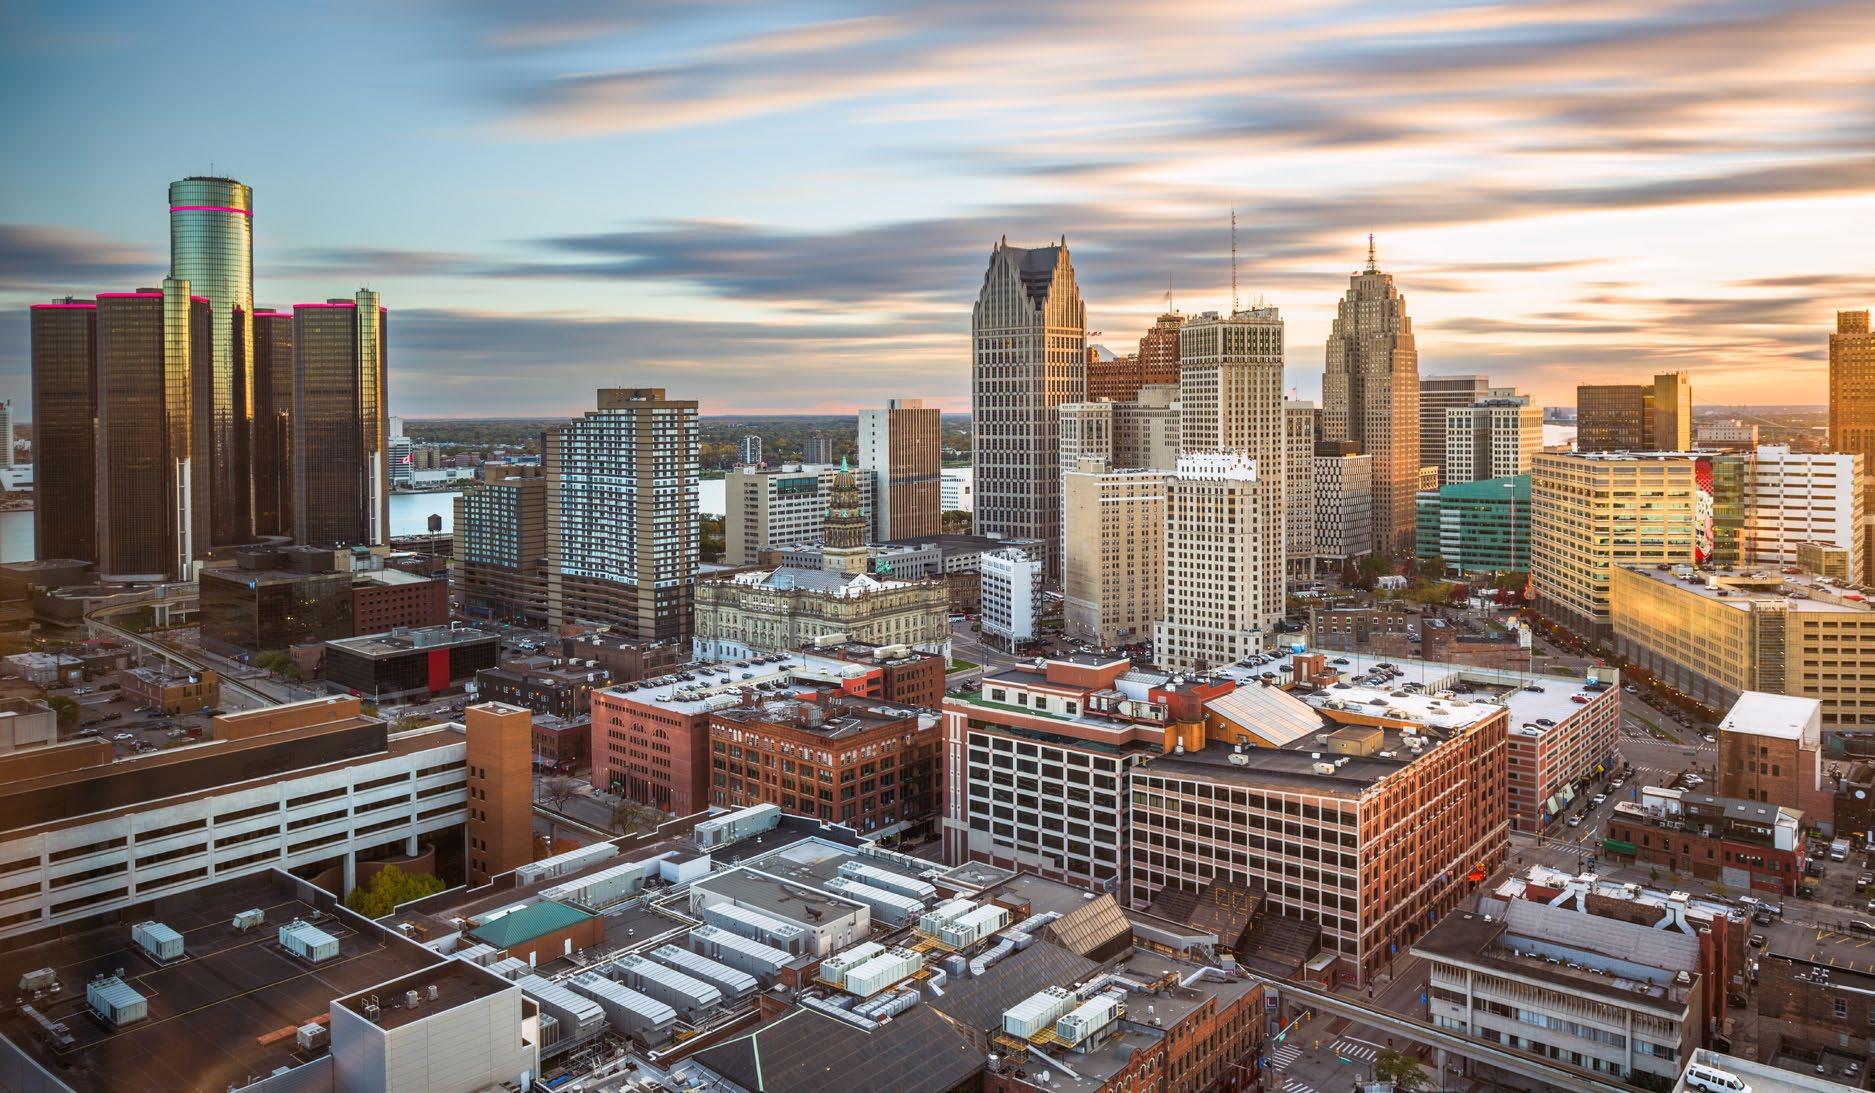
MIDTOWN, DETROIT: A WALKABLE HUB OF SOCIAL INFRASTRUCTURE
Midtown stands out for its walkable, mixed-use design and intentional cultivation of third places. Anchored by Wayne State University, the Detroit Public Library Main Branch, the Detroit Institute of Arts Museum, and local hubs like the Hub of Detroit and Back Alley Bikes, the area seamlessly blends civic, cultural, and commercial life. Independent coffee shops, barbershops, galleries, and social enterprises, including The Commons, a hybrid café, laundromat, and community space, foster everyday social interaction across racial and socioeconomic lines. Reflecting this diversity, the neighborhood is home to a population that is approximately 48% African American, 33% White, 10% Asian, 5% multiracial, and 4% Hispanic. Midtown demonstrates how reinvestment in urban corridors can foster inclusive environments that cater to diverse community needs.
Spanning nearly fifteen square miles, West Philadelphia has long been a site of both cultural vitality and structural disinvestment. Despite the impacts of redlining and the destruction of areas like Black Bottom once home to a thriving Black neighborhood known for its bustling business district, jazz scene, and strong community ties. Black-owned barbershops, salons, halal markets, and restaurants along the 52nd Street Corridor and Baltimore Avenue, serve as vital gathering spaces. Public institutions, such as Blackwell Regional Library, and local churches foster social connections, while grassroots efforts from the Enterprise Center and Urban Art Gallery support entrepreneurship and cultural continuity. In areas like Cedar Park, a vibrant mix of cafés, bookstores, and public parks reinforces West Philly’s legacy as a third-place ecosystem that fosters connections across generations.
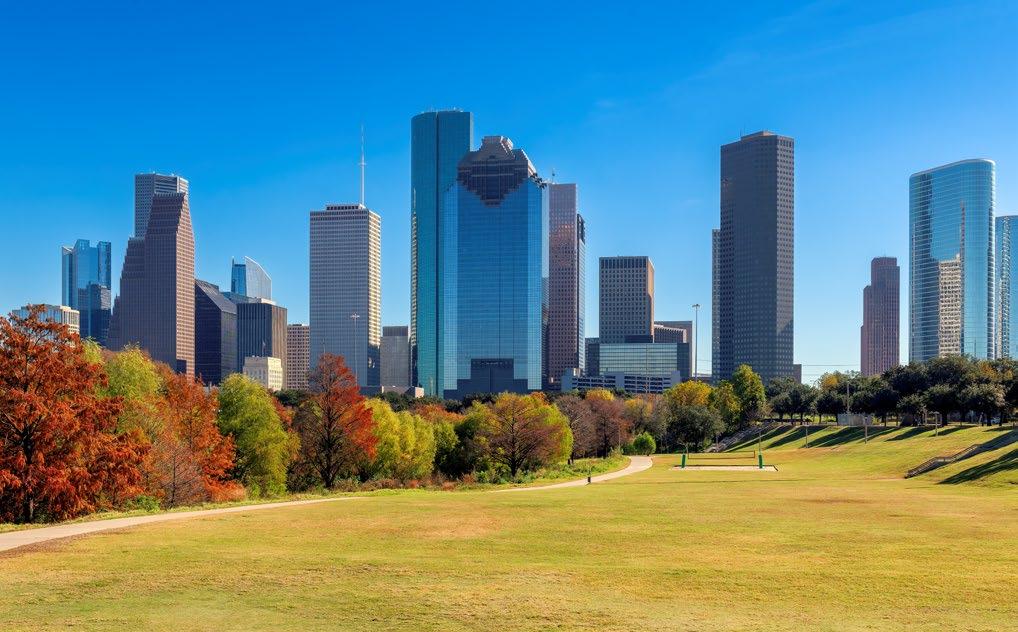
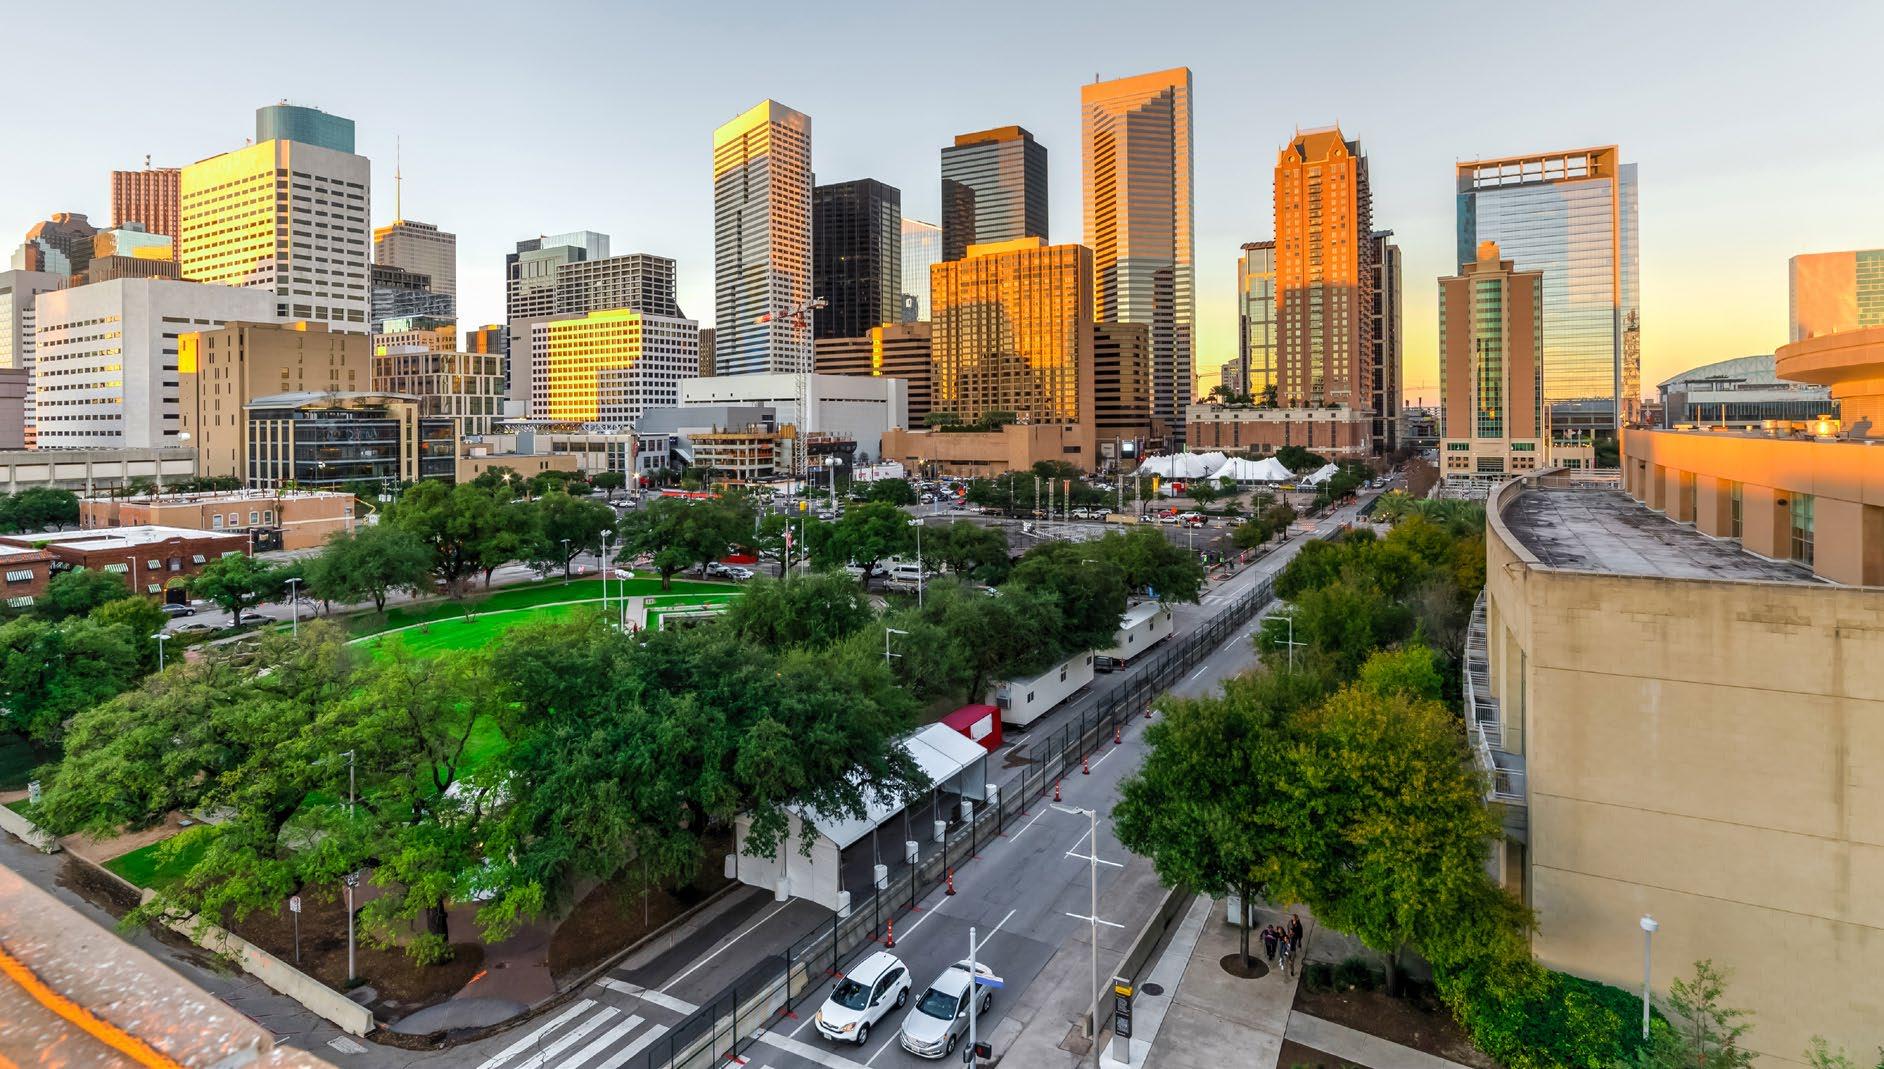
Located just southeast of Downtown Houston, Third Ward is one of the city’s most historic and culturally significant African American neighborhoods. With a population that is over 70% African American, Third Ward has long served as the heart of Black civic, cultural, and intellectual life in Houston, anchored by vital third places such as Texas Southern University, the University of Houston, historic churches, and Emancipation Park, a 10-acre space purchased by formerly enslaved residents in 1872 and fully renovated in 2017. It remains a powerful symbol of community resilience and celebration, particularly around Juneteenth. Civic institutions, such as the S.H.A.P.E. Community Center, the Urban League, the Houston Defender a leading Black news source, and the state’s only Black-owned bank, UNITY, have historically utilized physical gathering spaces to promote education, entrepreneurship, and civil rights.
The accessibility of third places is not just about how many exist, but about whether people can safely reach them, afford to use them, and feel a sense of belonging. Proximity does not guarantee access if transit systems are unreliable and sidewalks are missing. Transportation can transform a nearby library into a community asset or a distant, unattainable service. Here is how each city compares when examining third-place density, availability for every resident, and proximity to transit.
PHILADELPHIA: HIGH DENSITY, STRONG TRANSIT, AND WALKABILITY
• Most third places per square mile: With 32.5 third places in each square mile, Philadelphia has the densest network of social spaces among the three cities.
• Most per capita access: With 3.5 third places for every 1,000 residents, residents enjoy many options for gathering, connecting, and engaging in community life.
• Closest to transit: Transit stops are within a 3-minute walk on average (0.15 miles). This close access makes public transportation a practical option for people of all ages and incomes, reinforcing walkability and ensuring equitable mobility across neighborhoods.
DETROIT: MODERATE DENSITY, REASONABLE REACH, UNEVEN SPREAD
• Middle in density: Detroit has 14.5 third places per square mile, reflecting moderate availability but with notable gaps in underserved neighborhoods.
• Comparable per capita access: The city offers 3.3 third places for every 1,000 residents, indicating fair access overall.
• Transit within reach: While most residents live within walking distance of a transit stop, small barriers, such as snow, broken sidewalks, or unsafe streets, can make the average 5-minute walk more difficult. These obstacles especially affect seniors, people with disabilities, and caregivers, limiting reliable access despite physical proximity.
• Lowest density: With just 5.8 third places in each square mile, Houston reflects the spatial challenges of urban sprawl.
• Least per capita access: Residents have access to just 2.2 third places for every 1,000 residents, the lowest of the three cities.
• Furthest from transit: The average distance to a transit stop in Houston is 0.32 miles, or approximately a 6 or 7-minute walk. While still within walking range, this exceeds the widely accepted 0.25-mile (5-minute) threshold often used as a benchmark for how far most people are willing to walk before choosing to drive. In a car-centric city with limited pedestrian infrastructure, even short walks can be inconvenient or unsafe. As a result, many residents, especially those without access to cars, are effectively cut off from public transportation and community connectivity.
The Justice40 Initiative, launched by President Joe Biden in 2021, represented a landmark federal commitment to addressing environmental and economic injustices in historically marginalized communities. It aimed to ensure that 40% of the benefits from key federal investments, such as climate change mitigation, clean energy, affordable housing, and pollution reduction, would flow to disadvantaged communities, many of which face deep structural barriers to accessing third places. Established by Executive Order 14008 and reinforced by Executive Order 14096, Justice40 marked a fundamental shift in how the federal government approached equity, especially for Black and brown communities disproportionately burdened by environmental hazards and underinvestment. However, the rescission of these executive orders under the Trump administration highlights the fragility of progress and the continued uneven distribution of the benefits of urban growth.
From Figure 2, Detroit’s overwhelming 87% disadvantaged population, which meets specific federal criteria related to high burdens of pollution, socioeconomic hardship, or underinvestment, typically defined through the Climate and Economic Justice Screening Tool, illustrates how social and economic exclusion compounds spatial barriers. This level of need calls for federally guided, locally implemented revitalization efforts, including third-place access via multi-modal transportation and infrastructure investment. Philadelphia’s significant disadvantage areas (56% disadvantaged, 44% non-disadvantaged) results in uneven access to transportation and third places, restricting social engagement and the mental health benefits those spaces provide. In contrast, Houston has a nearly equal split (49% disadvantaged, 51% non-disadvantaged), suggesting more balanced access. However, Houston also reflects the tensions between growth and equity in sprawling urban environments. Without strategic investment in third-place access, this balance risks tipping toward deeper exclusion.
While Detroit offers a relatively high share of free third places, its spatial gaps and uneven accessibility present challenges, especially in neighborhoods without any third places.
• Improve Mobility to Foster Social Belonging: With an overwhelming 87% of the population classified as disadvantaged and 17% of tracts lacking third places, Detroit requires targeted investments in sidewalk repairs, lighting, and snow removal to create safe, year-round pathways to nearby social spaces. Launch flexible shuttle programs that connect isolated neighborhoods to cultural, religious, and recreational third places, especially for youths, seniors, and caregivers.
• Leverage Churches as Access Anchors: With churches comprising 76% of Detroit’s free third places, city partnerships with faith-based organizations can transform these sites into broader community resource hubs that strengthen trust and reduce isolation.
Philadelphia has excellent transit and walkability, but with 46% of third places falling into the “affordable” category, rising costs could reduce access for low-income residents.
• Promote Social Inclusion Through Local Subsidies: Offer targeted affordability programs, such as museum passes, discounted café vouchers, and barbershop subsidies, in high-poverty neighborhoods. These small grants preserve access to culturally important third places and prevent quiet exclusion from everyday social life.
• Activate Trusted Public Spaces as Equity Engines: Extend hours and diversify programming in libraries and parks to include youth mentorship, mental health support, and community storytelling nights. These efforts build cross-generational connections and reduce isolation.
Houston’s low density, poor transit proximity, and high share of expensive third places (19%) create significant access barriers for low- and moderate-income groups.
• Reclaim Underused Space for Belonging: Transform vacant lots near transit into free, multi-use community hubs that combine gardens, playgrounds, and cultural gathering areas. Focus on neighborhood-led designs that reflect local identity and promote intergenerational social bonding.
• Bridge the Last Mile to Connection: Build protected walking and biking paths within a 0.25–0.5 mile radius of third places. These social access corridors are especially critical in a sprawling city like Houston, as they bridge the gap between proximity and accessibility.
Access to third places is not just a question of quantity, it is a question of equity. As cities like Detroit, Philadelphia, and Houston strive to foster a sense of belonging, connection, and wellbeing, they must recognize that spatial availability alone does not ensure inclusion. Transportation, affordability, and coordinated investment through local planning, community initiatives, or federal efforts, such as Justice40, ultimately shape whether a park or a barbershop becomes a lifeenhancing anchor or remains a missed opportunity. For historically marginalized communities, third places serve as critical spaces for mental health, social cohesion, and economic opportunity. But to realize their full potential, these places must be accessible, welcoming, and equitably distributed. The broader political environments in these cities also affect their ability to achieve these goals. Houston, for example, faces the tension of a Democratic mayor working within a state led by a Republican governor and legislature, which may limit funding and supportive policy for equity-focused investments. Philadelphia, with a Democratic mayor and governor but a swing-state electorate that recently supported Trump, faces unpredictable shifts in political will and resources. Detroit has a Democratic mayor and governor but also saw statewide swings toward Republican leadership in 2024, highlighting how local efforts can be complicated by state-level shifts. Reimagining access means investing not just in benches and bus stops, but in belonging. Cities must commit to just access, ensuring every resident, regardless of income, ZIP code, or race, has a place to feel seen, supported, and connected.
Caliper Corporation. (2024). Business Locations by Category [GIS dataset]. Included with Maptitude 2024. Caliper Corporation.
Distance to nearest transit stop in 2021. PolicyMap, https://plcy.mp/2RxD19lw (based on data from EPA Smart Location Database; Accessed 13 October 2024).
Jake Blumgart. (2017). West Philadelphia. Rutgers University. The Encyclopedia of Greater Philadelphia. https://philadelphiaencyclopedia.org/locations/west-philadelphia/ Visit Midtown. (n.d.). Midtown Detroit. https://visitmidtown.com/around-the-corner/.

