January 2026
Sally Ayuk, PhD, Transportation Equity Senior Research Fellow
January 2026
Sally Ayuk, PhD, Transportation Equity Senior Research Fellow


Beginning January 1, 2027, Medicaid eligibility will expand beyond income prerequisites to include a work and community engagement requirement of at least 80 hours per month through employment, workforce training, community service, part-time education, or a combination of these activities. However, states may begin implementation before 2027. This change, established under Section 71119 of the One Big Beautiful Bill Act , ties eligibility not only to income and minimum wage thresholds but also to verified participation in qualifying activities, with accommodations for seasonal workers and exemptions for several groups, including children under 19; adults aged 65 and older; individuals with disabilities, mental illness, or complex health needs; pregnant people; veterans with total disability; caregivers of young children or disabled relatives; people in rehabilitation or incarceration; and tribal members.
Transportation and digital access are critical factors in whether Medicaid beneficiaries can meet the forthcoming 80-hour-per-month work or training requirement, as the cost and availability often determine job access and reporting obligations. This analysis seeks to quantify how cost, access, and coverage barriers affect compliance with the 80-hour-per-month Medicaid work requirement, particularly among Black adults, who face disproportionate transportation and digital access challenges. Recent outcomes from states that have already implemented work requirements show the urgency of this issue.
In Arkansas, about a quarter (18,000) of approximately 72,000 adults subject to Medicaid work requirements lost coverage between 2018 and 2019, primarily for failing to report work hours online. This led to coverage loss and medical hardship without increasing employment in the state. Georgia has not adopted full Medicaid expansion under the Affordable Care Act (ACA); instead, it created a limited program through its “Pathways to Coverage” waiver. Implemented in July 2023, Pathways extends Medicaid to adults with incomes up to 100% of the federal poverty level, but conditions eligibility on strict work and monthly reporting requirements and excludes many standard exemptions. By early 2025, enrollment was only about 6,500 adults, far below the state’s projection of 25,000 in the first year, while administrative costs exceeded $40 million, largely spent on bureaucracy and outreach rather than care. These outcomes echo patterns seen in other states, showing that work-conditioned eligibility restricts coverage without improving
CPAR | Driving Disconnection: Structural Barriers to Medicaid Work Requirements for Black Americans employment. 1 Both of these cases demonstrate the failures of previous Medicaid work requirements, which resulted in fewer people having access to care.
Despite evidence like this, a new federal work requirement is set to take effect in 2027, mandating 80 hours of work or related activities per month. Without addressing underlying barriers, states risk repeating the same inequities, penalizing low-income adults who are already working or seeking work but lack the means to comply because of transportation affordability or digital access. Building on this policy context, this analysis focuses on five states that represent diverse regions of the United States, including the Southeast, Midwest, Southwest, and Northeast: Arkansas and Georgia have previously piloted or implemented Medicaid work requirements, while Nebraska, Texas, and Pennsylvania have not. Understanding these barriers underscores the need to evaluate whether states have the transportation systems, digital infrastructure, and labor-market conditions necessary to support fair and feasible implementation of the 80-hour requirement.

1 Hinton, E., & Rudowitz, R. (2025). 5 Key Facts About Medicaid Work Requirements. Kaiser Family Foundation. https://www.kff.org/medicaid/5-key-facts-about-medicaid-work-requirements/
As of June 2025, 77.7 million people were enrolled in Medicaid and CHIP nationwide, an 18% decline from March 2023, but still 9% higher than pre-pandemic levels in February 2020 (Table 1). 2
Table 1: Medicaid enrollment
The 2025 enrollment data provides a current snapshot, while the 2023 workforce statistics show that most adults enrolled in Medicaid under age 65 were working (64%) or not working (28%) due to caregiving, illness, or schooling. Among those employed, nearly seven in ten (69%) worked full-time, while part-time workers often faced barriers such as limited hours, childcare responsibilities, or seasonal work conditions. Many Medicaid adults are concentrated in low-wage sectors such as agriculture, services, and retail, with unstable hours and limited benefits, compounded by transportation burdens since remote work is not an option. Digital access constraints further compound these challenges, as many low-income workers lack reliable broadband or devices needed for monthly online reporting under work requirement rules. In non-expansion states such as Georgia and Texas, where policymakers chose not to adopt the ACA’s Medicaid expansion, a program allowing states to extend health coverage to more low-income adults (up to 138% of the poverty line), many adults earn too much to qualify for Medicaid, as the median eligibility limit for parents was only 35% of the Federal Poverty Level (FPL) as of May 2024. This gap
2 Kaiser Family Foundation (KFF). (2025). Medicaid Enrollment and Unwinding Tracker. https://www.kff.org/medicaid/medicaid-enrollment-and-unwinding-tracker/
CPAR | Driving Disconnection: Structural Barriers to Medicaid Work Requirements for Black Americans illustrates why Medicaid’s expanded role under the ACA in states like Arkansas, Nebraska, and Pennsylvania is critical. 3 4
Medicaid’s 80-hour monthly work requirement assumes that part-time work can lift individuals toward economic independence. However, wage levels and basic cost-of-living rates across states indicate that compliance does not translate into self-sufficiency. As of 2025, the federal minimum wage ranges from $7.25/hour in Georgia, Texas, and Pennsylvania, $11.00/hour in Arkansas, and $13.50/hour in Nebraska. For individuals working 80 hours per month, the benchmark used in the Medicaid work rule equates to:
Georgia, Texas, and Pennsylvania: $580/month
Arkansas: $880/month
Nebraska: $1,080/month
FEDERAL POVERTY LINE: $1,304/month
The monthly earnings reflect what a person would make while meeting the 80-hour requirement at each state’s minimum wage. Even in Nebraska, the highest among the five states, $1,080 per month remains well below the federal poverty line for a single adult ($1,304 per month). In Georgia, Texas, and Pennsylvania, workers would earn only $580 per month, less than half of the poverty threshold. Since the earnings under the work requirement fall below the federal poverty line, the 80-hour rule does not support economic self-sufficiency.
3 Kaiser Family Foundation (KFF). (2025). Status of State Medicaid Expansion Decisions. https://www.kff.org/medicaid/status-of-state-medicaid-expansion-decisions/
4 Tolbert, J., Cervantes, S., Rudowitz, R., & Burns, A. (2025). Understanding the intersection of Medicaid and work: An update. Kaiser Family Foundation. https://www.kff.org/medicaid/understanding-the-intersection-of-medicaid-and-work-an-update/
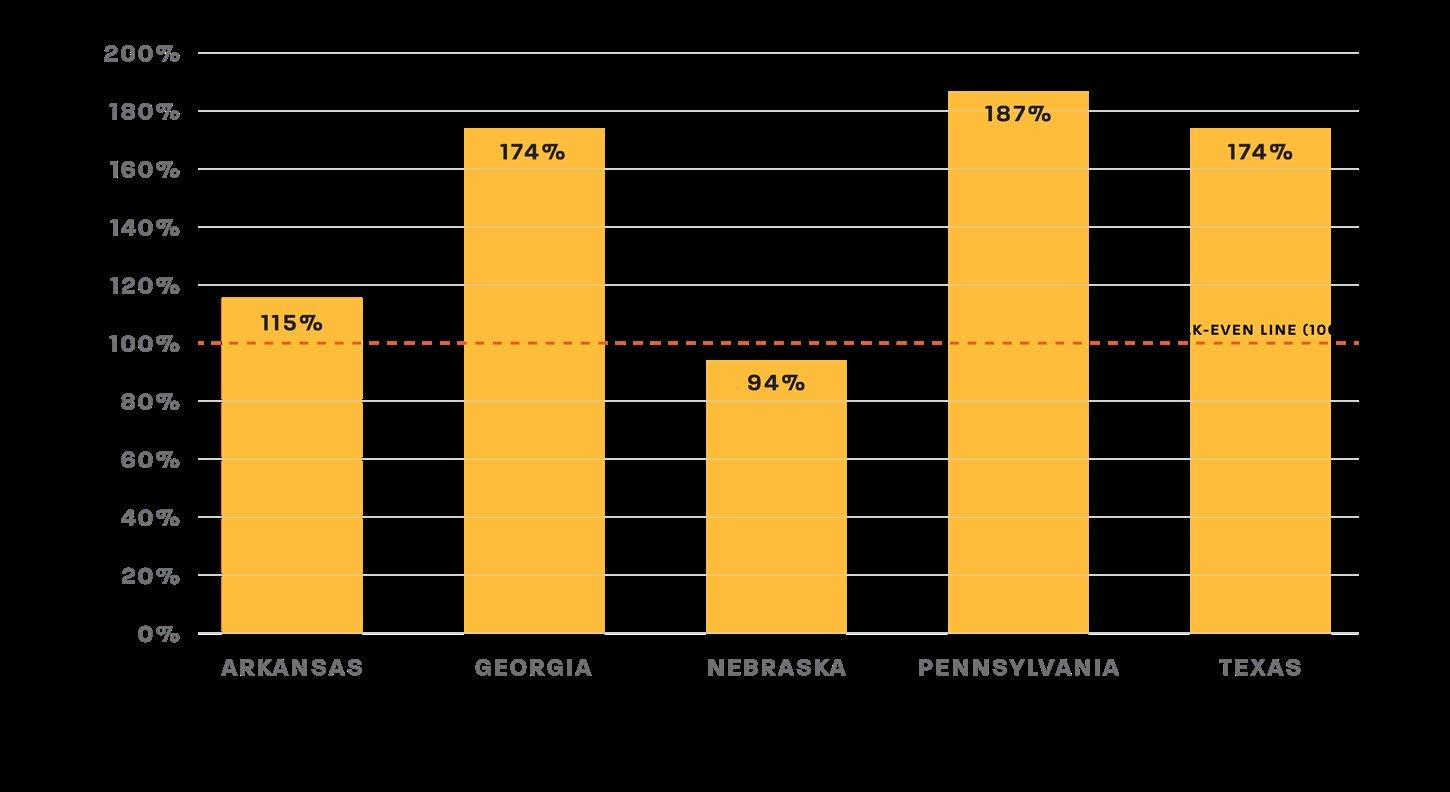
When comparing these incomes with regional transportation expenditures from the U.S. Bureau of Labor Statistics, the results are stark. 5 Across all five states (Figure 1), monthly transportation expenses exceed or nearly equal total earnings under the work rule. This shows that work requirements presuppose access to affordable transportation, which is financially unrealistic for many low-income or rural residents, and similar affordability constraints apply to digital access needed for work-reporting compliance.
• In Georgia, Texas, and Pennsylvania, the average transportation cost alone is 174–187% of total income. This means that even a single month of car expenses outpaced the total earnings from 80 hours of work.
• Arkansas fares slightly better, with transportation costing 115% of income.
• Only Nebraska, with its higher state minimum wage ($13.50/hr), approaches parity at 94%, still leaving no room for housing, food, or healthcare expenses.
5 U.S. Bureau of Labor Statistics (BLS) Consumer Expenditure Surveys. (2024). Consumer Expenditures for the U.S., regions, and selected metropolitan areas. https://www.bls.gov/regions/midwest/data/consumerexpenditures_ selectedareas_table.htm#:~:text=Table_title:%20Consumer%20Expenditures%20for%20the%20U.S.%2C%20 regions%2C,United%20States:%203%2C841%20%7C%20Midwest(2):%205.3%20%7C
Under the 2025 Federal Poverty Guidelines, the poverty line for a one-person household is $15,650 per year (100% FPL), or $1,304/month. 6 Based on current minimum wages:
• In Georgia, Texas, and Pennsylvania, the income from 80 hours of work ($6,960/yr) represents only 44.5% of the Federal Poverty Level (FPL), leaving workers more than 55% below poverty.
• Arkansas performs slightly better due to a higher minimum wage ($10,560/yr), yet workers still earn only 67.4% of the FPL, leaving them 33% below the poverty line.
• Even Nebraska, with one of the highest state minimum wages ($12,960/yr), reaches only 82.8% of the FPL, meaning workers remain 17% below poverty despite full compliance.
All five states are well below the Medicaid expansion threshold of 133–138% FPL, meaning that even with full work compliance, workers will continue to face poverty-level incomes. These poverty-level wages also limit the ability to afford broadband or devices required for mandatory online reporting.
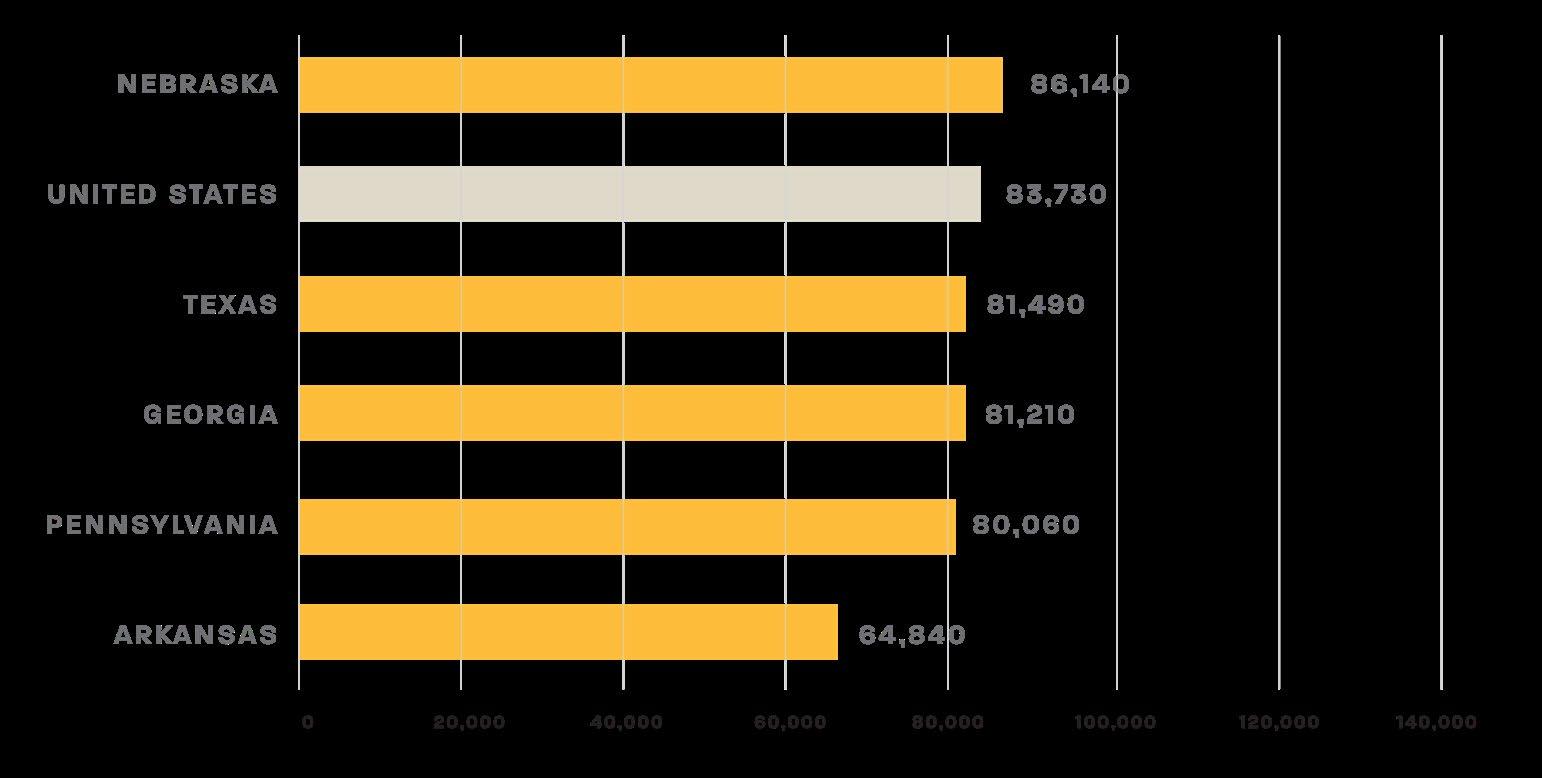
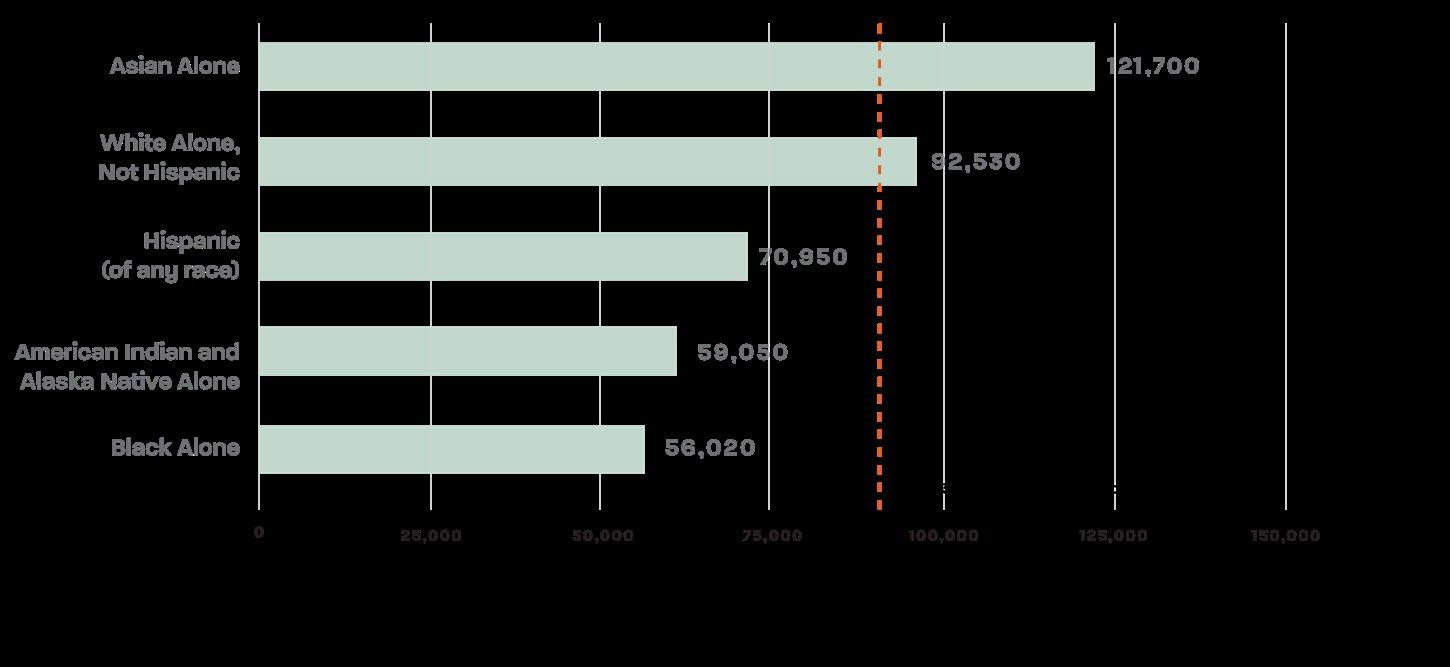
In 2024, the U.S. median household income was $83,730. Notably, Nebraska was the only state above the national average. 7 Overall, Asian households had the highest median household income among racial and ethnic groups at $121,700, while Black households had the lowest at $56,020 (Figures 2 and 3). 8 The wide income gap across states and racial groups, particularly the stark disparity between Asian and white versus Black households, highlights deep structural inequities that shape economic opportunity and financial stability nationwide.
6 Department of Health and Human Services (HHS). (2025). 2025 Poverty Guidelines: 48 Contiguous States (all states except Alaska and Hawaii). https://aspe.hhs.gov/sites/default/files/documents/dd73d4f00d8a819d10b2fdb70d254f7b/ detailed-guidelines-2025.pdf
7 Tierney, A. (2025). Median household income in the United States in 2024, by state. Statista. https://www.statista.com/ statistics/233170/median-household-income-in-the-united-states-by-state/?srsltid=AfmBOoodh6Oq84VT0Tdb71pdnxe _S-T5qxNGh71jvLp5nsj_W2z7gtl_
8 Tierney, A. (2025). Median household income in the United States in 2024, by race and ethnicity. Statista. https://www.statista.com/statistics/233324/median-household-income-in-the-united-states-by-race-or-ethnicgroup/#:~:text=Asian%20households%20measured%20the%20highest%20median%20household,and%20 ethnic%20groups%20in%20the%20United%20States
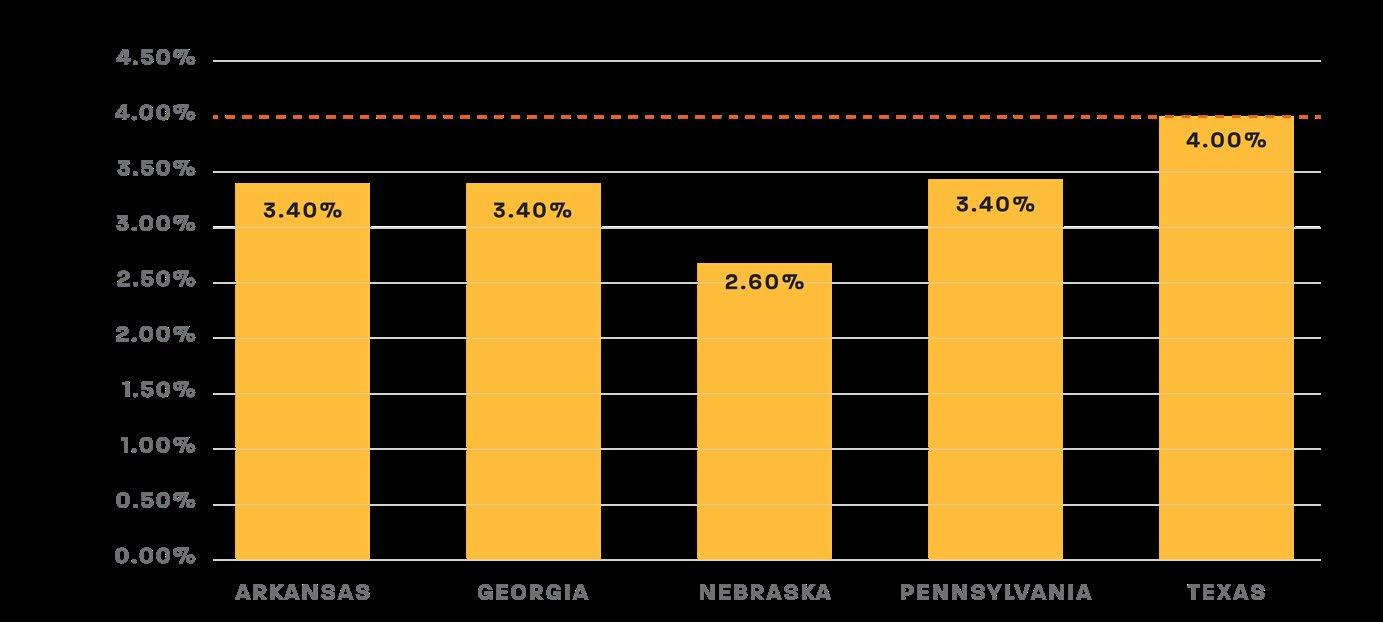
State-level unemployment conditions illustrate the broader labor market context in which compliance must occur. Average unemployment rates were lower at 2.6% in Nebraska; 3.4% in Arkansas, Georgia, and Pennsylvania; and higher at 4.0% in Texas (Figure 4). 9 While these statewide averages appear relatively low, they obscure persistent racial disparities in employment access. In many states, Black unemployment remains significantly higher than overall averages, meaning Medicaid recipients may fall out of
9 Tierney, A. (2025). Unemployment rate in the United States in 2024, by race and ethnicity. Statista. https://www.statista.com/statistics/237917/us-unemployment-rate-by-race-and-ethnicity/
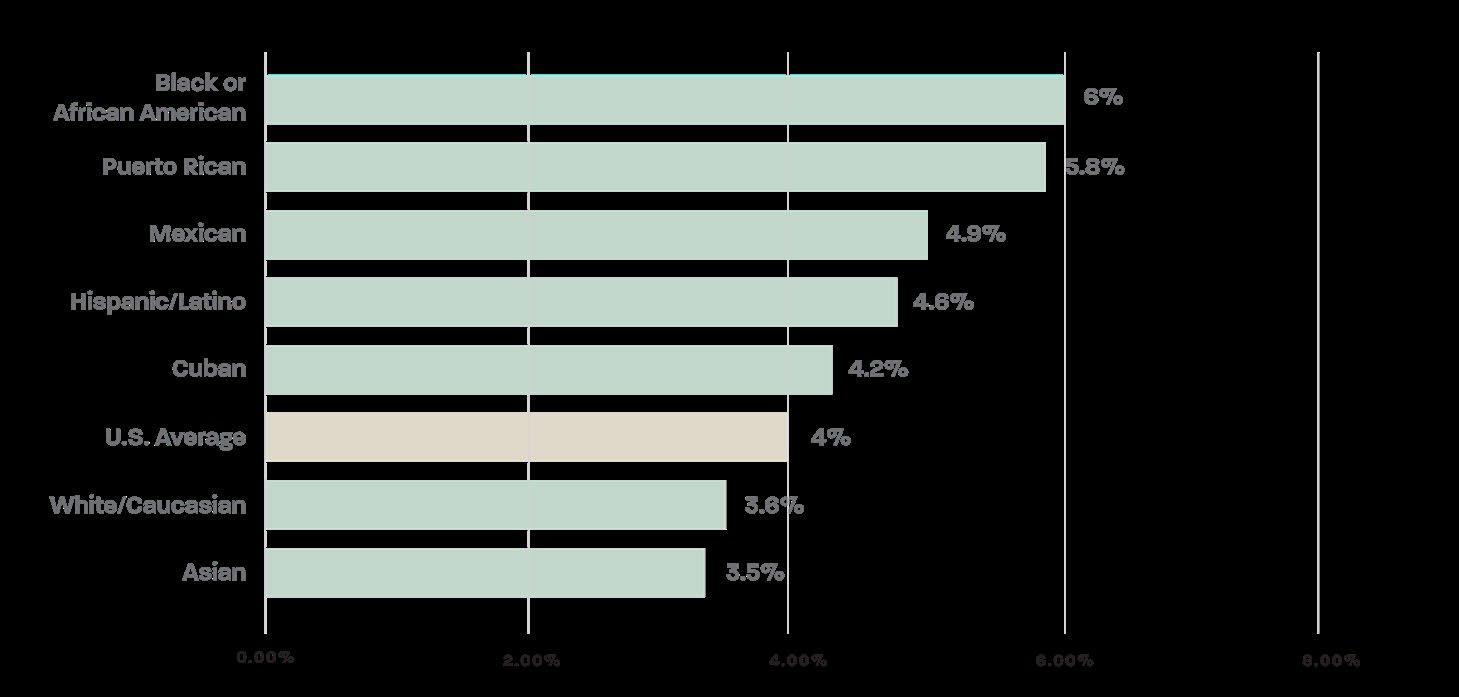
CPAR | Driving Disconnection: Structural Barriers to Medicaid Work Requirements for Black Americans compliance due to unstable job markets rather than an unwillingness to work. The Black unemployment rate in the United States was 6%, the highest of any racial or ethnic group and well above the national average of 4% (Figure 5). 10 Maintaining consistent employment is central to meeting the 80-hour monthly rule, yet Black workers face higher joblessness even before accounting for transportation or digital barriers. Unemployment directly affects whether Medicaid adults can secure the hours needed to meet the 80hour requirement, and higher Black unemployment means compliance challenges will disproportionately fall on Black communities.
10 Tierney, A. (2025). Unemployment rate in the United States in 2024, by race and ethnicity. Statista. https://www.statista.com/statistics/237917/us-unemployment-rate-by-race-and-ethnicity/
Across all five states, household internet connectivity rates range from 90.9% in Arkansas to 93.8% in Texas. However, the share of the population living in rural areas varies substantially, which affects broadband reliability and infrastructure investment. Nebraska (34.1% rural) and Arkansas (38.6% rural) have the highest rural population shares, meaning a larger portion of residents live in areas where broadband service is often slower, less reliable, or unavailable. This contrasts sharply with Texas (9.7% rural) and Georgia (16.6% rural), where higher overall connectivity rates reflect more urbanized populations but still leave large numbers of households, over 482,000 in Texas and 184,000 in Georgia, without internet access. 11 While these percentages suggest widespread access, aggregate statistics mask racial and economic disparities in digital connectivity (Figure 5). 12
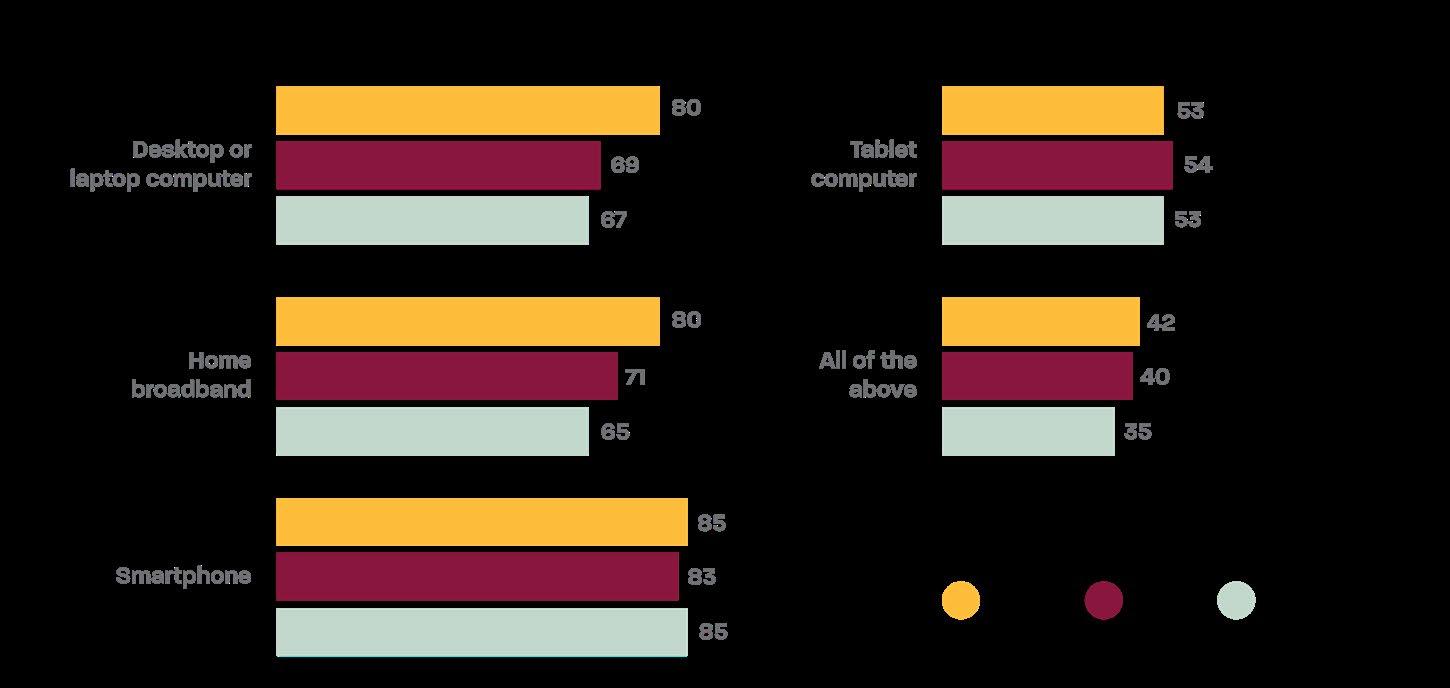
Digital disparities directly affect individuals’ ability to meet online reporting and compliance requirements, including work-requirement portals and benefits reporting systems. Limited broadband access or reliance on smartphones can make it harder for users to upload
11 Wheelwright, T. (2025). The U.S. Digital Divide Is Shrinking, But Nearly 8 Million Households Remain Offline. Reviews.org. https://www.reviews.org/internet-service/how-many-us-households-are-without-internet-connection/#:~:text=Table_ title:%20States%20with%20the%20biggest%20increases%20in,%25%20of%20connected%20households%20 (2023):%2094.31%25%20%7C
12 Atske, S & Perrin, A. (2021). Home broadband adoption, computer ownership vary by race, ethnicity in the U.S. Pew Research Center. https://www.pewresearch.org/short-reads/2021/07/16/home-broadband-adoption-computerownership-vary-by-race-ethnicity-in-the-u-s/
CPAR | Driving Disconnection: Structural Barriers to Medicaid Work Requirements for Black Americans documents, complete lengthy forms, or reliably track required hours. As a result, Black and Hispanic adults are more likely to face structural barriers to meeting digital participation requirements, not because of a lack of willingness or effort, but due to inequitable access to essential technology and internet infrastructure.
Transportation remains one of the largest barriers to meeting Medicaid’s 80-hour monthly work requirement. For low-income adults, car ownership is often the only practical way to reach jobs, training, or reporting sites. Yet for many, it is financially out of reach. Nationwide, households headed by people of color are less likely than white households to have access to a vehicle. The percentage of households without access to a vehicle is highest among Black households at 17% (2.55 million households). 13 The average annual cost of owning and operating a new vehicle is $11,577 per year, or roughly $833/month for 10,000 miles (short commute), $965/month for 15,000 miles (average commute), and $1,100/month for 20,000 miles (multi-job or long commute). 14 This amount alone exceeds or matches the entire monthly income of a minimum-wage worker in states like Texas, Georgia, and Pennsylvania ($580/month).
BREAKDOWN OF MAJOR COST COMPONENTS (2025):
• Car insurance cost of $1,694/year: Legally required in all states and a major affordability burden for low-income drivers.
• License, registration, and inspection fees of $813/year: Ongoing costs to maintain legal access to drive.
• Finance charges of $1,131/year: Reflects typical loan interest for a 5-year vehicle purchase; low-income and Medicaid recipients often face even higher rates due to poor credit or subprime financing.
13 National Equity Atlas. (n.d). Car access: Everyone needs reliable transportation access and in most American communities that means a car. https://nationalequityatlas.org/indicators/Car_access
14 AAA Newsroom. (2025). Your Driving Costs. https://newsroom.aaa.com/wp-content/uploads/2025/09/UPDATE-AAAFact-Sheet-Your-Driving-Cost-9.2025-1.pdf
CPAR | Driving Disconnection: Structural Barriers to Medicaid Work Requirements for Black Americans
• Maintenance, repair, and tire cost of $1,656/year (about 11¢ per mile): Routine upkeep and tire replacement costs that expose recurring financial vulnerability for lowincome drivers.
• Fuel cost averaged $3.151 per gallon (2025 average): A direct and variable cost tied to commuting distance, and fluctuations disproportionately impact workers with longer trips or older, less fuel-efficient vehicles.
These recurring costs create a structural affordability barrier, making even modest car ownership total nearly $12,000 annually. This burden is unsustainable for Medicaid recipients earning between $6,960 and $12,960 per year under minimum wage conditions. These costs show why car ownership, often the only practical way to reach jobs, training, or reporting sites, directly undermines Medicaid’s 80-hour work requirement. When the cost of maintaining a vehicle exceeds or matches the monthly income earned under the rule, compliance becomes financially impossible. The work requirement ultimately assumes a level of transportation access that many low-income Medicaid adults simply cannot afford.
Reliable public transportation offers a far more affordable route to employment than car ownership. The average commute time for all workers increased from 22 minutes in 1990 to 27 minutes in 2022. Black workers who commute by public transportation experience the longest commutes (52 minutes), largely due to residential segregation, limited transit coverage in predominantly Black neighborhoods, and longer trip distances to major employment centers. Many Black workers also rely on multi-transfer routes because frequent, high-capacity transit service is less available in their communities. 15 Access to public transportation, measured by the availability, frequency, and proximity of transit services, shows that Arkansas, Georgia, and Texas have the lowest access scores, while Nebraska and Pennsylvania were towards the middle. 16 Using fare data from the American
15 National Equity Atlas. (n.d). Commute time: All workers should have reasonable commutes. https://nationalequityatlas.org/indicators/Commute_time
16 Kenny, S. (2023). Is your state missing the bus? Evaluating state transit access and ridership. Transportation for America. https://t4america.org/2023/05/03/is-your-state-missing-the-bus-evaluating-state-transit-access-and-rider ip/
CPAR | Driving Disconnection: Structural Barriers to Medicaid Work Requirements for Black Americans
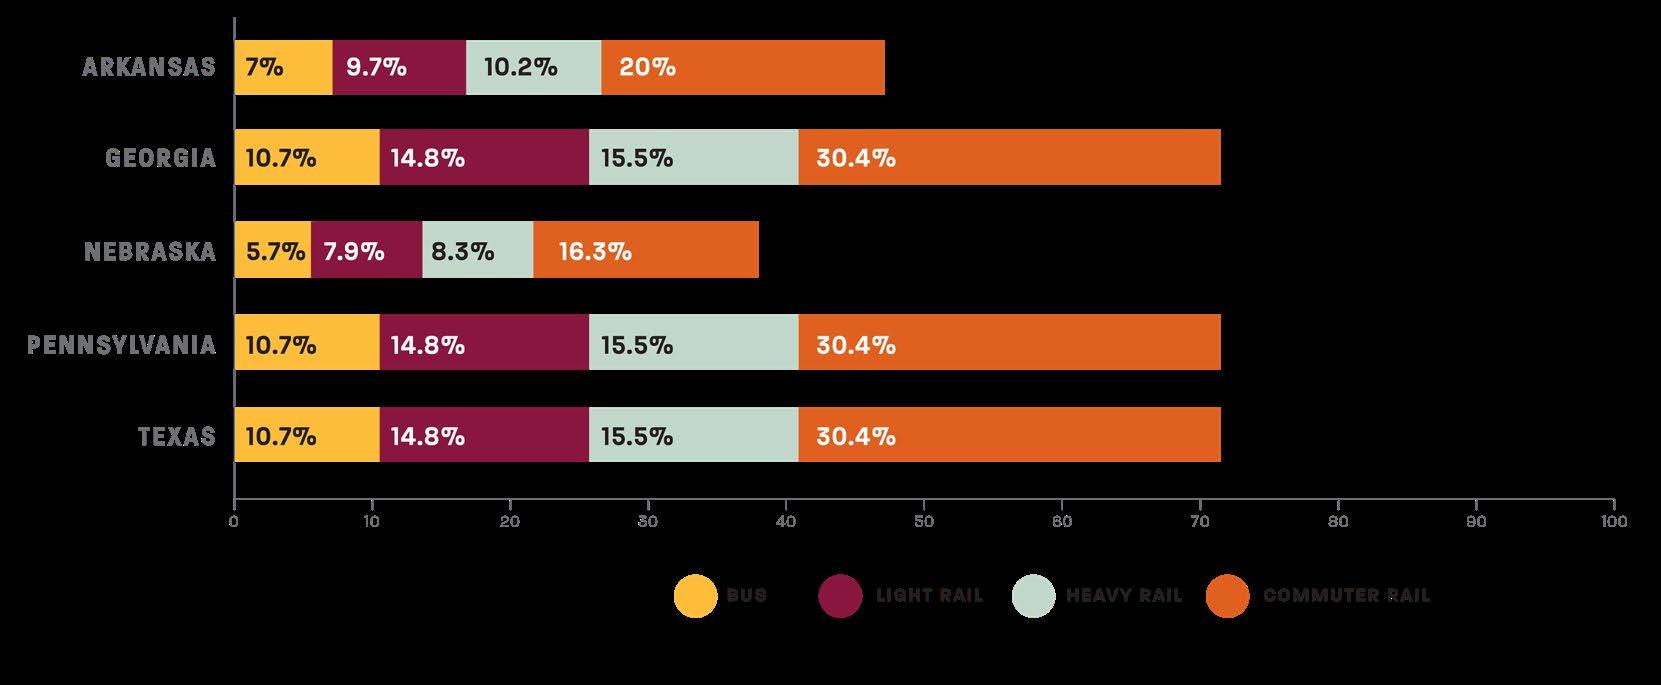
Public Transportation Association, 17 the average one-way base fare is $1.55 for bus, $2.14 for light rail, $2.25 for heavy rail, and $4.41 for commuter rail. At a commuting cost of two trips per day for 20 workdays per month, the typical monthly cost ranges from $62 for bus to $176 for commuter rail. Compared with the 80-hour monthly income of Medicaideligible workers, these costs represent 5–30% of total income, depending on the state and transit mode (Figure 5).
Even in high-fare transit modes, these costs are dramatically lower than the estimated costs per month of owning a vehicle. Thus, where systems are available and service spans align with job or training hours, transit provides a viable path to compliance with Medicaid work rules without consuming most of a worker’s earnings. But, when public transit is limited or unavailable, individuals face a “mobility penalty” as they may lose coverage simply because they cannot afford the transportation needed to get to work. This burden falls most heavily on Black Americans, who are more likely to rely on public transit and face the longest commute times, making them especially vulnerable to coverage loss under the Medicaid work requirement.
17 The American Public Transportation Association (APTA). (2023). 2023 Public Transportation Fact Book. https://www.apta.com/wp-content/uploads/APTA-2023-Public-Transportation-Fact-Book.pdf
RIDE-HAILING AFFORDABILITY
The median U.S. cost of an Uber or Lyft ride rose to $15.99 in 2024, with a typical 10mile trip averaging about $25. For a worker commuting 20 days per month under Medicaid’s 80-hour work requirement, this translates to approximately $1,000 per month in transportation costs, far exceeding the total monthly income of low-wage workers in states such as Texas, Georgia, and Pennsylvania ($580/month). Ride-hailing, therefore, represents a financially unfeasible last resort for Medicaid participants without access to a car or public transit, and even a few trips per week can consume a disproportionate share of income.
The evidence across enrollment, workforce, and cost analyses shows that Medicaid work requirements risk penalizing low-income adults who are working or seeking work but lack access to affordable transportation, digital infrastructure, or living wages. This policy is more likely to perpetuate inequities than to promote economic stability. Addressing these structural barriers is essential if compliance is to reflect economic reality rather than serve as a mechanism for coverage loss.
TRANSPORTATION ACCESS AND AFFORDABILITY
• Transportation is the largest structural barrier to compliance with Medicaid’s 80-hour work requirements. In states like Georgia, Texas, and Pennsylvania, transportation costs, driven primarily by vehicle ownership, exceed 170% of total earnings under the 80-hour work rule. With annual car ownership costs nearing $12,000, many Medicaid recipients cannot afford the best and fastest mode of travel to reach jobs, training sites, or reporting locations. Even with access to transit, many low-income and Black workers face long travel times, limited routes, and multi-transfer trips that make commuting difficult and unreliable.
• As states implement the Medicaid work requirement, they should provide transportation stipends, transit fare subsidies, or Medicaid-supported mobility assistance programs that cover commuting to work or training. These supports are essential to prevent coverage loss due to transportation barriers rather than a lack of willingness to work.
CPAR | Driving Disconnection: Structural Barriers to Medicaid Work Requirements for Black Americans
• States should prioritize rural transit grants and low-income fare programs to offset geographic inequities in access. This will reduce the “mobility penalty” that disproportionately affects low-income and Black workers, who are less likely to own a vehicle and more dependent on transit systems with longer, more burdensome commutes.
• The digital divide might undermine the reporting and verification of work as Black and Hispanic adults are less likely than White adults to have broadband or computer access. 18 States should adopt multi-modal reporting systems, including mobile-friendly options such as call-in and SMS text verifications, as well as community kiosk access points in libraries and workforce centers.
• Federal funding for digital literacy and broadband infrastructure should be tied to the implementation of any Medicaid work-reporting systems to prevent digital exclusion. By offering digital literacy assistance as part of Medicaid outreach, the literacy program ensures participants can navigate online portals.
• States should require equity impact assessments before states launch digital reporting systems to ensure accessibility for all demographic groups.
• Even with full compliance, income from 80 hours of minimum-wage work leaves participants well below the federal poverty line, ranging from 44.5% of FPL in Georgia, Texas, and Pennsylvania to 82.8% in Nebraska. Work requirements should therefore be paired with income-based adjustments to eligibility thresholds and expanded Medicaid coverage in non-expansion states (e.g., Georgia and Texas) to close the “coverage gap” for adults earning too much to qualify for Medicaid but too little for marketplace subsidies.
18 Atske, S & Perrin, A. (2021). Home broadband adoption, computer ownership vary by race, ethnicity in the U.S. Pew Research Center. https://www.pewresearch.org/short-reads/2021/07/16/home-broadband-adoption-computerownership-vary-by-race-ethnicity-in-the-u-s/
STRENGTHEN MEDICAID AS A WORK SUPPORT
• Medicaid should function as an employment support, not a conditional benefit. One solution would be for states to integrate transportation, training assistance, and childcare support into Medicaid programs, enabling individuals to meet work or training expectations without risking coverage.
• All states should use data-sharing agreements between Medicaid and workforce agencies to simplify verification and reduce administrative burden.
This analysis demonstrates that Medicaid’s 80-hour work requirement is not simply a matter of compliance; it is a test of access . Most adults on Medicaid are already working or seeking work, but low wages, high transportation costs, and limited digital connectivity make meeting the requirement economically and logistically unrealistic. In many cases, the cost of getting to work or reporting hours exceeds the income earned. Effective implementation, therefore, depends on integrating Medicaid policy with transportation, broadband, and labor systems rather than treating eligibility as an isolated condition. To advance economic mobility rather than reinforce economic inequalities, policymakers must ensure that Medicaid functions as a platform for stability , supporting access to affordable transit, broadband, and healthcare for low-income workers. Without addressing these structural barriers, work requirements risk deepening inequities by penalizing those who are already working the hardest to remain eligible.