How we created our Local Habitat Map
(Please note that a more detailed technical methodology is available by contacting naturerecovery@herefordshire.gov.uk)
Why create maps for the Local Nature Recovery Strategy?
Maps are a key element of the Local Nature Recovery Strategy (LNRS) because species require places and spaces (habitats) in which to live and through which to move. The LNRS maps identify where we should target local effort for nature recovery and wider environmental benefits.
What maps have been created?
Two main layers make up the LNRS Local Habitat Map: the Areas of Particular Importance for Biodiversity and the Opportunities Maps, known as Areas that Could be Important for Biodiversity.
Areas of Particular Importance for Biodiversity (APIB)
Showing sites that are nationally and/or locally designated for their value to nature:
• Special Areas of Conservation
• National Nature Reserves
• Sites of Special Scientific Interest
• Local Nature Reserves
• Local Wildlife Sites
• Irreplaceable habitat such as ancient woodland
National LNRS guidelines meant that only these designated sites could be added to the APIB map.
Opportunities for nature recovery (ACIB)
Showing the locations where the measures described in the Local Nature Recovery Strategy document would be most effective and therefore where effort and funding should be targeted. They are split into habitat types.

How the Opportunities Maps were created
There were three steps in the process of creating the maps.
Step 1
Map existing high quality habitats and the land use around them
Step 1:
Step 2
Map the existing ecological networks that allow species to move through the landscape
Mapping existing habitats and land use
Step 3
Map where habitats could be created or enhanced to best support and connect existing habitats
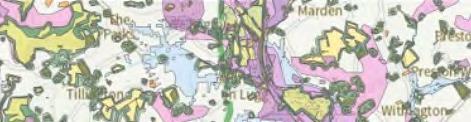
A Herefordshire core habitat base map was created from local and national data sources for different habitat types and land uses, such as the Herefordshire Local Wildlife Sites Survey and Ancient Woodland Inventory for England. These data sources were of varied reliability, and some are several years out of date, but care was taken to assign the most accurate habitat possible. Checks were made against satellite imagery but visiting every site was not possible. When the LNRS is reviewed we will be able to access updated data to update our map. Habitats were grouped into three types: tree and woodland habitats, open habitats and wetland habitats. This created the APIB map.
Step 2: Mapping existing
ecological networks
For nature to recover, species need to be able to move and spread from one suitable place to another. This is ecological connectivity. A structurally diverse landscape containing elements of woodland, open habitat and wetland, such as orchards with ponds, meadows with hedgerows and woodlands with glades, provides good connectivity. Being able to move between suitable habitats is an important adaptation to changing climate and other pressures. Assessing connectivity is complicated. The existing ecological networks were mapped for Herefordshire using a method called least cost path analysis which looks at both habitat structure and requirements of species.
Step 3: Mapping opportunities for habitat connection through creation and enhancement
The final step was to map where there are opportunities to create or restore habitats to improve ecological connectivity. The mapping worked outwards from existing good quality habitats to extend and connect them. Constraints which would make creating new habitats difficult were identified, and these were incorporated into the opportunities maps. Constraints could include grade 1 and 2 agricultural land and built-up areas. Constraints meant that it is harder for opportunities to be mapped to these areas but not impossible. Maps were created for wetland, woodland and open habitats as well as for a combined open/woodland habitat, where a mixed habitat that connects both woodland and open habitats, or where either a woodland or an open habitat would be suitable.
Open habitats include grasslands, heathlands and some upland habitats; essentially anywhere that trees and shrubs do not dominate. Hedgerows, wood pastures and parkland habitats are included in woodland habitats, but traditional orchard measures have their own layer. The wetland opportunities map overlays the other habitat maps because wet woodland or wet open habitats could be created or enhanced where conditions are right.
All the opportunities were ranked as high, medium and low priority. Only the high opportunities appear on the LNRS maps. This created the ACIB map. You can view the ACIB map with all habitat opportunities combined or you can view opportunity maps for each habitat. You can also view maps for each of the mapped measures.
How to view and comment on the Local Habitat Map
Visit our website to see instructions on how to view and use the map and to submit comment to the consultation.