GDP
GNI per capita (PPP) ($int)
HDI
CRI
Climate Losses (PPP) ($M)
Fragility States Index
Transparency
$35,381 $78.447 $112,268 $141,779 $6,030 $19,608 $24,723 $32,528 $24,430 $1,010,804 $21,139 $2,492 $10,124 $685,452 $10,374 $139,380 $69,994 $60,508
$16,680 $3,540 $4,150 $3,120 $3,340 $1,140 $20,990 $1,190 $10,380 $5,740 $1,860 $28,380 $1,320 $12,830 $8,310 $2,740 $1,790 $3,850
0.698 0.512 0.579 0.548 0.497 0.445 0.777 0.416 0.628 0.514 0.483 0.772 0.413 0.666 0.531 0.521 0.483 0.586
141.50 133.83 103.17 81.17 118.83 79.00 103.67 43.33 69.50 112.00 111.67 159.33 121.83 83.33 107.83 103.50 87.33 130.17
$12.793 $11.741 $31.816 $92.910 $17.700 $56.973 $26.302 $94.401 $26.114 $101.519 $8.042 $0.854 $0.620 $459.542 $22.085 $64.591 $56.835 $22.395
63.8 95.6 69.7 96.4 81.7 88.0 41.7 89.0 70.4 101.6 90.8 59.4 89.3 72.3 88.8 80.3 96.0 87.8
61 25 40 28 42 31 50 25 51 27 55 ND 30 43 ND 36 26 37
$540,894 $30,381 $8,067,710 $800,542 $937,932 $456,676 $242,080
$3,790 $83,010 $6,490 $26,900 $5,560 $85,020 $12,200
0.570 0.856 0.609 0.779 0.538 0.912 0.757
25.00 168.33 37.50 94.00 30.50 171.83 64.33
$2,283.378 $0.349 $11,335.170 $271.755 $3,823.175 $2.822 $234.431
89.1 61.6 77.9 65.4 98.9 32.5 86.6
28 62 40 47 33 84 38
$2,122 $8,1168 $4,774 $2,879 $1,563,501 $747 $1,413 $5,619 $23,568 $2,138 $1,341 $1,165 $41,583
$22,090 $21,640 $17,180 $7,930 $44,020 $10,620 $13,720 $7,800 $8,450 $12,030 $25,640 $11,380 $31,770
0.783 0.790 0.785 0.715 0.913 0.724 0.750 0.636 0.719 0.729 0.752 0.720 0.717
74.50 ND 144.00 47.17 97.00 42.00 40.33 101.00 63.50 60.67 62.00 63.33 153.83
$15.553 ND $3.697 $56.838 $46.023 $78.734 $33.684 $155.505 $16.740 $36.208 $11.168 $2.304
54.8 52.4 49.6 65.5 22.6 69.0 61.5 71.3 65.2 ND ND ND 56.7
ND 65 68 ND 82 57 52 38 44 55 ND 58 41
$26,681 $15,618 $2,574,939
$32,200 $35,710 $41,640
0.850 0.839 0.907
95.50 152.17 66.17
$15.729 $2.904 $1,522.434
62.6 38.6 33.2
57 56 82
$1,071,584 $7,592 $224 $169 $165,518 $31,356 $1,154 $1,242 $571 $38 $772
$45,210 $8,710 $3,050 $17,510 $37,190 $4,140 $6,230 $2,140 $5,780 $5,920 $3,040
0.935 0.727 0.590 0.704 0.914 0.505 0.702 0.506 0.717 0.772 0.594
52.00 47.33 112.83 ND 83.50 64.83 77.50 73.67 58.00 115.00 54.67
$2,203.885 $57.356 $10.685 ND $301.123 $35.991 $8.583 $5.457 $6.729 $2.668 $16.049
22.3 76.9 ND ND 22.6 86.4 67.1 84.8 ND ND ND
77 ND ND ND 89 29 ND 39 ND ND ND
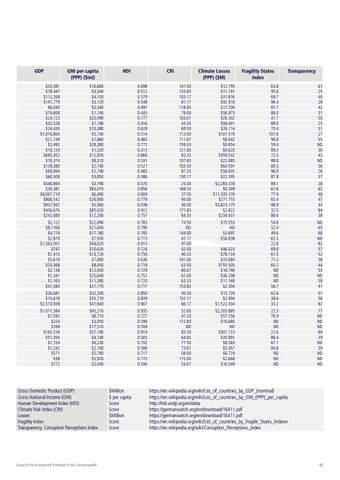
Gross Domestic Product (GDP) Gross National Income (GNI) Human Development Index (HDI) Climate Risk Index (CRI) Losses Fragility Index Transparency. Corruption Perceptions Index
Survey of the Architectural Profession in the Commonwealth
$Million $ per capita Score Score $Million Score Score
https://en.wikipedia.org/wiki/List_of_countries_by_GDP_(nominal) https://en.wikipedia.org/wiki/List_of_countries_by_GNI_(PPP)_per_capita http://hdr.undp.org/en/data https://germanwatch.org/en/download/16411.pdf https://germanwatch.org/en/download/16411.pdf https://en.wikipedia.org/wiki/List_of_countries_by_Fragile_States_Indexw https://en.wikipedia.org/wiki/Corruption_Perceptions_Index
67