40,000
2014 2015 2016
38,000 36,000 34,000 32,000
Number of Registered Architects
30,000 28,000 26,000 24,000 22,000 20,000 18,000 16,000 14,000 12,000 10,000 8,000
6,000 4,000 2,000
Ba rb ud a d
ua An
tig
U
nit
N
an
Bo tsw an a
U ga nd a
ha na G
M al ta
La nk a Sr i
Ze al an d
ys ia
ew
C
M al a
yp ru s
h ad es
Ba ng l
Ko ng H
So
ut h
on g
Af
ric a
an Pa kis t
an ad a C
Au str al ia
ed
Ki
ng do m
0
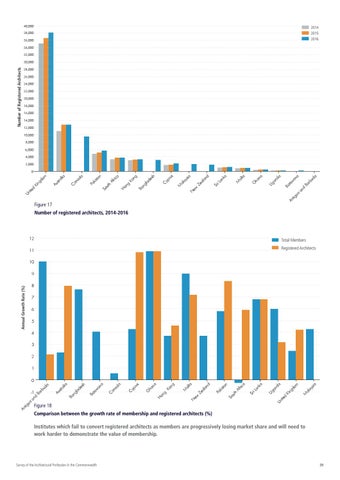
Figure 17 Number of registered architects, 2014-2016
12
Total Members Registered Architects
11 10 9
Annual Growth Rate (%)
8 7 6 5 4 3 2 1
ay sia al M
Ki ng do m
U ga nd a
La nk a Sr i
Af ric a
So ut h
ew N
Pa kis ta n
Ze al an d
ta al M
Ko ng
H on g
G ha na
C yp ru s
C an ad a
Bo tsw an a
Ba ng la de sh
Au str al ia
Figure 18
U nit ed
An tig ua
an d
-1
Ba rb ud a
0
Comparison between the growth rate of membership and registered architects (%)
Institutes which fail to convert registered architects as members are progressively losing market share and will need to work harder to demonstrate the value of membership.
Survey of the Architectural Profession in the Commonwealth
39