1.789
Cyprus
0.580
United Kingdom Australia
0.532 0.458
Hong Kong
0.390
New Zealand Canada
0.263
Antigua and Barbuda
0.235
South Africa
0.067
Malaysia
0.062
Sri Lanka
0.054
Botswana
0.042
Pakistan
0.029
Bangladesh
0.019
Ghana
0.017
Uganda
Africa Asia Caribbean and America Europe Oceania (Pacific)
2.182
Malta
0.004
0.00
0.50
1.00
1.50
2.00
2.50
Registered Architects per 1000 population
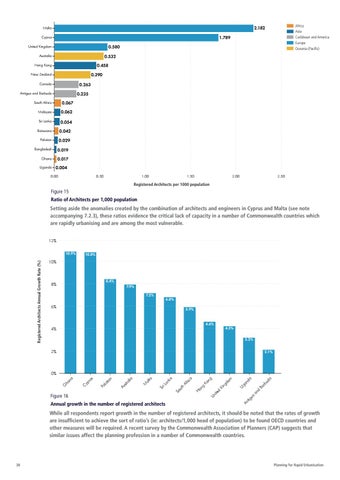
Figure 15 Ratio of Architects per 1,000 population
Setting aside the anomalies created by the combination of architects and engineers in Cyprus and Malta (see note accompanying 7.2.3), these ratios evidence the critical lack of capacity in a number of Commonwealth countries which are rapidly urbanising and are among the most vulnerable. 12%
Registered Architects Annual Growth Rate (%)
10.9%
10.8%
10%
8.4%
8%
7.9% 7.2%
6.8%
6%
5.9%
4.6%
4.2%
4%
3.2%
2%
2.1%
a ud Ba d an
ua tig
nit
rb
nd ga U
Ki
a
m
Ko g on
h ut
ng do
ng
a H
ed
An
Annual growth in the number of registered architects
U
Figure 16
So
Sr
iL
an
Af ric
ka
ta al M
Au
str al
ia
n Pa k
ist a
s ru yp C
G
ha
na
0%
While all respondents report growth in the number of registered architects, it should be noted that the rates of growth are insufficient to achieve the sort of ratio’s (ie: architects/1,000 head of population) to be found OECD countries and other measures will be required. A recent survey by the Commonwealth Association of Planners (CAP) suggests that similar issues affect the planning profession in a number of Commonwealth countries.
38
Planning for Rapid Urbanisation