44,000 4,000
40,000
3,200
Number of Members
36,000
32,000 28,000
Number of Members
Fellow Affiliate Student Associate Chartered
3,600
24,000
2,800 2,400 2,000 1,600 1,200 800
20,000
400
16,000
nd
a
ta
U ga
U ga
M al
nd
a
ta M al
ha na
an iL Sr
N
So
G
ka
us yp r
ut h
C
is t
Af r ic
an
d
Pa k
Ze al
an
de sh
ew
Ba
ng
M al
la
ay sia
ng Ko on g H
12,000
a
0
8,000 4,000
Ba rb ud a
An
tig
U
ua
an d
Bo tsw an a
U
ga nd a
al ta M
ha na G
Sr i
La nk a
s C
yp ru
a ric Af h So ut
N
ew
Pa kis
ta n
Ze al an d
h Ba ng
al a
la de s
ys ia
Ko ng H
M
C
on g
an ad a
str al ia
nit ed
Ki
Au
ng
do m
0
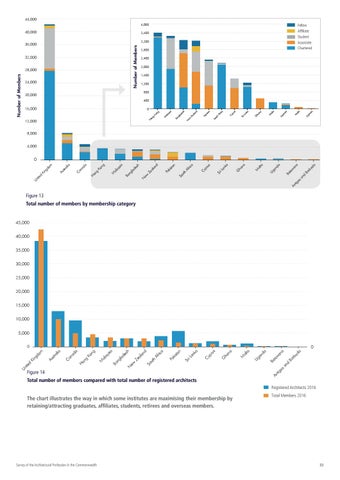
Figure 13 Total number of members by membership category
45,000 40,000 35,000 30,000 25,000 20,000 15,000 10,000 5,000 0
Total number of members compared with total number of registered architects
da
an
d
Ba r
bu
a tsw an Bo tig ua
U
ga
nd
a
al ta M
na G
ha
s ru yp C
Sr
iL
an
ka
n ist a Pa k
h
Af
ric
a
d ut So
N
ew
Ze al an
sh de la
Ba
ng
ay sia M
Ko g on H
al
ng
a ad C an
str al ia Au
Figure 14
An
U
nit
ed
Ki
ng do
m
0
Registered Architects 2016
The chart illustrates the way in which some institutes are maximising their membership by retaining/attracting graduates, affiliates, students, retirees and overseas members.
Survey of the Architectural Profession in the Commonwealth
Total Members 2016
33