$70,000
£700
$60,000
£600
$50,000
£500
$40,000
£400
$30,000
£300
$20,000
£200
$10,000
£100
h
U ga na da
ad es
ha na
Ba ng l
Sr i
An
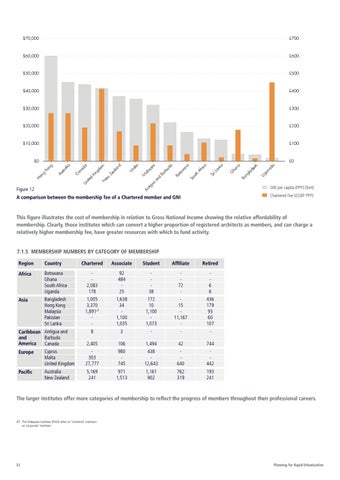
Figure 12
G
La nk a
ric a Af
So ut h
Bo tsw an a
ys ia
Ba rb ud a
GNI per capita (PPP) ($int)
tig
U
ua
an d
M al a
M al ta
N
ew
Ki d nit e
Ze al an d
ng do m
an ad a C
H on g
Au str al ia
£0 Ko ng
$0
Chartered Fee (£GBP PPP)
A comparison between the membership fee of a Chartered member and GNI
This figure illustrates the cost of membership in relation to Gross National Income showing the relative affordability of membership. Clearly, those institutes which can convert a higher proportion of registered architects as members, and can charge a relatively higher membership fee, have greater resources with which to fund activity. 7.1.5 MEMBERSHIP NUMBERS BY CATEGORY OF MEMBERSHIP Region
Country
Chartered
Associate
Student
Affiliate
Retired
Africa
Botswana Ghana South Africa Uganda
2,083 178
92 484 25
38
72 -
6 6
Asia
Bangladesh Hong Kong Malaysia Pakistan Sri Lanka
1,005 3,370 1,89127 -
1,638 34 1,100 1,035
172 10 1,100 1,073
15 11,167 -
436 179 93 60 107
8
3
-
-
-
Caribbean Antigua and Barbuda and America Canada
2,405
106
1,494
42
744
Europe
Cyprus Malta United Kingdom
303 27,777
980 745
438 12,643
640
442
Pacific
Australia New Zealand
5,169 241
971 1,513
1,161 902
762 319
193 241
The larger institutes offer more categories of membership to reflect the progress of members throughout their professional careers.
27 The Malaysian Institute (PAM) refers to ‘chartered’ members as ‘corporate’ members
32
Planning for Rapid Urbanisation