SO, HOW MANY ARCHITECTS DO WE NEED ANYWAY?
Having established a shortfall in the number of architects in a number of Commonwealth countries, on what basis might we assess the number of architects required in each case? Figures from the OECD countries which responded to the survey suggest a ratio of roughly 0.44 architects per 1,000 head of population. These figures relate to mature economies and to countries which are, on average, already 85% urbanised. Applying such a ratio to a country such as Uganda, which is currently only 16.8% urbanised would clearly be inappropriate. It may, therefore, be more appropriate to apply the ratio to the urbanised population before then incrementing on an annual basis to reflect the rate of urbanisation. Applying such a ratio to the urban population of Uganda, for example, would suggest a current shortfall of circa 2,990 architects together with a requirement for a further 275 architects per annum. The calculation upon which this assessment has been made is as follows:
A. B. C. D. E. F. G. H. I. J. K. L. M.
Total population Urbanisation Urban population Number of existing architects Total number of architects required Shortfall in the number of architects Population growth Urban growth per annum Total population (2019) Urbanisation % (2019) Urban population (2019) Total number of architects required (2019) Additional architects required (2019)
:42,863,000 :16.8% :7,200,984 :178 :3,168 :2,990 est :3.2% :5.3% :44,234,616 :17.69% :7,431,415 :3,443 :275 est
(A x B) (C x 0.44) (D - E) (A + (A x G) (B + (B x H) (I x J) (K x 0.44) (L - E)
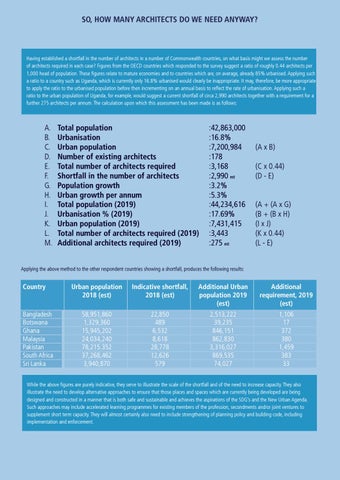
Applying the above method to the other respondent countries showing a shortfall, produces the following results:
Country
Bangladesh Botswana Ghana Malaysia Pakistan South Africa Sri Lanka
Urban population 2018 (est)
Indicative shortfall, 2018 (est)
Additional Urban population 2019 (est)
Additional requirement, 2019 (est)
58,951,860 1,329,360 15,945,202 24,034,240 78,215.352 37,268,462 3,940,870
22,850 489 6,532 8,618 28,778 12,626 579
2,513,222 39,235 846,151 862,830 3,316,027 869,535 74,027
1,106 17 372 380 1,459 383 33
While the above figures are purely indicative, they serve to illustrate the scale of the shortfall and of the need to increase capacity. They also illustrate the need to develop alternative approaches to ensure that those places and spaces which are currently being developed are being designed and constructed in a manner that is both safe and sustainable and achieves the aspirations of the SDG’s and the New Urban Agenda. Such approaches may include accelerated learning programmes for existing members of the profession, secondments and/or joint ventures to supplement short term capacity. They will almost certainly also need to include strengthening of planning policy and building code, including implementation and enforcement.
26
Planning for Rapid Urbanisation