
Annual Report with sustainability reporting 2022/23 1
Halle, 9 June 2023
FINANCIAL YEAR 2022/23
Annual report presented by the Board of Directors to the Ordinary General Meeting of Shareholders of 27 September 2023 and Independent auditor’s report
The Dutch annual report in the European Single Electronic Format (ESEF) is the only official version.
Dit jaarverslag is ook verkrijgbaar in het Nederlands. Ce rapport annuel est également disponible en français.
Financial year 2022/23 covers the period from 1 April 2022 to 31 March 2023.
This annual report is also available on colruytgroup.com/en/annualreport. Our corporate website also includes all press releases, extra stories and background information.
2

3 Corporate governance 119 Governance, supervision and management 123 Sustainable corporate governance 145 Share ownership, Colruyt shares and bonds Corporate sustainability 154 SDG 2 – Zero hunger 156 SDG 3 – Good health and well-being 160 SDG 6 – Clean water and sanitation 162 SDG 7 – Affordable and clean energy 164 SDG 8 – Decent work and economic growth 168 SDG 12 – Responsible consumption and production 174 SDG 13 - Climate action 180 Our sustainability indicators 191 EU Taxonomy Intro 4 Word from the Chairman 6 Who are we? 12 Our strategy 14 Our vision on sustainability 25 Management report 36 Key figures 43 Activities 47 Retail 82 Wholesale 88 Foodservice 91 Other activities 103 Group support activities Financial report 207 Consolidated income statement 208 Consolidated statement of comprehensive income 209 Consolidated statement of financial position 210 Consolidated statement of cash flows 211 Consolidated statement of changes in equity 213 Management responsibility statement 214 Independent auditor’s report 222 Notes to the consolidated financial statements 297 Definitions TABLE OF CONTENTS
Word from the Chairman
2022/23 was an eventful, challenging financial year, in which we have continued to evolve, based on our belief that we create added value for society today, tomorrow and in the long term. Over the past thirty years, Colruyt Group has evolved from a family business to a large, diverse group of companies. After years of double-digit growth, we are now experiencing a period of slowdown. This is not uncommon, especially in a context of high inflation that is seriously challenging all retailers and has sharply increased our costs, among other things for energy and employee pay. In retrospect, we are proud that, despite all this, we achieved good revenue growth and consolidated our market share.

Continuing to consolidate our long-term strategy required us to take a number of difficult decisions, which after careful consideration of various scenarios proved to be unavoidable. Thus, we published our decision for Dreamland to structurally join forces with Belgian toy specialist ToyChamp in April. In addition, we announced our intention to restructure Dreamland and Dreambaby, applying the ‘Renault Act’ collective redundancy scheme to a number of employees, and closing one Dreamland and five Dreambaby stores. We are convinced that these actions can contribute to the continued existence of Dreamland (now together with ToyChamp) and to that of Dreambaby as an integral part of the group. We are working towards this together, in constructive consultation with our trade union partners. We are and remain incredibly grateful and proud of the people who give the best of themselves for these attractive brands in our non-food area.
During the past financial year we also implemented numerous small and large cost saving, optimisation and efficiency measures. The sales, logistics, production and support services focused on
controlling their operational costs and specifically on energy efficiency. Energy prices started falling again from the beginning of 2023, while the joint market share of Colruyt Lowest Prices, Okay and Spar in Belgium increased to 31,0% at the end of the financial year. Partly as a result of this, we were able to slightly adjust in a positive direction our outlook for the full-year results. Ultimately, our revenue for the financial year increased by 7,7%, to over 10,8 billion euros. The net result decreased by one percentage point to 1,9% of revenue.
In the coming financial year, we will maintain our increased focus on efficiency and continue to implement our strategic plan We are convinced that we will emerge stronger from the current period. We therefore continue to expand our smart ecosystem, with products and services in four areas, where a significant portion of family budgets is spent. In the fields of nutrition and health, in particular, we have taken major steps through investments, participations and acquisitions. Our Jims fitness chain boosted its muscle by acquiring six high-quality clubs from the Oxygen chain. We also took a shareholding in digital health platform yoboo, strong in personal counselling towards healthier lifestyles. Finally, our Newpharma online pharmacy expanded its storage space to over 20.000 m², with potential for future growth. At the beginning of 2023, we concluded an agreement in principle to acquire 100% of the Degrenne Distribution group, a significant regional player in the French convenience store market. The company perfectly complements our Codifrance wholesale branch and will significantly strengthen our presence in France. Our retail network also continued to grow in Belgium and Luxembourg, with 13 new food stores and 22 renovations, representing 13.400 m² of additional retail space.
INTRO | Word from the Chairman • Who are we? • Our strategy • Our vision on sustainability • Management report • Key figures 4
Our Colruyt Lowest Prices format experienced its greatest expansion. With its unique lowest price guarantee, it is clearly more relevant than ever. With food price inflation continuing, Colruyt attracted many new customers from autumn 2022 onwards and increased its market share. We continued to protect our customers’ purses and purchasing power, even during the often challenging annual negotiations with suppliers. We nonetheless succeeded in devising solutions acceptable to all parties, with a view to our lowest price guarantee (which celebrates its 50th anniversary this year) and our long-term supplier relationships.
We have also set a new course in the energy field. Our energy holding company Virya Energy reached an agreement to sell its offshore wind energy platform Parkwind to Japanese energy group JERA Green. The takeover offers Parkwind the potential to develop further as a leading international energy player, based in our country. This was a necessary step in an increasingly competitive offshore industry with substantially larger projects and higher investment risks.
At the beginning of June 2023, we completed the sale of fuel specialist DATS 24 to Virya Energy. In a rapidly greening energy market, the holding company will gain a lot of clout from this pooling of expertise. For our customers, nothing changes: DATS 24 remains part of the Xtra ecosystem.
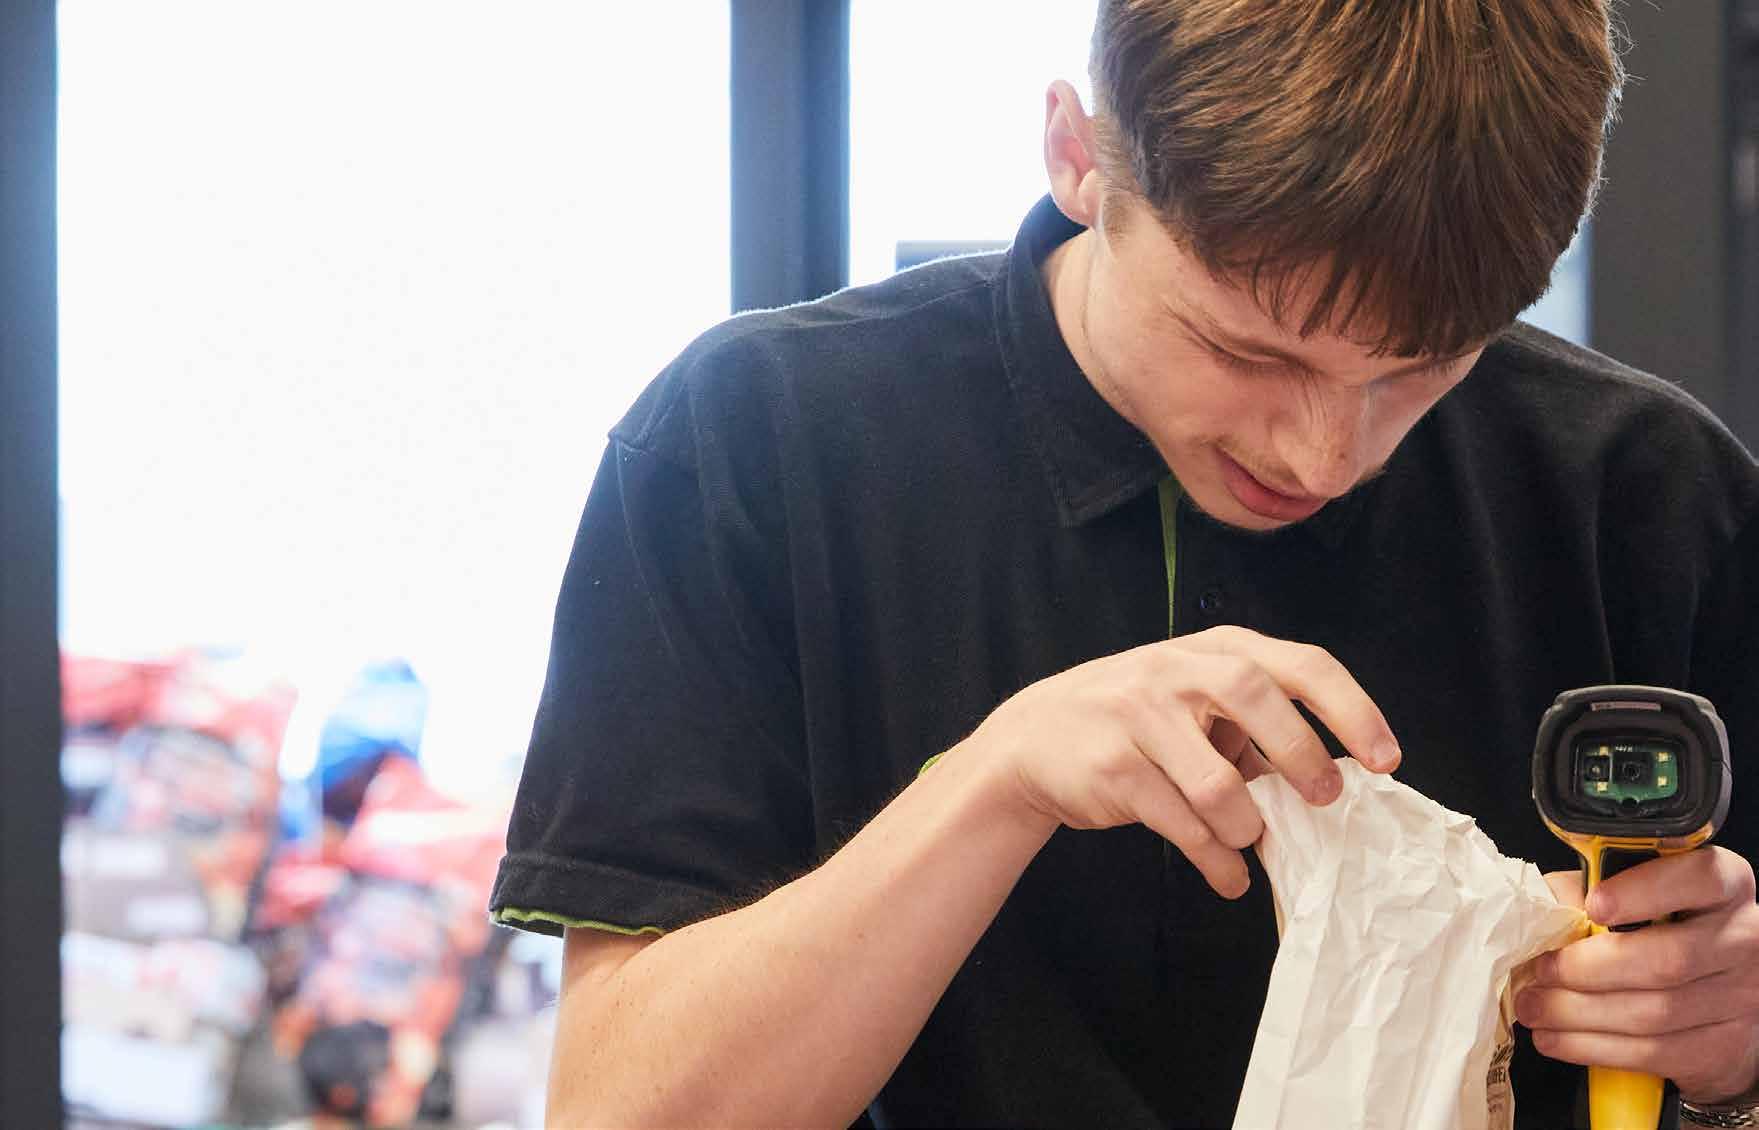
In the past financial year, we again worked hard on numerous innovation and sustainability initiatives. These include new technologies to speed up checkout flow, while making work more ergonomic for our employees. We have experimented with unmanned vehicles for home delivery from Collect&Go and further digitised our processes and systems.
To help consumers in making more sustainable choices, we are continuing steadily to roll out the Eco-score we launched in 2021. This sustainability label is linked to a unique, low-entry threshold points saving programme that allows customers to support great ecological initiatives. And we are pleased to report that international manufacturers are also starting to apply the Eco-score to their A-brand products.
Level playing field
As the only 100% Belgian retailer, we continue to invest in logistics and production in our own country. We buy as much as possible from Belgian producers, contribute to the sustainability of agriculture and the anchoring of craftsmanship. In so doing, we create lots of jobs and support entrepreneurship in our country. Through our activities, we also make a significant contribution to the public purse, while our leadership in sustainability and innovation helps put our country on the map. We therefore want to make a plea here for the continued existence of integrated trading in Belgium. For this, we are calling in the first place for a major reduction of the number of joint employer-employee negotiating committees in the trading area. In this way, a fair and competitive landscape can be created in which integrated and independent stores continue to coexist perfectly, without unfair competition in wages and working conditions. This ultimately benefits both employees and the entire retail sector, from small independents to franchisees to integrated chains.
of our very first Green Retail Bond. With it, we easily raised the intended 250 million euros to finance existing and new sustainable projects in the coming years.
In the past financial year, we have taken many steps to ensure the sustainable continued existence of our group. Spring 2023 saw some important internal changes. General manager of Colruyt Lowest Prices Chris Van Wettere went into welldeserved retirement, and a milestone also followed for myself. On 1 July 2023, I handed over the day-to-day management of Colruyt Group to Stefan Goethaert, who has been the new CEO since then. Stefan combines strong international management experience with the required leadership skills and a valuesdriven vision. Timing and preparation are right: together we came through both the corona crisis and the shock wave of the war in Ukraine. We have taken important structural and organisational decisions and our strategy for the next few years is clear and under implementation. The day-to-day management and future of Colruyt Group are in good hands with Stefan and his executive committee, while I also remain closely involved as Chairman of the Board of Directors.
Finally I want to extend my sincere thanks to all employees, customers and partners who, with their continued trust in Colruyt Group even in difficult times, are today building the future with us.
We continued to invest in our in-house production and in our own agricultural land, which we make available to independent farmers on a long-term basis, with part of it earmarked for innovative, more sustainable crops.
We expect a first harvest of Belgian mussels from our sea farm in summer 2023, for sale in our Cru markets. At the end of 2022, we announced our ambition to make our freight transport completely emission-free by 2035 by switching to battery and hydrogen-electric vehicles. In the meantime, we have already commissioned various electric vehicles, including one 44-tonne truck and five refrigerated trucks.
We feel confirmed in the sustainable course we have been following for a number of years now, including the success
Jef Colruyt CEO Colruyt Group
5
INTRO | Word from the Chairman • Who are we? • Our strategy • Our vision on sustainability • Management report • Key figures
Who are we?
A family business
Colruyt Group is a family business that has grown over three generations into a retail group with over 33.000 employees and a diverse portfolio of food and non-food formats, in Belgium and abroad. The biggest activity remains our supermarket Colruyt, which has delivered on its brand promise of “Lowest Prices” day after day for 50 years. Over the last half a century, we have diversified our activities substantially. However, we remain true to retail, which still accounts for four fifths of our revenue. Today, we are active in retail with around ten business formats, with both physical outlets and online shops in Belgium, Luxembourg and France. In addition, we operate in foodservice and wholesale, for instance as a dedicated partner for the independent Spar stores. In recent years, we have also grown strongly as a producer and supplier of renewable wind and solar energy. Finally, it is typical of Colruyt Group that we continue to do many things ourselves. We possess a wealth of experience and expertise in areas such as technology, IT and communication, as well as production and packaging of meat, coffee, cheese and wine, for example.
Complementary brands, shared values
At Colruyt Group, we want to make a positive difference with everything we do. At every stage of life and at all important moments in our customers’ lives, we want to be there for them in a suitable way. For this reason, we aim for maximum complementarity between our different brands. One by one, they differentiate themselves with simple solutions for specific requirements. Each in their own, authentic way, our brands express the ‘simplicity in retail’ that we represent as Colruyt Group. In this way, each brand helps achieve our common mission. Each business format also embodies the same group values. Together, they form the foundation on which we continue to build as a group and a point of reference in this rapidly changing world. For ourselves, for our partners and for our customers. So they all know what they can expect of us, and that creates trust in turn.
Working towards our goals
In stormy times, it is the roots that determine how firmly our tree stands. The fruits on our tree are our results. But results are merely a consequence. They merely tell us something about how we performed in a given context. That’s why, at Colruyt Group, we don’t focus on results but on goals. That means setting a goal and doing the right thing towards it in the here and now. We are focussed, have confidence in our own ability and hope for the best possible outcome. Not by concentrating on the fruits, but by staying focussed on our orchard and looking after our ‘terroir’.
INTRO | Word from the Chairman • Who are we? • Our strategy • Our vision on sustainability • Management report • Key figures 6
7
INTRO | Word from the Chairman • Who are we? • Our strategy • Our vision on sustainability • Management report • Key figures
To make a positive difference with everything we do
Firm roots
Knowing where you come from helps you understand where you are going. At Colruyt Group, we greatly value the insights and experience that three generations of entrepreneurship have brought us. We know who we are, what we stand for together, we appreciate our own strengths, identity and culture. In this way, we manage to keep a family atmosphere and an SME attitude, as a company that now has more than 33.000 employees.
Faith in people
At Colruyt Group, we always start with a positive view of people. We believe in people’s creative power to see and seize opportunities. We assume that every employee is driven to deliver quality and can add something to the greater whole. So, we do all we can to allow our employees’ natural life energy to flow as effectively as possible. That stimulates their entrepreneurship and growth, in their craft and as people. After all, as the people grow, our company will grow. Our positive view of people stems from a wider, more positive worldview and our optimistic nature. We are convinced that through our enterprise, we help build a world in which we all want to live. Step by step, together with colleagues, customers and partners.

INTRO | Word from the Chairman • Who are we? • Our strategy • Our vision on sustainability • Management report • Key figures 8
Common purpose
Our group mission is to channel the creative power of our people.That is our shared ‘why’. At Colruyt Group we want to:
Create sustainable added value together through value-driven craftsmanship in retail.
• Together. Only together with our colleagues, suppliers, business partners, investors and customers can we make a positive difference.
• Added value. Creating social added value gives our work meaning, generates satisfaction and makes us wiser. Those are the true, lasting ‘rewards’. Money, on the other hand, is merely a resource that we invest to realise our common dream.
• Sustainable creation. Every day, we start with a blank page. We gaze in amazement at the world to see what is possible, conscious of our strengths and limitations. And we don’t waste energy needlessly from ourselves, our environment or nature.
• Value-driven. Our values form a common frame of reference that determines how we behave and cooperate with one another. They ensure that we act coherently and consistently, in everything we do.
• Craftsmanship. Living craftsmanship is a source of joy and pride. Our company’s success is determined by the skills, attitudes and knowledge of our employees and their teams.
• In retail. Our craft is still retail, even though, over time, our entrepreneurship and creative drive have spawned many other initiatives.
9
INTRO | Word from the Chairman • Who are we? • Our strategy • Our vision on sustainability • Management report • Key figures
Driven by values
At Colruyt Group, we identify nine core attitudes that we consider valuable in helping us realise our mission. They have grown historically and capture the essence of what we all stand for. These values form, so to speak, the roots that feed our tree and determine who we are. Our values inspire us and give meaning to what we do. But they only ‘live’ insofar as we actually apply them in our everyday work. In order to focus on that, at Colruyt Group we also link nine focus points to our values. These help us act consistently and authentically.
Our values story
We have Respect for every individual. That is the basis for our interaction. Every person is equal, despite the great differences in appearance, culture, background, skills, knowledge, interests, etc. Our Togetherness, the realisation that we all rely on one another to be able to work well, is the basic attitude that enables us to work together as a team. We love to serve others. Our Readiness to serve is therefore the basic attitude required to be able to deliver quality day after day. In this, we aim for Simplicity by reducing things to essentials. That helps us work efficiently and essentially.
To be able to produce good work, we need several other things. Starting with our Faith in people’s positive intentions. That is essential if we are to trust. Our Hope then invites us to
invest the necessary time and resources, to be clear in our expectations and eventually to let go and be open to the results that follow. It is essential here that we allow ourselves the Space to pause, take a step back and consider what we are doing. As soon as our head is too ‘full’, that consciousness vanishes and we fall behind.
Finally, we demonstrate inner Courage in showing enterprise. With a positive attitude and a fresh, creative view, constantly working hard and mastering our craft, step by step. That is where our Strength lies, through which we experience satisfaction and fulfilment in our job.
INTRO | Word from the Chairman • Who are we? • Our strategy • Our vision on sustainability • Management report • Key figures 10
11 INTRO | Word from the Chairman • Who are we? • Our strategy • Our vision on sustainability • Management report • Key figures
Our strategy
To be able to fulfil our mission, we have developed a long-term strategy and formulated clear ambitions and objectives. The common thread is and remains that we want to do business sustainably and at the same time facilitate conscious consumption, as a strong and constantly innovative local player.
Our starting point at all times is our customers and their evolving needs, including greater control over their budgets, their desire to live healthier and more sustainable lives, their need for greater convenience, or the right offer at the right time.
Food
Food retailing is our profession, which we pursue via strong physical and online store formats and efficient logistics. We continue to renew and enrich our range, for example with OTC pharmacy, meal boxes and flowers. About a third of our sales revenues from private-label products is produced by us.
Health & well-being
We want to positively impact the health of employees, customers and society. For this, we are building an ecosystem that promotes a preventative approach to wellness and health, among others through the Jims fitness clubs and our Newpharma online pharmacy.
We intend to meet these needs in three ways. We want to make our customers’ lives easier with relevant, simple solutions (Simplify), offer them opportunities to make more (environmentally) conscious choices (Empower) and to connect more with each other, society and our company (Connect).
To be truly relevant in our customers’ lives, we offer them products and services in four areas: food, health and well-being, non-food and energy. In these areas, we are active with a wide range of complementary brands, together representing around a quarter of an average household budget.
Non-food
Non-food remains an essential component of our total offering. We are well represented on the Belgian non-food market with strong brands such as Zeb, Bike Republic, Dreambaby and our share in Dreamland.
Energy
We have considerable expertise in producing renewable energy from wind and solar sources, and in distributing it to private and professional customers.
INTRO | Word from the Chairman • Who are we? • Our strategy • Our vision on sustainability • Management report • Key figures
12
We are keen to accumulate further specialist skills in these areas of expertise in the coming years, and continue to grow. In each area of expertise, we group several brands and activities, so as to manage them in a targeted and professional manner. Of course, we will seek strong cooperation across these areas of expertise and develop synergies to offer our customers optimal solutions. Our Xtra app is enabling us to know our customers ever better, and therefore tailor our offering even closer to their needs.
To give more concrete form to our ambitions and objectives, we have formulated four strategic changes, on which we will be focusing strongly in the coming years.
• Being the most cost-efficient retailer, in our stores, logistics and support services, by focusing on economies of scale, automation and digitalisation. In this way, we can offer a high-quality, correctly priced basic range on a permanent basis.
• Being a ‘phygital’ retailer, in which the physical and the digital reinforce each other. Using data to lead the way in online shopping.
• Being the best retailer for our customers, through skills excellence in all our activities.
• Growing further by responding to opportunities for new synergies and commercial formats, including in city concepts, in France and Luxembourg, in B2B, in digital business, etc.
To bring these changes to a successful conclusion, we will continue to focus, among other things, on committed and skilled employees, strong leadership and an agile organisation. Naturally, true to our mission, we want to continue to create added value in a value-driven, economically sustainable manner, with respect for people and the environment.
13 INTRO | Word from the Chairman • Who are we? • Our strategy • Our vision on sustainability • Management report • Key figures
Our vision on sustainability
Sustainability has been a common thread through all our activities for many years. For us, sustainability is no longer just a collective name for various social themes, but rather the basis for long-term success and growth. Essential for responding quickly and flexibly to the complex challenges of an everchanging world. Doing business sustainably is more important than ever.
We recently sharpened our sustainability strategy with clear ambitions and objectives. In the coming months, we will flesh out in concrete terms how we will realise these. One thing is certain: we are joining forces with all our partners in the supply chain. Because together we are so much stronger for creating a sustainable positive impact.
INTRO | Word from the Chairman • Who are we? • Our strategy • Our vision on sustainability • Management report • Key figures 14
Sustainability right across the value chain
As a retailer with our own production departments, we have an impact throughout the entire supply chain. With this come many opportunities to make our activities more sustainable. We are committed to innovation and collaboration to continuously reduce our ecological footprint, based as far as possible on scientific methodologies. Moreover, our unique position in the chain enables us to connect the various partners in it, to inspire them and to act as a driver for a sustainable evolution.
• Raw materials. As a retailer, we use our economic drive to stimulate positive social, environmental and animal-friendly practices at the producers, farmers and suppliers from whom we purchase our raw materials and products.
• Processing. Our goal is to both reduce the environmental footprint of our products and increase our positive social impact. We are also working to improve the nutritional values of our private-label products.
• Transport. We organise our goods transport as efficiently and safely as possible, with respect for the environment and our neighbours.
• Sales. We are always looking for the most sustainable solutions for keeping our products cool, for energy consumption in our stores, for customer and employee mobility, and more.
• Use of products. With ‘Step by step’, we inform and activate our customers towards consciously making more sustainable choices.
• Recycling/re-use. Following the principles of the circular economy, we want to reuse, upgrade or recycle the residual flows of our products and packaging as much as possible.
15
verwerking transport transpor verkoop oop consump e e afval/recyclage afval/ clage grondstoffen ondst Transforma on orma Transport ansport Vente Consomma on Déchets/recyclage Ma ères premières pr processing ocessing transport transpor sales s consump on waste/recycling waste/ cling raw materials Raw materials Processing Transport Sales Use Recycling/ re-use INTRO | Word from the Chairman • Who are we? • Our strategy • Our vision on sustainability • Management report • Key figures
Our approach to sustainable business
17 SDGs to report on


INTRO | Word from the Chairman • Who are we? • Our strategy • Our vision on sustainability • Management report • Key figures
Client
EnergyMobility Water AtmosphereBiodiversityAgricultureRawmaterialsAnimalwelfareLivingtogetherWorkingLearningtogether Healthtogether
drivers on which we organise ourselves
than 150 projects 12 programmes to make a difference Product Infrastructure People 16
4 themes to consume more consciously
3
More
3 drivers on which we organise ourselves
Our sustainability policy is guided by three drivers. To start with: our products and services, the core of our activity as a retailer. A second driver is the infrastructure we use to bring those products and services to our customers. People are our third driving force. We implement our sustainability projects together with our employees, our business partners, our customers, our investors, knowledge institutions, governments, sector federations and other social organisations.
With the Sustainability Domain and the Domain Board as overarching bodies, our organisational structure guarantees an ecosystem in which sustainability is deeply rooted.
The Sustainability Domain helps formulate the sustainability vision, strategy and objectives, provides risk management and ensures compliance.
The Domain Board, chaired by the CEO, monitors our progress towards our objectives and the integration of sustainability throughout the organisation.
For each driver, a director is responsible for the implementation of the respective projects.
12 programmes to make a difference
In our sustainability strategy, we focus on a number of themes. These form our 12 sustainability programmes. For each programme, we believe we can achieve a concrete positive impact, in every link of the chain. The term ‘programme’ indicates that our work is never finished: once we achieve our goals, we set new ambitions. In this way, over time we achieve more than we ever thought possible.
17
People
Product Infrastructure
Mobility Energy Water Atmosphere Raw materials Agriculture Biodiversity Animal welfare Living together Learning together Working together Health INTRO | Word from the Chairman • Who are we? • Our strategy • Our vision on sustainability • Management report • Key figures
4 themes to consume more consciously
To make it easier for our customers to consume consciously, we communicate very transparently about our sustainability efforts. Products, services and initiatives with strong ambitions and a demonstrable impact on health, society, animal welfare or environment receive one or more colourful icons corresponding to these four themes. In this accessible way, we seek to encourage our customers to consciously make more sustainable choices.
17 Sustainable Development Goals to report on
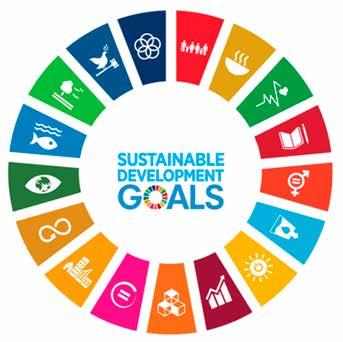
Our efforts for a more sustainable world align seamlessly with the 17 United Nations Sustainable Development Goals (SDGs). Together they form a common sustainability agenda with concrete objectives, not only for society, the economy and the environment, but also for human rights and world peace. As an ‘SDG Voice’, we attach great importance to this ambitious agenda, because it offers us:
• an external view of what sustainability entails and can entail,
• a common language to use with external stakeholders,
• and a common base from which to tackle a whole range of societal challenges.
We use the 17 Sustainable Development Goals as a compass for our sustainability strategy and a reporting framework for our achievements.
INTRO | Word from the Chairman • Who are we? • Our strategy • Our vision on sustainability • Management report • Key figures 18
Materiality analysis to determine our focus points
Where do we have the most impact?
Sustainability goes a long way. To determine our focus points, we performed a materiality analysis in March 2022. The term ‘materiality’ indicates how important or ‘material’ a certain sustainability theme is for an organisation and its stakeholders. Themes that score high on both axes of a so-called ‘materiality matrix’ are close to the heart of both the organisation and stakeholders. It is these themes where as a company you can have the greatest impact.
This financial year, we use last year’s materiality matrix as our baseline. We shall prepare a new matrix in the 2024/25 financial year. In this way, we keep our finger on the pulse.
Three-dimensional materiality matrix
Our materiality matrix on p. 21 is the visual representation of three dimensions.
• First dimension (the vertical y-axis): based on international frameworks (GRI, SASB, SDGs) and our own sustainability strategy, we selected 21 topics where we as a company can make a difference. We asked 355 stakeholders which topics have the highest priority for them. We plotted these results on the vertical axis.
• Second dimension (the horizontal x-axis): Colruyt Group’s impact on the environment and society. Based on input from recognised sources like SASB, MSCI and GRI, we analysed the risks and opportunities in the retail sector. We plotted these results on the horizontal axis.
• Third dimension (the size of the circles): the financial impact of the topics on Colruyt Group. With this, we comply with the principle of double materiality: we weigh both the impact by our business and the impact on our company.
19
INTRO | Word from the Chairman • Who are we? • Our strategy • Our vision on sustainability • Management report • Key figures
7 material sustainability topics and 6 respective SDGs
The result is a matrix that shows how ‘material’ each topic is for Colruyt Group. Highest-scoring topics are healthy products, product safety and quality, working conditions in the chain, emissions, energy management, responsible sourcing and fair and sustainable trade. We link these seven material topics to the matching Sustainable Development Goals, our chosen framework for reporting on our achievements.
Topic SDG
Healthy products SDG 3 – Good health and well-being
Product safety and quality
SDG 12 – Responsible consumption and production
Working conditions in the chain SDG 8 – Decent work and economic growth
Emissions SDG 13 - Climate action
Energy management
SDG 7 – Affordable and clean energy
Responsible sourcing SDG 12 – Responsible consumption and production
Fair and sustainable trade
SDG 2 – Zero hunger and SDG 12 – Responsible consumption and production
We also report on SDG 6 – Clean water and sanitation given the importance we attach to this in our business strategy.
We will of course continue to focus on the other SDGs. For example, we consider Peace, justice and strong institutions (SDG 16) and Partnerships for the goals (SDG 17) as levers for reaching all the other SDGs. We work closely with our partners and suppliers, always with mutual respect and on the basis of dialogue and trust.
INTRO | Word from the Chairman • Who are we? • Our strategy • Our vision on sustainability • Management report • Key figures 20
21
1 Healthy products 2 Product safety and quality 3 Product transparency and responsible sales practices 4 Development and training 5 Local involvement 6 Diversity and inclusivity 7 Working conditions in the chain 8 Safety, health and well-being at Colruyt Group 9 Animal welfare 10 Emissions 11 Biodiversity 12 Energy management 13 Food loss 14 Sustainable packaging 15 Responsible sourcing 16 Waste management 17 Fair and sustainable trade 18 Sustainable transport 19 Water management 20 Data security and customer privacy 21 Sound governance Medium Colruyt Group’s impact on the ecosystem Importance for our stakeholders Medium High High Low 19 6 4 5 9 8 3 1 2 15 7 10 12 17 18 16 14 11 13 20 21 Y Importance for our stakeholders X Colruyt
on
environment and society Size
X Y INTRO | Word from the Chairman • Who are we? • Our strategy • Our vision on sustainability • Management report • Key figures
Materiality matrix
Group’s impact
the
of the circles: the financial impact of the material topics on our business activities
7 objectives for the future and 27 sub-objectives to achieve them
We have recently sharpened our sustainability strategy with seven objectives. These respond to the most important sustainability challenges facing us and the material sustainability topics. To efficiently achieve these objectives, we classify them according to our three drivers: product, infrastructure and people
The environment and society are the common thread running through our objectives:
• In the ecological area, we intend to reduce our environmental footprint as much as possible and promote the circularity of raw materials, materials and products. Our products are responsible for 95% of our environmental impact. So we can make a big difference here.
• In the social area, we want to make a positive contribution by focusing on safeguarding human rights in the chain, actively promoting balanced and sustainable lifestyles and supporting target groups in a vulnerable context.
We consciously set objectives for the entire supply chain: from the sourcing of raw materials, through our own retail activities, to our customers. We hope that our new objectives will also inspire others and are convinced that collaboration is the key to creating a lasting positive impact.
To concretely realise our seven overarching objectives, we have formulated 27 sub-objectives. At the time of publication of this annual report, these (sub-)objectives are still new. Because we want to be transparent, we already share them here. We have already incorporated a number of them into our sustainability reporting. From next year, we will integrate all (sub-)objectives in our reporting and communicate clearly about our progress.
Circular products
By 2030, all our products will comply with the principles of the circular economy.
Reducing environmental impact of our products
By 2035 we will halve the environmental impact of the products we sell.
Buying socially responsibly
By 2035 we will purchase all our products and services in a socially responsible manner.


Food loss and food waste
Every year we sell at least 97,4% of our fresh produce. By 2025, at least 40% of unsold products that are still consumable will serve for human or animal consumption.
Protection and restoration of ecosystems
By 2030, we will eliminate deforestation and land use conversion for products from high-risk chains.
Human rights
We promote human rights by actively identifying and remedying human right violations.
Packaging
By 2030, all packaging in our stores will be recyclable or reusable.
Climate change

By 2027, 77% of our suppliers (by purchase figures) will have science-based climate plans.
Inclusive business practices
By 2030, we will integrate inclusive business practices in our key private-label chains.
Circular business models
We are introducing circular business models into our (non-food) retail activities.
Water footprint
By 2025, 70% of our products from high-water-risk regions will meet a water standard.
Living standards
By 2030, we will close the living wage and living income gap for our top five high-risk commodities.
Due diligence
By 2025, we will know the country and region of origin (and where possible also links in the chain) for our private-label products. By 2030, this will also apply to national brands and indirect purchases. By 2027, we will have fully integrated due diligence into our business processes.
Sustainable sourcing

By 2030, our environmental, social and animal welfare objectives will be fully integrated into our commercial chains.

Product
INTRO | Word from the Chairman • Who are we? • Our strategy • Our vision on sustainability • Management report • Key figures
22
Infrastructure
Reducing environmental impact of our own operations
We are working towards the lowest possible environmental impact of our business operations and infrastructure.
Promoting sustainable consumption
By 2030, 50% of our recognised customers will display more sustainable consumption patterns.
Reducing and recycling waste
We strive for an annual decrease of the waste tonnage/million euros of revenue and a minimum recycling rate of 85%.


Protein shift

By 2028, 60% of the proteins in our sold products will come from plant sources and 40% from animal sources.

People


No one left behind
We are using our leverage to support target groups in a vulnerable context.
Access to balanced, sustainable diet
We make balanced, sustainable diet accessible by focusing on, among other things, an affordable, high-quality product offering, information and awareness-raising, and appropriate infrastructure.

Workable and meaningful jobs
We provide and promote workable and meaningful work for every employee.
Healthier employees
Every year, 25% of our employees participate in a health-related learning initiative. We also continue to monitor workplace safety.
Our objectives are linked to our 12 programmes
Circular water consumption
By 2030, 50% of our total water consumption (excl. bottled water for sale) will come from rain- and wastewater.
Eco-score
By 2026, we will generate 34,5% of our revenue from Eco-score A and B products.


Increasing opportunities
We promote the integration of target groups in a vulnerable context, both in society and the labour market.
Committed and satisfied employees
Employees feel seen, heard and involved. This is also reflected in constructive social dialogue.


Circular building
By 2050, we will take a 100% circular approach to construction and furnishing materials under our own management.


Nutri-Score
By 2026, we will generate 46% of our revenue from Nutri-Score A and B products.
Every customer feels welcome and respected
Our digital and physical touchpoints are accessible and our communication is inclusive.
Equal opportunities
By 2030, all employee-related processes will be inclusive. We are also increasing diversity within our workforce and management.
Direct greenhouse gas emissions


By 2030, we will reduce our greenhouse gas emissions for scopes 1 and 2 by 42% compared to 2021. By 2030, we will also have net-zero emissions in scopes 1 and 2.
Sustainable savings programme
By 2025, 15% of our recognised customers will be actively using our sustainable savings programme.
Energy consumption


By 2030, we will reduce our energy consumption by 20% (per million euros of revenue) compared to 2009.
Employees as ambassadors
All our employees actively contribute to sustainable business practices and conscious consumption.
23
INTRO | Word from the Chairman • Who are we? • Our strategy • Our vision on sustainability • Management report • Key figures Raw materials Biodiversity Agriculture Atmosphere Water Working together Animal welfare Energy Mobility Learning together Living together Health
Sustainability reporting
Our full sustainability reporting can be found in the ‘Corporate sustainability’ chapter, starting on page 153. This presentation of non-financial information and diversity is based on Articles 96, §4 or 119, §2 of the Belgian Code on Companies and Associations, implemented by the Belgian Law of 03/09/2017 transposing EU Directive 2014/95/EU.
More sustainable stories
Scan the QR code and discover our sustainable achievements, through the eyes of our passionate colleagues and partners.
INTRO | Word from the Chairman • Who are we? • Our strategy • Our vision on sustainability • Management report • Key figures
24
Management report
Revenue grows 7,7% Market share increases to 31,0% Lower operating result and net result
Headlines financial year 2022/23 (1)
The financial year 2022/23 was marked by a challenging macroeconomic context with high inflation, substantial cost increases and a negative business and consumer confidence.
This context translates into a 7,7% increase of the Colruyt Group revenue (7,4% excluding fuels and 6,9% excluding fuels and Newpharma). The revenue increase is mainly driven by inflation, partially offset by lower volumes. The Belgian retail market is characterised by volume declines in food stores and high competitiveness. In this context, Colruyt Lowest Prices continues to consistently implement its lowest price strategy. This implies that Colruyt Group has not been able to fully pass on cost price inflation to the customer, bringing down the gross profit margin.
In addition, today’s context causes Colruyt Group’s operating expenses to increase markedly. This increase is mainly attributable to rising inflation, with a large impact on energy, transport costs and employee benefit expenses. The latter are heavily impacted by Belgium’s automatic wage indexation system. The group succeeded in limiting the increase in operating expenses in part through an increased focus on cost control and (energy) efficiency.
Impairment charges rose by EUR 27 million to EUR 33 million. This is mainly due to the valuation of
tangible and intangible fixed assets related to the lossmaking operations of Dreamland and Dreambaby.
This results in a decrease of the group’s operating profit and net result to, respectively, EUR 279 million (2,6% of revenue) and EUR 201 million (1,9% of revenue) in 2022/23.
In October 2022, Colruyt Group further increased its stake in Newpharma from 61 to 100%. Since then, Newpharma has been fully consolidated (period from October to December 2022). This has contributed to the consolidated revenue. The impact on the operating profit and the net result is limited. Colruyt Group’s investments amounted to EUR 463 million in the financial year 2022/23 (4,3% of revenue) and related mainly to new stores and the modernisation of existing stores, to the expansion of logistics capacity in Belgium and France, to innovation and digital transformation programmes, and to renewable energy and energy efficiency. The combination of the above elements results in an increase of the net financial debt (excluding IFRS 16) to EUR 691 million compared to 31 March 2022 (EUR 523 million excluding IFRS 16).
CEO Jef Colruyt:
“We look back on a challenging financial year that ended in a strong decrease in result. We intensified our efforts and increased our focus on operational cost control and efficiency, as well as cash management. Partly thanks to these efforts, the results declined less than initially feared in the financial year 2022/23. Together with our employees, who give their best day in day out, we as a group purposefully continue to work towards building a healthy, sustainable future. And - thanks to the successful issuance of our green retail bond in February 2023 - we also feel supported in this effort by investors. We maintain a critical mindset and adjust where needed, while always holding firm to our long-term strategy.”
(1) The headlines have been formulated based on the key figures and thus include DATS 24 NV. For a reconciliation between the key figures and the consolidated income statement (in which DATS 24 NV is presented as a discontinued operation), we refer to the annex on page 33 ‘Reconciliation of key figures and consolidated income statement’.
25
INTRO | Word from the Chairman • Who are we? • Our strategy • Our vision on sustainability • Management report • Key figures
Consolidated key figures (1)
(1) The key figures are inclusive of DATS 24 NV. For a reconciliation between the key figures and the consolidated income statement (in which DATS 24 NV is presented as a discontinued operation), we refer to the annex on page 33 ‘Reconciliation of key figures and consolidated income statement’.
(2) The weighted average number of outstanding shares equalled 127.967.641 in 2022/23 and 132.677.085 in 2021/22.
(in million EUR) 01/04/202231/03/2023 % of revenue 01/04/202131/03/2022 % of revenue Variance Revenue 10.820 10.049 +7,7% Gross profit 2.931 27,1% 2.752 27,4% +6,5% Operating cash flow (EBITDA) 685 6,3% 741 7,4% -7,5% Operating profit (EBIT) 279 2,6% 375 3,7% -25,8% Profit before tax 270 2,5% 383 3,8% -29,5% Profit for the financial year 201 1,9% 288 2,9% -30,4% Earnings per share (in EUR) (2) 1,57 2,16 -27,6%
INTRO | Word from the Chairman • Who are we? • Our strategy • Our vision on sustainability • Management report • Key figures 26
Consolidated income statement
Colruyt Group’s revenue rose by 7,7% to EUR 10,8 billion in 2022/23. Revenue was positively impacted by the revenue increase from the fuel distribution activities of DATS 24 (excluding petrol, revenue improved by 7,4%), the full consolidation of Roelandt Group and Newpharma and increased food inflation. On the other hand, revenue evolution was negatively affected by the declining volumes.
Colruyt Group’s market share in Belgium (Colruyt Lowest Prices, Okay and Spar) rose to 31,0% in the financial year 2022/23 (30,8% in 2021/22). At the start of the financial year 2023/24, the market share maintains its upward trend
The gross profit margin decreased to 27,1% of revenue. Excluding petrol, the gross margin declined by 40 basis points. The Belgian retail market remains highly competitive. As a retailer and as the market leader, Colruyt Group continues to fulfil its role in society, whereby customers can count on the group to help them stay on top of their household budgets. This implies that Colruyt Group has not been able to fully pass on cost price inflation to the customer.
Net operating expenses climbed from 20,0% to 20,8% of revenue. This significant increase is mainly attributable to rising inflation, with a large impact on energy costs, transport costs and employee benefit expenses. The latter are heavily impacted by the automatic wage indexation system in place in Belgium. In view of the current market conditions, Colruyt Group monitors to a maximum extent cost management and improvements in efficiency. The group succeeded in
limiting the increase in operating expenses in part through an increased focus on cost control and (energy) efficiency. In addition, the group maintains its long-term focus and pursues its investments in sustainability and efficiency, digital transformation and innovation, employees and high-quality house-brand products in a targeted manner.
The operating cash flow (EBITDA) reached 6,3% of revenue (7,4% in 2021/22).
The depreciation, amortisation and impairment charges rose by EUR 41 million. Depreciation and amortisation charges rose by EUR 15 million, mainly as a result of the continuous investments in stores, distribution and production centres and transformation programmes. Impairment charges rose by EUR 27 million to EUR 33 million. This is mainly due to the evaluation of tangible and intangible fixed assets related to the loss-making operations of Dreamland and Dreambaby.
The operating profit (EBIT) totalled EUR 279 million or 2,6% of revenue in 2022/23 (3,7% in 2021/22).
Taking into account an effective tax rate of 25,8%, the profit for the financial year amounted to EUR 201 million (1,9% of revenue), a decrease by 30,4% compared to 2021/22 (EUR 288 million or 2,9% of revenue).
81%
REVENUE
8% OTHER ACTIVITIES
27
INTRO | Word from the Chairman • Who are we? • Our strategy • Our vision on sustainability • Management report • Key figures Colruyt Group revenue (in million EUR) 8.652 8.917 9.177 9.493 9.031 9.434 9.581 9.931 13/14 14/15 15/16 16/17 17/18 18/19 19/20 20/21 21/22 22/23 (1) 10.049 10.820
11% WHOLESALE AND FOODSERVICE RETAIL
(1) Revenue based on the key figures and therefore inclusive of DATS 24 NV. For a reconciliation between the key figures and the consolidated income statement (in which DATS 24 NV is presented as a discontinued operation), we refer to the annex ‘Reconciliation of key figures and consolidated income statement’ on page 33.
Colruyt Group results (in million EUR)
(1) Results based on the key figures and therefore inclusive of DATS 24 NV. For a reconciliation between the key figures and the consolidated income statement (in which DATS 24 NV is presented as a discontinued operation), we refer to the annex ‘Reconciliation of key figures and consolidated income statement’ on page 33.
Income statement per segment Retail
Revenue from the retail activities grew by 7,2% to EUR 8.750 million. The retail activities accounted for 80,9% of the consolidated revenue in 2022/23.
In a highly competitive market environment, food retail revenue increased by 6,6%. This increase is a result of food inflation and the full consolidation of Roelandt Group in January 2022, partially offset by volume declines in food stores.
As from this financial year, the online revenue of Dreamland and Dreambaby is reported in the non-food retail revenue section, regardless of which store realised the revenue. As a result, the related comparative figures have been reclassified.
Revenue of Colruyt Lowest Prices in Belgium and Luxembourg increased by 6,9% for the reasons mentioned above. Colruyt Lowest Prices continues to consistently implement its lowest prices strategy and delivers on its commitment to its customers day after day. This implies that Colruyt Group has not been able to fully pass on cost price inflation to the customer.
During the financial year 2022/23, eleven stores were renewed and five new Colruyt stores opened, one of which is located in Luxembourg.
Colruyt Lowest Prices once again won several prizes this year. It was presented with the Best Brands Award 2023 in the Best Retail Food Brand category and ranked first in the GfK summer and winter reports in 2022.
Okay, Bio-Planet and Cru reported an aggregate revenue growth of 2,4%. Revenue is im-pacted by price inflation, which is partly offset by volume declines.
As a neighbourhood discounter, Okay continues to commit to providing a quick, cheap and easy shopping experience. Okay’s store network expanded with three stores in the financial year 2022/23, while the renewed store concept was rolled out in several stores. In addition, a second Okay Direct was opened, which targets an audience that wants to shop faster, also outside traditional opening hours and on Sundays. Okay was voted best store chain in the category Convenience in 2022/23.
Bio-Planet remains a pioneer in sustainability with a large range of organic, eco-friendly and local products and healthy food. In the past financial year, the energy crisis and inflation caused a contraction of the organic market, resulting in a revenue decrease. During the financial year 2022/23, two new stores featuring a renewed store concept opened their doors, one in St. Denijs-Westrem and one in Tournai.
At the end of September 2022, Cru opened its fourth market on the Eylenbosch site in Dilbeek. A passion for tasty
INTRO | Word from the Chairman • Who are we? • Our strategy • Our vision on sustainability • Management report • Key figures
13/14 14/15 15/16 16/17 17/18 18/19 350 363 366 383 374 384 488 495 507 493 488 485 21/22 20/21 288 416 375 523 19/20 431 511 14% WHOLESALE AND FOODSERVICE 87% RETAIL 10% OTHER ACTIVITIES - 10% CORPORATE EBIT 22/23 (1) 201 279 EBIT Profit for the financial year
28
artisan products and customer experience combined with craftsmanship remain at the forefront for the Cru multiexperience markets. In the meantime, they pursue their efforts to improve operational efficiency.
The revenue of Colruyt in France (including the fuel distribution activities of DATS 24 in France) rose by 10,5%. Excluding petrol, the revenue of Colruyt in France increased by 9,3%. The French retail market is also facing high food inflation and volumes that are under pressure. Three new stores opened in France during the financial year 2022/23. Colruyt Prix-Qualité is a clearly laid-out neighbourhood supermarket, where customers can find everything they need for their daily and weekly shopping. Colruyt Group will continue to make targeted investments in its French retail activities by opening new stores, renewing existing stores and doubling the logistics capacity in the years ahead.
Non-food retail revenue increased by 15,5% compared to last year and comprises the store revenue and online revenue of Dreamland, Dreambaby, Bike Republic, The Fashion Society and Jims. Since October 2022, Newpharma has also been fully consolidated (period from October to December 2022). As from this financial year, the online revenue of Dreamland and Dreambaby is also reported in the non-food retail revenue section, regard-less of which store realised the revenue. As a result, the related comparative figures have been reclassified.
Despite their leading market positions, Dreamland and Dreambaby are experiencing de-creasing volumes with a substantial negative impact on their profitability. This is the result of the challenging markets in which both nonfood activities operate and is strengthened by the current macroeconomic environment. Over the past months, several corrective measures have been taken to allow Dreamland and Dreambaby to consolidate their market position and become profitable in a sustainable way. The online assortment of Dreamland has been reviewed recently, as have the delivery rates for online orders. Colruyt Group believes additional measures are necessary for Dreamland and Dreambaby to progress to-wards a healthy, sustainable future. In April 2023, the management informed the works council of its intention to restructure Dreamland and Dreambaby (which together form one technical business unit). The execution of this plan would have an impact on the employment whereby the Procedure Renault with regard to collective redundancies would be applied.
In addition, Colruyt Group has reached a principle agreement with ToyChamp whereby ToyChamp would obtain 75% of the shares of Dreamland and thus gain control over Dreamland. Upon completion of the transaction, Dreamland would no longer be fully consolidated in the consolidated figures of Colruyt Group.
The revenue of Bike Republic, The Fashion Society and Jims grew strongly in 2022/23 by, respectively, 84,6%, 14,5% and 66,4%.
Bike Republic expanded its store estate with no fewer than six stores and is a leading play-er in its respective market.
The Fashion Society, the holding that comprises the fashion chains Zeb, PointCarré and The Fashion Store, expanded its store estate with five stores.
Jims has 34 fitness centres (30 in Belgium and four in Luxembourg) and also offers group exercise classes and digital coaching. In the first half of the year, a new Jims fitness opened in Kuurne. In the second half of the year, six Oxygen Fitness gyms were acquired and a new Jims was opened in Kirchberg (Luxembourg).
In October 2022, Colruyt Group’s stake in the online pharmacy specialist Newpharma was increased from 61% to 100%. Newpharma was accounted for using the equity method from January 2022 to September 2022 and was fully consolidated from October 2022 to December 2022.
Colruyt Group invests in and innovates its online store concepts and digital applications in a targeted way.
In 2022/23, Colruyt Group’s online sales amounted to 6,8% of the retail revenue, excluding petrol. Colruyt Group’s online revenue is primarily generated by Collect&Go. The shopping service of the Colruyt and Bio-Planet stores is the market leader in the Belgian online food market. In June 2022, Colruyt Group launched a home delivery service via Collect&Go, with orders being delivered by its own employees in Brussels and Antwerp.
In February 2023, a second Collect&Go Walk-in collection point, equipped to meet the needs of city dwellers who collect their shopping on foot or by bicycle or scooter, opened in Sint-Gillis.
In September 2022, Colruyt Group’s Xtra app was revamped. Customers can use the app to make payment, to put together shopping lists, to save receipts, warranty certificates and vouchers, and to look up product characteristics by means of a
bar code scanner. New, use-ful features will regularly be added in the coming months.
Innovation and sustainability remain the common threads running through all Colruyt Group’s activities. Smart Technics, Colruyt Group’s innovation hub, focuses on the introduction of robotics in distribution centres and the integration of technologies in the stores. Smart Technics developed the Product Finder technology and the easy check-out’, which are both being tested by the store employees of the Colruyt Lowest Prices store in Halle. The Product Finder technology shows store employees immediately where on the shelves a product needs to go. In the ‘easy check-out’, the products in the shopping cart are scanned automatically by a camera that uses artificial intelligence. Both innovations lead to time savings in the store. Since February 2023, the Okay Compact in Ghent has been testing the ‘assisted self check-out’, a new checkout system that enables customers to scan and settle their groceries themselves.
Colruyt Group is a reference point for sustainable entrepreneurship and a source of inspiration for conscious consumption. The group works towards this objective step by step, through a wide array of initiatives and partnerships. Since early November 2022, customers can save points through the Xtra app by buying food products with Eco-score A or B. These points can then be exchanged to support projects that contribute to a better environment. To this end, Colruyt Group cooperates with local partners by, for example, having them plant trees or sow flower meadows. In this way, we contribute to a better environment, step by step.
In late November, the group announced its ambition to make its freight transport zero-emission by 2035, both for its own transports to and from the stores and for the transports to the distribution centres via suppliers. The group relies on the expertise of Virya Energy and DATS 24 and on its years of experience in transport to achieve this. Moreover, the group actively enters into dialogue on these matters with its network of (transport) partners and suppliers. This ambition will have a significant impact on Colruyt Group’s direct and indirect greenhouse gas emissions. In this context, Solucious invested in five electric, refrigerated trucks, a major step towards the 2035 target.
Colruyt Group is collaborating with The Seaweed Company in a project on soil health. The product TopHealth Plants, an
29 INTRO | Word from the Chairman • Who are we? • Our strategy • Our vision on sustainability • Management report • Key figures
organic seaweed-based biostimulant that naturally improves soil quality and health is used. It also increases plant growth and resilience and thus indirectly reduces the use of artificial fertilisers and pesticides. Colruyt Group will work with The Seaweed Company, in which Colruyt Group holds a minority stake, to study the applicability and benefits of using this biostimulant during the growing season. The use of seaweed as a biostimulant is increasing rapidly worldwide because it can play an important role in improving the sustainability of agriculture. In the years ahead, the group will continue to invest in making its patrimony more sustainable in various areas such as circularity, energy efficiency and greenhouse gas emission reduction.
Wholesale and Foodservice
Revenue from the wholesale and foodservice segment increased by 9,0% to EUR 1.161 million. These activities accounted for 10,7% of the consolidated revenue in 2022/23. Wholesale revenue rose by 3,7% as a result of food inflation, partly offset by lower volumes. The Spar Colruyt Group stores in Belgium position themselves as friendly neighbourhood supermarkets for daily grocery shopping, with a wide range of fresh products and personal service.
Colruyt Group continues to focus on a close, long-term collaboration with the independent entrepreneurs and intends to further expand its efficient independent store network in Belgium and France over the coming years. The acquisition of the French distribution group Degrenne Distribution, which has been completed at the beginning of July 2023, is in line with that ambition. Degrenne Distribution is a family-owned business that was founded in 1960 and specialises in the distribution of food products to a network of about 1.800 neighbourhood stores in the northwest of France and in the Ile-de-France region.
Revenue from the foodservice activities of Colruyt Group increased by 40,8% in 2022/23. The revenue was realised mainly by Solucious, Colruyt Group’s foodservice specialist that delivers foodservice and retail products to professional customers, including hospitals, SMEs and the hospitality sector. Solucious stands out by its convenience, its wide product range, its smooth and reliable deliveries and its fair and consistent pricing.
Other activities
Revenue from the other activities grew by 10,9% to EUR 908 million. These activities accounted for 8,4% of the consolidated revenue.
This segment basically comprises the revenue of the Belgian DATS 24 filling stations, which was positively impacted by price increases.
DATS 24’s ambitions include promoting greener mobility and raising the level of public acceptance of the sustainable energy transition. Today, this translates into investments in renewable energy, such as the expansion of the electric charging infrastructure and the construction of additional public hydrogen filling stations.
Since 1 June 2023 (after the balance sheet date), DATS 24 has been acquired by Virya Energy, which means that it will no longer be fully consolidated.
Colruyt Group is the majority shareholder of Virya Energy Virya Energy is active in the development, financing, construction, operation and maintenance of sustainable energy sources, with a particular focus on offshore and onshore wind energy. Virya Energy, which groups several energy expertise companies (including Parkwind, Eurowatt and Eoly Energy), is also working towards developing a service offering in offshore renewable energy (with stakes in GEOxyz, DotOcean and Fluves). Virya Energy has the ambition to continue to invest in other technologies besides onshore wind energy, such as solar and hydrogen, and to extend its scope to new activities and new geographies.
On 22 March 2023, Virya Energy signed an agreement with JERA to sell 100% of the shares of Parkwind, a 100% subsidiary of Virya Energy and the largest offshore wind energy platform in Belgium. The transaction is expected to close later this year and is subject to the approval by the relevant competition and other regulatory authorities.
The final price can still vary depending on the exact closing date but is expected to amount to at least EUR 1,55 billion (net of debt) at the level of Virya Energy. JERA invites Virya Energy to re-invest part of the expected proceeds from the transaction in a minority stake in Parkwind’s Belgian wind farms. The terms of such potential re-investment will be negotiated in good faith between both parties between signing and closing of the transaction.
The completion of the transaction will lead to a very large one-off positive effect in the consolidated net result of Colruyt Group in the financial year 2023/24. As per 31 March 2023, the net carrying amount of Virya Energy in the consolidated figures of Colruyt Group amounted to EUR 466 million (to a large extent attributable to Parkwind).
The revenue from printing and document management solutions relates to the activities of Symeta Hybrid.
INTRO | Word from the Chairman • Who are we? • Our strategy • Our vision on sustainability • Management report • Key figures
30
Consolidated balance sheet (1)
The net carrying amount of the tangible and intangible fixed assets increased by EUR 303 million to EUR 3.535 million. The increase is primarily the net effect of new investments (EUR 463 million), business combinations and changes in the consolidation scope (EUR 232 million, mainly due to the increase of the stake in Newpharma), depreciation charges (EUR 373 million), impairment charges (EUR 33 million) and the reclassification of the tangible and intangible fixed assets of DATS 24 to assets held for sale (EUR 64 million).
Colruyt Group continues to make targeted investments in its distribution channels, logistics and production departments, in renewable energy and in digital transformation programmes.
Investments accounted for using the equity method rose by EUR 78 million, mainly due to:
• An increase resulting from the convertible bonds which were issued by Virya Energy in the financial year 2020/21 and were converted in June 2022. The same transaction led to a decrease in current financial assets.
• An increase reflecting the revaluation of interest swap contracts within Virya Energy
• Partly offset by a decrease due to the change in consolidation method resulting from the increase of the stake in Newpharma
Cash and cash equivalents amounted to EUR 359 million at 31 March 2023.
The net financial debt (excluding IFRS 16) increased compared to 31 March 2022 and amounted to EUR 691 million on 31 March 2023. In February 2023, a green retail bond with a five-year maturity for an amount of EUR 250 million was issued with a 4,25% coupon per annum (gross).
Colruyt Group’s equity totalled EUR 2.510 million at 31 March 2023, accounting for 40,8% of the balance sheet total.
Treasury shares
In 2022/23, 3.169.026 treasury shares were purchased for an amount of EUR 94,8 million.
After year-end, 397.921 treasury shares were purchased for an amount of EUR 12,2 million.
On 9 June 2023, Colruyt Group held 7.085.901 treasury shares, which represented 5,28% of the total number of shares issued.
Events after the balance sheet date
Dreamland and Dreambaby
During an extraordinary works council held on 19 April 2023, Dreamland and Dreambaby announced their intention to restructure, to which the Procedure Renault applies. Dreamland and Dreambaby together employ about 1.100 employees. The intention to restructure affected 192 employees and also implied the closure of a limited number of stores (1 Dreamland store and 5 Dreambaby stores). The first stage (information and consultation stage) of the Procedure Renault was completed at the end of May. Subsequently, on 26 May 2023, the Board of Directors of Dreamland and Dreambaby decided to proceed with the collective dismissal of 151 employees in total. As a people-oriented employer, Colruyt Group will make maximum efforts to provide professional reorientation within the group to reduce the number of redundancies.
In addition, on 19 April 2023, Colruyt Group reached a principle agreement with ToyChamp whereby ToyChamp would obtain 75% of the shares of Dreamland and thus gain control over Dreamland. Dreamland will continue to exist; as a brand, as a legal entity and as an employer. The current management of Dreamland remains on board. The principle agreement was recently developed further and converted into a final agreement. Completion of the transaction is expected in the third quarter of the financial year 2023/24 and will have a limited one-off effect on the net result of the financial year 2023/24 (still highly subject to further developments between the closing of the financial year, i.e. 31 March 2023, and the completion of the transaction).
Upon completion of the transaction, Dreamland will no longer be fully consolidated in the consolidated figures of Colruyt Group.
The group will in that case act in accordance with the applicable regulations and communicate on further developments.
DATS 24
On 1 June 2023, Colruyt Group and Virya Energy reached an agreement to fully integrate DATS 24 NV into Virya Energy.
The transaction is based on an enterprise value of EUR 56 million, plus a potential earn-out consideration of up to EUR 11 million. Following this transaction, Colruyt Group’s cash flow statement is expected to include a cash inflow of approximately the same order of magnitude (inter alia after settlement of intragroup positions and net of cash and cash equivalents disposed of, which in total are estimated at approximately EUR 25 million – based on preliminary figures per 31 March 2023). Furthermore, this transaction is expected to result in a limited one-off impact on the net result of the financial year 2023/24. Both are subject to the customary post-closing purchase price adjustments. Additionally, certain assets have been transferred from Colruyt Group for a total of EUR 6 million. Arm’s length principles were applied for the valuation.
As of June 2023, DATS 24 will no longer be fully consolidated by Colruyt Group, but by Virya Energy. This means that as of June 2023, the results of DATS 24 will be accounted for in Colruyt Group’s consolidated figures via Virya Energy using the equity method.
The fuel distribution activities in France are inseparably connected to, and therefore an integral part of, the stores in France and are not included in this transaction.
The requisite measures were taken in the context of the conflict of interest rules.
31 INTRO | Word from the Chairman • Who are we? • Our strategy • Our vision on sustainability • Management report • Key figures
(1) In the consolidated balance sheet DATS 24 NV is presented as ‘Assets from discontinued operations’ and ‘Liabilities from discontinued operations’.
Degrenne Distribution
On 2 February 2023, Colruyt Group reached agreement to acquire 100% of the shares of Degrenne Distribution, owned by the Degrenne family. The acquisition is subject to the suspensive condition of approval by the French Competition Authority as well as by the French Ministry of Economy and Finance under the international investment law.
The necessary approvals have been obtained and the transaction has been finalised at the beginning of July 2023. Degrenne Distribution will be fully consolidated in the course of financial year 2023/24.
Colruyt Group does not expect the acquisition of Degrenne Distribution to have a material impact on the net result of the financial year 2023/24.
Outlook
Colruyt Group expects the macroeconomic context to remain challenging and uncertain and the fierce competitiveness in the Belgian retail market to continue.
The group continues to maximise the management of its operating costs and its cash position. In addition, the group maintains its long-term focus and pursues its investments in sustainability and efficiency, digital transformation and innovation, employees and high-quality housebrand products in a targeted manner.
As a retailer and market leader in Belgium, Colruyt Lowest Prices will continue to fulfil its role in society and to consistently deliver on its lowest price promise. Thanks to its permanent focus on efficiency as well as operational cost control, Colruyt Lowest Prices can continue to live up to its promise to its customers.
Colruyt Group expects the operating profit and the net result (i.e. excluding one-off effects in the financial year 2023/24 and excluding DATS 24) to increase significantly in the financial year 2023/24.
The group points out that the uncertainty associated with the macroeconomic context and the high competitiveness in the Belgian retail market may impact the 2023/24 outlook.
The financial year 2023/24 will include several one-off effects:
• Upon completion, the sale of Parkwind to JERA by Virya Energy will result in a very significant one-off positive effect in the consolidated net result of Colruyt Group in the financial year 2023/24. That effect is estimated at EUR 600 million to EUR 700 million (based on Virya Energy’s last closing date, i.e. 31 December 2022). The final price can still vary depending on the exact closing date but is expected to amount to at least EUR 1,55 billion (net of debt) at the level of Virya Energy.
• The restructuring of Dreamland and Dreambaby will give rise to a restructuring charge in the financial year 2023/24.
• Completion of the transaction with ToyChamp, whereby ToyChamp will acquire 75% of the shares of Dreamland, is expected to have a limited one-off effect on the net result of the financial year 2023/24 (still highly subject to further developments between the closing of the financial year, i.e. 31 March 2023, and the completion of the transaction).
• The sale of DATS 24 to Virya Energy is expected to result in a limited one-off effect on the net result of the financial year 2023/24 (still subject to the customary post-closing purchase price adjustments).
Colruyt Group will present its full-year 2023/24 guidance at the General Meeting of Shareholders on 27 September 2023.
Colruyt Group retains its focus on its long-term strategy which is based on four areas of expertise – ‘Food’, ‘Health and Well-being’, ‘Non-Food’ and ‘Energy’ – that are supported by a physical component on the one hand (stores, distribution centres, etc.) and are inter-connected by a digital component on the other (Xtra). Colruyt Group has the ambition to continue to grow, gain further expert knowledge and provide a sustainable offering in each of those four areas of expertise in the years to come. This will enable the group to create sustainable added value for the customer, provide them the best possible service and re-spond to their needs. To provide more clarity and boost our strength and effectiveness as a group, the legal structure will be adapted to be better aligned with these four areas of expertise. This led to the establishment of Virya Energy NV in late 2019 and the recent integration of DATS 24 NV into Virya Energy NV with a view to centralising the energy activities of the group. Also, the non-food activities of the group were centralised under the entity Darzana NV in April 2022. The activities related to ‘Health
and Well-being’ were centralised under the entity Sukhino NV at the end of March 2023. Further changes to the legal structure will be im-plemented in the coming months. The food retail activities of Etn. Fr. Colruyt NV will be transferred to a separate subsidiary and the activities of the listed parent company will be structured with a focus on a wide range of service and group support activities, which include but are not limited to private label management, strategy development, HR policy, customer services, financing activities and technical support. Eventually all Colruyt Group activities will be centralised by area of expertise - ‘Food’, ‘Health and Well-being’, ‘Non-Food’ and ‘Energy’. The parent company will serve all these areas of expertise and connect them with each other in order to create and exploit synergies, ensure smooth and efficient management and achieve the group’s long-term objectives.
INTRO | Word from the Chairman • Who are we? • Our strategy • Our vision on sustainability • Management report • Key figures
32
Reconciliation of key figures and consolidated income statement (annex)
Following the announcement made on 25 October 2022, and subsequently on 2 June 2023, that DATS 24 NV (‘DATS 24’) has been sold to Virya Energy NV, DATS 24 is presented as a discontinued operation in the consolidated income statement. In the financial report however, the key figures
are presented and reported inclusive of DATS 24. The table below shows the reconciliation between the key figures (including DATS 24) and the consolidated income statement (with DATS 24 presented as a discontinued operation).
Reconciliation of key figures and consolidated income statement 2022/23 (in million EUR)
Reconciliation of key figures and consolidated income statement 2021/22 (in million EUR)
Consolidated income statement with DATS 24 presented as discontinued operation in the financial year 2022/23 and in the financial year 2021/22 (in million EUR)
33 INTRO | Word from the Chairman • Who are we? • Our strategy • Our vision on sustainability • Management report • Key figures
Key figures DATS 24 Consolidated income statement Revenue 10.820 886 9.934 Gross profit 2.931 72 2.859 % of revenue 27,1% 8,1% 28,8% Operating cash flow (EBITDA) 685 35 650 % of revenue 6,3% 4,0% 6,5% Operating profit (EBIT) 279 28 251 % of revenue 2,6% 3,1% 2,5% Profit before tax 270 28 242 % of revenue 2,5% 3,1% 2,4% Profit for the financial year from continuing operations 180 % of revenue 1,8% Profit from the financial year from discontinued operations 21 Profit for the financial year 201 21 201 % of revenue 1,9% 2,4% 2,0% Earnings per share (in EUR) 1,57 0,16 1,57 From continuing operations 1,40 From discontinued operations 0,16
1/04/202231/03/2023 1/04/202231/03/2023 Variance 9.934 9.251 +7,4% 2.859 2.705 +5,7% 28,8% 29,2% 650 720 -9,7% 6,5% 7,8% 251 363 -30,9% 2,5% 3,9% 242 371 -34,7% 2,4% 4,0% 180 278 -35,4% 1,8% 3,0% 21 10 +109,0% 201 288 -30,4% 2,0% 3,1% 1,57 2,16 -27,6% 1,40 2,09 -32,8% 0,16 0,07 +116,7%
Key figures DATS 24 Consolidated income statement 10.049 798 9.251 2.752 47 2.705 27,4% 5,9% 29,2% 741 21 720 7,4% 2,6% 7,8% 375 12 363 3,7% 1,5% 3,9% 383 12 371 3,8% 1,5% 4,0% 278 3,0% 10 288 10 288 2,9% 1,3% 3,1% 2,16 0,07 2,16 2,09 0,07
Dividend
The Board of Directors will propose a gross dividend of EUR 0,80 per share to the General Meeting of Shareholders.
Earnings and gross dividend per share (in EUR)
(*) Earnings per share based on the key figures and therefore inclusive of DATS 24 NV. For a reconciliation between the key figures and the consolidated income statement (in which DATS 24 NV is presented as a discontinued operation), we refer to the annex ‘Reconciliation of key figures and consolidated income statement’ on page 33.
12/13 13/14 14/15 15/16 16/17 17/18 18/19 19/20 1,00 1,00 1,00 1,12 1,18 1,22 1,31 1,35 2,26 2,24 2,21 2,49 2,60 2,60 2,78 3,14 44,2% 44,6% 45,2% 45,1% 45,3% 46,9% 47,2% 43,O% 20/21 1,47 3,06 21/22 1,10 2,16 1,57 48,O% 50,8% 22/23 (*) 0,80 51,0% INTRO | Word from the Chairman • Who are we? • Our strategy • Our vision on sustainability • Management report • Key figures
Gross dividend per share
Earnings per share
Dividend pay-out ratio
34
Segment information
(1) Including transactions with other operating segments.
(2) The revenue from the webshops Dreamland and Dreambaby realised by Colruyt, Okay and Bio-Planet stores is presented under Retail Non-food as from financial year 2022/23. The figures of financial year 2021/22 were adapted accordingly.
(3) Including the revenue from the webshops Collect&Go and Bio-Planet realised by the Colruyt stores.
(4) Including the revenue from Roelandt Group as from January 2022.
(5) Including the revenue from Dreamland, Dreambaby, Bike Republic, The Fashion Society, Jims (as from May 2021) and Newpharma (three months from October through December 2022).
35 (In million EUR) Revenue EBITDA EBIT Retail (1) 8.822 569 243 Retail Food 8.146 • Colruyt Belgium and Luxembourg (2) (3) (4) 6.436 • Okay, Bio-Planet and Cru 1.056 • Colruyt France and DATS 24 France 654 Retail Non-food (1) (4) (5) 604 Transactions with other operating segments 72 Wholesale and Foodservice (1) 1.183 61 38 Wholesale 944 Foodservice 217 Transactions with other operating segments 22 Other activities 929 39 27 DATS 24 Belgium 886 Printing and document management solutions 22 Transactions with other operating segments 20 Eliminations between operating segments - 114 -Corporate (not allocated) 0 17 - 29 Total Colruyt Group consolidated (including DATS 24 NV) 10.820 685 279
INTRO | Word from the Chairman • Who are we? • Our strategy • Our vision on sustainability • Management report • Key figures
(In million EUR) 01/04/202231/03/2023 01/04/202131/03/2022 I. Retail 336 369 Colruyt (Belgium and Luxembourg) (2) 72 158 Okay, Bio-Planet and Cru 20 24 Dreamland, Dreambaby, Bike Republic, The Fashion Society, Jims and Newpharma (3) 22 16 Colruyt France and DATS 24 France 18 18 Other retail and real estate 204 154 II. Wholesale and Foodservice 23 26 Wholesale 5 15 Foodservice 2 1 Real estate 16 9 III. Other activities 18 21 IV. Unallocated corporate activities 86 72 Total Colruyt Group consolidated (including DATS 24 NV) 463 488
EUR463 million investments (1) Exclusive of acquisitions through business combinations, right-of-use assets and change in consolidation method. (2) Including Roelandt Group since January 2022 (3) Including Newpharma since October 2022 INTRO | Word from the Chairman • Who are we? • Our strategy • Our vision on sustainability • Management report • Key figures 36
Key figures Investments realised (1)
The investments in 2022/23 mainly related to:
• the expansion and the renovation of stores in Belgium and France;
• the expansion of logistics capacity in Belgium and France (for example, the new distribution centre in Ollignies for the non-food range in the food stores and the new distribution centre near Dôle in France);
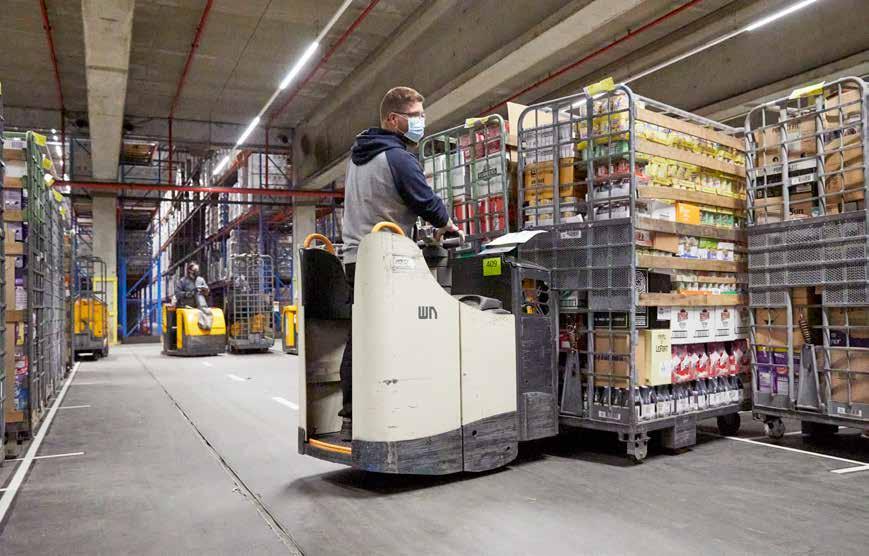
• production capacity in Belgium, focusing on vertical integration;
• renewable energy (such as solar panels, hydrogen filling stations and charging stations) and energy efficiency (for example, the sustainable renovation of buildings and making the vehicle fleet more sustainable);
• innovative change programmes and digital transition.
Excluding any acquisitions or interests, Colruyt Group expects to carry out an investment programme of between EUR 440 million and EUR 460 million in financial year 2023/24. The group will continue to invest in:
• new stores and the renovation of existing stores in Belgium and France;
• the expansion of logistics capacity in Belgium and France (for example, the further development of the new distribution centre in Ollignies for the nonfood range in the food stores and the new distribution centre near Dôle in France);
• automation and innovation (such as automated machinery and installations in the distribution centres and innovations in the stores);
• innovative change programmes and digital transition;
• renewable energy (such as solar panels and charging squares) and energy efficiency (for example, the sustainable renovation of buildings and making the vehicle fleet more sustainable).
Production and distribution centres
37
m2 number Production and distribution centres Belgium and Luxembourg 637.739 33 France 64.417 4
INTRO | Word from the Chairman • Who are we? • Our strategy • Our vision on sustainability • Management report • Key figures
The freehold percentage (based on m²) of production and distribution centres in Belgium, Luxembourg and France combined is approximately 85%.
Company-operated stores of Colruyt Group
2022/23 2021/22 2020/21 2019/20 2018/19 BELGIUM AND LUXEMBOURG Colruyt - number 259 254 252 248 243 of which leased externally 24 23 22 19 19 - in ‘000 m² 460 454 444 437 426 Okay - number 159 156 150 145 141 of which leased externally 33 31 32 29 30 - in ‘000 m² 93 92 89 86 82 Bio-Planet - number 33 31 31 31 29 of which leased externally 16 14 15 15 15 - in ‘000 m² 21 20 20 20 19 Cru - number 4 3 3 3 3 of which leased externally 2 2 2 2 2 - in ‘000 m² 2 2 2 2 2 Dreamland - number 48 47 47 45 42 of which leased externally 15 15 16 15 15 - in ‘000 m² 82 80 83 80 76 Dreambaby - number 32 31 30 29 29 of which leased externally 15 16 15 15 15 - in ‘000 m² 20 19 18 17 17 Bike Republic - number 27 21 15 13 of which leased externally 26 21 15 13 - in ‘000 m² 24 24 18 16 The Fashion Society (1) - number 117 109 101 of which leased externally 116 109 100 - in ‘000 m² 120 108 99 FRANCE Colruyt - number 95 92 91 87 85 of which leased externally 2 2 4 4 3 - in ‘000 m² 94 90 89 85 81
INTRO | Word from the Chairman • Who are we? • Our strategy • Our vision on sustainability • Management report • Key figures 38
(1) The Fashion Society includes the fashion retail chains Zeb, The Fashion Store and PointCarré. In addition to the integrated stores, there are stores in Belgium and France that are operated by franchisees.
Key figures over five years
(1) The key figures are inclusive of DATS 24 NV. For a reconciliation between the key figures and the consolidated income statement (in which DATS 24 NV is presented as a discontinued operation), we refer to the annex ‘Reconciliation of key figures and consolidated income statement’ on page 33.
(2) Including the impact of IFRS 16 and the full consolidation of Bike Republic as from financial year 2019/20.
(3) Exclusive of acquisitions through business combinations, right-of-use assets and change in consolidation method.
(4) The calculation of the ROIC was refined as from financial year 2021/22. In addition, the acquisitions made in the financial year in question (Culinoa, Jims and Roelandt Group in financial year 2021/22 and Newpharma in financial year 2022/23) were not included in the calculation.
39 (In million EUR) 2022/23 (1) 2021/22 2020/21 2019/20 (2) 2018/19 Revenue 10.820 10.049 9.931 9.581 9.434 Retail 8.822 8.233 8.373 7.956 7.837 Wholesale and foodservice 1.183 1.082 1.088 969 958 Other activities 929 833 557 731 713 Intersegment -114 -99 -87 -75 - 73 Gross profit 2.931 2.752 2.792 2.565 2.471 EBITDA 685 741 850 807 758 EBITDA margin 6,3% 7,4% 8,6% 8,4% 8,0% EBIT 279 375 523 511 485 EBIT margin 2,6% 3,7% 5,3% 5,3% 5,1% Profit before tax 270 383 521 561 519 Taxes 69 95 105 130 135 Net profit 201 288 416 431 384 Net profit margin 1,9% 2,9% 4,2% 4,5% 4,1% Cash flow from operating activities 705 499 708 830 565 Free cash flow 153 -108 114 462 260 Total equity 2.510 2.462 2.527 2.359 2.208 Balance sheet total 6.148 5.614 5.195 4.565 4.147 Investments (3) 463 488 469 410 378 ROIC (4) 8,9% 13,4% 17,6% 18,5% 17,3%
INTRO | Word from the Chairman • Who are we? • Our strategy • Our vision on sustainability • Management report • Key figures
Key figures over five years (sequel)
(1) Including the impact of IFRS 16 and the full consolidation of Bike Republic as from financial year 2019/20.
(2) Including the employees of Newpharma as per 31 March 2023 (304 heads / 298 FTE’s)
(3) Exclusive of the fitness facilities of Jims.
2022/23 2021/22 2020/21 2019/20 (1) 2018/19 Market capitalisation at year-end (In million EUR) 3.609 5.019 6.925 6.821 9.460 Weighted average number of outstanding shares 127.967.641 132.677.085 135.503.424 137.279.011 137.758.364 Number of outstanding shares on 31/3 134.077.688 133.839.188 136.154.960 138.432.588 143.552.090 Earnings per share (EPS) (in EUR) 1,57 2,16 3,06 3,14 2,78 Gross dividend per share (in EUR) 0,80 1,10 1,47 1,35 1,31 Dividend yield 2,97% 2,93% 2,89% 2,74% 1,99% Number of employees (2) 33.384 32.996 32.945 30.631 29.903 Number of employees in FTE (2) 31.535 31.210 31.189 29.056 28.339 Number of own stores in Belgium, Luxembourg and France (3) 774 744 720 601 572 Store area of own stores in ‘000 m2 (3) 917 889 861 743 704 Number of independent storekeepers in Belgium, affiliated stores in France (excluding independent retailers) and franchisees of the multi-brand chain The Fashion Society. 576 588 591 583 579
INTRO | Word from the Chairman • Who are we? • Our strategy • Our vision on sustainability • Management report • Key figures 40
Contributions paid to the Belgian treasury in proportion to the added value
In the last financial year, all Belgian companies of Colruyt Group together passed on EUR 974,5 million in social, fiscal and product-related taxes to the Belgian treasury. In addition, the net VAT payment (difference between payable and deductible VAT) to the tax authorities amounted to EUR 300,3 million.
Distribution of the net added value generated by Colruyt Group in Belgium
All these taxes are the result of the creation by the group of added value. The net added value (1) generated by Colruyt Group in Belgium amounts to EUR 2,08 billion. Of this, 46,8% goes as taxes to the various local and federal governments and 45,1% is paid to employees for services rendered. 4,0% is distributed to shareholders (2) and the remaining 4,1% is invested back into the group to finance future projects.
(1) The excise duties paid have been integrated into the net added value so as to be able to express the total contribution to the treasury of EUR 974,5 million as a percentage of the net added value corrected in this way.
(2) This calculation method takes no account of purchases or cancellations of treasury shares.
46,8% local and federal governments
4,1% retained earnings
45,1% Colruyt Group employees
4,0% shareholders
41
(1) Including charge reductions obtained at federal and regional level.
(in
Social security (1) 386,6 Withholding tax on wages (1) 151,3 Income tax on profits 61,4 Product-related taxes (customs, excise) 334,2 Withholding tax on income from investments 17,1 Property withholding tax 12,9 Registration duties, provincial and municipal taxes and other federal taxes 11,1 Total 974,5
Payments made to the Belgian treasury
million EUR)
INTRO | Word from the Chairman • Who are we? • Our strategy • Our vision on sustainability • Management report • Key figures
974,5 million contributed to the Belgian treasury
917.000 m2 retail space of own stores
576 independent storekeepers in Belgium, affiliated stores in France (excluding independent retailers) and franchisees of The Fashion Society
33.384 employees
774 own stores
INTRO | Word from the Chairman • Who are we? • Our strategy • Our vision on sustainability • Management report • Key figures
42
Xtra was set up in 2017 as a common customer card and app for the group’s stores and webshops. Since then Xtra has developed into a personal digital assistant.


1,4 million app downloads
4,2 million Xtra customers
More than 500.000 users of the payment function mijnxtra.be

A varied range of services

• Automatically all benefits when shopping, physically and online
• Simple refuelling at DATS 24, billing via direct debit
• Managing personal data, folders and newsletters
• Overview of expenses per receipt, month, product group …
• Barcode scanner for product info (ingredients, Eco-score, Nutri-Score …)
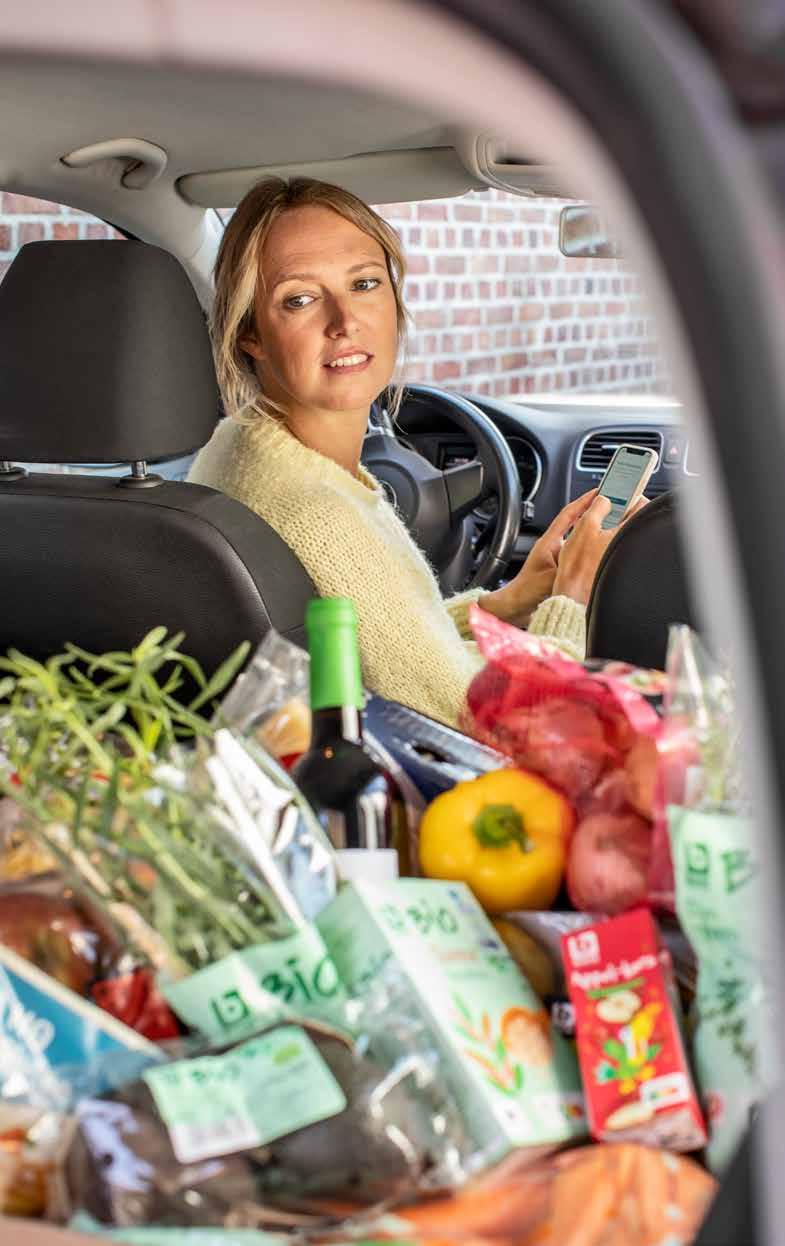
• Shopping lists, also sorted by store layout
• Store locator, food preferences, warranty cards and vouchers …
43 XTRA
ENERGY NON-FOOD HEALTH & WELL-BEING FOOD
Saving points for the environment
The Xtra app also includes Colruyt Group’s Eco-score savings programme. Customers who buy products with Eco-scores A or B automatically save points in their Xtra app. They can then use these points to support a local environmental project or to follow a workshop at Colruyt Group Academy.
Milestones in the app
In addition to the new Xtra website, the renewed Xtra app has received important functionalities since being launched in September 2022.
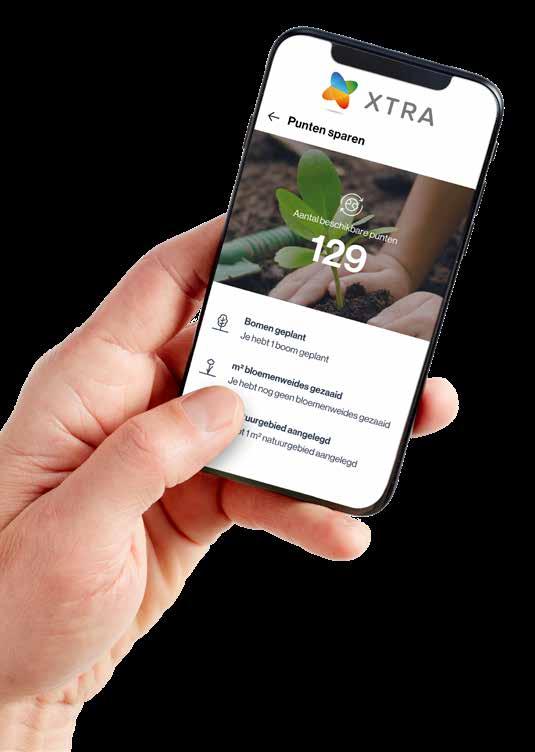
• Integration of the MyColruyt app, Collect&Go app and the newpharma.be webshop.
• Smoother onboarding of the payment function.
• Multi-factor authentication for additional security.
• Mobile payment with Xtra. The customer shows his Xtra QR code at the checkout, confirms the amount and no longer has to pass through the payment terminal. Good for a smoother flow at check-out and less cashier work.
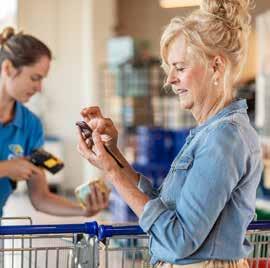
• Digital receipts, in the first phase on top of the printed receipts, later also as the sole option.

• Media selling: space for advertisements from internal and external partners.
Still planned in the second half of 2023:
• Mobile loading of electric cars at DATS 24.
• Recipes in the app, with easy conversion from lists to orders at Collect&Go.
Collecting insights
Via Xtra, Colruyt Group gains insight into customers’ purchasing behaviour and needs. In this way, our store formats can better serve individual customers with relevant offers, brochures and customised communication. New insights can also be useful, for example, for adjusting store ranges or estimating where new stores are needed.
The personal data and the purchase data are kept in separate databases with limited access, in full compliance with the GDPR legislation. We treat the data strictly confidentially and do not sell it to third parties.
Shift from card to app
Xtra is using intensive campaigns to promote the downloading and active use of the app. Among new applicants, an average of eight times more customers opt for the app rather than the physical card.
XTRA
ENERGY NON-FOOD HEALTH & WELL-BEING FOOD 44
Geographic segmentation of revenue
Activities
92,1% Belgium
0,7% Other
7,2% France
Colruyt Group’s operational activities are subdivided into retail, wholesale, foodservice, other activities and group support activities. The retail shop formulas and the deliveries to independent retailers (wholesale) and professional customers in food service represent the lion’s share of our commercial activities. DATS 24, Symeta Hybrid and our stake in Virya Energy are included in ‘Other activities’.

45
ACTIVITIES | Retail • Wholesale • Foodservice • Other activities • Group support activities
8,4% of group revenue


EUR 908 million

France Wholesale Belgium Foodservice Belgium Wholesale Retail
of group revenue
million Wholesale and foodservice
80,9%
EUR 8.750
10,7% of group revenue
activities
EUR 1.161 million Other
Interests Interests ACTIVITIES | Retail • Wholesale • Foodservice • Other activities • Group support activities 46
Colruyt Lowest Prices is primarily aimed at families who do their weekly shopping in a price-conscious way. It is also the ideal format for professionals, associations and households doing big shopping in an efficient way. Colruyt has a wide range, a considerably expanded butcher’s section and fresh food department. Day after day, the store chain guarantees its customers the lowest prices for national brands as well as the Boni Selection and Everyday private labels. Is a product cheaper elsewhere nearby? Colruyt immediately lowers its price. On top of this, the formula offers its own promotions and responds to all competitors’ promotions, both nationally and regionally. Colruyt prioritises simplicity, efficiency and readiness to serve.
1976
EUR 6.436 million revenue (+ 6,9%)
253 stores in Belgium and 6 in the Grand Duchy of Luxembourg
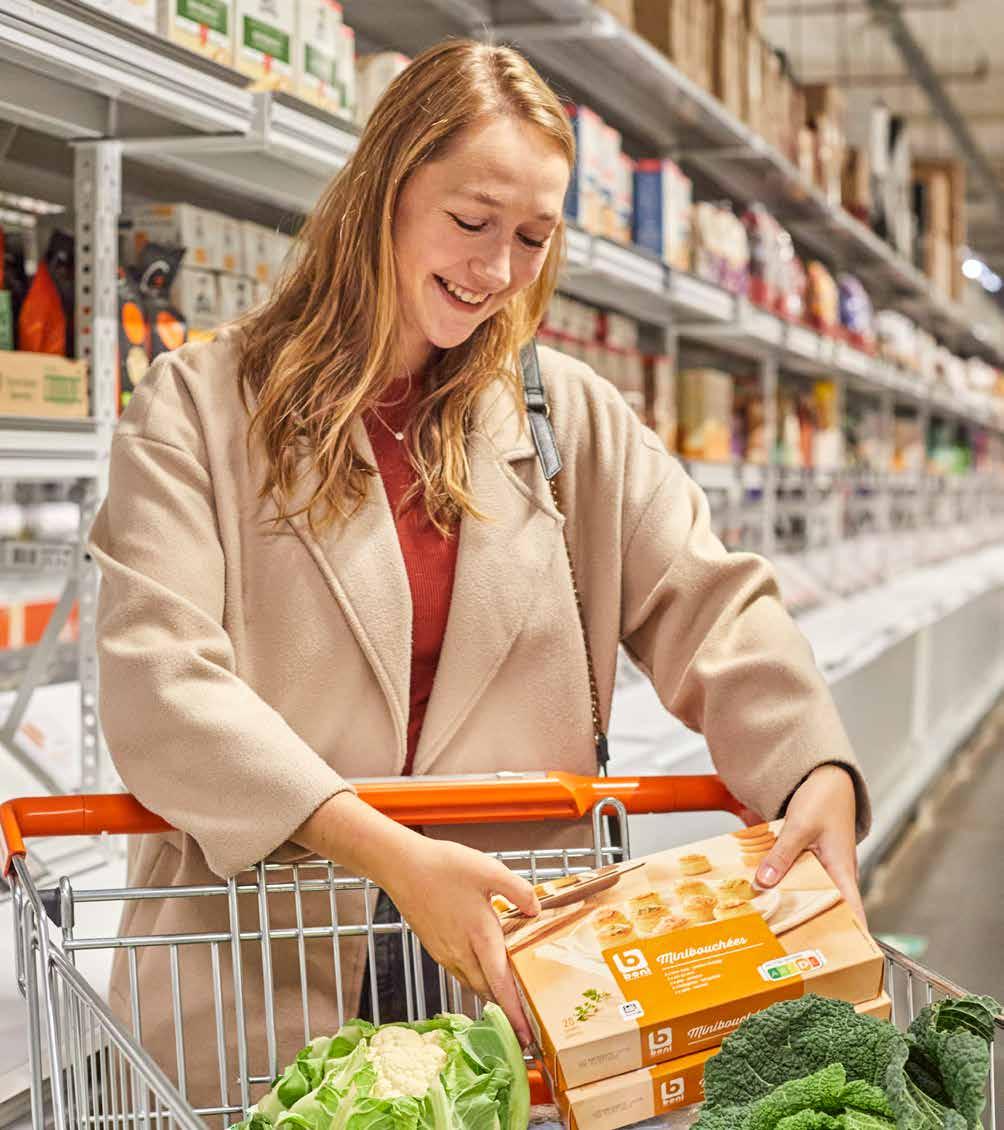
1.700 m2 average store area
10.500 food and 7.500 non-food items
More than 15.400 employees in FTE
Lowest prices
colruyt.be / colruyt.lu
47
ACTIVITIES | Retail • Wholesale • Foodservice • Other activities • Group support activities ENERGY NON-FOOD HEALTH & WELL-BEING FOOD
Rising revenue and market share
• During the past financial year, Colruyt Lowest Prices recorded a considerable increase in revenue, driven mainly by food price inflation and an influx of new customers. In the first half of the year, inflation-driven revenue continued to be impacted by promotional pressure, which subsequently weakened somewhat. Summer sales were moderate, partly because families started travelling again. The football World Cup in November and December generated a slight increase in revenue. Year-end sales were successful, with families more often celebrating at home and able more easily than ever to find inspiration for budget-friendly dining at Colruyt.
• In a shrinking Belgian retail market, Colruyt’s sales volumes also fell, albeit relatively less sharply. Customers visited stores more frequently, but with on average smaller shopping baskets and to a certain extent choosing budget-friendly own brands over national brands.
• Spiking energy and food prices increased consumer price awareness. In a context of persistent food price inflation, Colruyt could attract many new customers from autumn 2022 onwards, which benefited its market share.
• Colruyt continued at all times to keep its promise of guaranteeing the lowest prices to consumers. In this way purchasing, energy, wage and other costs were not fully passed on in the selling prices, as a result of which the margins fell slightly.
• Colruyt continues to expand steadily, with 1 to 2 new branches every year and a dozen renovated stores, often with expanded sales areas.
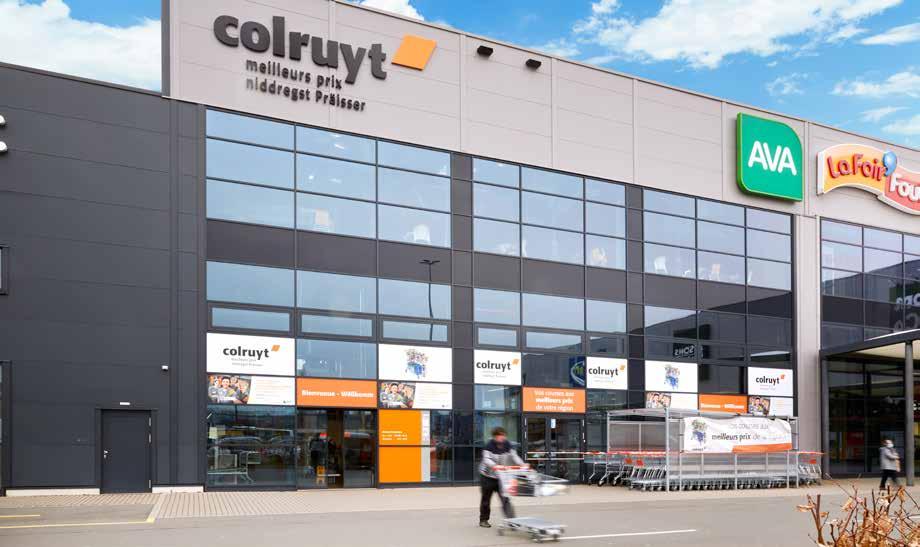
• 4 new stores in Belgium and 1 in Luxembourg
• 12 renovations
The lowest price for each product at every moment. For 50 years now, this has been the promise of Colruyt Lowest Prices in Belgium and Luxembourg, to which the brand remains true even in difficult circumstances. In the past financial year, rising raw materials, energy, packaging and transport prices made the annual supplier negotiations even more challenging. Colruyt took the necessary time to work out solutions acceptable to all parties in constructive discussions, always with an eye for both the lowest price guarantee and the long-term relationships with its suppliers.
Colruyt continues to present itself as the defender of consumers’ purchasing power. As well as guaranteeing this right through the year with the lowest prices, Colruyt helps customers manage their budgets in other ways. For example, the ‘Smart saving’ campaign provides useful tips for preparing shopping visits efficiently, comparing promotions and packaging, or combining private labels and national brands.
In its annual price survey, consumer organisation Test Aankoop confirmed that Colruyt Lowest Prices is still the cheapest supermarket in Belgium.
Colruyt’s lowest price guarantee is made possible in part by strong purchasing conditions from suppliers and by its membership of the European retail alliance Agecore.
ACTIVITIES | Retail • Wholesale • Foodservice • Other activities • Group support activities
ENERGY NON-FOOD HEALTH & WELL-BEING FOOD 48
Simpler pricing display
In May 2022, Colruyt simplified its price display format, on paper, online and on the electronic price labels on the shelves. All prices are now marked ‘black and white’, including reduced prices in response to competitors. Own promotions are in red, and marked as ‘Promotion/Actie’. This makes it even clearer to customers that they can always count on the lowest prices and often additional discounts.
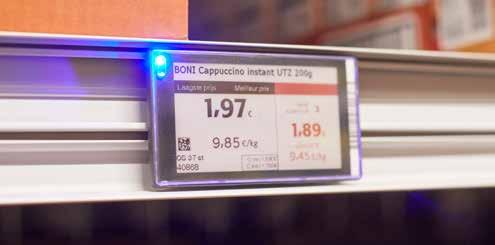
This simplified price indication is also in line with new European legislation, which applies in Belgium since June 2022.
Lowest costs
Colruyt fulfils its promise of lowest prices by working efficiently and focusing on lowest costs, for example with sober shop fittings, energy-efficient freezers and fully loaded trucks. This year additional efforts were made.
• Due to rising energy costs, the well-known flaps at the entrances to the refrigerated sections returned. They represent a saving of 2,3 million euros on the annual energy bill.
• Initial tests with technical innovations that provide attractive time savings, like Easy Check-out for the checkout process and Product Finder for in-store work.
• No more paper post for store employees, who receive all communications on their personal smartphones. At group level, this represents an annual savings of 273.000 euros.

Putting our money on B2B
Colruyt has many professional customers like catering companies and resellers.
With their loyalty cards, they can count on wholesale prices in all Colruyt stores, as well as in two target-group-oriented Colruyt Professionals stores. With both Brussels stores now doing well, Colruyt is keen to extend the cash&carry concept in other major cities.
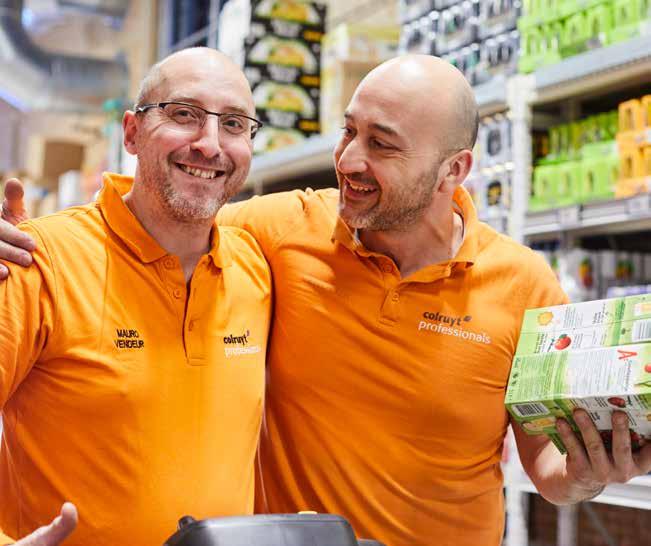
The wholesale service has started using a new CRM software package that enables employees to communicate more smoothly and, above all, to serve their customers and prospects better and more proactively.
Prize winner
• Winner in GfK’s summer and winter 2022 reports
• Retailer of the Year 2022 in the Hypermarkets and Supermarkets category
• Best Brands Award 2022 in the Best Retail Food Brand category
• First place in the Advantage Insights 2022 survey on supplier-retailer relations.
49 ACTIVITIES | Retail • Wholesale • Foodservice • Other activities • Group support activities
ENERGY NON-FOOD HEALTH & WELL-BEING FOOD
Efficiency and ergonomics go hand in hand
In a changing world, we at Colruyt Group attach great importance to versatility, as well as to being healthy and enjoying coming to work. That is why Colruyt is accelerating its investments in technology that makes work in the store more efficient and more pleasant. For example, personal smartphones are getting more and more new functionalities. This saves employees a lot of running back and forth, they can help customers quickly and communicate smoothly with colleagues and central services.
Less searching
Saving up to an hour and a half every day on shelf-stocking is possible using the Product Finder application that connects store employees’ smartphones to the electronic price labels. Anyone scanning a product will see its price label light up and immediately find the right place in the shelf. Less searching makes life quite a bit easier for store employees. Colruyt started testing the internally developed technology at the end of 2022 and plans to introduce it in all stores in the second half of 2023.
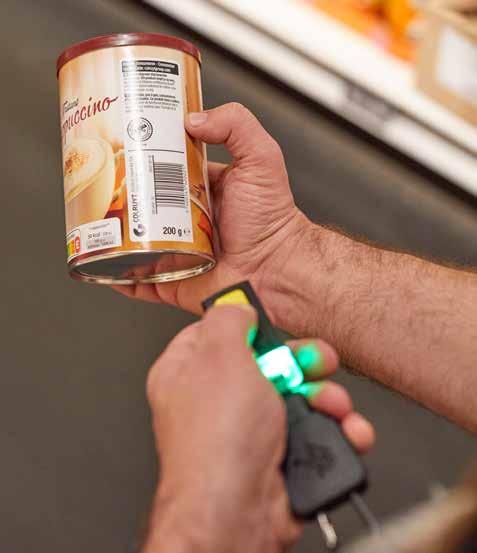
Smoother checkout process
Easy Check-out is an intelligent camera system above the cash register that automatically scans all barcoded products. In this way, the cashier no longer needs a hand scanner and can hold the products with both hands. This speeds up the checkout process by up to a fifth and is ergonomically better for employees. The internally developed system has been tested since February 2023 and will be installed in a first phase in 60 stores.
Back-saving work
Together with the Belgian start-up SpineWise, a new technology was tested that sensitises store employees to working more ergonomically. Sensors on work clothing emit vibration signals enabling employees to correct overly stressful positions. In tests in two stores, up to 30% less back-straining movements were observed.
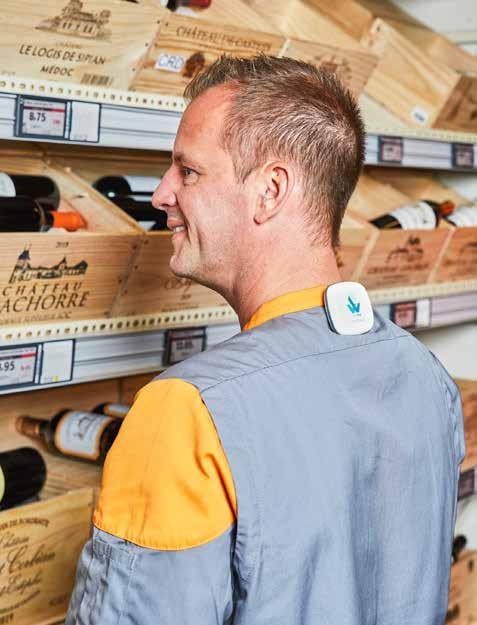
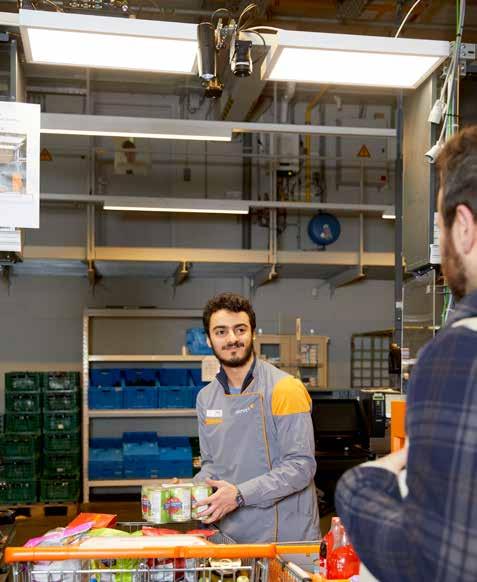
ACTIVITIES | Retail • Wholesale • Foodservice • Other activities • Group support activities
ENERGY NON-FOOD HEALTH & WELL-BEING FOOD 50
Continually adapted assortment
Colruyt continuously adapts its ranges to respond to customers’ changing needs.
More products from more sustainable Belgian agricultural chains with an eye for animal welfare, soil health, biodiversity, etc. Collaboration with 330 dairy farmers, 185 cattle farmers, 17 chicken breeders, 17 potato growers, 6 organic pig breeders, 3 fruit growers … We indirectly purchase products from around 6.000 Belgian farms.
Almost all stores now have a parapharmacy shelf, with products for first aid, skin care and colds. In the meantime, customers can easily find their way to the shelf, compiled with advice from our Newpharma online pharmacy.
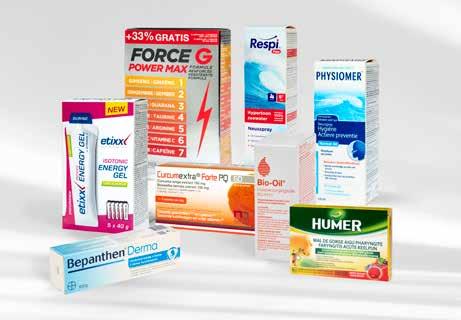
Doing business sustainably
Pioneer for humanely bred chicken

The first ‘humanely bred chicken’ products went on sale in mid-2022, and in October, together with 17 Belgian breeders, we launched our own chain of humanely bred chicken products, from egg to plate. This chain meets higher standards of well-being: the chickens live longer, have 40% more space, daylight, etc. In addition, the chicks also hatch in the hut where the eggs are laid, which avoids transport stress.
All three good!
• The completely revamped biweekly inspiration folder is now built around two weekly menus, an approach that has been positively received.
Week 2
Solidarity with poultry farmers
With 35 new items, Colruyt already offers some hundred non-alcoholic alternatives. Sales volumes of nonalcoholic drinks are increasing year on year, especially in beers, followed by aperitifs, ready-to-drink mocktails and digestives.
More than 120 fresh vegetarian products and about 80 plant-based dairy alternatives. Colruyt is a permanent partner of the Veggie Challenge and inspires its customers with, among other things, 2.800 vegetarian recipes.
Introducing twenty halal products in as many urban stores.
With the launch of the ‘Solidarity Eggs’, we reached out to poultry farmers affected by the confinement rules, which require them to keep their free-range chickens indoors and offer their eggs as cheaper barn eggs. Colruyt and Okay sold those eggs at free-range prices, including compensation for the affected poultry farmers.
Participating in shared mobility
Cars and cargo bikes from the Poppy and Cambio sharing platforms are parked in the car parks of certain urban Colruyt stores. A convenient mobility solution for city customers without cars wanting to make bigger shopping trips. The cars are used more than average, mainly by local residents and Colruyt customers, but also employees.
Ons vakmanschap drink met verstand Bier met liefde gebrouwen, drink met verstand
Quiche met groene asperges en heilbot Hoofdgerecht Ingrediënten personen) 500 groene asperges 100 babyspinazie 150 gerookte heilbot eieren 250 ricotta


dl extra lichte room (7 V.G.) 1 rol kruimeldeeg zonnebloempitten zwarte peper (molen) zout Bereiding min. 25 min. de oven) 1 chil asperges vanaf het midden en verwijder het harde uiteinde. Kook min. lichtgezouten water. Giet af en spoel onder koud water. Laat uitlekken en snij in stukjes van cm. Hak spinazie grof. erwarm de oven voor op 180 °C.

Meer weten over seizoensgroenten en -fruit? Kijk colruyt.be/seizoenskalender
het kruimeldeeg met het bakpapier een taartvorm. Verdeel er de gerookte heilbot, de stukjes asperge en de spinazie over. reek de eieren en meng er room en helft van de ricotta onder. Kruid met peper en zout giet de taartvorm. erdeel rest van de ricotta toefjes over de quiche bestrooi met de zonnebloempitten.
Zo dragen we samen bij aan een betere ezondheid stap voor stap.
21
• After a long interruption due to corona, the popular tastings returned in mid-2022.
• 30 lucky winners won a unique Coltruy sweater after a fun competition on social media, producing unprecedented interaction and attention.
51 ACTIVITIES | Retail • Wholesale • Foodservice • Other activities • Group support activities
Week Voedingswaarde per persoon (op basis van de ingrediëntenlijst) Energie 450 kcal Vetten 19,6 (waarvan) verzadigde vetzuren 5,2 Koolhydraten 43,7 (waarvan) suikers 8,6 Vezels 13,9 Eiwitten 17,6 Zout 1,1 “ Dit is lichte veggiekost, ideaal vlak voor een paasweekend. Sans Alcoholvrij Alc. + Ohne Lactose Zyliss messenslijper €999 Laagste prijs laatste 30d: 10,49 Victorinox groentemesjes stuks Meer artikelen winkel. €8 49 Laagste prijs laatste 30d: 10,89 “ Prinsessenboontjes zijn een hit bij ons aan tafel. Door hun zachte smaak gaan ze bij de kinderen vlotjes naar binnen.
Bak 25 min. de voorverwarmde oven. inot Gris ‘Sélection du Sommelier’ A.O.P. Alsace Wolfberger Cambre Blond Blond abdijbier Voedingswaarde per persoon (op basis van de ingrediëntenlijst) Energie 566 kcal Vetten 35,9 (waarvan) verzadigde vetzuren 13,4 Koolhydraten 30,0 (waarvan) suikers 5,0 Vezels 4,0 Eiwitten 286 Zout 1,4 Dag 3 3,45 20 25 Versmarkt Boni Selection gerookte Groenlandse heilbot 10 sneetjes 150 Herkomst: Atlantische Oceaan. €44929,93/kg “ Koken doe ik zoveel mogelijk met seizoensgroenten en -fruit. Ze hebben meer smaak en vitamines, zijn vaak duurzamer en hebben een interessantere prijs. Goedvoorhetmilieu
ENERGY NON-FOOD HEALTH & WELL-BEING FOOD
Collect&Go has been the market leader in the Belgian online food market for over 20 years. Customers reserve items from the Colruyt and Bio-Planet ranges via the website or app. Staff in the stores and the Londerzeel and Erpe-Mere e-distribution centres carefully select the best products and prepare the order. Customers reserving before midnight can collect their groceries the next day from more than 220 collection points at Colruyt, Okay, Bio-Planet or standalone. The online shopping service stands for quality, reliability, expertise and personal service.
2000 226 collection points in Belgium and Luxembourg
More than 550 employees in FTE
We do the shopping for you collectandgo.be
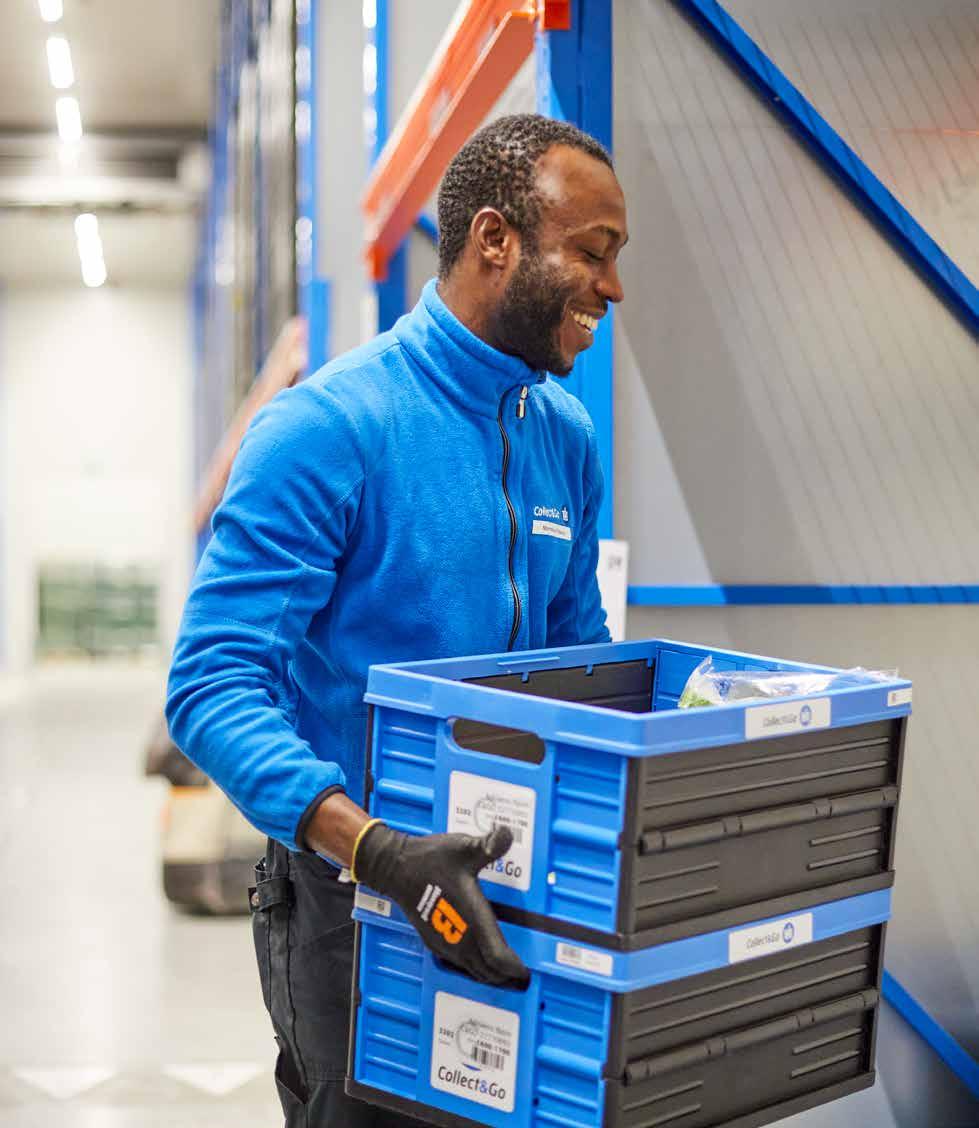
ACTIVITIES | Retail • Wholesale • Foodservice • Other activities • Group support activities
ENERGY NON-FOOD HEALTH & WELL-BEING FOOD 52
Sustainable business model
• In an e-commerce market under pressure, market leader Collect&Go proved that its business model is sustainable and profitable. Even post-covid, turnover remained more than fifty percent higher than before the pandemic.
• The average basket continued to rise throughout the financial year, in line with rising inflation. Attractively priced products were also ordered in larger quantities. 23 December was again a record day, with no fewer than 25,000 orders
• The number of active customers remained stable, as did the number of customers who only shop online with our group. Only the order frequency decreased, as customers started combining online ordering with physical shopping after the corona period.
• At the beginning of 2023, the variable service cost was introduced, whereby collections and deliveries during peak times became 1 euro more expensive. This intervention to better spread the workload and maintain a high service level met expectations. Customers can still enjoy numerous interesting promotions that eliminate the service cost.
• To further broaden the customer base and strengthen loyalty, Collect&Go wants to diversify its offering with more services in addition to large-scale weekly grocery shopping. For example, the meal boxes from partner Foodbag will also be available from Collect&Go from mid-2023.
Home delivery is expanding
In addition to its extensive collection network, Collect&Go also offers home delivery, either with its own deliverers or with private ‘Drivers’. In this way, the service already reaches more than a third of households in Belgium.
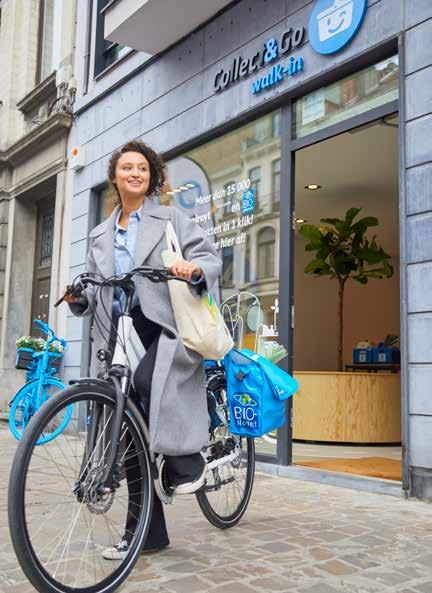
• Home delivery via our own deliverers has been available in and around Brussels and Antwerp since mid-2022. The service reaches a lot of new customers, about half of whom have never placed an order before. The orders are prepared in the Londerzeel distribution centre. Given the high demand, Collect&Go is gradually scaling up the service via an adapted ordering policy, with a view to further profitability and a continuing focus on the quality of its service, as a constant differentiator.
• Drivers is an official sharing economy platform, where private individuals pick up the groceries at a Collect&Go collection point, to deliver them to customer homes in their neighbourhoods. For this, the deliverer receives a fee of 7 euros. The service now has more than 2.000 active deliverers and is available at around sixty collection points in central cities.
Second Walk-in collection point
A Collect&Go Walk-in opened in Saint-Gilles, the second collection point after Ixelles, geared to a city public that comes to shop on foot, by bicycle or scooter. On an area of barely 25 m², the Walk-in makes the large range and all the benefits of Colruyt Lowest Prices and Bio-Planet accessible in the heart of the city.
• Although half of the customers arrive without cars, the value of the shopping baskets is easily two to three times that of a typical neighbourhood store.
• The new Walk-in shares a building with an Okay Compact, enabling customers to combine their collections with smaller grocery purchases.
• With this formula, Collect&Go gets to know the urban consumer well and succeeds in attracting new customers and quickly building up loyalty. More Walk-ins are planned in the metropolitan area.
Successful summer tour
Collect&Go organised a summer roadshow on the Flemish coast and inland, with lots of attractions, a bouncy castle festival and performances by wellknown artists. In this way, passers-by got to know the shopping service in a relaxed way.
53 ACTIVITIES | Retail • Wholesale • Foodservice • Other activities • Group support activities
ENERGY NON-FOOD HEALTH & WELL-BEING FOOD
Unmanned delivery
Collect&Go continues to focus on sustainable innovation. At the beginning of 2023, an unmanned vehicle delivered orders to a few customers’ homes in Londerzeel. Using a code, customers could take their groceries from the vehicle and return empty boxes or empties. The successful test in collaboration with our Smart Technics innovation hub opens up perspectives for innovative, sustainable ways of delivering groceries in urban areas, in consultation with the competent authorities that shape the regulatory framework.
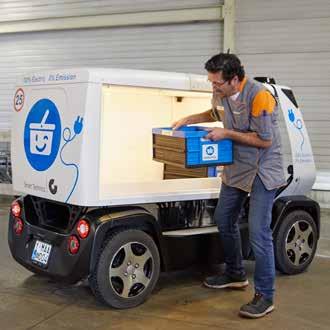
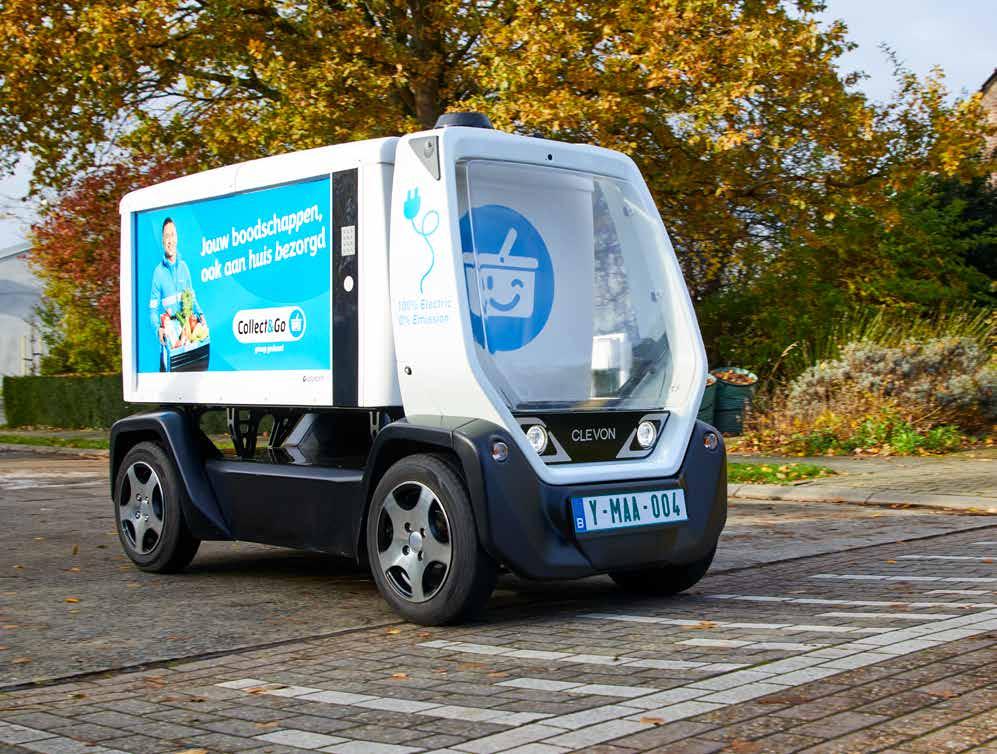
Increasing capacity
The Londerzeel and Erpe-Mere distribution centres prepare more than a quarter of all orders for shipment to the collection points. Together, they offer the potential to significantly increase capacity in the coming years, especially by using more surface area and by focusing on automation. In Londerzeel, for example, the picking of fresh products will be supported by autonomously driving pick-up carts from mid-2023.
ACTIVITIES | Retail • Wholesale • Foodservice • Other activities • Group support activities
ENERGY NON-FOOD HEALTH & WELL-BEING FOOD 54
For 25 years already, Okay has been the handy neighbourhood discounter where customers can do their daily shopping quickly, inexpensively and conveniently. The easily accessible shops are conveniently arranged, with a complete range of daily shopping products within a limited space. Okay is strong in high-quality ultra-fresh products, especially fruit and vegetables, meat, ready-to-eat meals and bread baked on site. The store format stands for a warm welcome, guarantees the lowest prices in the neighbourhood and inspires its customers with simplicity and convenience.
Okay Compact has been the format for fast, cheap and easy city centre shopping since 2012.
Okay Direct is the 24/7 automatic self-service shop where customers also do their daily shopping outside normal opening hours.
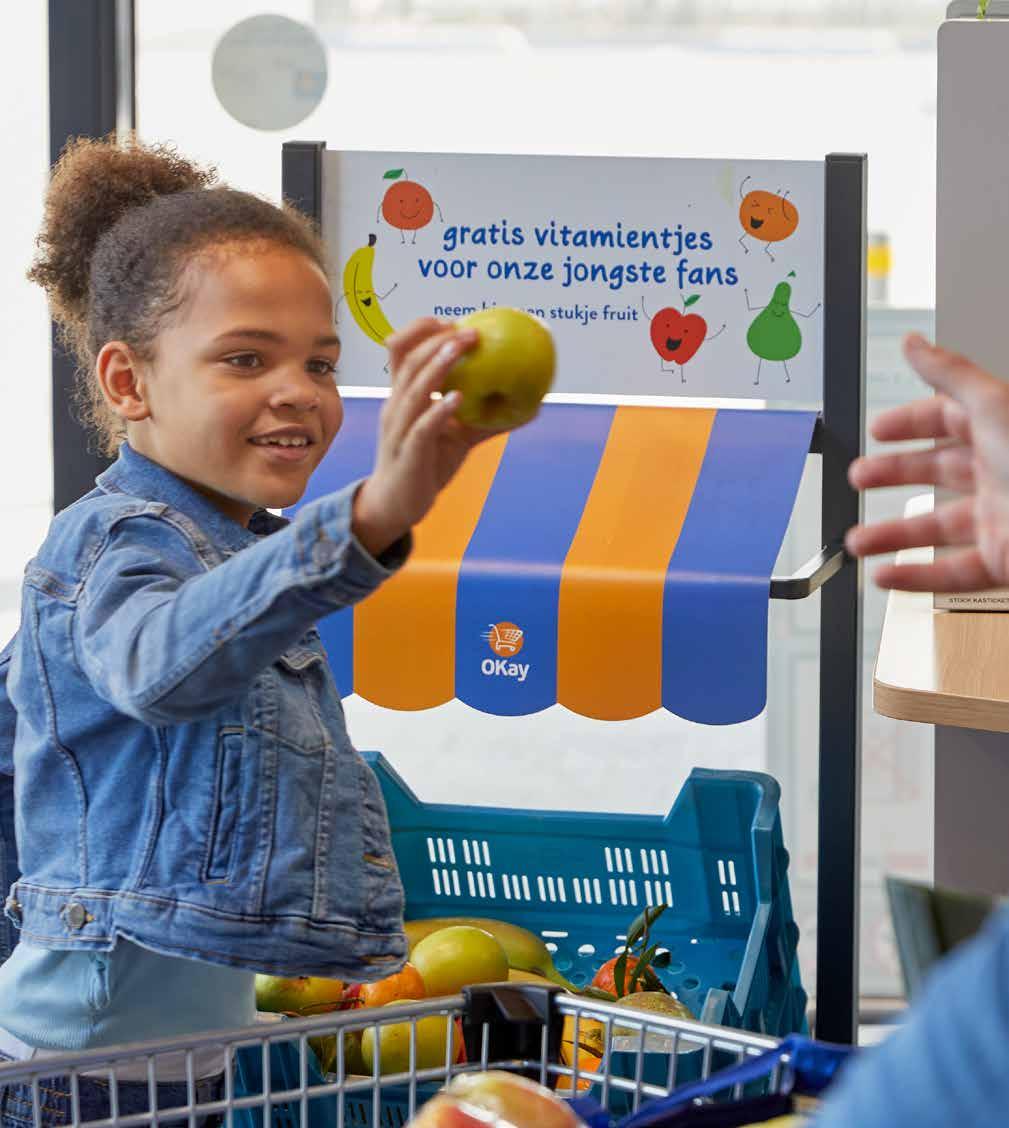
1998
EUR 1.056 million combined revenue
Okay, Bio-Planet and Cru (+2,4%)
160 stores, of which 144 Okay,
14 Okay Compact and 2 Okay Direct
400 to 650 m² average store area
4.500 items, up to 3.500 in Okay Compact
More than 2.400 employees in FTE
Fast, inexpensive and convenient
Okay.be
55 ACTIVITIES | Retail • Wholesale • Foodservice • Other activities • Group support activities
ENERGY NON-FOOD HEALTH & WELL-BEING FOOD
Attractive sales growth
• After a difficult start to the financial year, Okay achieved a more than decent sales growth, especially in the second half of the year, driven on the one hand by rising inflation. On the other hand, there was a successful end-of-year sales campaign, including ready-made party menus and individual caterer dishes. The first quarter of 2023 was also good, thanks in part to the enthusiastically received promo policy with strong 1+1 offers and despite stabilising inflation. This resulted in strong customer growth and increased shopping frequency. This allowed Okay to keep its market share stable in a shrinking retail market, despite the slightly lower volumes and smaller shopping baskets.
• Okay expects its increased focus on price advantage to further drive sales in the coming financial year, as will the activation campaign marking the format’s 25th anniversary.
• Okay remains the format that stands for the fastest and most convenient shopping in the market, in combination with its ‘lowest price in the area’ positioning and a high degree of customer friendliness. With the chain focused on popular, fast-rotating items, customers can also be sure of high product availability.
• Armed with these trump cards, the chain sees potential for at least 250 outlets in Belgium. The group is keen to accelerate growth of the Okay and Okay Compact formats, with a focus on Ghent, Antwerp and Brussels and the central cities. Supporting this expansion, the group will invest in the coming financial year in expanding the distribution centre, with a focus on urban and ultra-fresh ranges.
• With electronic price labels now rolled out in all stores, employees can focus even more on their core tasks and planning can be done more efficiently.
• Openings: 1 Okay, 3 Okay Compact and 1 Okay Direct
• Coming financial year
2 openings at Okay and 5 at Okay Compact
Self-service checkout in test phase
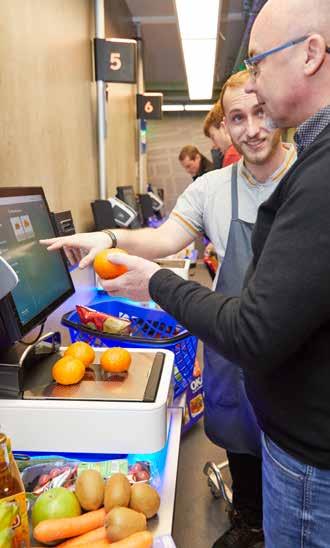
Scan and pay for your groceries yourself, with a shop assistant nearby for any assistance. That is the aim of the ‘Assisted self-check-out’, a hybrid cash register system consisting of self-scan stations and two manned checkout tills. The goal is to greatly reduce customer checkout waiting times. Checkout working hours also reduce, to the benefit of the store organisation. The system has been tested since February 2023 and installed in a dozen stores in the course of the year.
Expanding self-service concept
Okay Direct is the innovative self-service concept where customers shop completely autonomously, around the clock, thanks to technology from our Smart Technics innovation department.
• At the end of 2021, the first 150 m² store with around 600 items, tailored to an urban public, opened in downtown Ghent. The concept is meeting expectations and in 2022 was awarded the prestigious Mercurius Prize of the Comeos trade federation.
• Okay believes in this perfectly scalable concept and will roll it out further in various variants and contexts. For example, at the beginning of 2023, a barely 21 m² mobile sales unit was installed next to the Okay store in Lennik, as an additional 24/7 out-of-city solution. Starting in autumn 2023, the concept will be further tested in an urban environment.
25 years young
The 25th anniversary started with an event in the very first Okay in Ertvelde, opened in January 1998. This was a budget-friendly yet festive moment with snacks, drinks, supplier tastings, children’s entertainment and a photo booth.
Okay also treated its customers to 900.000 free products and some two hundred attractive prizes via a scratch card promotion.
ACTIVITIES | Retail • Wholesale • Foodservice • Other activities • Group support activities
ENERGY NON-FOOD HEALTH & WELL-BEING FOOD 56
Purebred neighbourhood discounter
True to its brand promise, Okay guarantees the lowest prices in the area, a trump card that it has been playing even more strongly since mid-2022, including strong 1 + 1 promos and a completely reworked brochure focused on customer benefits. The promotions are also given more prominent place in the shops and online, resulting in a favourable price perception. Along with this, Okay continues to inspire its customers with quick, easy recipes and all kinds of tips, including through its brand-new ‘Helemaal Okay’ (Totally Okay) seasonal magazine.
57 ACTIVITIES | Retail • Wholesale • Foodservice • Other activities • Group support activities
ENERGY NON-FOOD HEALTH & WELL-BEING FOOD
Bio-Planet has been a full-fledged supermarket for 20 years with approximately 5.500 organic and ecological products. Spearheading its offering are the fresh food market and the service counter with a range of quality meat, cheese and vegetarian products and preparations.
Under its ‘Truly good’ motto, Bio-Planet inspires its customers to eat, enjoy and live consciously. In the stores, skilled employees advise and assist customers. Bio-Planet is a pioneer in product sustainability, working closely with growers and producers. It also makes maximum use of sustainable materials and technologies in its store premises
2001
EUR 1.056 million combined revenue
Okay, Bio-Planet and Cru (+2,4%)
33 stores
650 m2 average store area
5.500 items
More than 400 employees in FTE
Truly good bioplanet.be
ACTIVITIES | Retail • Wholesale • Foodservice • Other activities • Group support activities
ENERGY NON-FOOD HEALTH & WELL-BEING FOOD 58
New stores even more sustainable
In March 2023, the 33rd store opened in Tournai, the third in the new store concept, with even more focus on sustainability, a focus that will be applied in renovations in the coming years. Some firsts:
Even more bulk products, in anticipation of future legislation. In addition to fruit and vegetables, these include nuts, cereals and dried fruits, sweet and salty snacks, origin coffee beans... Customers can also have their own jars filled at the service counter.
Biological purification plant that purifies waste water for reuse, like for flushing toilets or cleaning the store.
Heat recovery With heat from the cooling installation reused to heat the building, no fossil fuels are needed.
Difficult financial year
• In a shrinking European organic market with a decreasing offering of organic products, Bio-Planet’s revenue also declined for the second year in a row, largely as a result of the successive crises. In this difficult context, customers pared spending and shopping trips, with new customers arriving only in dribs and drabs. In the first quarter of 2023, sales started to pick up again, mainly driven by the most loyal customers.
• The fall in revenue, combined with increased remuneration and energy costs, had an effect on profitability.
• The competitively priced Boni Bio private label with approximately 330 references remains a crucial starter that keeps organic accessible to everyone.
• Bio-Planet remains by far the largest chain among pure organic stores and continues to expand its store park, with a first store in Luxembourg possibly opening in the coming financial year. At the same time, the chain is taking a number of structural actions to make its activities profitable.
• New stores in Sint-Denijs-Westrem and Tournai
• Openings planned in Hannut and Londerzeel in the 2023/24 financial year
• Potential for around sixty stores in Belgium and Luxembourg combined
Top chef as ambassador for organic
Well-known foodie Seppe Nobels and Bio-Planet have created a dozen new Belgian classics with vegetables in the lead role. Like a true ambassador, he publicly commits himself to working with organic and local products as much as possible. Nobels also provided a much-appreciated webinar on barbecue for Bio-Planet, under the Colruyt Group Academy banner.
Structural actions
• Online reservations via Collect&Go can only be picked up in Bio-Planet stores, no longer in 130 Colruyt stores. This saves on transport costs. In addition, the online shopping service was able to attract new customers, with online orders weighing about half more than the average offline shopping basket.
• Reduction of the number of items from 6.000 to 5.000, with room for 500 seasonal products. Throughout the year slow-rotating products are taken faster off the shelf.
Intolerance advice
Bio-Planet’s INTO mailing programme supports consumers with food intolerances. Registered consumers received four weekly test emails with inspiration for a gluten- or lactose-free life and a selection from the wide range of suitable products. In the meantime, about a thousand people have already subscribed to the monthly newsletter, including many new customers.
Innovative burgers
Bio-Planet has developed three innovative burgers with less meat and more vegetables, legumes or mushrooms, which still match the taste and mouthfeel of classic burgers. That makes it easy for everyone to eat more vegetable proteins and contribute to the protein shift.
One of the burgers contains seaweed from The Seaweed Company, a sustainable company in which the group participates. The chicken burger contains leftover of oyster mushrooms that Bio-Planet has grown on bread waste from the shops, making it a perfectly circular product.
• The number of deliveries to stores fell from five to four a week, sufficient to keep shelves nicely filled.
• At the beginning of 2023, the paper folders were replaced with an online version, saving printing and postage costs and permitting faster responses with last-minute promotions.
• More pre-packaged products on offer, especially in cheese and salads. This reduces waste and shortens customer waiting times.
59 ACTIVITIES | Retail • Wholesale • Foodservice • Other activities • Group support activities
ENERGY NON-FOOD HEALTH & WELL-BEING FOOD
Cru is a multi-experience market, for people who are passionate about food. Cru brings together ten artisan specialities under a single roof, offering a unique selection of fruit and vegetables, meat and charcuterie, fish and poultry, as well as cheeses, drinks, chocolate, sourdough bread and flowers.
Cru follows the rhythm of the seasons with authentic, ‘ordinary’ pure-tasting products of exceptional quality, in close cooperation with selected producer partners. Expert staff present the products in their purest form, ready to cook or pre-prepared.
Customers can taste the products at their leisure in the market, and enjoy breakfast, drinks, lunch and coffee in the adjacent Cuit eateries (Ghent and Overijse). They can pick up webshop orders in the market or have them delivered to their homes.
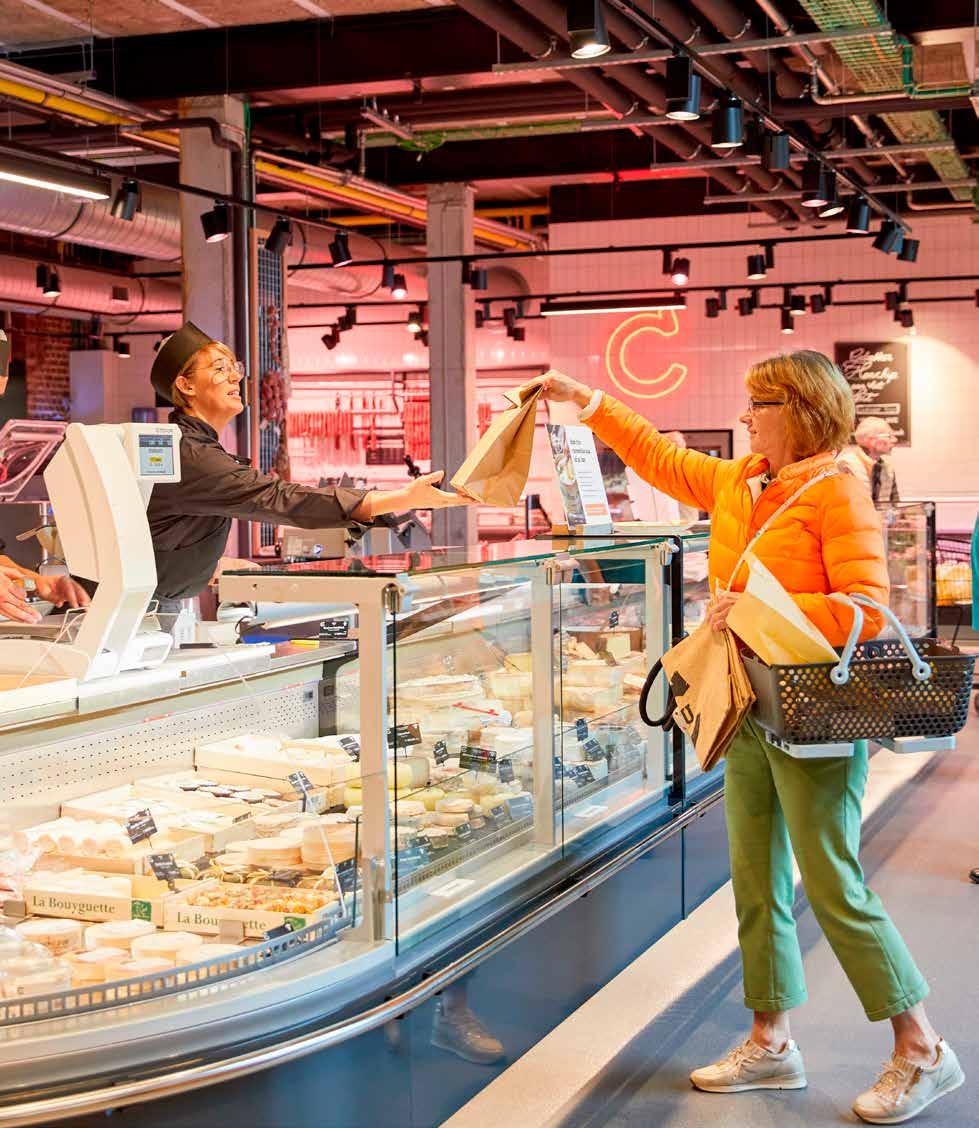
2014
EUR 1.056 million combined revenue
Okay, Bio-Planet and Cru (+2,4%)
4 markets: Overijse, Ghent Kouter, Antwerp Groenplaats and Dilbeek
650 m2 average store area
900 to 950 items
More than 100 employees in FTE
Discover. Test. Experience
cru.be
ACTIVITIES | Retail • Wholesale • Foodservice • Other activities • Group support activities
ENERGY NON-FOOD HEALTH & WELL-BEING FOOD 60
Recovery after a difficult year
• Cru experienced a slight decrease in revenue, due mainly to the crisis context, lower consumer confidence and stronger price awareness, as well as the again increasing number of restaurant visits. This translated into more modest shopping baskets and more spaced-out store visits. Sales picked up again from the first quarter of 2023 onwards.
• Cru has continued to attract new customers, responding to the demand for quality over quantity and for pure, authentic products with a story, even in uncertain times.
• The year-end period was once again a success, with Cru remaining top of mind for party shopping, even if staff shortages presented challenges in the Christmas run-up. The Cuit eatery in Overijse was closed for several months due to road works.
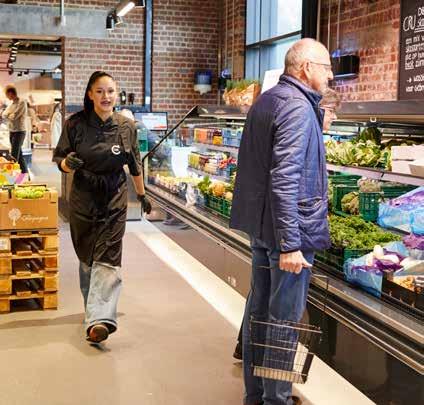
• The understaffing reduced personnel costs. Operating costs, on the other hand, rose due to the start-up of Cru Dilbeek, IT investments and spiking energy expenditure.
Quality and innovation
Cru is known among its customers for the quality of its products. Indeed, many regular customers invariably buy bread, meat, vegetables and fruit every time they visit.
The interaction with like-minded partner-suppliers brings craftspersons together to create new, unique products or recipes that do justice to the pure flavours.
Within Colruyt Group, Cru often plays the role of innovator and tester, for both technology and products.
• First on the market with Belgian apricots and, for the second year in a row, fresh Belgian ginger, now with derivatives such as jam and sirup.
• Introduction of drinking broths and a wider range of premium non-alcoholic drinks.
• Next financial year, the first Belgian premium mussels and even more variation in the range, in tune with the seasons and in response to new trends.
Optimisations
Cru continues to focus on operational efficiency and profitability at store level. Additional steps have been taken to save costs and at the same time to serve customers even more attentively. More effort was put into increasing craftsmanship and optimising purchasing, logistics, waste management and other processes.
Partial cutting and pre-package of processed meats by an external partner: less waste than with cutting at the counter. The pre-packaged charcuterie is proving popular with customers. New personnel planning tool, supported by Colruyt Group IT: more efficient and flexible, lower administration and maintenance costs. Cashless shopping in Cru Dilbeek, previously rolled out in the Cuit eateries: more efficient and safer.
Fourth market in Dilbeek
In September 2022, a fourth market opened on the historic Eylenbosch brewery site in Dilbeek, a busy location on the Brussels periphery.
This new 565 m² experience market is open daily. The Cuit eatery serves breakfast, lunch and aperitif and, with its 255 m², is spacious enough for a relaxed meal.
• The market focuses on an intense experience: customers can see the professionals at work.
• More self-service and a self-checkout ensure a smooth flow.
• The market was in full swing by the important Christmas period, and posted good results from the first quarter of 2023 onwards.
9/10
Satisfied customers
Like no other format, Cru can count on highly satisfied, loyal customers, with year-end orders scoring an average of 9 out of 10 in an online survey of customers who had ordered. Cru will focus even more on customer acquisition and retention, through investments in marketing, craftsmanship, entrepreneurship and market perception. For example, tastings where suppliers present their products and customer tours.
61 ACTIVITIES | Retail • Wholesale • Foodservice • Other activities • Group support activities
ENERGY NON-FOOD HEALTH & WELL-BEING FOOD
Colruyt Prix Qualité is a clearly laid out and affordable neighbourhood supermarket where customers can find everything they need for their daily and weekly shopping. The stores offer the best value in the neighbourhood for a similar shopping cart, and are strong on fresh produce, meat, charcuterie and bread. Other strengths include the wine section and the growing range of organic, regional and local products.
The stores are mainly located along approach roads in (semi-)rural areas and almost all of them have a Collect&Go collection point. About half also have a DATS 24 filling station, to support penetration in the region. The contribution of the filling stations is included in Colruyt Prix Qualité’s revenue.
1996
EUR 654 million revenue (+10,5%, including fuels)
95 stores, 95 Collect&Go collection points
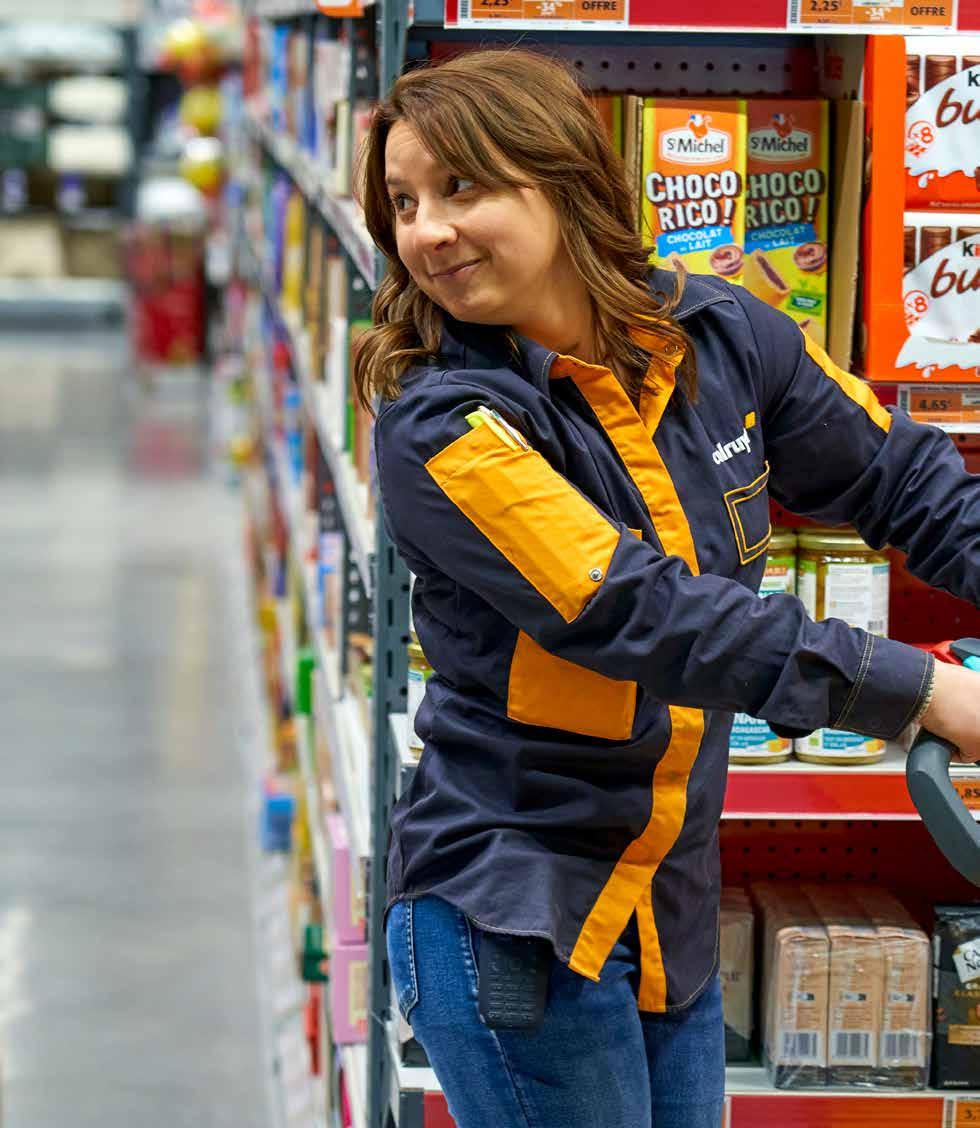
990 m² average store area
9.000 food, 2.500 non-food items
More than 2.000 employees in FTE
44 DATS 24 filling stations
Tout simplement l’essentiel colruyt.fr
ACTIVITIES | Retail • Wholesale • Foodservice • Other activities • Group support activities ENERGY NON-FOOD HEALTH & WELL-BEING FOOD 62
Slight growth on top of inflation
• Our French food retailer looks back with satisfaction on the past financial year. Revenue grew by more than 10%, partly due to expansion with 3 new stores and a remarkable growth and growing loyalty of the wider customer base. Half of the growth was driven by robust sales price inflation, which however only partially covered the higher purchase prices, putting margins under slight pressure.
• Inflation has led to a general shift in the French market, with smaller average shopping baskets and a larger share of cheaper brands. However, thanks to its favourable price positioning and perception and the quality of its product range, Colruyt was able to keep volume decreases and downshifting below the market average and succeeded in gaining local market share.
• Colruyt Prix Qualité enjoyed contractually agreed favourable electricity rates for a long time, but these rose very significantly at the beginning of 2023, with a temporary adverse effect on profits. Thanks to a long-term agreement with our energy producer EuroWatt Energy, Colruyt is assured of more favourable electricity prices in the coming years.
• For the first time in three years, two well-attended wine fairs were organised, plus special in-store tasting evenings for loyal wine buyers.
• Colruyt believes in its growth potential and is pursuing its expansion plans. A fourth store was added in Alsace and another 3 to 4 are planned for the coming financial year.
• The Collect&Go online shopping service has maintained its revenue levels, and continues to invest in performance and ease of use.
Local anchoring
Dole distribution centre operational
Delivery of the new 25.000 m² distribution centre in Dole was slightly delayed, but costs remained under control as most contracts predated the corona crisis. The hall for fast-rotating products opened as planned in mid-2023, with that for fresh products to follow in the autumn of 2023 .
Together with the Gondreville site opened in 2021, the new DC significantly reduces the number of transport kilometres, ensures efficiency gains and permits further expansion.
The planned office building in Dole has been postponed to 2026, allowing more resources to be focused on the logistics refurbishment. Moreover, the option of teleworking has made the need for extra office space less urgent.
In France, Colruyt traditionally supports many local initiatives. Since 2020, for example, it has had a partnership with the annual post-Tour de France cycling criterium in Dole. The initiative is a great success and has generated lots of goodwill among local authorities and residents.
Lowest prices around
As its name already promises, Colruyt Prix Qualité offers excellent value for money. For comparable products from national brands, it has the lowest prices in the immediate vicinity of the shops. By combining this price positioning with ‘proximité’ and ‘convivialité’ (customer-friendliness), Colruyt continues to occupy a unique position in the French retail market. The brand is considerably cheaper than the average local store and distinguishes itself from the hard discounters with, among other things, its wide range of national, regional and local brands.
Sustainability
Although customers focused more on price in the past financial year, Colruyt also continued to roll out sustainability initiatives.
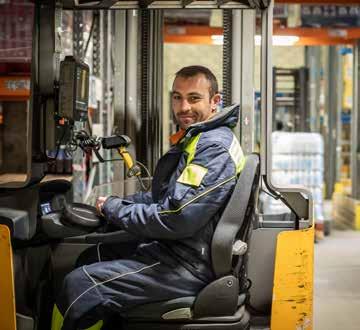
• Introduction of the reusable bags already in use in Belgium, in anticipation of the ban on biodegradable bags.
• More sustainable packaging for pre-packaged fruit and vegetables, in collaboration with suppliers.
• 3 new stores: Horbourg-Wihr, Beuvillers and Bonnefamille
• Two renovations and five to eight openings in the 2023/24 financial year, bringing the mark of 100 stores within reach
Multi-skilled employees
In a tight labour market, it is not easy for Colruyt to find employees, especially for trades such as bakers or butchers. For this reason, the chain is starting to train its employees in a more multidisciplinary way and deploy them in multiple sectors. At the same time, the organisation is gearing itself more to the wishes of the younger generations, including flexible employment contracts and teleworking options.
• More intensive digital marketing communication, including email, social media and digital radio, anticipating future limitations of paper leaflets.
63 ACTIVITIES | Retail • Wholesale • Foodservice • Other activities • Group support activities
ENERGY NON-FOOD HEALTH & WELL-BEING FOOD
Colex (Colruyt Export) supplies retail and foodservice products to distributors, wholesalers and supermarkets all over the world, with a focus on the African continent and French Overseas Territories. The export department does especially well in Central and Western Africa, with the Democratic Republic of the Congo as its largest sales market. Colex does not have its own stores there, but works closely with local partners, using their distribution networks.
Colex offers a wide range of groceries, fresh produce and frozen food under Colruyt Group’s own brands (like Everyday and Boni Selection), supplemented by a peripheral range of A-brands. The company stands out with its unique all-in export service and for the support it gives its customers in marketing the products.
1985
Around 130 active clients
4.500 items
More than 40 employees in FTE
Bringing quality products to the world
colex-export.com
ACTIVITIES | Retail • Wholesale • Foodservice • Other activities • Group support activities
ENERGY NON-FOOD HEALTH & WELL-BEING FOOD 64
Strong growth in the Congo
In the past financial year, Colex’s exports to the Democratic Republic of the Congo grew by more than half. Growth was stimulated by intensive marketing campaigns to promote Everyday as a leading European brand and ‘La marque préférée des Congolais’. In parallel, Colex worked hard to market Boni Selection more firmly as a premium brand with a very wide product range. Market research tells us that conscious Boni consumers are very satisfied with the quality and show exceptional brand loyalty, confirming the slogan ‘L’essayer c’est l’adopter’ (Trying is adopting).

Launch of new products tailored to the African consumer, like milk powder. In-store tasting campaign for the switch from the old, popular own brand Jempy to Everyday.

After ‘Everyday RDC’, the new Facebook channel ‘Boni Selection RDC’ with more than 75.000 followers is also a huge success.
Turntable Senegal
In West Africa, the focus is on Senegal, a highly competitive market where French retailers operate their own stores. There, Colex supports local mini-markets, wholesalers and neighbourhood shops in marketing its own brands. Sales in seven neighbouring countries are also managed out of Senegal.
Local employment
Colex wants to integrate further into the ecosystems of its key markets and also effectively create added value there. For this reason, our export company is keen to attract more local employees for administration, sales and marketing, in addition to the five who are already active in Senegal and the Congo. It is looking at possibilities to expand its range with locally produced products, as is already the case with salt.
65 ACTIVITIES | Retail • Wholesale • Foodservice • Other activities • Group support activities
Congo
ENERGY NON-FOOD HEALTH & WELL-BEING FOOD
Senegal
Since february 2022
Stake: 41,36% in Smartmat nv
The Belgian meal box
Foodbag, the thoroughly Belgian meal box distinguishes itself from the competition with quality products from local suppliers, flexible service and an eye to sustainability.
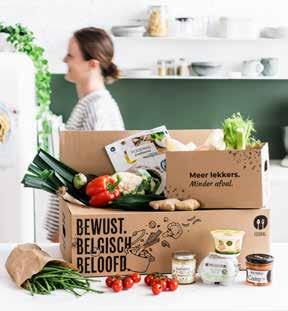
Flexible. Each box contains a choice of three, four, five or six dishes, for one to five people.
Customers order separate boxes or choose a weekly or biweekly subscription, which they can easily pause.
Local. Close cooperation with local partners enables Foodbag to offer the best seasonal products from our own soil. Foodbag is transparent about their origin and presents some thirty suppliers on its website.
Original. Every week customers have a choice of thirty dishes from our own chefs, in five cooking styles: from classic with a twist or vegetarian to cosmopolitan, nice and easy or ready-made.
More choice, more convenience
Foodbag continued its growth also after corona, started working even more intensively with local partners, and successfully completed the integration of the 15gram meal box brand. The range grew from 23 to 30 weekly dishes, with an additional thirty or so convenience items, such as bread, pizza, soup, drinks, fruit and cakes. A special loyalty system has been developed for loyal customers.
Quality delivery
Our own drivers deliver the refrigerated meal boxes to customer homes in Flanders, Brussels and Wallonia, from Friday to Monday. The boxes are also available in about twenty Collect&Go collection points.
• The company’s own delivery network grew to 80 vans and 150 drivers. To permit quality delivery, Foodbag often works with newly retired drivers.
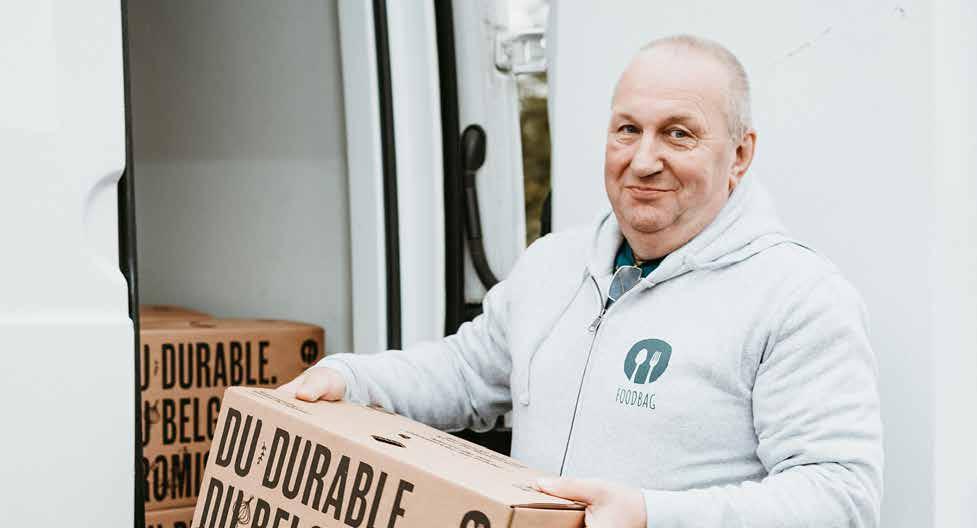
• Foodbag tested electric delivery in core cities and home delivery to a hundred customers via smart locks.
Smartmat
Foodbag is a brand of Smartmat nv, of which Colruyt Group became the main shareholder at the beginning of 2022, together with the Colruyt family holding company Korys. Smartmat is an important player in the Belgian food e-market, and also includes the online supermarket Rayon.
ACTIVITIES | Retail • Wholesale • Foodservice • Other activities • Group support activities
ENERGY NON-FOOD HEALTH & WELL-BEING FOOD 66
Since july 2021 Stake: 51,99%
The most sustainable drinking water
Robinetto sees its mission as providing as many people as possible with quality drinking water from the tap, a much more ecological and cheaper solution than bottled water. The company installs professional tap installations for delivering filtered, cooled, still and sparkling water, and in so doing relieves customers of disposing of masses of plastic waste. Robinetto today offers 40 different taps, specifically designed for catering, events, schools, offices, small and medium-sized companies, and other situations. In addition, it offers reusable, customisable cups and bottles and lemonade syrups.
16 million fewer bottles
• In 2022, Robinetto installed more than 500 water taps in the group’s central buildings and in Colruyt, Bio-Planet and Okay stores.

• All customers together tapped over 4 million litres of water from more than 1.500 installations. Together, they avoided the equivalent of over 16 million 25cl-sized packages.
• Colruyt Group increased Robinetto’s capital at the end of 2022, giving it room to grow further sustainably and to move into the private customers market.
New: the tap for the home
With Robi everyone can now enjoy delicious water at home. The device takes three types of capsules that purify 600 to 1.000 litres of tap water from taste impairments and limescale, enriching it if desired with bubbles and magnesium. The Robi app signals when capsules need replacing. Customers also learn how much water they are drinking and how much money they are saving. The appliance is easy to install under the sink, but Robinetto also takes care of installation.
Robi was first offered at promotional prices to Colruyt Group employees from March 2023 and in Colruyt and Bio-Planet stores from midMay. Other sales channels, like electrical stores, will follow later. The refill capsules will also be available in the group’s food stores.
67 ACTIVITIES | Retail • Wholesale • Foodservice • Other activities • Group support activities
ENERGY NON-FOOD HEALTH & WELL-BEING FOOD
Newpharma is Belgium’s largest online pharmacy, with more than 1.700 brands and 45.000 products at reasonable prices. A team of pharmacists provides customers with advice about products ordered and combinations with previous purchases. Newpharma delivers to the home in Belgium (orders placed before noon are delivered within 24 hours) and has a network of 2.000 collection points. Newpharma Group also delivers in thirteen countries, five of which are served with specific ranges: France, Switzerland, the Netherlands, Austria and Germany.
Investment since December 2017, 100% consolidated since October 2022
EUR 604 million combined revenue Dreamland, Dreambaby, Bike Republic, The Fashion Society, Jims and Newpharma (+15,5%) 1
45.000 items for the Belgian market.
Delivers in 13 countries
More than 250 employees in FTE
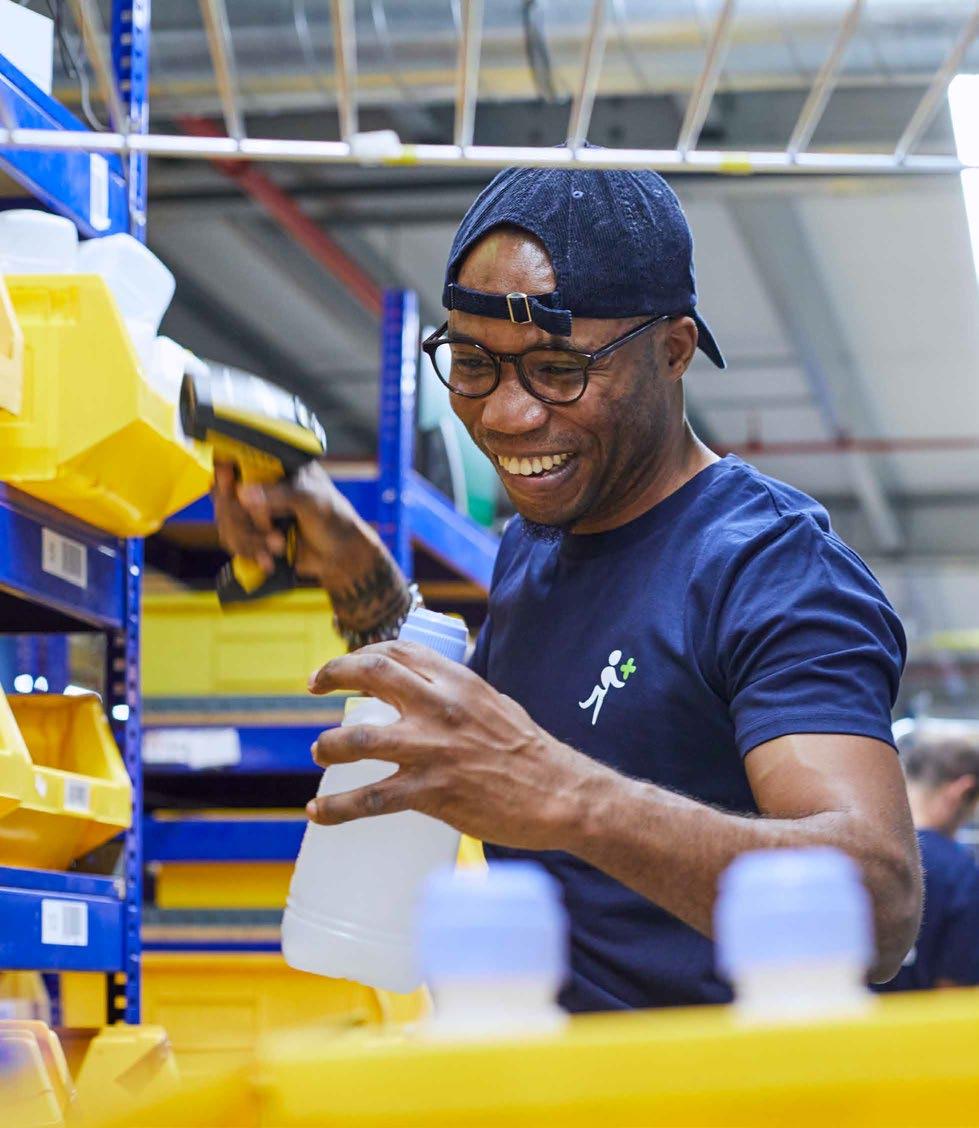
Your pharmacy, always at hand
Newpharma.be
(1) Includes Jims since May 2021 and Newpharma since October 2022 (three months of revenue)
ACTIVITIES | Retail • Wholesale • Foodservice • Other activities • Group support activities
ENERGY NON-FOOD HEALTH & WELL-BEING FOOD 68
Solid growth
• After the busy corona period, Newpharma also achieved solid growth in the past financial year (2022 calendar year), partly as a result of inflation, partly due to the expansion of the customer base. Since corona, seniors are also finding their way more easily to the online pharmacy. Frequency increased and the average shopping basket grew, mainly due to increased sales of non-prescription medicines, and despite the slight shift from premium brands to cheaper alternatives. Newpharma kept its costs under control and its margin stable.
• On the Belgian market, Newpharma is the second largest online pharmacy in terms of turnover, with the widest penetration in Wallonia. In Flanders, Newpharma is becoming increasingly known thanks to synergies from Colruyt Group..
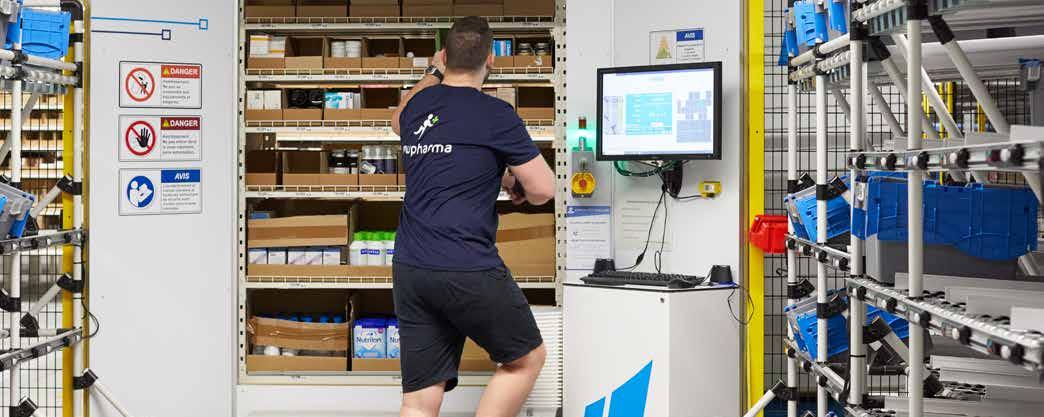
• In terms of international growth, Newpharma focuses on Switzerland, where it is number two with Apo24.ch, and on France, where newpharma.fr is already the largest. The activity is growing strongly year after year, partly thanks to access to a wide and relevant range of French brands.
• Newpharma prides itself on its high customer satisfaction, thanks to, among other things, the wide choice, strong promotions, sufficient stock availability, correct deliveries, sound advice and an accessible customer service
Intensive cooperation
Newpharma delivers orders in 400 Collishop collection points at Colruyt Lowest Prices and Okay, a delivery method that is very popular. Our store formats also work together with Newpharma Group in other areas.
Advice on defining the product range in the parapharmacy departments of the Colruyt stores, and limited advice also to Dreambaby and Okay
New free app ‘Relaxation by Newpharma’, developed by Newpharma Group with specialists from our Jims fitness chain. The user-friendly app helps the user relax in minutes with a combination of 3D animations, sounds, simple yoga and breathing exercises. The app fits in seamlessly with the mission to make preventive healthcare more accessible.
New digital campaign on the terminals of the DATS 24 filling stations.
Operations centre partly automated
• The 21.000 m² operational centre in Liège was commissioned in October 2021 and has been running at full capacity since May 2022. All orders for Belgium and abroad leave from Liège. The larger warehouse allowed Newpharma to increase its stocks and anticipate possible shortages.
• The site is partly automated with Scallog robots, which look after around 30% of the picking. This automation reduced the margin of error to almost zero and contributed in part to the increase in operational efficiency by a quarter.
• The current storage space is sufficient to accommodate growth for a few more years. After that, there is potential to expand the site to 50.000 m².
69
ACTIVITIES | Retail • Wholesale • Foodservice • Other activities • Group support activities ENERGY NON-FOOD HEALTH & WELL-BEING FOOD
we move with you
Jims runs 34 fitness clubs in Belgium and Luxembourg. As the country’s second largest fitness chain, its mission is to encourage consumers to adopt fitter and healthier lifestyles. Customers follow fitness or strength training in a safe environment and join very diverse group lessons at attractive prices. The fitness chain is strong on individual guidance, with an eye for health in the broad sense. In every club of the network, members can count on quality service from skilled and enthusiastic employees.

Acquired in May 2021
EUR 604 million combined revenue Dreamland, Dreambaby, Bike Republic, The Fashion Society, Jims en Newpharma (+15,5%) 1 34 fitness clubs (30 in Belgium and 4 in Luxembourg)
More than 100 employees in FTE
We move with you
Jimsfitness.be
(1) Includes Jims since May 2021 and Newpharma since October 2022 (three months of revenue)
ACTIVITIES | Retail • Wholesale • Foodservice • Other activities • Group support activities
ENERGY NON-FOOD HEALTH & WELL-BEING FOOD 70
Record revenues
• Jims posted strong revenues, due among other things to expansion with new premises, inflow of new members and higher spending per customer, especially for group lessons.
• In Luxembourg, Jims is the market leader and reference in corporate fitness with four well-functioning clubs. In Belgium, urban clubs are also starting to attract corporate clients, especially through tailor-made packages.
• The subscription structure has been simplified, with formulas for people who like to train individually, those who want more coaching, or those who want to add specific sports. Quite unique in the sector are the group lessons for limited numbers of 8 to 12 participants from specific target groups, for example power for women or pre- and postnatal guidance.

• From April 2023, Jims wants to strengthen the workforce per site by one half-time equivalent employee. In this way, a full-time coach can be available in every club, in addition to two part-time employees.
We Move With You
More than ever, Jims focuses on health in the broad sense of the term, with attention to exercise and also nutrition, sleep, stress prevention, etc. Under the new motto We Move With You’, the fitness chain wants to make health broadly accessible and move with the customers through all phases of life. That translates into focused offers for target groups like beginners, regular sportspersons, pregnant women, the over-55s …
The new slogan of the restyled Jims also refers to its commitment to connectedness, between staff and members, between members themselves, with society. The company reaffirmed that commitment through a partnership with the Special Olympics Team Belgium, which prepared for the 2023 Summer Games at Jims.
Flywheel for movement and health
Jims is active in the field of ‘Health and wellness’ and develops holistic solutions for a healthier lifestyle.
• Fitness is a rewarding activity for linking exercise and nutrition and also for reaching retail formulas’ target groups via Jims. A small number of co-creations with internal partners: pre- and postnatal training with Dreambaby, training for cyclists with Bike Republic, nutritional supplements from Newpharma, children’s sports camps with Dreamland, etc. The smart, healthy vending machines supplied by our food service company Solucious also inspired the unmanned ‘Spar For You’ concept.
• Nine innovative pilot projects are currently running within the group, in which, for example, logistics employees receive instruction on the floor in ergonomic lifting and tilting techniques or warming-up exercises to avoid injuries or occupational accidents. Jims is also experimenting with concepts like sports days or relaxation sessions during breaks, in order to further develop and commercialise its services to third parties.
Accelerated growth plans
Jims invested heavily in expansion and expanded its network from 27 to 34 clubs.
In Belgium, the six clubs run by Oxygen were taken over, giving almost complete coverage of East Flanders. The concept of the acquired clubs fits well with that of Jims, with integration costs limited mainly to software implementation and remodelling. By the end of 2023, the clubs will be in the new Jims look. All employees and the majority of customers made the switch.
In October 2022, a new club opened in Kuurne, close to the Colruyt Lowest Prices, Bike Republic, Dreamland and Dreambaby outlets. This fitness club is completely fitted in the new house style, which positions Jims higher up in the middle market.
In Luxembourg, 1 new club opened and after the end of the financial year, a fitness club was also added in Wilrijk, with a separate ‘Boxing cube’ for premium boxing lessons.
Jims is seeking opportunities for further expansion in metropolitan areas. It sees a potential for 50 to 60 clubs in Belgium and Luxembourg, preferably on sites where Colruyt Group is already present. The target for next year is 4 openings and 11 renovations.
The newly established Jims Academy ensures greater uniformity in the training of our own and external trainers, who are obtaining more and more European and international quality certificates.
71 ACTIVITIES | Retail • Wholesale • Foodservice • Other activities • Group support activities
ENERGY NON-FOOD HEALTH & WELL-BEING FOOD
The Dreamland family and seasonal store is Belgium’s leading toy seller. It also offers an extensive range of gaming, outdoor toys and garden furniture, in addition to school supplies, books, etc. Dreamland wants to inspire children and their parents to share connecting moments in a fun way. The format consists of physical stores and an online shop. Using the free Click&Collect service, customers can reserve items from the store stock to pick up at the store within three hours. Webshop reservations can also be picked up in a Colruyt or Okay store or delivered to the home.

1994 acquisition Droomland, renamed Dreamland in 2002
EUR 604 million combined revenue Dreamland, Dreambaby, Bike Republic, The Fashion Society, Jims and Newpharma (+15,5%) 1
48 stores
1.600 m2 average store area
45.000 items offline and online
More than 750 employees in FTE
Unpack your dreams
dreamland.be
(1) Includes Jims since May 2021 and Newpharma since October 2022 (three months of revenue)
ACTIVITIES | Retail • Wholesale • Foodservice • Other activities • Group support activities ENERGY NON-FOOD HEALTH & WELL-BEING FOOD 72
Standing our ground in a challenging market
• Dreamland has been operating for some time in a challenging market characterised by increasing competition, pressure on volumes, a shift from offline to online consumption and changing customer behaviour. As a result, Dreamland, despite its market leader position, had another difficult financial year. This was made worse by the current macroeconomic context, leading consumers to cancel purchases or wait for the sales. In the first quarter of 2023, revenue was negatively affected by the reduced online offering and the bad spring weather. In those months, Dreamland was able to clear up part of the overstock built up in 2022 through hefty discounts and round prices.
• In a Belgian toy and gaming market that shrank by about 7% during 2022, Dreamland successfully maintained its leading position. Collectables and merchandising items in particular did well, as did blocks and building kits for young and old. Games and puzzles, on the other hand, were less popular after the earlier boom in the corona period.
• An in-depth profitability exercise was carried out in the past financial year. Dreamland reduced the number of items, both online and in stores. The children’s rooms and deco categories are now discontinued, and product groups like books, gaming and writing tools whittled down.
• No new store openings are planned for the present and coming financial years. Dreamland will focus on making the current activities profitable within a reasonable period of time.
Betting on ‘click2brick’
Dreamland has been an important omnichannel player for years, combining its extensive store network with an online sales channel. This webshop has proved very difficult to make profitable, especially in times of rising transport costs. Dreamland therefore chose to evolve towards a ‘click2brick’ model, with a more limited online offering and, above all, information and inspiration for purchases in the physical stores, where experience takes precedence for the children and parents target group. The physical shopping experience remains crucial, especially for younger children, offering an advantage over pure online players. Here are a number of measures that were carried out since early 2023:
• The webshop now focuses only on toys, outdoor toys and garden items.

• 2,99 euros is charged for delivering online orders at Colruyt or Okay, and 5,99 euros for the home delivery of parcels.
• The well-functioning Click&Collect service in the Dreamland stores remains free of charge. Customers who want to reserve from the store stock can find the exact stock even more easily online.
Second life for 2.350 book bags
Dreamland joined forces with NGO Oxfam and called on its customers to bring in old book bags or backpacks in exchange for a 5 euro purchase voucher. No fewer than 2.850 items were collected, of which Oxfam offered some 2.350 in its stores for an average 12 euros each. The NGO used the proceeds for its operations and projects in Belgium.
Restructuring at Dreamland and Dreambaby
After the financial year closing, Colruyt Group announced on 19 April 2023 its intention to start a restructuring programme for Dreamland and Dreambaby, with the Belgian ‘Renault Act’ collective redundancy legislation applying to 150 and 42 employees of these non-food brands respectively. This includes the intention to close one Dreamland store and five Dreambaby stores.
Acquisition by ToyChamp
• 1 new store in Laneffe
We are convinced that these actions are necessary to ensure the future of Dreamland and Dreambaby. We plan to provide the necessary guidance and support for all colleagues and to do everything we can to work constructively with all parties involved.
At the same time, we also announced that we had reached an agreement in principle with the Belgian family business ToyChamp, which will acquire 75% of Dreamland’s shares. ToyChamp is a prominent, profitable player in the toy market with 24 stores in the Netherlands and 9 in Belgium. The objective is to give Dreamland a healthy future in the challenging toy market with ToyChamp as a strong partner. By combining their knowledge and expertise, Dreamland and ToyChamp would together become the number 1 toy retailer in Belgium, with Toychamp also active in the Netherlands. Dreamland is and remains a strong brand that will continue to exist, also as a legal entity and employer. As soon as the transaction (expected by the end of 2023) can be completed, Dreamland will no longer be fully consolidated in the figures of Colruyt Group.
73 ACTIVITIES | Retail • Wholesale • Foodservice • Other activities • Group support activities
ENERGY NON-FOOD HEALTH & WELL-BEING FOOD
Dreambaby is the largest national player in the Belgian baby market, with a wide, high quality product offering for babies and toddlers up to 30 months. The physical stores and the online shop offer a choice of most major brands and the own brand Dreambee. Customers can compile and manage baby gift lists both online and in-store. Online reservations can be collected in Dreambaby, Dreamland and Colruyt stores, or delivered to the customer’s home. Dreambaby stands out for the personal guidance and advice provided by experienced staff.
2001
EUR 604 million combined revenue Dreamland, Dreambaby, Bike Republic, The Fashion Society, Jims and Newpharma (+15,5%) 1
32 stores
600 m2 average store area
8.000 items in the stores and the webshop
More than 250 employees in FTE
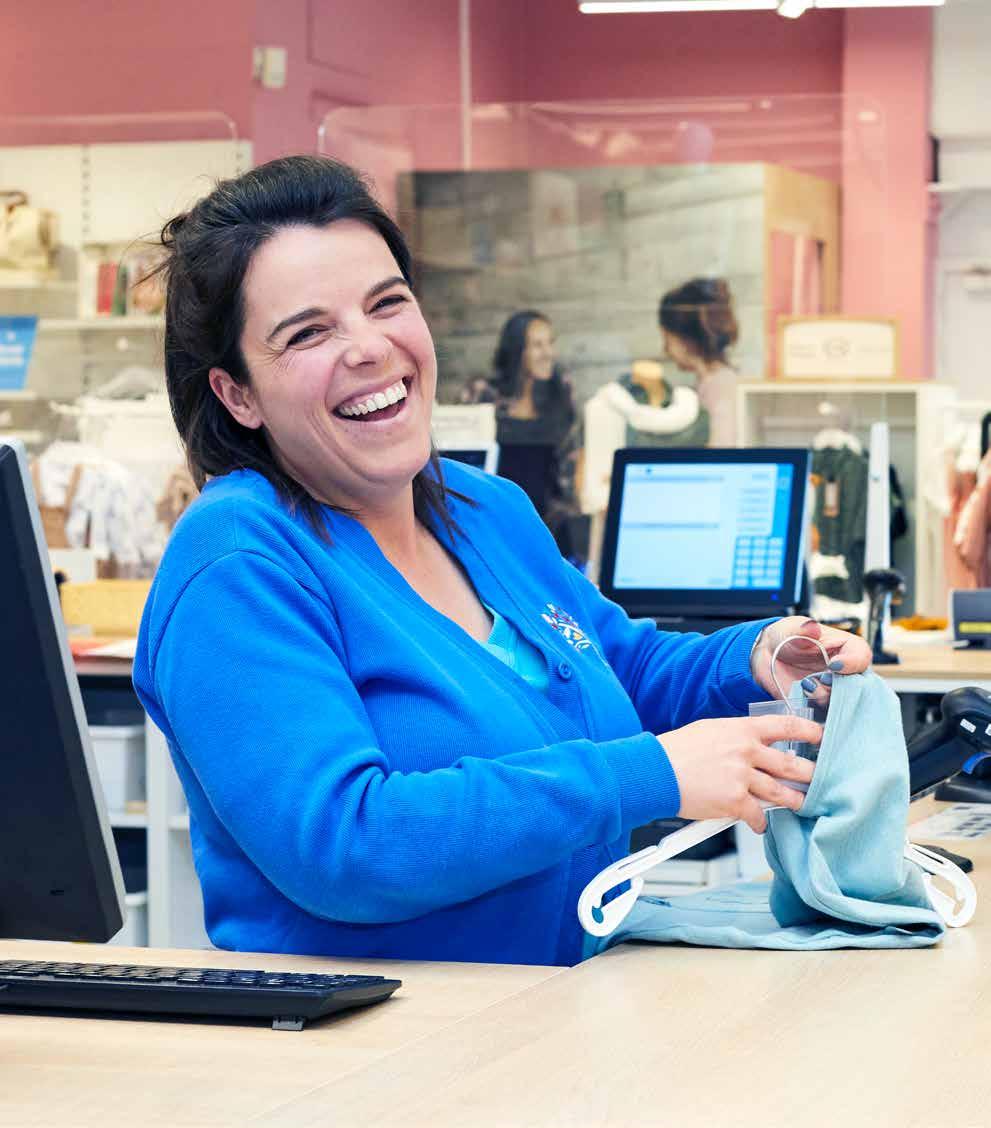
The best start for you and your baby dreambaby.be
(1) Includes Jims since May 2021 and Newpharma since October 2022 (three months of revenue)
ACTIVITIES | Retail • Wholesale • Foodservice • Other activities • Group support activities
ENERGY NON-FOOD HEALTH & WELL-BEING FOOD 74
More synergy within the group
Difficult financial year, focus on profitability
• Dreambaby has been operating for some time in a challenging market characterised by increasing competition, pressure on volumes, a shift from offline to online consumption and changing customer behaviour. This led to a very difficult financial year in which Dreambaby saw falling sales volumes. The situation was made worse by the current macroeconomic context, with stock shortages in the aftermath of the logistics crisis and customers cancelling or postponing their purchases. The volume decline was most pronounced in the baby gift lists.
• In a highly competitive landscape, Dreambaby managed to consolidate its market leader position, with the biggest market penetration after second-hand providers.
• In 2023-24, Dreambaby will focus on making the existing activities profitable and does not plan any (re)openings. In April 2023, after the end of the financial year, the company announced it was permanently closing 5 stores. These are the outlets in Drogenbos, Vilvoorde, Tienen, Beveren and Huy. Internal reorientation will be pursued for the employees involved. See the box on p. 73.
• The pilot project with an online second-hand platform was discontinued. Dreambaby is thinking hard about how to provide a more customer-friendly and scalable service, to respond to the growing demand for secondhand and to evolve towards a more circular and sustainable baby sector.
• 1 new store: La Louvière
• 3 relocations: Wilrijk, Lede en Vilvoorde
• 1 reopening (after fire): Zaventem
Dreambaby invests in customer acquisition and loyalty through successful and new partnerships with various formats.
• Workshops in collaboration with Colruyt Group Academy. Physically and digitally, with relevant topics about pregnancy and baby. Baby carrying techniques have been a fixed feature for several years.
• New goodie bag to be picked up in the store, with the cooperation of Newpharma, Foodbag, Jims, Boni and Collect&Go.
• Anyone handing in a baby gift list receives 150 euro of discounts and free products at almost all our store formats.
Vibrant community
After a successful test with a closed Facebook group on the subject of sleep, Dreambaby started a new group for future parents. The ‘Pregnant with Dreambaby’ community soon numbered 1.900 members, who exchange experiences, information and tips among themselves.
Sustainable business
• Dreambaby and Dreamland combined and optimised their transports, in so doing saving many transport kilometres.
• Textiles in Dreambee’s own brand range are made from 100% organic cotton.
• More sustainable packaging of privatelabel products, in collaboration with suppliers.
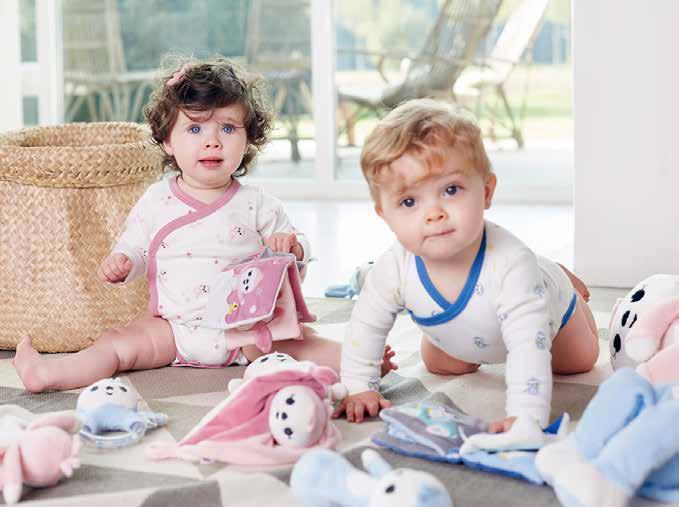
75 ACTIVITIES | Retail • Wholesale • Foodservice • Other activities • Group support activities
ENERGY NON-FOOD HEALTH & WELL-BEING FOOD
FASHION SOCIETY
FS
The Fashion Society groups three multi-brand chains for women’s and men’s fashion, operating mainly in Belgium, but also in Luxembourg and France. These are out-of-town destination stores, with a focus on customer satisfaction and shopping experience.
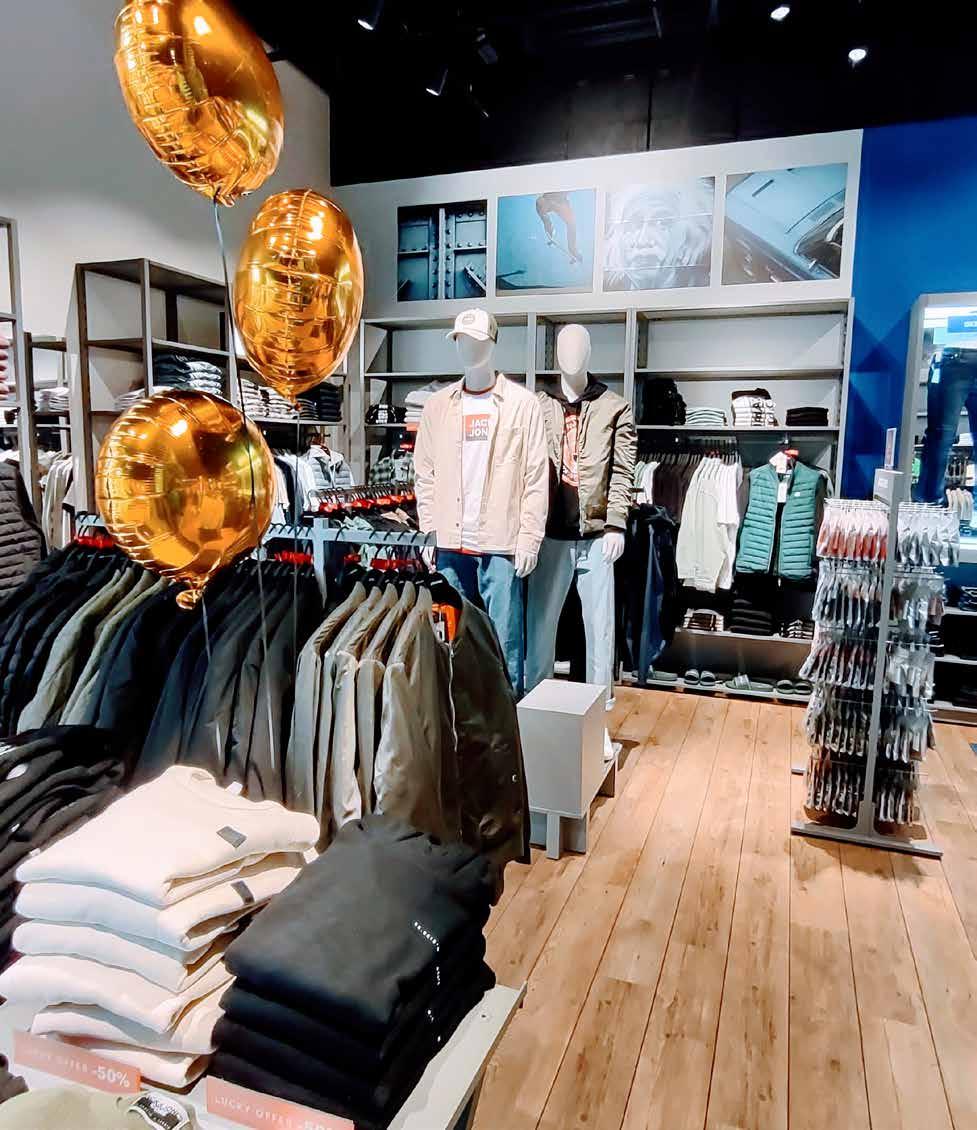
The store concepts target broad but distinct groups, covering a large proportion of the fashion market. Zeb is for confident, fashionconscious customers seeking inspiration. Family stores PointCarré and The Fashion Store target multi-generational trend followers and focus on personal advice.
2020: Colruyt Group increases stake to more than 96%, 100% consolidated since January 2022
EUR 604 million combined revenue
Dreamland, Dreambaby, Bike Republic, The Fashion Society, Jims and Newpharma (+15,5%) 1
129 stores under the Zeb, PointCarré and The Fashion Store labels
1.000 m2 average store area
Average of 7.500 items on an annnual basis
More than 800 employees in FTE zeb.be | pointcarre.be | thefashionstore.be
(1) Includes Jims since May 2021 and Newpharma since October 2022 (three months of revenue)
ACTIVITIES | Retail • Wholesale • Foodservice • Other activities • Group support activities ENERGY NON-FOOD HEALTH & WELL-BEING FOOD 76
Highest revenue ever
In a challenging fashion market, the fashion group saw its turnover increase strongly, mainly from the opening of new stores and inflow of new customers. Zeb was the strongest performer, The Fashion Store did well and PointCarré was just below expectations. From spring 2022, the textile business felt the inflationary pressure on costs, but a good summer put a shine back on the business. Subsequently, the warm autumn disrupted the start of the winter season. The resulting sales shortfall was partially recovered between mid-November and the end of the financial year. After peaking during the corona period, online sales stabilised at the former level. Customers purchased more price-consciously and looked more actively for promotions, which put some pressure on margins. Thanks in part to strict personnel planning, costs remained under control. After a number of challenging months, the fashion group looks to the future with confidence.
The Fashion Society is one of the few fashion retailers to continue to invest in expansion, with seven new stores in 2022 and five planned openings for 2023. The group offers customers continuously changing collections, with the right articles at the right time. They can also count on numerous deals and promotions, plenty of shopping experience and communication tailored to their needs. As a result, the group’s market share continues to grow, both in Flanders and in Wallonia.
Switch to digital marketing
After thorough testing, the three fashion chains accelerated their transition from print to digital marketing communication during the past financial year. Zeb replaced two-thirds of its printed matter with digital campaigns, with significant savings on paper, printing and postage costs. In addition, online campaigns yield more relevant data and customer insights.
• 79 stores (+5)
• New stores in Auvelais, Dour, Braine-le-Comte, Mechelen en Lier, with 1.500 m² the largest in the country.
• Potential for more than 100 stores in Belgium, of which 70 in Flanders.
Experience and co-creation
• Zeb provided lots of shopping experience during the past financial year, including a fashion show and campaigns with well-known ambassadors like James Cooke. Zeb also remains strong in exclusive co-creations, including new collections from Nora Gharib and Tourist LeMC.
• In recent years, the chain has invested heavily in making its stores accessible to persons with disabilities. The Zeb for Everyone action plan has already won several awards. For example, Queen Mathilde visited Zeb Merchtem, as part of the ‘De Warmste Entrée’ initiative of trade federation Comeos.
• Customers are increasingly making use of private shopping outside opening hours.
• 19 stores (+4)
• New stores in SintKatelijne-Waver, Zoersel, Kalmthout and Hasselt
• Potential of 30 stores, mainly in Flanders
The Fashion Store launched its new webshop, added new collections and continued to roll out its Personal styling service.
• 31 stores, of which 12 in franchise (mainly in Wallonia and 2 in France)
• New store in Soignies
• The franchise formula is proving successful in France, where independence and an individual approach are appreciated. The chain wants to open three integrated flagship stores there in 2023, as an accelerator for later expansion through franchising.
• In Belgium, PointCarré took over three Belgian stores from franchisees.
77 ACTIVITIES | Retail • Wholesale • Foodservice • Other activities • Group support activities
ENERGY NON-FOOD HEALTH & WELL-BEING FOOD
Bike Republic is a leading seller of primarily e-bikes, cycling clothing and accessories to individuals and companies. The extensive bike range consists of thirty top brands, including the Hiron own brand. As a ‘compagnon de route’ for every moment, Bike Republic wants to provide pure cycling pleasure to as many people as possible, from commuters and recreational cyclists to sports enthusiasts. The bicycle specialist excels in accessibility, through its attractive shops, well-arranged website and high accessibility by phone and online. Bike Republic also sets itself apart through providing top notch service and making life easier for customers with sound advice, excellent after-sales service, maintenance and repair in its own workshops, insurance, etc. B2B customers can count on a total solution, with various buy or leasing formulas, customised cycle plans and a wide range of services.
2019: acquisition of Fiets! by Colruyt Group, renamed Bike Republic in 2021
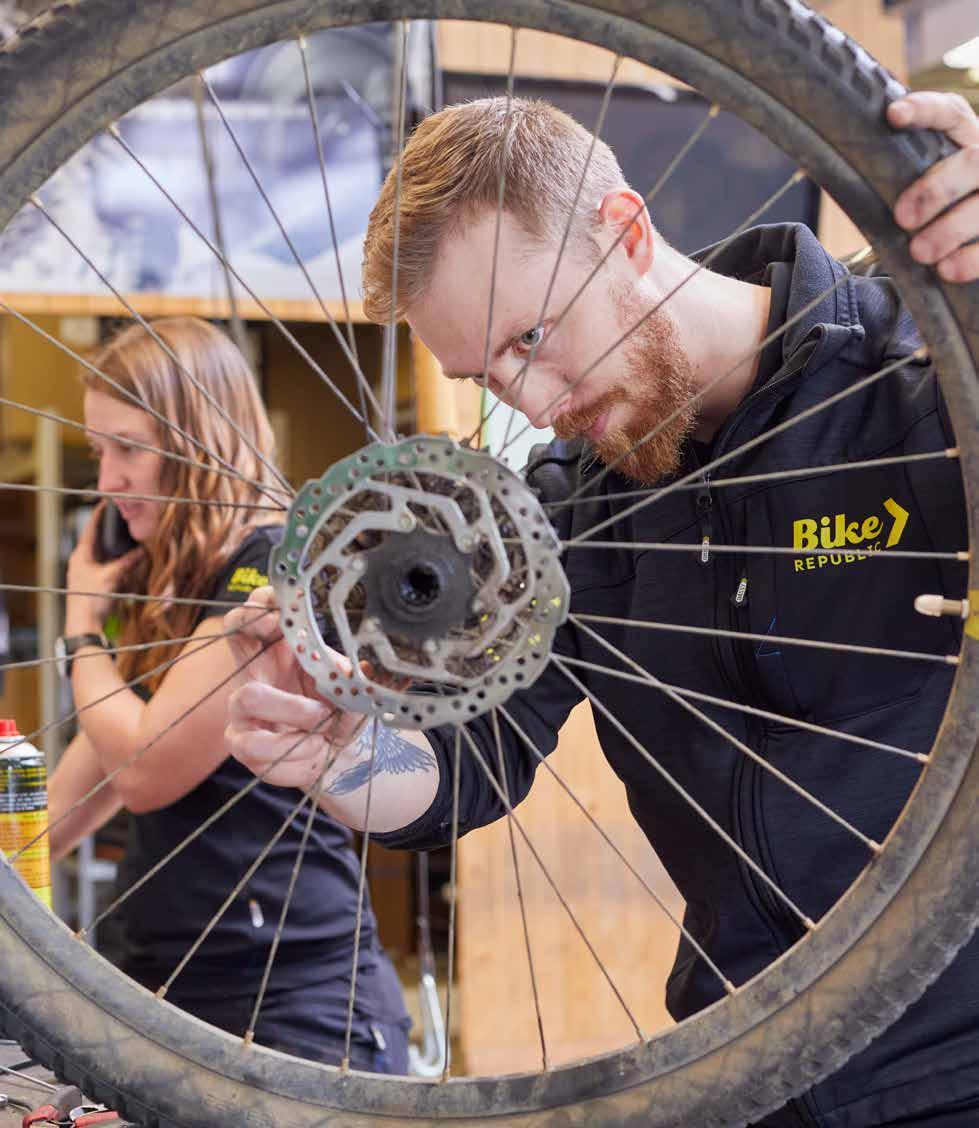
EUR 604 million combined revenue Dreamland, Dreambaby, Bike Republic, The Fashion Society, Jims and Newpharma (+15,5%) 1
27 stores with showroom and workshop
800 to 1.200 m² average store area
More than 10.000 bikes in stock, of which 7.000 e-bikes.
More than 150 employees in FTE
Your all-time companion on the road bikerepublic.be
(1) Includes Jims since May 2021 and Newpharma since October 2022 (three months of revenue)
ACTIVITIES | Retail • Wholesale • Foodservice • Other activities • Group support activities
ENERGY NON-FOOD HEALTH & WELL-BEING FOOD 78
Expansion moves up a gear
• Bike Republic continues to invest heavily in expansion, adding six branches last financial year, including a first in the Brussels Region. With rural Flanders now fairly well covered, the focus will shift in the coming years to Flemish cities like Bruges and Antwerp, and then to Brussels and Wallonia. Our bike specialist sees potential for around sixty shops in Belgium and wants to become the reference on the (e-)bike market.
• Multiple criteria are taken into consideration in acquisitions, including (potential) revenue, brand portfolio, identity, culture and craftsmanship, services and unique assets.
• The Evere store was taken over from family business IMP Bike, a well-known name in Brussels. As the first truly bilingual store, Evere is an important springboard towards the French-speaking market.
• The stores in Aalst and Ninove were acquired from CycloM, those in Retie and Turnhout from Cycling Van der Veken, both established names in their regions.
Significant growth strengthens market position
• In a growing bike market, Bike Republic almost doubled its revenue, partly by expansion and partly by increased sales in the existing points of sale. The additional sales came mainly from B2B customers, while private spending remained stable. B2B sales already represent a third of total sales.
• Bike Republic continues to steadily increase its market share and is extending its lead as the country’s largest multi-brand chain. This upscaling is a strategic advantage for being able at all times to offer customers the right bike, given the continuing long delivery times and shortages at suppliers.
• The range was further enriched with a number of quality brands. Bike Republic now has an attractive range of e-bikes in the middle to premium segment, supplemented with a range of classic entry to middle segment (sports) bikes. The company is also increasingly focused on cargo bikes for couriers, craftspeople or liberal professions who want to move around the city sustainably and smoothly.
• New store in Sint-Denijs-Westrem
• Acquisitions in Evere, Ninove and Aalst, Retie and Turnhout
bikes on 1.000 m²
• The new Bike Republic in Sint-Denijs-Westrem is one of the largest outlets, including a 1.000 m² showroom with no fewer than 300 bikes and an indoor test course.
• With three stores in the greater Ghent area, Bike Republic is easily accessible for customers from both the city and the suburbs. They can view the entire collection and order a bike in Sint-Denijs-Westrem and then have it delivered and maintained in a city shop. Accessibility trumps!
79 ACTIVITIES | Retail • Wholesale • Foodservice • Other activities • Group support activities
300
ENERGY NON-FOOD HEALTH & WELL-BEING FOOD
Betting on the business market
Bike Republic still sees lots of market potential for company bicycles, offering business customers attractive purchase and lease formulas, customised bicycle plans and a wide range of services like tax advice, maintenance and repair, and assistance. In order to unburden B2B customers even more, a new platform came on line in March 2023 for complete fleet management, from purchase through depreciation to residual value. Employees can also use the platform to book appointments for maintenance and repairs
A first: the CityQ cargo bike
Bike Republic is the exclusive distributor in our country of the Norwegian-German CityQ electric cargo bikes. These combine the comfort of a car with the advantages of an e-bike, making them interesting for companies, self-employed people, and families alike. The modular bike is available with, for example, a closed cargo box or a bench seat at the back, if desired with stickers and a custom finish.
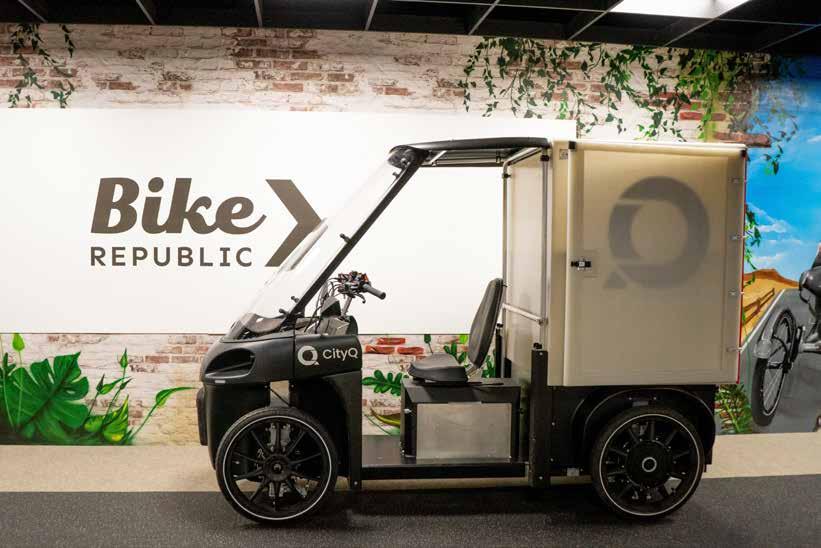
Intragroup synergies
Bike Republic regularly organises promotions with other store formats.
• Facebook competition for unique ‘Koersboxen’ (Cycle racing boxes) with six beers, to be picked up at Colruyt.
• 1 year’s free cargo bike use, to be won in a competition marking the 25 years of Okay.
• 250 euros coupon in the DreamBaby goodie bag for couples expecting a baby.
• Customer platform with benefits from Jims, Okay, Newpharma ...
• Participation in Colruyt Group Academy’s ‘Gerust CO2-Bewust’ (Just CO2-Conscious) family experience day together with DATS 24, Bio-Planet and Colruyt.
ACTIVITIES | Retail • Wholesale • Foodservice • Other activities • Group support activities
ENERGY NON-FOOD HEALTH & WELL-BEING FOOD 80
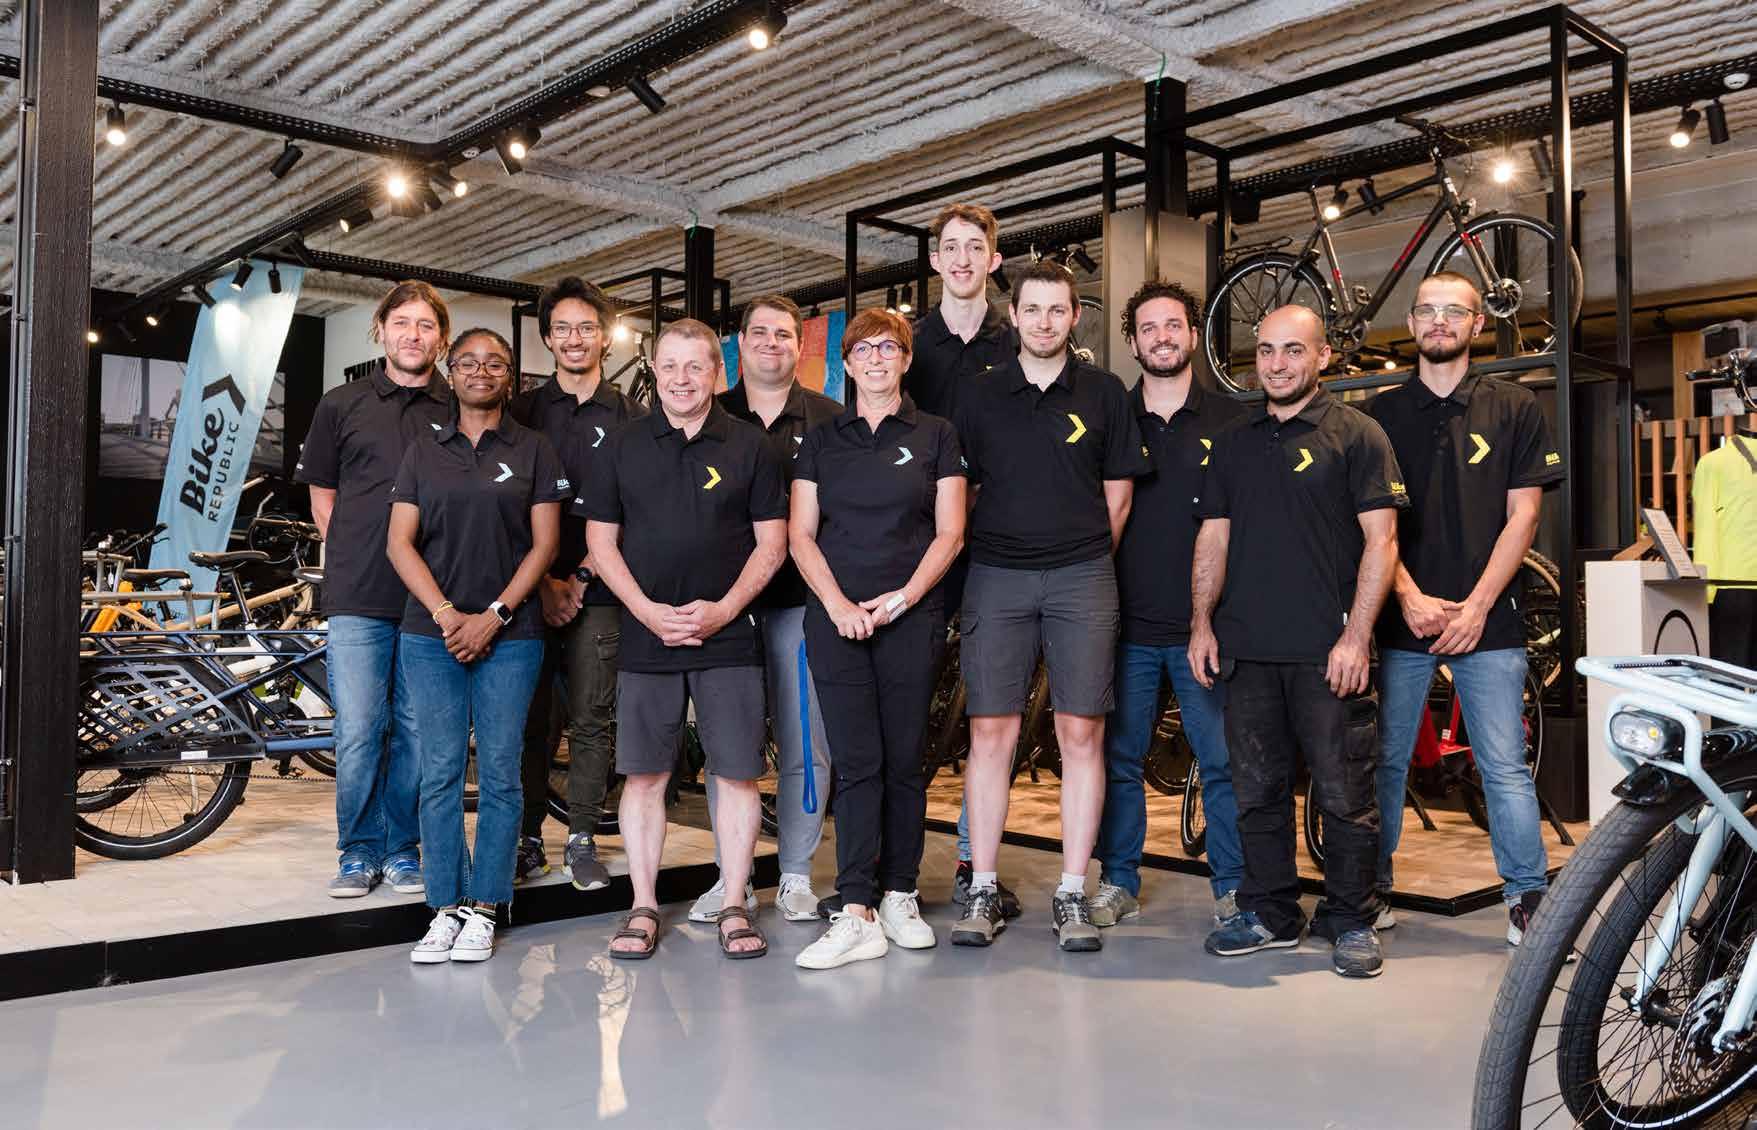
81 ACTIVITIES | Retail • Wholesale • Foodservice • Other activities • Group support activities
ENERGY NON-FOOD HEALTH & WELL-BEING FOOD
Team Bike Republic Evere
Retail Partners Colruyt Group is the licensee of the Spar format in Belgium and works closely with the independent Spar storekeepers. Besides supply and assortment management, the organisation also takes care of commercial policy, from promotion and marketing to sales support. RPCG has a unique consultation model, in partnership with the elected delegation of retailers. Together, they shape the look of the stores, product range, commercial focus and the future of Spar Colruyt Group.
RPCG also supplies fresh products and groceries to independent Alvo storekeepers and unaffiliated clients
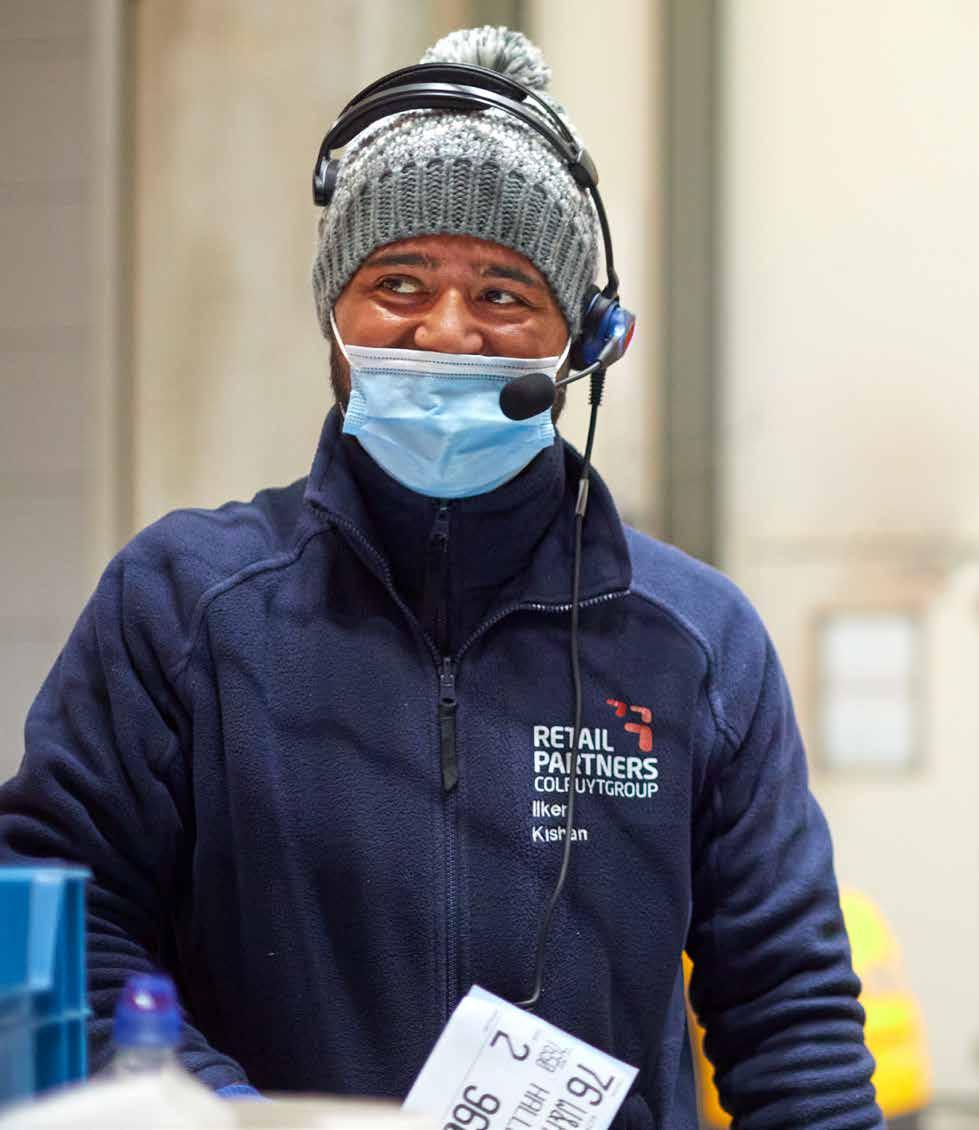
2003 Spar Retail, renamed Retail Partners Colruyt Group in 2014
213 Spar storees
52 Alvo stores
75 independent retailers, of which 20 are Mini Markets
More than 800 employees in FTE
Doing business together is to grow retailpartnerscolruytgroup.be
ACTIVITIES | Retail • Wholesale • Foodservice • Other activities • Group support activities ENERGY NON-FOOD HEALTH & WELL-BEING FOOD 82
Solid financial year
Given the difficult socio-economic context, Retail Partners Colruyt Group can look back on a solid financial year. Revenue rose, mainly as a result of rising inflation, while sales volumes clearly declined. The customers of the affiliated stores visited more frequently, taking away smaller average shopping baskets. Sales fell most in categories like alcohol and home maintenance, while bread and deli dishes saw volumes increase. Nevertheless, RPCG maintained its customer base and market share, which is a good performance in a challenging retail market.
Pressure on the margin from inflation and wage indexation was largely eliminated by tight cost control, thanks among other things to energy-saving measures and optimised staffing with fewer temporary and interim employees. With its high-performance IT platform, RPCG was able to switch gear quickly enough and take measures right among the logistics chain to flexibly absorb the decrease in volume.
Independent Spar entrepreneurs saw their profitability threatened by high energy expenditure and by the wage indexation in January 2023. RPCG provided support where necessary by, for example, accelerating the (energy) renovation of the stores and with technical analyses and energy audits for entrepreneurs who wanted.
RPCG maintained its delivery reliability at an exceptionally high level throughout the financial year. The excellent level of service to independent retailers is generally recognised in the sector.
In the past financial year, the number of Spar retailers remained more or less stable, as did the number of Alvo stores. RPCG had slightly fewer unaffiliated clients, due to cessations of activity or upscaling. RPCG is keen to further expand its network of affiliated and independent clients.
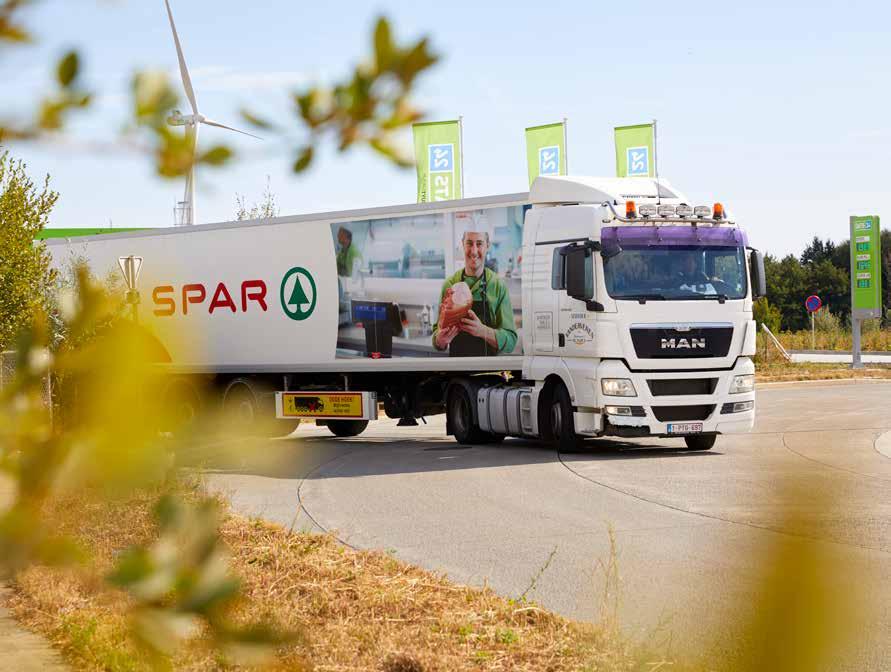
Context for successful entrepreneurship
• Even in a difficult retail market, RPCG is looking for new independent entrepreneurs for the Spar format, which remains one of the most profitable in the franchise market. Candidate entrepreneurs can count on broad support in starting their businesses.
• RPCG can offer entrepreneurs decent margins by rigorously continuing to focus on efficiency throughout the supply chain, from order processing to invoicing. At the same time, the organisation monitors the profitability of the affiliated stores, facilitating timely preventive intervention if necessary.
• The franchise model offers a lot of scope for personal entrepreneurship and a wide range of support services and advice, for example for improving cost structures.
• Starting from a stable IT environment with a solid, resilient supply chain and high delivery reliability, RPCG above all creates a context that makes successful entrepreneurship possible.
83 ACTIVITIES | Retail • Wholesale • Foodservice • Other activities • Group support activities
ENERGY NON-FOOD HEALTH & WELL-BEING FOOD
Spar Colruyt Group is the friendly neighbourhood supermarket for daily grocery shopping, offering a good range of fresh products, personal service and competitive prices. With their specific skills and product ranges, the independent retailers set their own accents in their stores. Spar provides inspiration through its free KOOK magazine and is well-known for its weekly 50% off Top Deals. Most stores are also open on Sunday (morning).
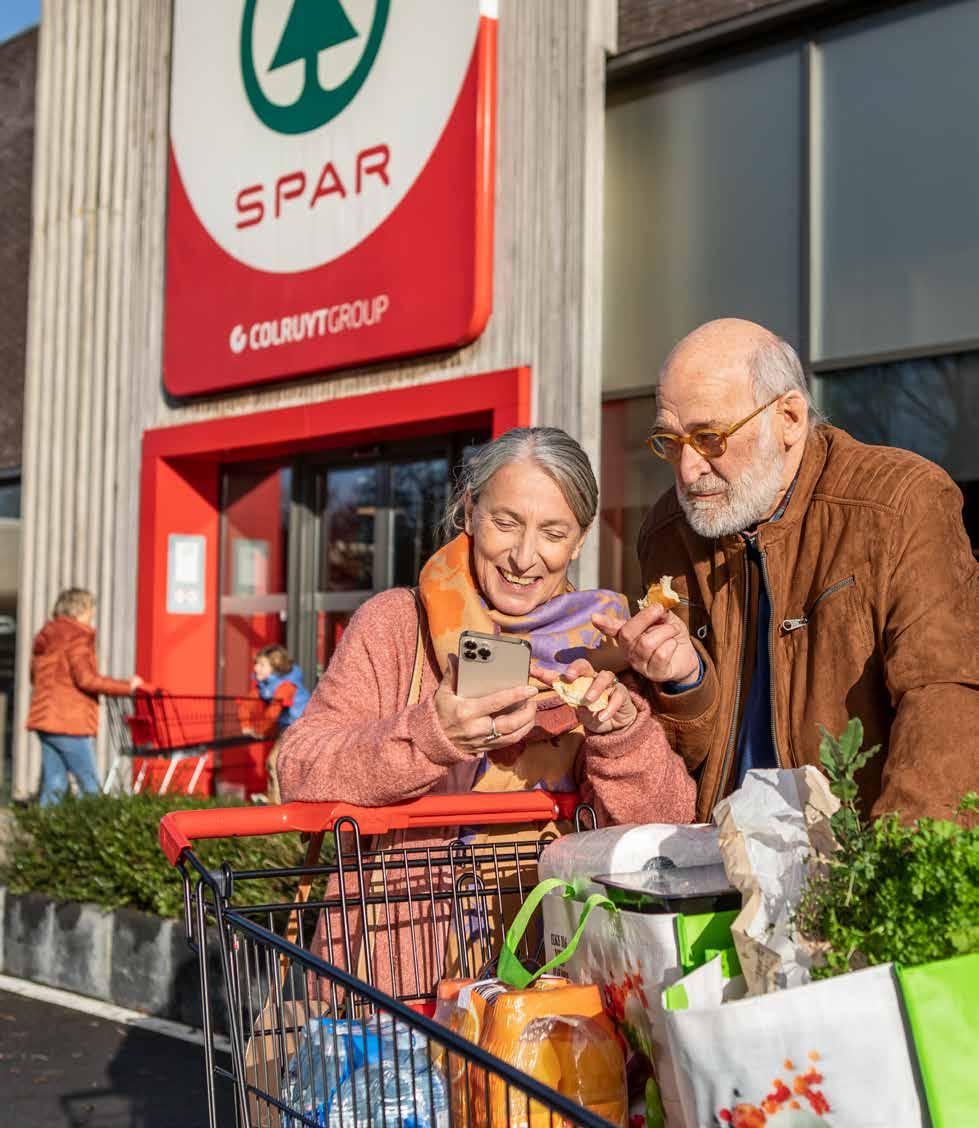
213 stores, of which 176 in the Spar Colruyt Group format
350-1.800 m² average store area
mijnspar.be
ACTIVITIES | Retail • Wholesale • Foodservice • Other activities • Group support activities ENERGY NON-FOOD HEALTH & WELL-BEING FOOD 84
Remodelling pays off
• Though remodelling requires considerable investment, retailers can count on sales and marketing support and a partial loan. Once at cruising speed, a new Spar Colruyt Group store performs noticeably better than the market.
• Remodelling also pays ample attention to energy efficiency. Through RPCG, entrepreneurs can obtain technical advice and energy audits and enjoy favourable conditions from contractors, installers and suppliers.
• During the past financial year 9 stores were fully remodelled and expanded, resulting in 64 stores in the Spar Colruyt Group outfit by the end of the financial year.
• 4 new stores
• 9 remodellings
• 3 closures
• 5 new stores and 12 remodellings in 2023/24
exemplaar
voor Spar
Prijs
Eetgoed,koopslim SOEP
NR FEBRUARI 2023
Great Deal
heerlijke
Sensing that customers are also attaching greater importance to strong promotions, Spar therefore relooked its fortnightly folder. The ‘Lekker veel voordeel’ (Great Deal) concept has been refreshed: the 1+1 offers are now at the front of the folder and the strongest promotions stand out more.
SCAN & ONTDEK
Weet hoewitlof geteeldwordt? Ontdekhetop www.mijnspar.be!
scheutje olijfolie tot een papje en strijk het vlees ermee in. Kruid met peper zout. 5. Leg het vlees op de uien, overgiet met mandarijnensap en strooi de koriandersteeltjes erbij. Dek de tajine af, breng aan kook en laat op een zacht vuur sudderen. Spoel het witlof, snij de lengte in verwijder de harde kern. Snij de breedte nog eens schik in de tajine. Bestrooi met rest van de hanout en Laat min verder garen. Werk af met korianderblaadjes, zeste van mandarijn serveer couscous.


In the monthly Kook magazine, inspiration always comes first. After a screening of recipients, circulation was reduced by a quarter.
Differentiating with fresh goods
Many Spar stores are known for their generous departments presenting all kinds of fruit and vegetables, deli dishes, meat, cheese and bread. These are pre-eminently spearhead categories with which entrepreneurs distinguish themselves in their environments and also achieve good margins. Bakeries equipped with their own dough proofers deliver superior quality bread. For launching and operating their bakeries, the entrepreneurs can count on advice from experts, often former bakers themselves. More and more entrepreneurs are using the central e-commerce platform, on which customers place orders for the year-end or BBQ season.
New: Spar For You unmanned sales format
Spar For You is a new, unmanned catering concept for the B2B market responding to contemporary needs like flexible working and on-the-go consumption. The concept allows companies, healthcare institutions, organisations, hotels or schools to achieve significant efficiency gains.
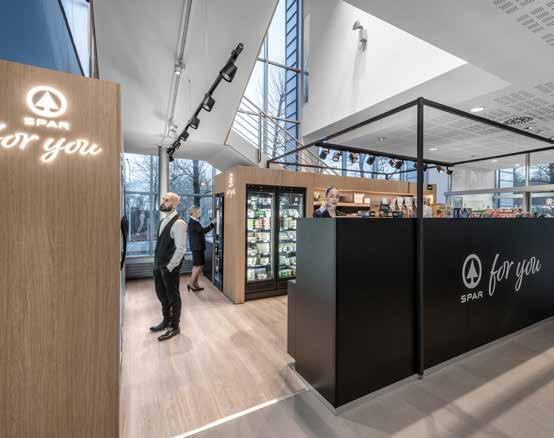
• Spar For You is available in various configurations, from one or more smart refrigerators, to a food corner with fresh coffee, to a minimarket. Employees, visitors and passers-by enjoy ease of use, contact-free payment and 24/7 availability.
• The service provides stocking, security and technology, which greatly relieves B2B clients. Clients also gain insight into the sales results and products offered, so as to make any necessary adjustments.
• Spar For You is a successful collaboration between Spar, our innovation hub Smart Technics, and our food service specialist Solucious, which takes care of the supply side.
• In 2022, test projects were undertaken, among others, for ISS and SN Brussels Airlines. In early 2023, a major project was introduced at UCB.
85 ACTIVITIES | Retail • Wholesale • Foodservice • Other activities • Group support activities
Tajine van kip en witlof geparfumeerd met mandarijn personen ippenkoteletten Spar grondwitlof m vers mandarijnensap leine uien een look gember kl Boni kaneelpoeder Boni ras-el-hanout osjes koriander zeste van andarijnen mespunt Boni saffraan Boni olijfolie Trek het vel van kippen koteletten. 2. Pel de uien en snij partjes. Verhit een scheut olijfolie de tajine en stoof de uien zacht. Kruid met peper en zout. Pluk de korianderblaadjes los en snij de steeltjes fijn. 4. Pel lookenpers.Schil gember en rasp fijn. Meng samen met de look, kaneel, saffraan, van de ras hanout en een
share!
PASSIONEEL PRODUCT Savooikool ENERGY NON-FOOD HEALTH & WELL-BEING FOOD
Let’s
Codifrance supplies more than 300 mini-markets affiliated to the Coccinelle, Coccimarket and Panier Sympa brands with dry goods, fresh produce and frozen food. The affiliated retailers also receive assistance with marketing, communication, defining product ranges, refurbishment and design of their points of sale. In addition, Codifrance supplies around 1.200 independent shops and wholesalers in more than 70 departments.
The mini-markets, found both in the city and the country, are primarily aimed at customers who come in daily. Codifrance offers the independent operators a wide assortment of products from national brands, private labels (Belle France) and discount brands. The operators enjoy a considerable measure of freedom in managing their stores.
2004: acquisition of Panier Sympa and licensee of Coccinelle and Coccimarket


302 affiliated stores: 20 Coccinelle, 94 Coccimarket and 188 Panier Sympa
Deliveries to more than 1.200 other independent retailers
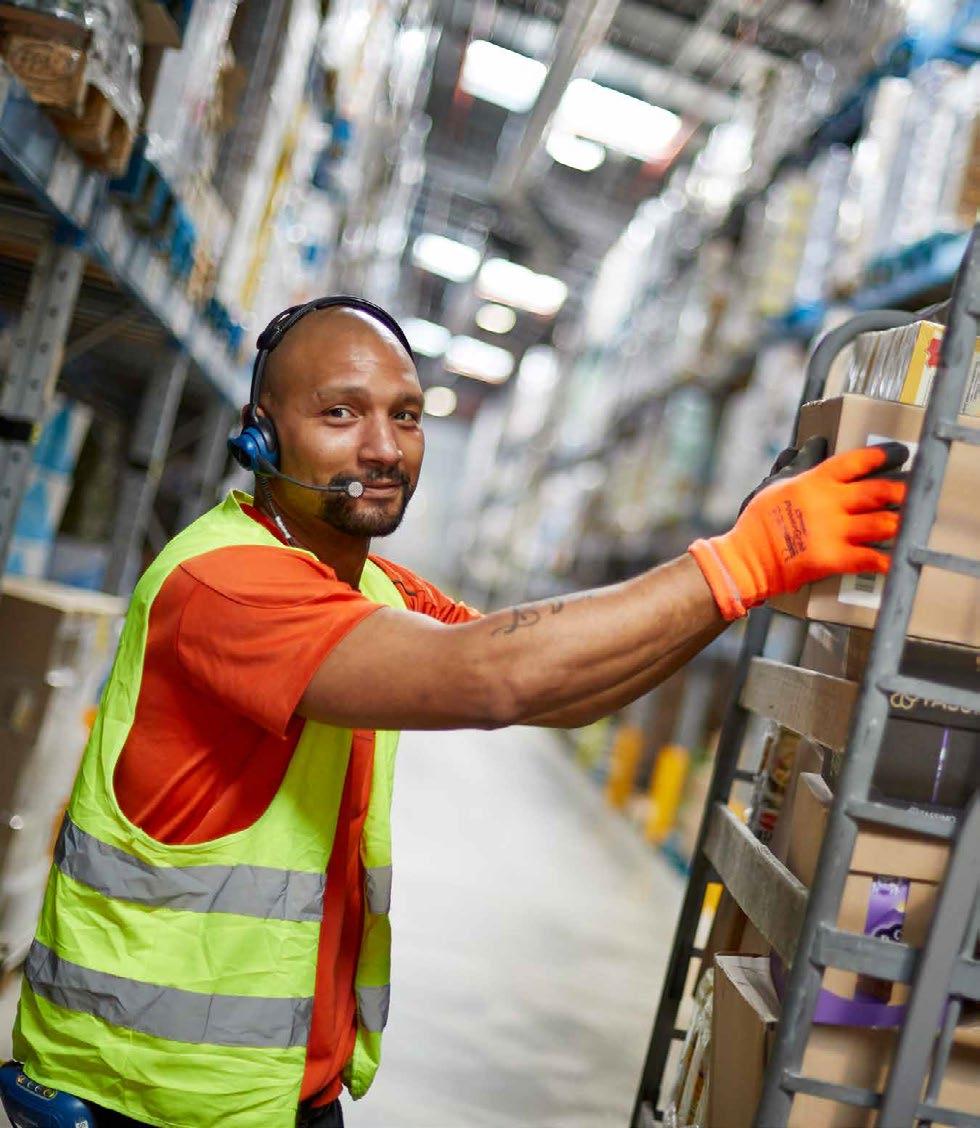
100-400 m² average store area
More than 8.000 items
Represented on three quarters of French territory
More than 200 employees in FTE
More than 50 years of experience in convenience stores codifrance.fr
ACTIVITIES | Retail • Wholesale • Foodservice • Other activities • Group support activities ENERGY NON-FOOD HEALTH & WELL-BEING FOOD 86
Slight revenue growth
Codifrance once again ended the financial year on a positive note, with good revenue growth. Ever since the often strongly restricted freedom of movement during the corona period, French consumers have remained remarkably loyal to the shops in their immediate vicinity. Even in a context of high inflation, local distribution channels have remained popular, with their diverse range of products and services as well as social contact.
The operating result improved, thanks in part to continued strict debtor monitoring. Codifrance was able to mitigate the impact of the strong inflation by continuing to control transport costs.
The new, high-performance ERP system will be fully delivered in October 2023. This will allow the organisation to improve its operational excellence, productivity and profitability even further.
Our French wholesale branch is a major player in the mini-market sector, which is an integral part of French consumers’ daily lives. Codifrance wants to further grow its retail network with quality shops run by passionate, enterprising operators.
Acquisition of Degrenne Distribution
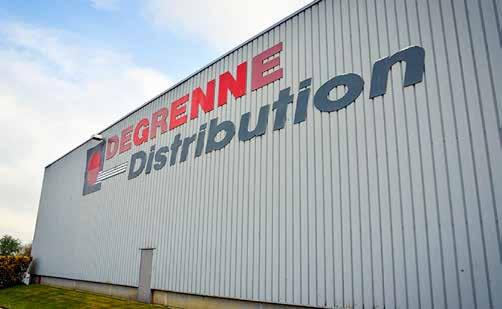
• Colruyt Group reached an agreement in principle in February 2023 to acquire 100% of the French group Degrenne Distribution. With an annual turnover of approximately EUR 110 million, Degrenne Distribution is an important regional player in the French neighbourhood store market.
• The family business operates in north-west France and in the Île-de-France region, where it supplies nearly 1.800 points of sale with dry, fresh and frozen products. Degrenne supplies, among other things, 521 affiliated neighbourhood stores under its own Episervice and Vivéco brands, as well as 47 Coccinelle stores and 183 Coccimarket stores.
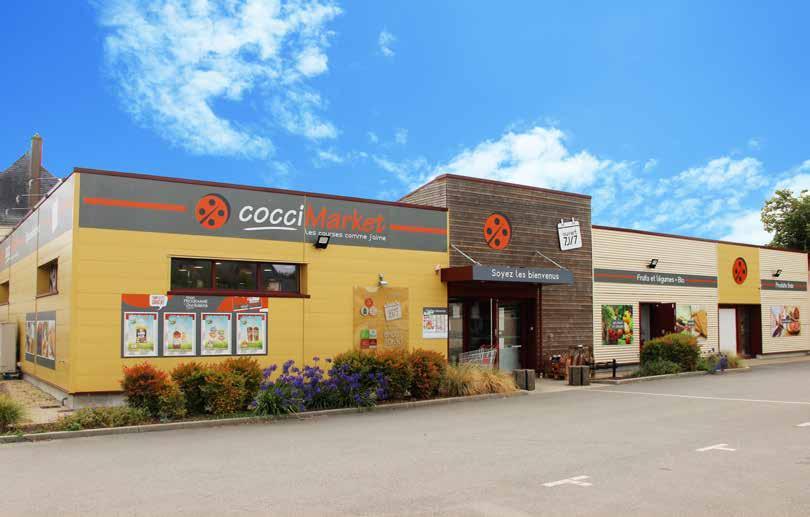
• Degrenne Distribution and Codifrance are perfectly complementary and will be able to create lots of synergies, starting in purchasing and logistics. The takeover offers potential for interesting developments in the French neighbourhood store market in the coming years.
• The transaction has been finalised at the beginning of July 2023 and integration into the consolidated figures of Colruyt Group is expected in the 2023/24 financial year.
87 ACTIVITIES | Retail • Wholesale • Foodservice • Other activities • Group support activities
ENERGY NON-FOOD HEALTH & WELL-BEING FOOD
Food service company Solucious supplies food products to professional customers throughout Belgium, primarily in social catering (schools, hospitals, care homes, etc.), the hospitality industry, and corporate catering. The range includes dry, fresh and frozen products, both in small and large packages, from national brands, the group’s own Culino and Econom food service brands for professional chefs and the group’s own retail brands Boni Selection and Everyday.
Solucious stands out for its ease-of-use, fair and consistent pricing with bulk discounts and constant reliability, about which it communicates transparently. The Culinoa department advises and supports care institutions in the operation of their industrial kitchens.
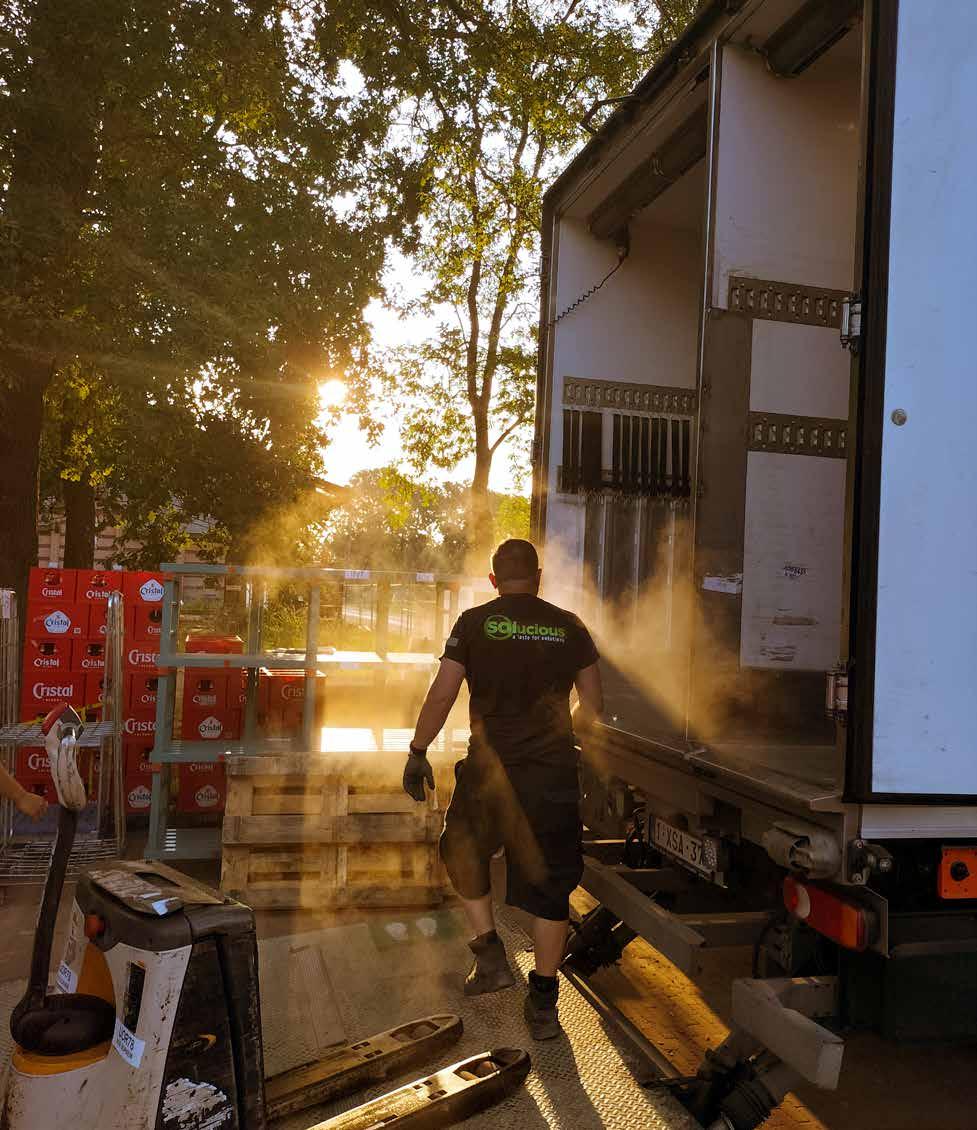
2013
EUR 217 million revenue (+40,8%)
29.000 customers
13.000 items, in food, fresh and frozen
More than 650 employees in FTE solucious.be
ACTIVITIES | Retail • Wholesale • Foodservice • Other activities • Group support activities ENERGY NON-FOOD HEALTH & WELL-BEING FOOD 88
Strong performance
• For the second consecutive year, Solucious achieved exceptional revenue growth, driven in part by inflation but to a greater extent by strong volume increases.
• In a stagnating food service market, the company was able to convince new customers, especially in the hospitality sector, including several larger catering chains. Social catering, the proportionally largest segment, grew slightly, thanks to good results from several large customers who had already chosen Solucious in the previous financial year. Company catering, on the other hand, still suffered somewhat from the widespread home-working. Culinoa, for its part, was able to add a small number of new care centres to its customer portfolio.
• Solucious kept its costs under control and continued to invest in future growth. The supply chain was strengthened with additional storage space and the recruitment of new employees. The company also continued to focus on digitising its internal business processes and on further expanding the e-commerce platform.
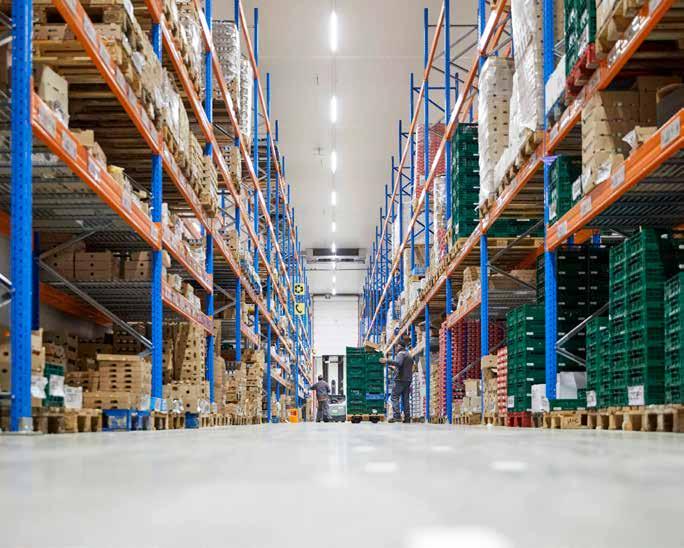
• On average, about 96% of the ordered items are available in stock. This enables Solucious to maintain a high level of delivery reliability, a key asset in the food service business.
Refrigerated storage space doubled
Solucious is serving more and more large customers with fresh products and is also keen to offer a wider choice of fresh foods. For this, the refrigerated warehouse in Bornem was expanded from 3.600 to 7.900 m², using space freed up with the departure of the Colex export service. The existing spaces were divided up and furnished differently, resulting in both more efficient, safer and more pleasant working conditions and increased delivery reliability.
• Cooling rooms at 12 °C for fruit and vegetables, 4 °C for dairy and meat.
• Picking of goods and transport to 5 regional hubs. Bornem itself also functions as a hub.
• Daily average of 28.000 picks or 900 orders.
• Sustainability: 640 solar panels and cooling with heat recovery that covers 80% of the heating needs in the offices.
More sustainable transport
• One in ten deliveries in central Ghent and Brussels already takes place by cargo bike. Bike delivery has also been available in Antwerp and Liège since August 2022. In March 2023, 700 deliveries in all were made, each representing an average value of 280 euros.
• Solucious expanded its transport network with a sixth hub close to Liège, which also includes three distribution centres. The hub model limits the number of kilometres delivery drivers travel. With Liège added, they save another 900 km every day.
• Commissioning of the first two of five electric trucks These refrigerated vehicles with a driving range of 300 km are being tested primarily for city distribution.
• Test conversion of twowalled roll containers to four-walled, closed models, eliminating the need for wrapping film. A full rollout would save more than 700 km of foil annually.
89 ACTIVITIES | Retail • Wholesale • Foodservice • Other activities • Group support activities
ENERGY NON-FOOD HEALTH & WELL-BEING FOOD
Even more customer convenience through internal synergy
By joining forces with partners within the group, Solucious creates solutions that respond to the constantly evolving needs of professional customers.
Catering customers in Brussels can now also pick up their online orders at the Colruyt Professionals cash&carry at Meiser. This way they save on delivery costs and they can choose from a wide product range for the catering industry.
Development of specific ranges for Spar For You unmanned company canteen concepts. Supply of balanced food and drinks to the smart refrigerators in the Jims fitness clubs.
Easier access to the job market
Solucious was awarded ‘Inclusive Business 2022’ by workplace architect JES vzw, for the way it gives opportunities to people who find it more difficult to enter the labour market. This involves attention to diversity in recruitment and initiatives such as workplace learning, job and language coaching. Successful job days for young people were also organised together with JES and Future@Work.
Logistics partner of Week van de Zorg (Care Week)
In May 2022, Solucious delivered 3.000 gift boxes to employees of Flemish care and welfare institutions. These opened their doors to the general public during Care Week, making a festive moment of every handover.
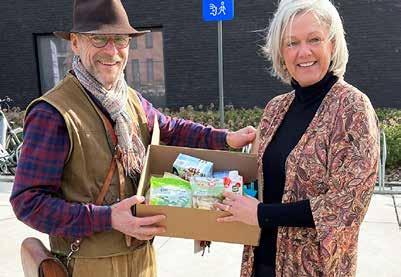
The company Culinoa, acquired in April 2021, assists healthcare institutions with running their industrial kitchens. In this way, chefs can focus on preparing tasty, healthy and high-quality meals at a controlled food cost.
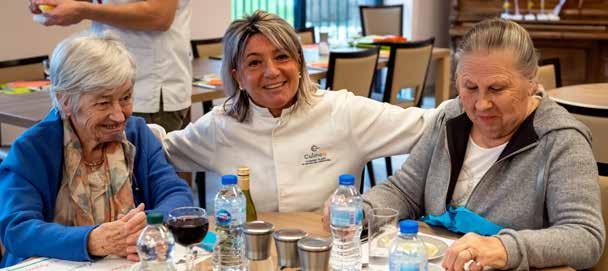

• Last financial year, a wide range of services was defined. Customers and prospects can contact Culinoa for audits and advice on, among other things, menu and nutrition plans, personnel management, sustainability, hygiene, optimising kitchen processes and controlling food costs. The new Culinoa Academy provides training on these themes at Colruyt Group Academy locations.
• Care institutions remain the main target group, but Culinoa is also gradually turning its attention to accommodation centres for persons with disabilities. It is also preparing to take the step towards Flanders, where it is looking to achieve solid growth in the coming years. For this, bilingualism has been introduced in the sales team, the contact centre and the communication channels.
• The in-house sales team will be integrated into that of Solucious, giving customers a single contact person for all services, from simple delivery to assistance with kitchen processes.
ACTIVITIES | Retail • Wholesale • Foodservice • Other activities • Group support activities
ENERGY NON-FOOD HEALTH & WELL-BEING FOOD 90
DATS 24 offers all common and alternative energy sources in Belgium: petrol, diesel, AdBlue and also natural gas (CNG), electricity and hydrogen. Colruyt Group’s fuel specialist and energy supplier is working towards greener mobility. It continues to invest in the expansion of its network, with a focus on electric charging infrastructure and public hydrogen stations. DATS 24 informs and inspires individuals and companies about how to achieve more sustainable mobility via workshops, talks and webinars. It holds ISO 14001 certification for the ecological management of its stations.
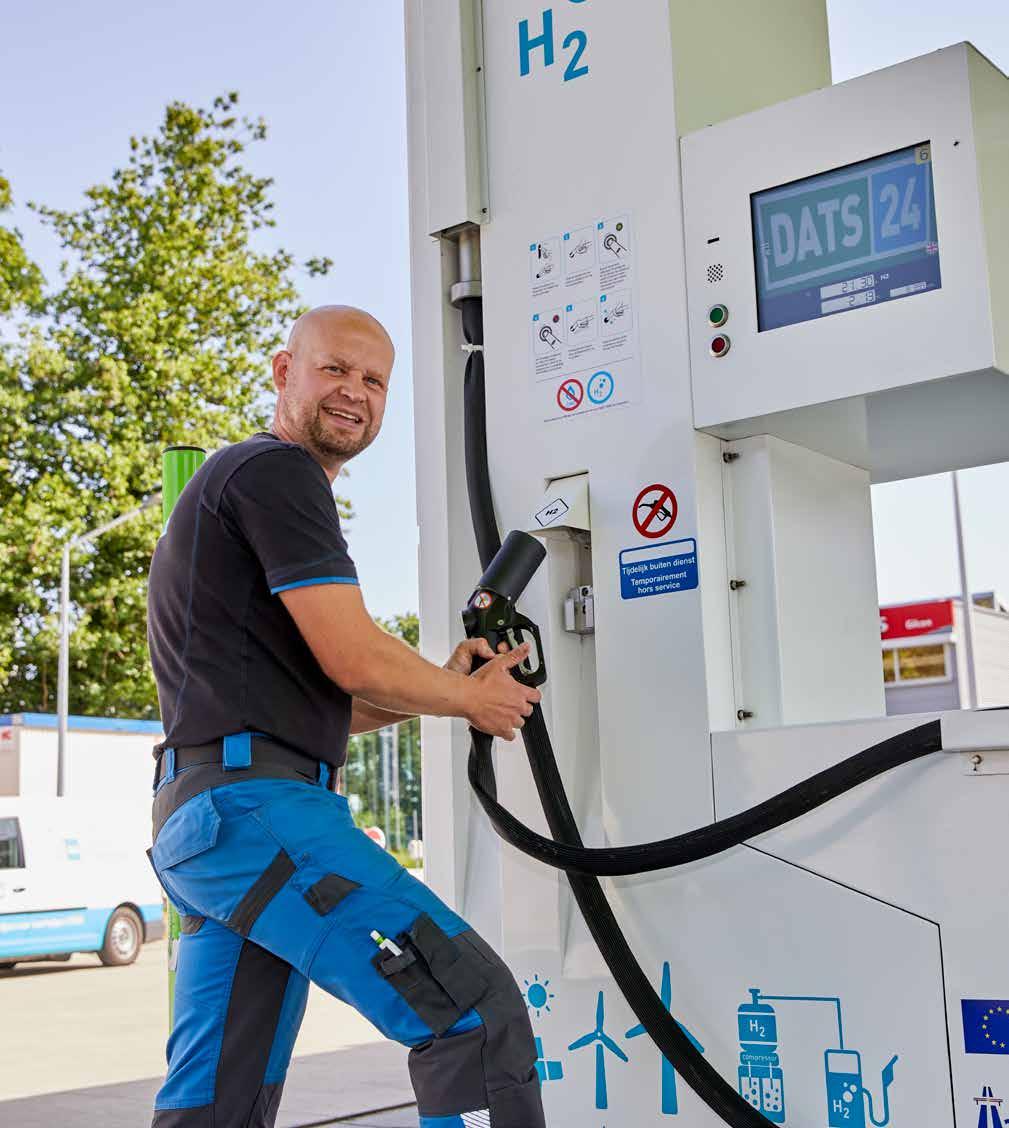
DATS 24 played a pioneering role over 50 years ago as a Discount Automatic Tanking Service with the first unmanned 24/24 filling stations.
1972
EUR 886 million revenue (+11,0%)
145 filling stations, of which 92 with CNG
208 store sites with charging stations
More than 70 employees in FTE
Energy at home, at work and on the road dats24.be
91
ACTIVITIES | Retail • Wholesale • Foodservice • Other activities • Group support activities ENERGY NON-FOOD HEALTH & WELL-BEING FOOD
Exceptional volatility
• DATS 24 experienced an exceptional financial year in all respects, in a highly volatile fuel market. Revenue rose in parallel with inflation throughout the financial year. The increase came from sales of traditional fuels, while the CNG volumes fell by more than a quarter, as customers switched to conventional fuels given the continued exceptionally high natural gas prices. Total sales volume decreased slightly, also in line with the contraction in the market.
• The customer count remained more or less stable, while the volume per refuelling dropped slightly. The latter was probably due to sharper customer price awareness and stricter budgeting, to the continuation of teleworking and the increasing proportion of hybrid cars that tank up in smaller volumes.
• Margins remained at the same level, although the market system caused DATS 24 to sell almost at a loss for a while, given the delay in official maximum prices catching up with ever-increasing purchase prices. Subsequently, all fuel brands started to apply the maximum prices, which largely halted the competitive promotions and boosted margins.
• DATS 24 accelerated the introduction of pumps with AdBlue, an additive that significantly reduces NOx emissions from diesel engines. At the end of the financial year, the product was available at 85 service stations while revenues more than doubled.
Focus on electric mobility
First charging stations for external customers
On the B2B market, DATS 24 focuses primarily on companies linked to Colruyt Group. At the end of the financial year, for example, (rapid) charging stations had already been installed at seven independent Spar stores. The retailers purchase the charging stations and receive a portion of the proceeds. The charging stations have a wide prospective customer base, accepting numerous charging cards and usually also accessible outside the stores’ opening hours.
Charging stations at 230 locations
• DATS 24 invested further in expanding its charging network, both at Colruyt Group stores and offices and at external customers. Green electricity was available at the end of the financial year to 735 charging points at 230 locations, including 13 points where customers can charge at a capacity of up to 60 kW. More than a third of the Colruyt, Okay, Bio-Planet, Dreamland and Dreambaby stores already have one or more charging stations, so that customers can easily combine shopping and charging.
The cooperation is a win-win. The external customer can count on the craftsmanship and reliability of DATS 24, from the choice of charger type to installation to inspection and aftercare. On the other hand, our energy specialist can make sustainable mobility more accessible, at home, on the road and at work.
Bundled expertise
• 4 new filling stations
• 2 extra CNG refuelling points
• 270 additional charging points
• Charging plazas are gradually being built at a number of selected store car parks, where up to ten users can charge at any one time. There, DATS 24 will also be responding to the growing demand for rapid charging, with three 150 KW rapid chargers in combination with two regular 22 KW chargers.
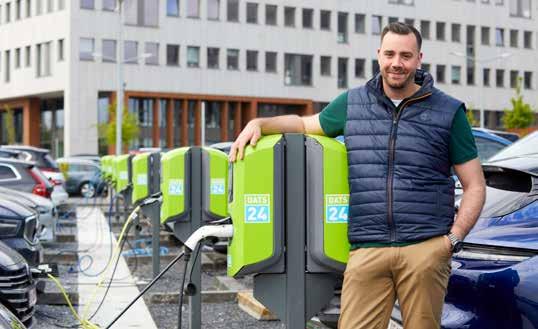
• In the past financial year, consumption in kWh at DATS 24 charging stations more than doubled, partly due to the expansion of the network, partly due to the growing share of electrically powered cars.
• The DATS 24 charge card gives subscribers access to more than 23.000 Belgian and 222.000 international charging stations.
In just a few years, DATS 24 has built up a great fund of expertise in the installation and operation of charging infrastructure at Colruyt Group stores, companies and employees at home. To further accelerate the expansion, our energy specialist has teamed up with Antwerp charging station company Pluginvest, which will take care of installing and maintaining the network. With an investment of EUR 4 million, Colruyt Group acquired a 25% participation in Pluginvest in mid-May 2022.
ACTIVITIES | Retail • Wholesale • Foodservice • Other activities • Group support activities
ENERGY NON-FOOD HEALTH & WELL-BEING FOOD 92
Energy for home and work
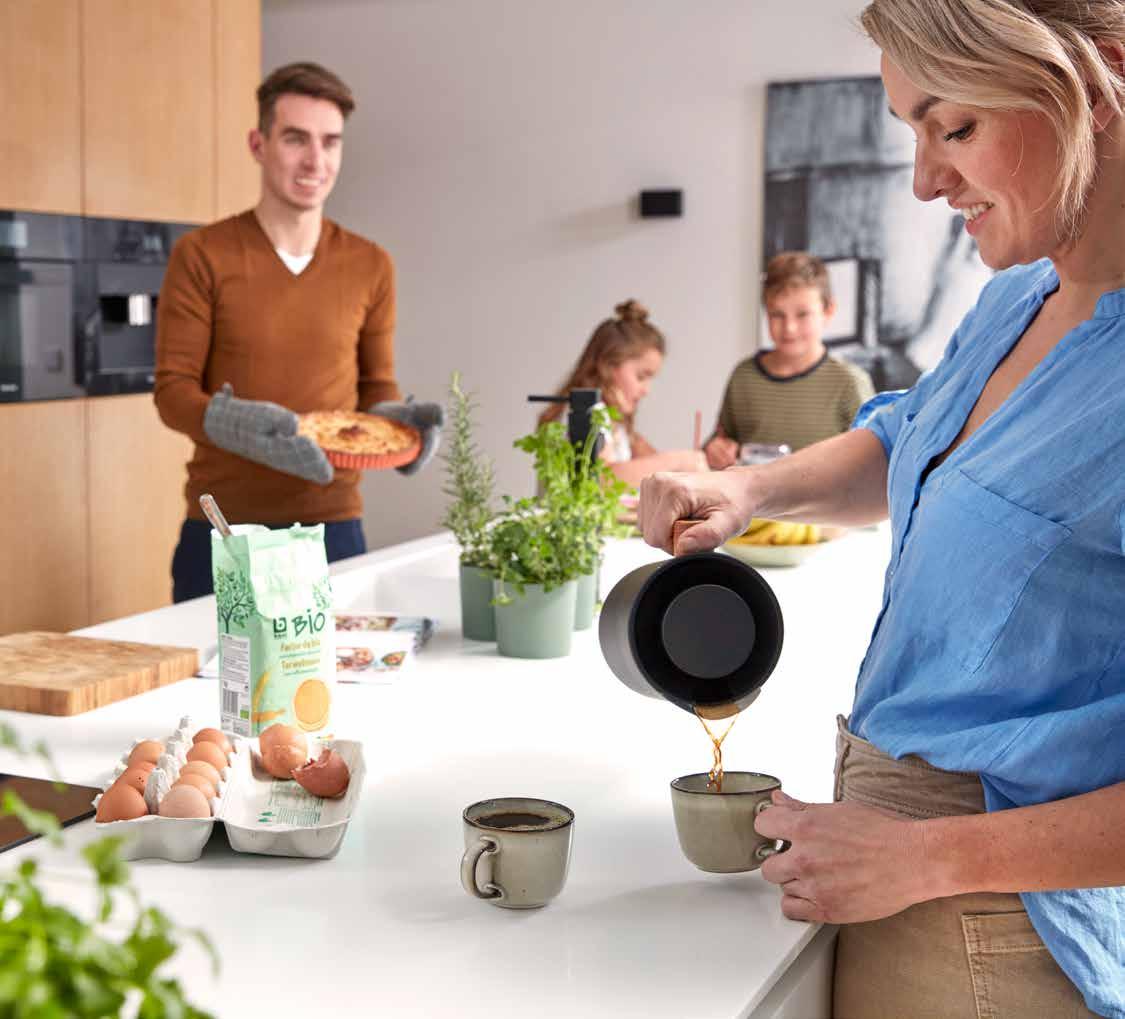
For two years, DATS 24 has been actively supplying 100% green electricity and natural gas to private individuals and companies. With no significant investment in marketing and customer acquisition, fifteen thousand families have already found their way to the energy supplier. They appreciate the clear and transparent offer, the accessibility of the service and the attractive prices. DATS 24 usually performs well in the price simulations performed by the official energy watchdogs. In terms of B2B activities, DATS 24 focuses on services to partners within the group.
CNG: waiting for European regulations
• With continuously increasing prices on the international energy market, CNG prices also continued to rise throughout the first half of the financial year, reaching a historic high in August 2022. Prices started falling from September onwards, stabilising at the end of the financial year at still double the historical price of under 1 euro. This inflation brought the number of new CNG car registrations to a standstill.
• As planned, DATS 24 opened two more CNG stations in the course of the financial year. It still sees potential in its natural gas network, because it is perfect for injecting (renewable) biogas. This results in a more sustainable mixture that does not require any adjustment to current CNG vehicles. DATS 24 is therefore looking forward to a European regulatory framework for the use of biofuels, possibly inspired by the certificate systems in the Netherlands and Germany.
93
ACTIVITIES | Retail • Wholesale • Foodservice • Other activities • Group support activities
ENERGY NON-FOOD HEALTH & WELL-BEING FOOD
Hydrogen as a sustainable fuel
DATS 24 remains a forerunner in the commercialisation of hydrogen as a sustainable road vehicle fuel. Electric driving on hydrogen offers certain unique advantages: fast refuelling, no CO₂, soot or particulate emissions while driving and a guaranteed electric range of 650 to 700 km, without winter impact.
DATS 24 is convinced that driving on hydrogen will become complementary to battery-electric driving, and estimates that one in five electric cars will be equipped with an H2 fuel cell. Hydrogen can be interesting in places with cold climates and insufficient electric charging infrastructure, as well as for drivers unable to install their own charging stations, who pull heavy loads or drive many kilometres and need to be able to refuel quickly.
• New hydrogen stations opened in Wilrijk and Haasrode, bringing the total to three. Together these stations sold 10 tons of hydrogen. The Wilrijk station serves, among others, the city of Antwerp’s hydrogenfuelled refuse trucks. The public hydrogen filling station in Haasrode came into being partly thanks to the support of the H2Benelux programme. More openings will follow in the course of 2023 in Ollignies, Herve and Erpe-Mere.

• Together with hydrogen pioneers like Toyota, Hyundai and ALD Automotive, DATS 24 is helping companies take the step towards hydrogen mobility, for example through interesting leasing formulas and workshops with test drives.
Advertising at petrol stations
The filling stations are gradually being used more for onsite media selling, via screens on the pumps and printed posters in all 145 stations. In addition, about thirty stations are equipped with large digital screens, operated in collaboration with Clear Channel Belgium. DATS 24 screens its own quality or sustainability messages, but also campaigns from internal partners like Newpharma, as well as messages from external advertisers.
New payment terminals
By the end of the financial year, all petrol stations were equipped with new payment terminals that excel in ease of use: well-lit, clearly legible, suitable for all cards and contactless payment. The 400 metre paper roll does not need to be replaced as quickly and terminal operation can be perfectly remote-monitored.
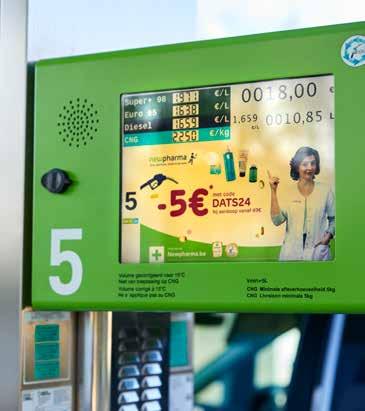
Saving energy
DATS 24 customers can count on lots of tips & tricks to save fuel and energy, both at home and on the road. In addition to the frequent newsletters, two highly appreciated workshops, ‘Greener on the road’ and ‘Save energy’, are available through the Colruyt Group Academy. The online brandstofwijzer.be tool is also doing well.
Integration into Virya Energy
In October 2022, Colruyt Group announced its intention to integrate the DATS 24 activities in Belgium into the energy holding company Virya Energy, of which the group is the majority shareholder. On 1 June 2023, the integration became a fact.
The joining of forces is necessary in order to remain relevant in a rapidly changing energy market. Working within a broader energy ecosystem gives DATS 24 more options, flexibility, speed and focus to successfully realise its ambitions and plans: to become a leading provider in the field of electrification and the transition towards renewable energy.
The integration of all energy expertise right across the value chain creates great added value and synergy, given that DATS 24 and Virya Energy complement each other along the entire energy value chain, from development, financing, construction, operation and maintenance to delivery and service offerings.
DATS 24 will continue to exist as a brand and will continue to operate its petrol stations and charging station network, with hardly anything changing for the end customers.
The company will also continue to contribute to the realisation of Colruyt Group’s strategic objectives.
ACTIVITIES | Retail • Wholesale • Foodservice • Other activities • Group support activities ENERGY NON-FOOD HEALTH & WELL-BEING FOOD 94
Energy holding company Virya Energy is active in the development, financing, construction, operation and maintenance of renewable energy production facilities, with a particular focus on offshore and onshore wind energy.
Virya Energy was established at the end of 2019 by Colruyt Group and its majority shareholder Korys. The holding company invests in companies focusing on the production of green electricity from wind and hydroelectric sources and on the development of plants for the production and storage of green hydrogen. The umbrella holding company facilitates the sharing of knowledge and technology between the companies and invests heavily in support services, research & development.
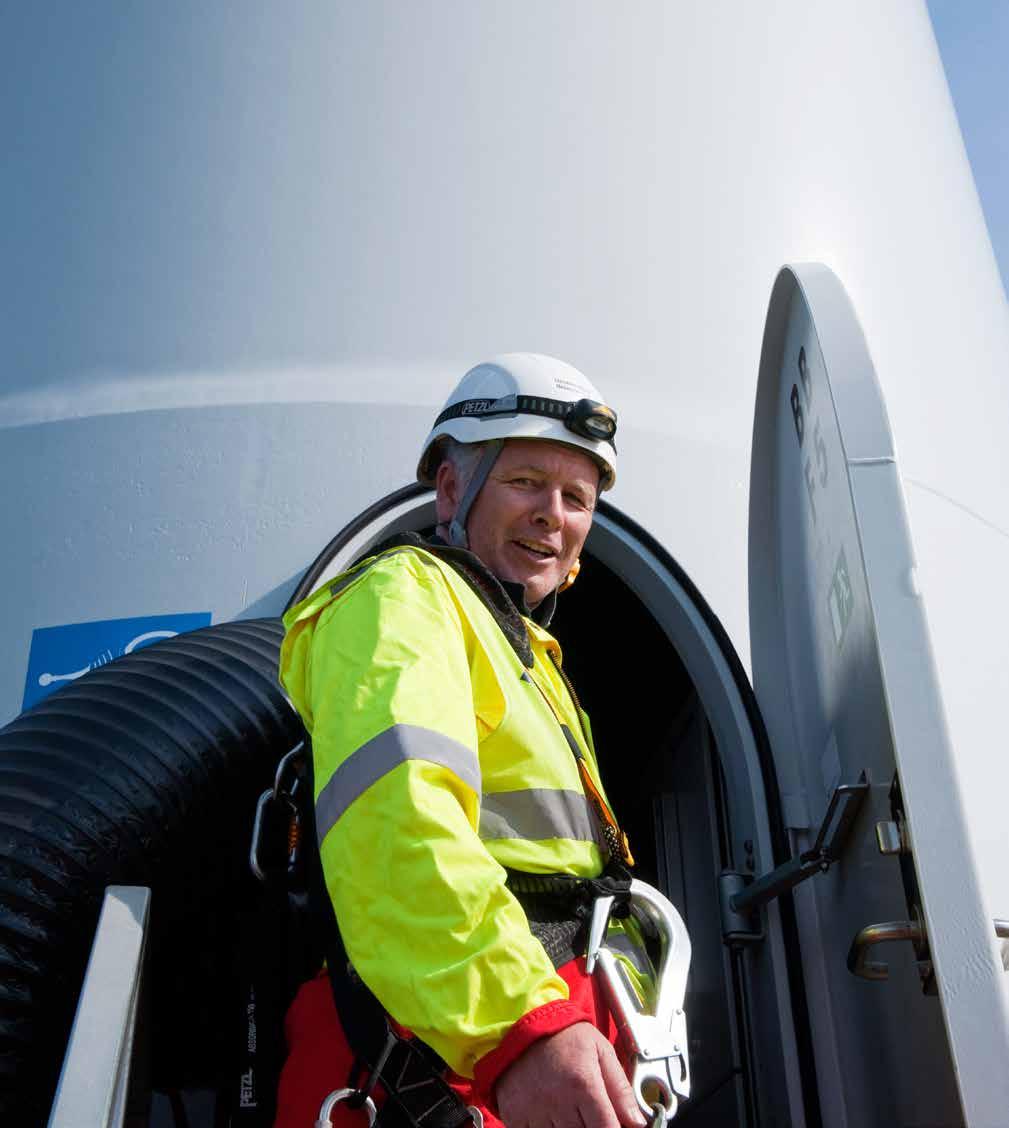
1.548 GWh of green energy
In 2022, Virya Energy produced more than 1.548 GWh of green energy, equivalent to the annual consumption of over 440.000 families.
2019: established by Colruyt Group and Korys
Stake: 59,94%
95
ACTIVITIES | Retail • Wholesale • Foodservice • Other activities • Group support activities
ENERGY NON-FOOD HEALTH & WELL-BEING FOOD
Belgian company Parkwind is active in the production of offshore wind energy, in various countries. It develops activities throughout the entire value chain and collaborates with universities and government institutions in various research programmes.
Offshore wind farms in Belgium
Parkwind participates in four operational wind farms located in the North Sea off the Belgian coast. In 2022, these wind farms together produced 2.127 GWh of green electricity, or the equivalent of the annual consumption of 607.000 households, making Parkwind one of the largest electricity producers in Belgium. The company also plans to participate in tenders for the construction of wind farms in the Princess Elisabeth zone off the Belgian coast in 2024.
• Weak winds, both offshore and onshore, made 2022 a poor wind year, one of the worst ever in Northern Europea.
• This weak wind harvest was offset to a small extent by historically higher energy prices, as a result of the international energy crisis. Price increases could, however, be realised only on a limited part of the energy production, as sales prices are usually fixed in long-term contracts.
• General inflation pushed up operating costs in the course of 2022.
• With an average of over 95%, installation availability once again remained at a high level. Operational continuity was also ensured throughout the year.
Virya Energy actively contributes to a more sustainable energy supply and a better environment, as well as to greater energy independence. The holding company is also responsible for the energy supply and has been helping to build a sustainable energy industry in Belgium and Europe for many years now.
Partly because of this, Belgium’s offshore wind industry has grown into an important, internationally renowned economic sector. Virya Energy is committed to consolidating and further strengthening the accumulated European expertise.
Virya Energy advocates a fair and transparent system that correctly taxes only real excess profits. Unfortunately, these conditions were in our opinion not met with possible additional taxes on the so-called excess profits made in 2022 by energy producers. Virya Energy does want to continue to think constructively with the government about ways to finance energy support measures, without harming the entire renewable energy industry and undermining the investment climate.
ACTIVITIES | Retail • Wholesale • Foodservice • Other activities • Group support activities
Wind farms in Belgium Parkwind stake Capacity Production 2022 Belwind (2010) 78,5% 171 MW 423 GWh Northwind (2014) 30% 216 MW 506 GWh Nobelwind (2017) 41% 165 MW 599 GWh Northwester 2 (2020) 70% 219 MW 599 GWh TOTAL 771 MW 2.127 GWh
ENERGY NON-FOOD HEALTH & WELL-BEING FOOD 96
Offshore wind farms abroad
Parkwind continues to develop international wind projects, with a focus on Europe, but also in Australia and New Zealand.
Arcadis Ost I. As planned, the wind farm in the German part of the Baltic Sea started producing power in the spring of 2023 with a limited number of turbines. The project went well, but was delayed by postponed deliveries of parts. With, among other things, the conclusion of new agreements with suppliers and banks, the park will be fully operational as planned by the end of 2023.
27 turbines with a combined capacity of 256 MW will be able to provide up to 290.000 German families with green electricity.
Oriel. Parkwind and Irish electricity company ESB obtained the necessary permits to participate in May 2023 in the call for tenders for the future wind farm in the Irish Sea. If they win the contract, the first steps could follow from autumn 2023 to develop a wind farm with 375 MW installed capacity.
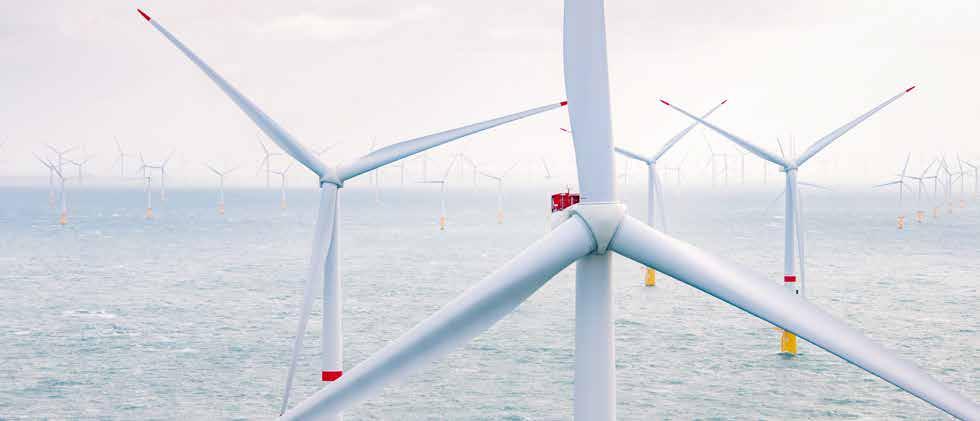
Both partners are working together on a future Irish wind farm Clogherhead
Norway. Together with two local partners, Parkwind is preparing to participate in tenders for two offshore wind farms in Norwegian waters in 2023.
Greece. Parkwind has contracted with local conglomerate Intrakat to compete in a tender for a 300 MW onshore wind farm.
JERA Green acquires Parkwind
In March 2023, Virya Energy reached an agreement with JERA Green, a subsidiary of Japanese global energy player JERA, to acquire 100% of the shares in Parkwind. The transaction is expected to close later this year. This will be an important milestone for the further development of Parkwind as a leading international energy player.
• JERA is Japan’s largest energy company, operating in 18 countries and across the entire energy chain.
• JERA will support Parkwind’s further expansion plans. The company will be able to expand its offshore wind activities more quickly in markets where JERA is already active or well positioned. At the same time, JERA intends to continue to invest in Belgium and in so doing expand Parkwind’s team and worldwide presence from the team base in Leuven.
In mid-2022, Colruyt Group had already communicated that Virya Energy would be examining strategic development options, including a full or partial divestment of its 100% stake in Parkwind. The offshore industry has gained strong momentum in recent years. The global offshore energy market has become even more competitive and new projects continue to grow substantially in size, entailing higher financial risks for investors. The acquisition by JERA offers Parkwind every opportunity to continue to play a prominent role in the international offshore industry.
Virya Energy for its part, is keen to further invest in other technologies like solar energy and hydrogen in addition to onshore wind energy and to expand its activities and locations.
97 ACTIVITIES | Retail • Wholesale • Foodservice • Other activities • Group support activities
ENERGY NON-FOOD HEALTH & WELL-BEING FOOD
Onshore renewable energy
In line with its ambition to pursue an even more sustainable impact, Virya is consolidating and further expanding its internal know-how and competences. For this reason, the Eurowatt and Eoly Energy teams are cooperating more and more closely in onshore wind and solar energy.
Eoly Energy operates in the Belgian energy market, managing 21 onshore wind turbines, 3 of which are owned by Eoly Cooperative. The company is also working on developing a further 19 new onshore turbines in Belgium. Several research programmes are running for the production and application of green hydrogen.
In 2022, Eoly Energy produced 71 GWh of green electricity, the equivalent of the annual consumption of 20.000 households. The significantly lower than expected results were due to frequent low wind speeds. Availability was 94,47%, lower than usual, but caused by technical issues that were subsequently resolved by the suppliers. In January 2023, availability climbed back to 96,57%.
• Affligem. Environmental permit application for 2 wind turbines along the E40 highway, together with power producer and supplier ENGIE. Local residents can co-invest through their CoGreen cooperative.
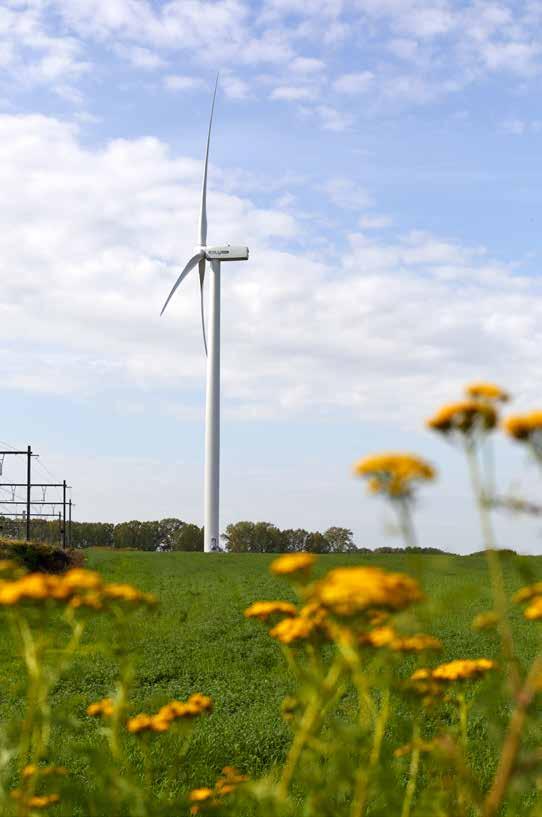
• Application submitted for an extension of the existing wind farm on the Dassenveld site in Halle.
Eurowatt produces onshore wind energy and smallscale hydropower. The company has 34 operational wind farms in France, Portugal and Poland and 3 hydroelectric power stations in Spain and Portugal, with a total installed capacity of approximately 400 MW. In 2022, all sites together produced 840 GWh of electricity, the equivalent of the annual consumption of 240.000 households.
Eurowatt is focused on expansion with the development and construction of new wind farms and solar parks in France and Poland, where plenty of potential remains for developing renewable energy.
In Greece, the Virya group obtained the permit to start developing an approx. 250 MW wind farm.
Eurowatt is studying various formulas to allow citizens to participate in wind and solar projects in the geographical zones where it operates.
Sanchore
The Indian Sanchore wind farm has 20 turbines with a total capacity of 40 MW and has been operational since 2018. In 2022, the wind farm produced 94,5 GWh of green electricity, in line with previous years. Following a debt refinancing, Sanchore again has sufficient own resources.
ACTIVITIES | Retail • Wholesale • Foodservice • Other activities • Group support activities
ENERGY NON-FOOD HEALTH & WELL-BEING FOOD 98
Virya Services
The Virya Services branch combines a wide range of support services to energy-producing companies, with which Virya Energy covers a larger part of the offshore value chain. In 2021, participations were taken in three Belgian companies, while the first full working year 2022 focused on supporting the entities in Virya Energy. In 2023, Virya Services wants to focus more on international expansion and on also offering maintenance, repair and safety services to wind farms beyond the development phase.
60% stake in GeoXYZ, specialising mainly in subsea soil investigation and monitoring.
37% stake in Fluves/Marlinks, specialising in systems for permanent monitoring of pipelines, industrial installations and submarine power cables.
86% stake in dotOcean, which develops advanced location software and control systems for, among other things, self-navigation of vessels and vehicles.
Betting on green hydrogen
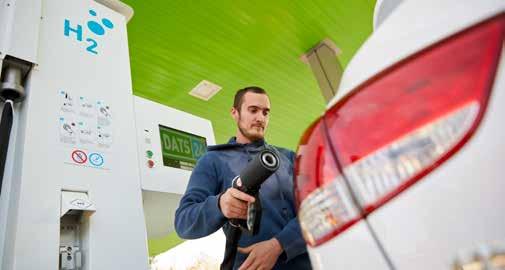
Virya Energy continues to invest in developing projects for producing sustainable hydrogen from renewable electricity. The company believes in the potential of hydrogen, in the first instance as a sustainable fuel for heavy transport and buses and for industrial applications. Secondly, hydrogen can also serve as a balancing agent for the electricity network and can be injected as green gas into the natural gas network and the future hydrogen network. Virya Energy is convinced that (green) hydrogen will in any event have to be part of the future energy mix and of the broader energy transition. It is therefore looking forward to a European regulatory framework.
• Virya Energy is involved in many (pilot) projects involving green hydrogen, for instance to power buses, riverboats and ships. In Brussels, a one-year pilot project was started together with Taxis Verts with the first green hydrogen taxi.
Citizen participation
• In the Netherlands and Germany too, Virya Energy is involved in industrial projects to combine the production of green electricity with that of green hydrogen. The projects at Terneuzen and Vlissingen are eligible for Dutch government subsidies.

• Virya is also leading the development of a large-scale hydrogen plant in Zeebrugge.
Eoly Coöperatie enables private individuals to invest in onshore wind turbines built by Eoly Energy. Local residents and Colruyt Group employees are given preference in subscribing to new capital rounds. The May 2022 round to raise 2,75 million euros for a third turbine was closed within a few weeks, just like the previous one.
The June 2022 general meeting approved an attractive gross dividend of EUR 13,75 per share, equal to a 5,5% gross annual return, for the 2021 financial year.
The North Sea Wind cooperation, set up in 2018 by Parkwind, Colruyt Group and Korys Investments, offered the general public the opportunity to co-invest in loans to the offshore wind industry.
The June 2022 general meeting approved a dividend of EUR 0,45 per share, equal to a 3,9% gross annual return, for the 2021 financial year.
North Sea Wind’s pioneering role and the experience with the Eoly Cooperative participation model can benefit Parkwind’s future offshore projects. Public participation is expected to become a key criterion for being permitted to tender for building new wind farms.
99 ACTIVITIES | Retail • Wholesale • Foodservice • Other activities • Group support activities
ENERGY NON-FOOD HEALTH & WELL-BEING FOOD
Symeta Hybrid is Belgium’s leading specialist in personalised marketing communications and administrative document flows such as invoices and payroll. Featuring state-of-the-art printing technology and a high-performance information management platform, the company guarantees the highest possible level of security for confidential data such as personal data. Flexible all-in-one solutions result in efficiency for companies, as well as user-friendliness and freedom of choice for end customers.
Symeta Hybrid serves both internal and external clients (1) in such diverse sectors as HR, finance, healthcare, utilities, telecoms, government and industry.
The company has all relevant ISO certifications: 14001 (environment), 9001 (production) and 27001 (information security).
(1) External sales are listed under ‘Other activities’
2020: merger of Symeta and Joos Hybrid
More than 400 employees in FTE symeta-hybrid.com
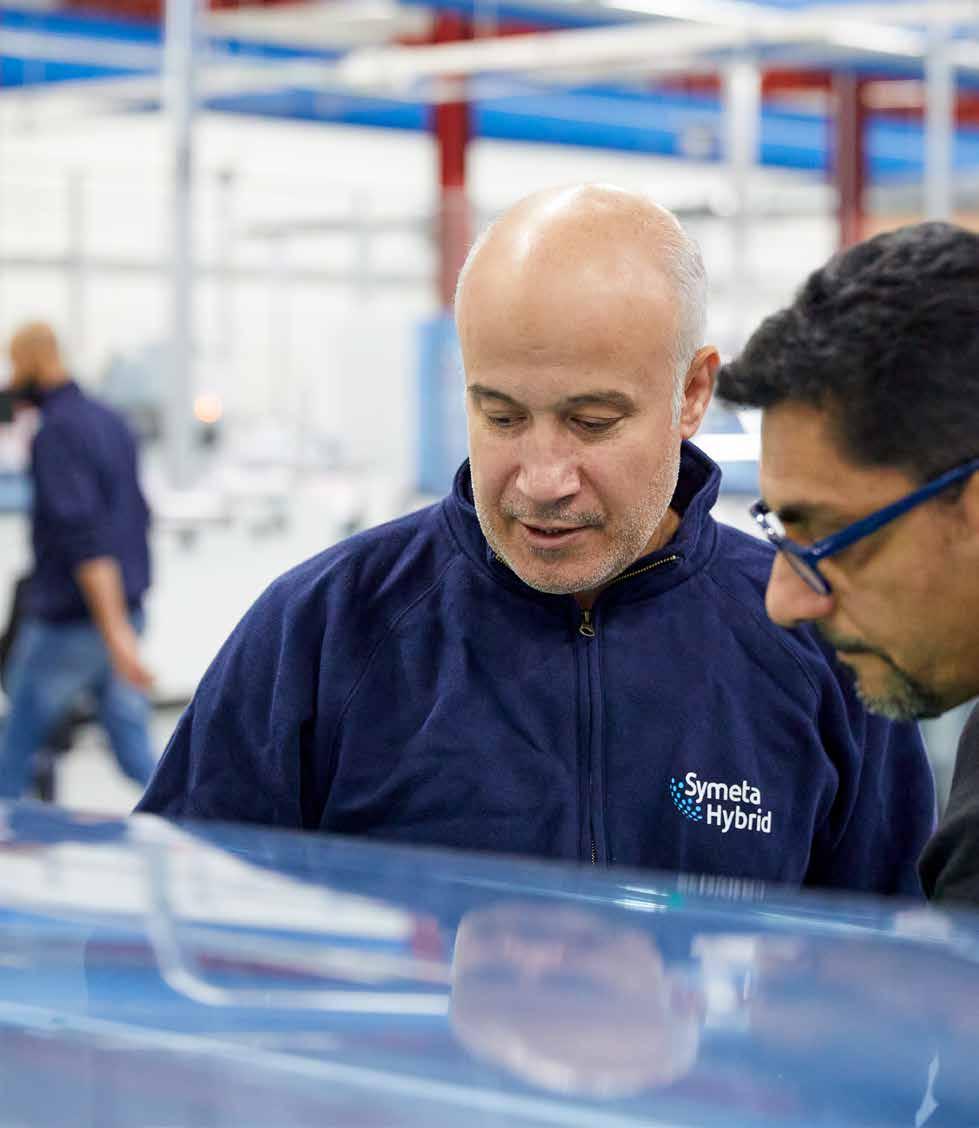
ACTIVITIES | Retail • Wholesale • Foodservice • Other activities • Group support activities 100
Orchestrator
Symeta Hybrid combines physical and digital document flows and is increasingly positioning itself as an orchestrator that also integrates external platforms and tools such as Doccle and ItsMe into communication. For digital invoicing, it is looking at possible collaborations with the Belgian specialist Digiteal, in which Colruyt Group has a stake. The company therefore continues to invest in a secure and agile IT environment that allows for the development of new data-driven services.
Less paper, more value
In a highly competitive market, Symeta Hybrid produced attractive volumes of printed matter for partners in Colruyt Group and for external clients. Owing in part to the strong price increases for paper and energy, demand for printed matter fell noticeably.
Symeta Hybrid continues to create lots of value thanks to its lead in personalised printing. For example, it leads the way in producing paper wrappers for leaflets and magazines, segmented and personalised down to individual level. The wrappers are just one of the ways in which paper can be used as a differentiator.
Symeta Hybrid is perfectly prepared for the accelerating shift from classic printing to more targeted communication, with an eye to sustainability, cost-efficiency and relevance.
With long-term contracts in government services and telecom for producing and dispatching transactional documents, Symeta Hybrid proves the perfect partner for organisations keen to outsource their print and mailing activities. To accommodate future growth in this area, 1,5 million euros was invested in additional mailing machines.
Booming paper and energy prices put pressure on margins. Contractual conditions meant that inflation could not be passed on to clients in full or else only with a delay, apart from a few interim adjustments. Clients also more often considered using cheaper paper types.

101
ACTIVITIES | Retail • Wholesale • Foodservice • Other activities • Group support activities
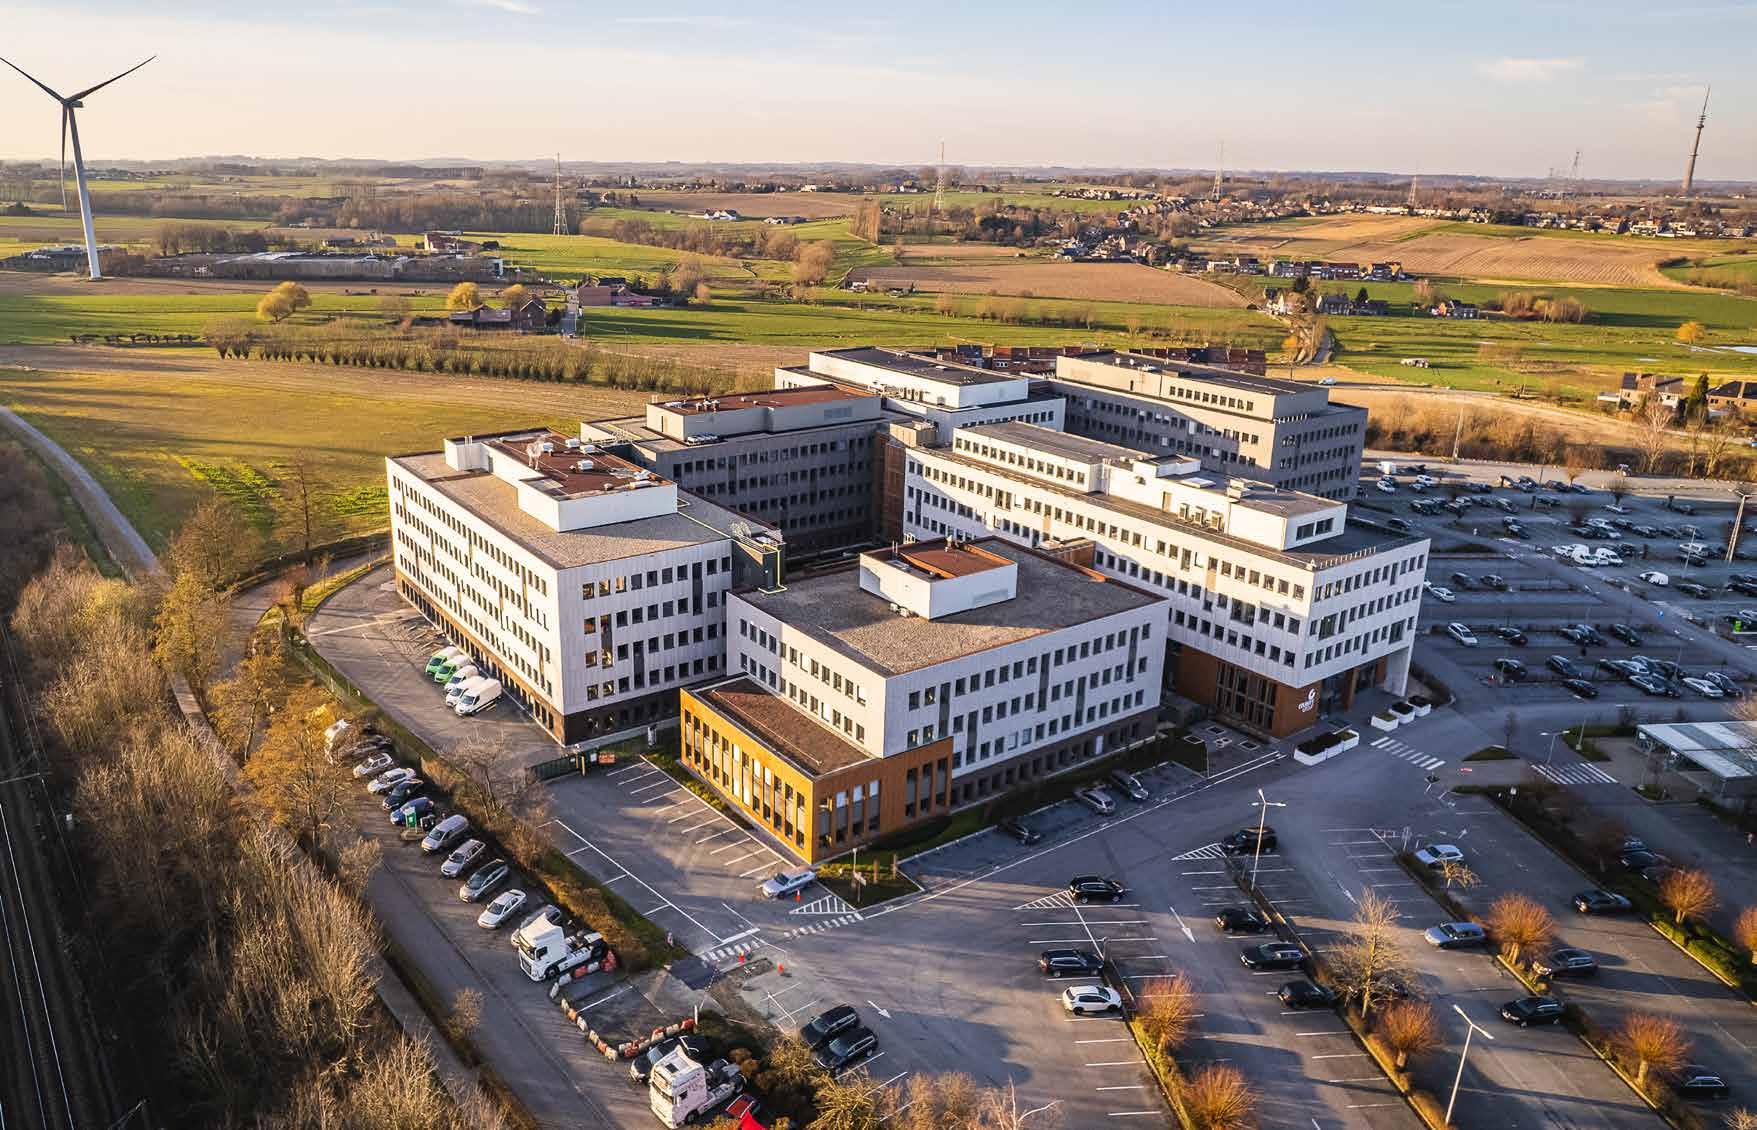
ACTIVITIES | Retail • Wholesale • Foodservice • Other activities • Group support activities 102
Group support activities
103
ACTIVITIES | Retail • Wholesale • Foodservice • Other activities • Group support activities From IT over technology to communication: Colruyt Group has significant in-house expertise that we put at the service of internal partners, employees, and customers. In this chapter, you can find a selection of our group support activities and achievements of the past financial year.
Fine Food
Colruyt Group is the only Belgian food retailer with its own industrial-scale production departments, grouped under Colruyt Group Fine Food. Thanks to in-house production and our years of expertise, we can operate in a cost-effective manner, guarantee constant quality and create added value both for our private labels and for customers.
Fine Food processes meat and makes salad spreads, cuts and packages cheese, bottles wine, roasts coffee and bakes bread. The ready-to-sell products are marketed under our own brands such as Colruyt Beenhouwerij, Boni Selection, Everyday and Spar. Fine Food has more than 1.100 permanent employees on nine production sites.
41.195 tonnes of meat processed
17.290 tonnes of cheese packed
2.785 tonnes of spreads produced
6.265 tonnes of coffee roasted
23,9 million litres of wine bottled
Less meat, more bread
35,75 million loaves baked
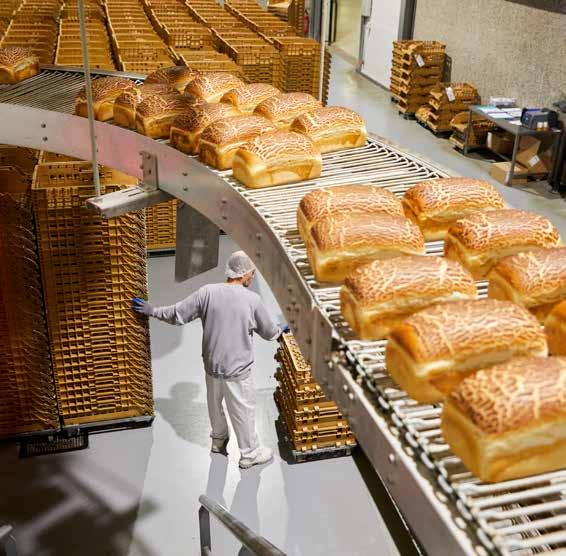
• In a shrinking retail market, Fine Food too saw its production volumes fall and shift in the past financial year. This trend was strongest in beef, slightly milder in pork and least in poultry, charcuterie and salad spreads. The production of vegetarian salad spreads doubled. Inflation caused consumers to look for cheaper alternatives, reflected, for example, in a shift from fresh meat to prepared products, or from Boni to Everyday. With the decrease in volume, a larger share of meat could be processed internally instead of being outsourced.
• The production volumes of cheese, coffee and wine remained more or less stable, while those of the bakeries increased slightly, partly thanks to the very competitive prices and the success of the bake-off bread for Okay, of budget products in general and of sandwiches for the international market.
• Profitability came under pressure from purchase price inflation and wage indexation in January 2023, while Fine Food passed on its higher costs only partially and with a delay.
• Fine Food expects categories like meat to remain expensive in the coming year, due to the persistently high prices for feed, packaging materials and additives such as butter, milk and eggs.
• The production departments will invest even more in developing specific ranges for our store formats, with greater attention to sustainability aspects such as the protein shift and recyclable packaging. For example, the site already produces an attractive assortment of hummus and other vegetarian products.
ACTIVITIES | Retail • Wholesale • Foodservice • Other activities • Group support activities
104
Group support activities
Group support activities
Optimisations
Fine Food focused on further optimisations and automation of (production) processes and systems, enabling it to use fewer temporary and interim workers.
• Increasing the operational efficiency of the production and packaging lines, for example by taking targeted action against losses and downtimes.
• Reducing the number of recipes in the bread department.
• Shifting volumes between the bakery sites, which specialise in everyday breads, patisserie, bake-off for external customers, etc.
• New installation that automatically opens fresh folding crates and saves a lot of manual work.
Investing in domestic production
Colruyt Group has been consciously investing in Belgian agriculture for years, to anchor production in its home country, to ensure a future for local skills and to set up sustainable collaboration forms. With guaranteed purchase systems among other things, we offer farmers income security and the prospect of sustainable growth. This way, as a Belgian retailer, we can continue to offer consumers a maximum of Belgian products, in sufficient volume, with guaranteed quality and at a correct price.
Continuing vertical integration
Colruyt Group continues to invest in its own production and vertical integration.
• In order to increase our efficiency and competitiveness, we will phase out poultry production at the Wommelgem site and fully centralise it at the Fine Food Meat site in Halle no later than December 2023. This centralisation permits synergies along with more efficient transfers between our production and distribution centres. The new location is also better suited to the slightly declining market volumes. The number of employment places will be maintained and the employees involved will receive personal guidance.
• Permit applications have been filed for building a new cheese slicing and packaging hall, also on the Fine Food site in Halle, which should become operational in the course of 2025.
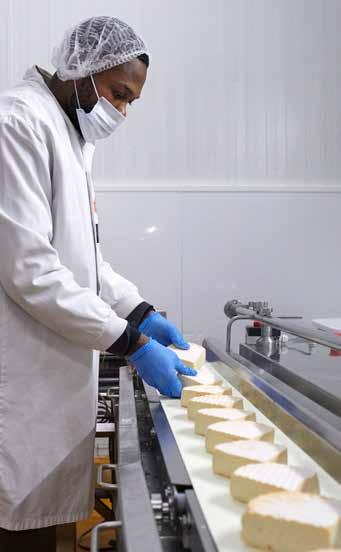
(txt volgt)
In recent years, we have structured various direct collaboration models with Belgian farmers, in which they take part as independent entrepreneurs, individually or in groups. These models combine our expertise with that of farmers and other links in the agri-food chain. Together, we form an important lever for even closer cooperation.
We currently work directly with no less than 600 Belgian agricultural businesses, including potato and fruit growers, dairy and cattle farmers, and chicken breeders. Together with producers and other partners, we have also set up a few completely new chains, for example for organic baking wheat, milk and organic pork.
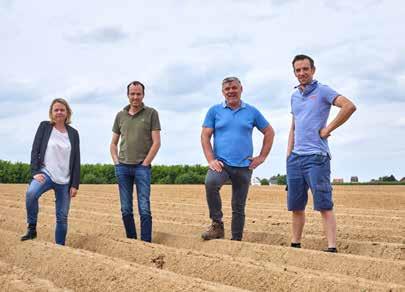
We also use our financial heft to invest in our own production facilities, such as the organic farm Het Zilverleen and our sea farm for cultivating mussels. We have also purchased 500 hectares of agricultural land, which we make available to independent farmers, while the products harvested on it are sold in our stores.
This collaboration allows farmers to use their machines in a more cost-effective manner and work more land without having to invest in the purchase themselves. We work structurally with the partner-producers, consulting together on items like crop planning. Together, we are also stronger to move forward in product innovation and sustainability, including biodiversity and soil health. And because as a retailer we are involved at the beginning of the chain, we can respond more quickly to evolving customer demands. It is important here that we opt for long-term sustainable partnerships: in this way, we commit that the high-quality agricultural land we have purchased will effectively remain just that.
105
ACTIVITIES | Retail • Wholesale • Foodservice • Other activities • Group support activities
Colruyt Group Academy provides a wide range of courses for individuals and businesses, with face-to-face and online workshops full of inspiration and experience. It has 10 learning centres spread across Belgium and offers affordable prices thanks to long-term partnerships.
Group support activities
Festive themes in demand
• After corona, customers found their way back to the learning centres fairly quickly and were already well acquainted with the now structurally embedded online offering. The Academy invested in new themes and formats, individually or in groups, in physical or digital format.
• The culinary themes remained very popular, with physical workshops in the Academy kitchens, digital lectures and demo cooking to follow at home. In the run-up to the festive seasons, the Academy always scores well with inspiration and tips to relax and enjoy partying together. For example, at the end of the year, the Okay session on party snacks counted almost 1.100 participants.
• In 2022, Colruyt Group Academy strengthened its presence in the business market, with a wide range of workshops, lectures and team building activities in addition to room rental.
More sustainability themes
The Academy is steadily broadening its range around sustainability themes to which Colruyt Group is strongly committed, such as environment and health. Classics among the workshops include energy saving at home and on the road (in collaboration with DATS 24), gluten-free and vegetarian cooking (with Colruyt and Bio-Planet) and carrying techniques and sleeping tips for babies (with Dreambaby).
• Fascinating speakers, recognisable stories and enriching tips, that’s what the new digital concept Life talks promises. This lecture series with a strong focus on well-being and health was kicked off in March 2023 by Jef Colruyt. His webinar about making a positive difference in uncertain times attracted more than 2.000 participants. The subsequent sessions also generated considerable interest.
• Since the end of 2022, customers have been able to use their Xtra points to follow free digital sessions on green themes, like cooking with leftovers, packaging myths and climate-friendly gardening.

• The Academy co-organised the experience day at apple grower Wolfcarius, which attracted no fewer than 550 people. Wolfcarius grows the Magic Star apple variety exclusively for our group. In May 2023, a new experience day on climate-conscious living followed.
Day camps for children
For the second summer holiday in a row, the Academy organised day camps for children aged 6 to 12 years in Melle, Grimbergen and Namur. The day care offered is meaningful and affordable with sporting, relaxing, creative or scientific activities, in collaboration with Dreamland. Parents can telework for free in the Academy and count on child-sitting before and after the activity. With advertising of the summer 2023 activities already starting in February, a large number of reservations had already come in by the end of June.

ACTIVITIES | Retail • Wholesale • Foodservice • Other activities • Group support activities
Ontdek onze dagkampen op colruytgroupacademy.be/dagkampen Voor kinderen van 6 tot 12 jaar Jij kiest: 1 of meerdere dagen plezier 10 originele dagthema’s: voor elk wat wils Gratis telewerken voor ouders om nooit te vergetenCreatieve dagkampen DEZE ZOMER 10 % KORTING Boek vóór 30 april BUITENACTIV TEITEN KOKEN KNUTSELEN WEBINARS over actuele thema’s die raken Leen Dendievel 25 april Laat angst niet regeren Jef Colruyt maart Een positief verschil maken in onzekere tijden Steven Gielis Boost het zelfvertrouwen van kind Steven Laureys Ma 17 april Slapen niet voor watjes Nina Mouton juni Zelfzorg, het begin van alles Ish Ait Hamou april Voor jezelf durven kiezen Sandra Bekkari 11 mei Gezond eten en genieten van leven colruytgroupacademy.be/nl/lifetalks meer sprekers SCHRIJF IN -
106
Learning & Development
Focused on professional and personal growth, Learning & Development is the training and education department for the Group’s employees. In the past financial year, the group invested approximately EUR 37,7 million in training and education, accounting for 2,6% of payroll.
Craftsmanship in learning
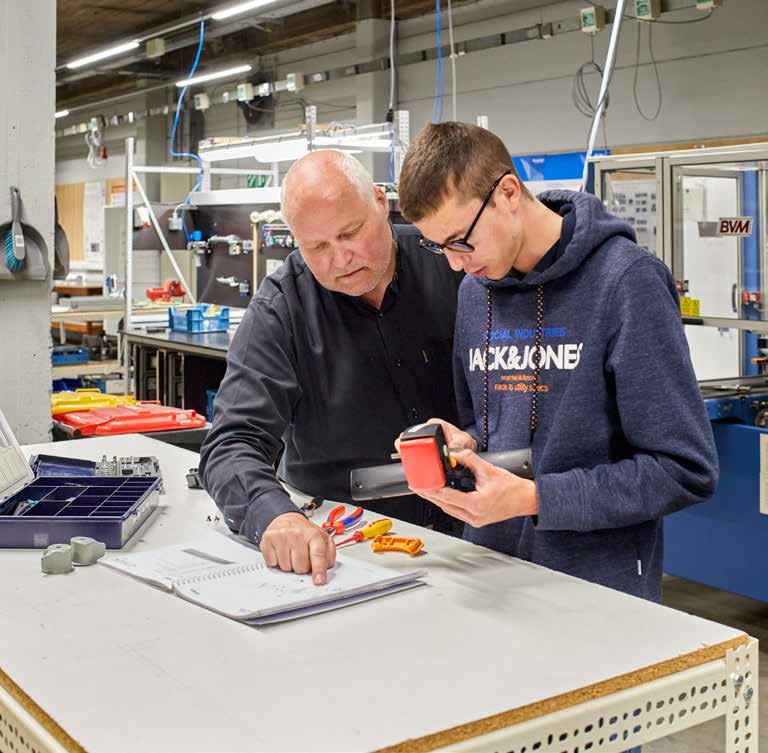
• L&D took further steps in its transition from organiser to facilitator of all possible forms of learning within the group, and supporter of everyone involved in learning. In this way, a network has been set up in which some two hundred learning professionals exchange knowledge and experience. Regardless of the content, they reinforce each other in teaching crafts and methods.
• The former training teams have been converted into ‘professional teams’, which are closer to the business and are familiar with its needs. Greater focus has been placed on the smooth, efficient integration of new employees, providing them with the right resources to grow both professionally and personally.
Mix of physical and digital learning

• Since corona, one-fifth of the training offering takes the form of digital training courses, to be followed in the classroom or individually. Language lessons, for example, are largely digital for reasons of efficiency. Store employees are also increasingly receiving tools, manuals and how-to videos on their smartphones to view when it suits them best. Given the need for personal connection and involvement, other courses take place only physically.
• Responding to the evolving employee needs, the department continues to enrich its offering with new or updated training courses in fields like personal growth, corporate culture, leadership and first aid.
• With more than 2.000 registrations, the course on value perception was the most attended. Many employees also joined workshops on undesirable transgressive behaviour or programmes on cooperation and team development.
107 ACTIVITIES | Retail • Wholesale • Foodservice • Other activities • Group support activities
Group
activities
support
People & Organisation
People & Organisation coordinates and supports Colruyt Group’s HR policies. Staffed by more than 350 permanent employees plus external colleagues, the department ensures employees make the most of their abilities. The HR partner offers several services: from payroll processing and recruitment via prevention and medical services to legal advice and relations with social partners. The HR knowledge centre works on topics such as personal and team development, remuneration, personal growth, leadership, well-being and skills.
Adjusted personnel policy
An adjusted recruitment and selection policy contributed to a better cost structure for the group in the past financial year.
• Departing staff were not automatically replaced with new hires, except for essential profiles and shortage professions like sales staff, butchers, computer scientists and engineers.
• Greater attention was paid to the attendance policy and to activating employees with long-term sicknesses. Managers received new team monitoring dashboards.
• The expertise centres worked hard on the more targeted deployment and development of existing employee skills.

• The support services optimised their operation by more sharply defining their services and focusing on efficiency and essentials.
Priority to internal mobility
Since the end of 2022, we have made maximum use of internal mobility to fill vacancies. This enables us to switch gears quickly and consolidate the expertise within the group. At the same time, as a large and diverse company, we offer almost all profiles the opportunity to take new directions within the group.
• As a standard rule, new vacancies are open for two months exclusively for internal employees. Only if there is still no suitable candidate do we go searching outside.
• The internal recruitment process has been shortened to a maximum of one month.
• Employees who need or want to change direction can count on extra guidance, in addition to tools like the internal job site, the job mail with new, suitable vacancies and toolboxes for those wanting to grow in their current roles, evolve into different ones or are still looking.
Pay statements digital from now on
At the beginning of 2023, 12.500 employees in Belgium already received their pay statements digitally via the external platform Doccle. In the meantime, we have decided to make all Belgian pay statements available digitally from June 2023 and to no longer send printed versions by default.
• We are keen to further digitise our administrative documents and evolve with the world around us. Doccle is the largest and most versatile digital platform in Belgium for managing personal administration.

• Cost consciousness and sustainability. By no longer printing pay statements and sending them by post, we can save up to 300.000 euros and 5 tonnes of paper annually.
• Ease of use. All digital wage statements since 2015 are stored in one central location, and can be consulted anytime, anywhere. Employees who lack digital tools can still request to receive their pay statements on paper.
ACTIVITIES | Retail • Wholesale • Foodservice • Other activities • Group support activities
108
Group support activities
Operate & Improve
Working together smarter
The almost 70 employees of Operate & Improve provide structural support in our more than ever relevant pursuit of simplicity and efficiency in our everyday work. The improvement and simplification of existing processes, systems, workstations and methods contributes to higher productivity and profitability. Working (together) smarter also benefits everyone’s involvement, entrepreneurship and job satisfaction.
Optimalisation and automation
• Support with the embedding of a new planning tool at Colruyt, which saves each store an average of one full-time equivalent.
• Emerging automation of repetitive, volumedriven and time-consuming administrative computer work. This process automation has already been applied in finance, the contact centres and the supply chain, and offers potential for the future.
• Realising optimisations in the return process for defective electronic price labels, in loading and unloading activities and in the cleaning of trailers, as well as in work processes of invoice control, student recruitment, etc.
Group support activities
Customer Services
Customer Services handles all enquiries and comments from customers, employees, suppliers and other stakeholders. Specialist contact centres serve all store formats as well as internal departments such as HR, store support and IT. The more than 200 staff can be reached by phone, email, online platforms and social media. Together, they handle around two million contacts a year. The department combines smart technology and standardised processes and systems with competent, customer-focused employees. Customer Services gives our store formats structured feedback on their customers’ views and concerns, so that they can adapt quickly where necessary.
Investing in cost efficiency
Customer Services continued to invest in systems and processes, in employee training and in organisational restructuring. Together, this resulted in good efficiency gains and a 10% decrease in employee count.
Flexible organisation. The various teams for food, non-food, energy, Xtra and social media were merged into a large, versatile team, which serves customers of several store formats. This requires extra training, but also permits a more balanced division of labour and lower occupation at off-peak times. All teams are now physically housed on a single site, which has greatly reduced the premises cost.
Optimised accessibility. The department has reduced its opening windows, especially during off-peak hours, but can still be reached by telephone: daily from 8 a.m. to 7 p.m., on Sundays from 10 a.m.
Fruitful interaction. Customer Services systematically informs our store formats of their customers’ questions. In this way, they can make their processes more customer-oriented, and the contact centre also ultimately receives fewer customer enquiries. Customers are increasingly finding their way to the online FAQs.
New tools. The rollout of new, user-friendly tools and the related integration of social media into the contact platform were completed. Integration of AI solutions such as chatbots will follow later.
Best in class
Customer Services strives to be best in class in the contact centre industry.

• Employees are given ample training and career opportunities, and many are truly bilingual.
• Employees can specify many preferences for their work schedules, work a maximum of one Sunday every two months and can work from home or regionally up to three days a week.
• Even in the middle of the energy crisis, the contact centre remained easily accessible for questions about energy supplier DATS 24.
109 ACTIVITIES | Retail • Wholesale • Foodservice • Other activities • Group support activities
Colruyt Group IT supports the group in the area of IT and process optimisation, tracks technological developments and innovations, and applies them to the specific needs of the various departments and businesses. The organisation does not just supply tools, but offers all-in services: ranging from building and implementing bespoke IT solutions to managing, supporting, maintaining and updating them. Colruyt Group IT proactively scans the market, tries out new things and builds prototypes to inspire its partners. The organisation has over a thousand permanent employees in Belgium and 600 in India, plus external contractors.
Active in India for 15 years
15 years ago Colruyt Group set up an IT department in the Indian metropolis of Hyderabad. This now has around six hundred employees, both salaried and seconded by temporary employment agencies. Colruyt India compensates for the scarcity of IT talent in Belgium, and contributes to keeping control of the cost structure at group level.
The department continues to grow and is keen to diversify its activities in the future into areas such as HR, customer contact or finance, to support the sustainable growth of the group. For example, the central IT helpdesk is already supported from India.

Colruyt India has its own, modern office building in Hyderabad and is looking into a suitable location for a second branch in another state, within two hours’ flying time. A second site will make it possible to grow and to appeal to a wider, more diverse pool of employees.
The company received the Great Place to Work’ certificate, following a satisfaction survey in which fourfifths of employees participated. The certificate is a great asset for the employer image, in a country where Colruyt Group is less known and with numerous international technology companies on the labour market.
Cost reductions
The IT department contributed to improving the cost structure at group level.
• Creative interventions have enabled a number of investments planned for the past and next financial year to be postponed to a later date. In addition, the scope of a number of projects was reduced to the essentials, without any direct impact on day-to-day operations.
• The software licences and the number of accesses have been reviewed to match real needs.
• The mainframes were sold in order to bring back the latest new mainframe version via lease.
• Reduction of the number of consultants in Belgium. Expansion of activities in India and more facilities for homeworking.
Together with sheltered workshops
In the past financial year, IT also called on a sheltered workshop for delivering large volumes of new and recovered IT material.
• 20.000 new IT devices unpacked, labelled and registered.
• 21.000 cables sorted and tested, of which IT was able to recover 15.000 for reuse.
• 65.000 Colruyt electronic price labels checked, more than 60% of which came back into circulation.
• 3.000 laptops, workstations and docking stations sorted in 6 months’ time.
IT
ACTIVITIES | Retail • Wholesale • Foodservice • Other activities • Group support activities
110
Group support activities
Working on a more agile group
• The IT department took further steps in its evolution, started around two years ago, towards a Service-Oriented Organisation, with the creation of more than thirty Service Centres to serve internal partners. In the meantime, these have developed working methods and methodologies, and documented and defined their service offerings, in order to continue working on improving the service over the next two years.
• A start was made on setting up IT ecosystems, for example for Java and SAP. These virtual teams align technologies and services, providing a framework and a common language.
Innovation in logistics
• Upgrading of the hands-free voice-picking technology in seven food distribution centres, including new devices, software, dialogues and functionalities such as track & trace for tobacco products. The operation was spread over two years, with no negative impact on operating performance. Today, 1.200 order pickers can work simultaneously with the future-proof technology.
• Rollout of ‘goods-to-person’ automation at the Ollignies distribution centre, bringing non-food items to the order picker.
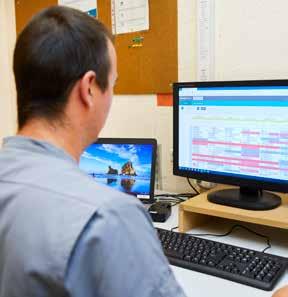
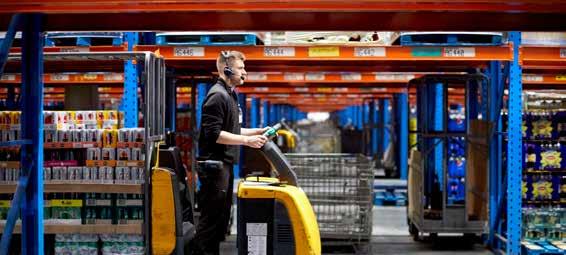
Innovation in the sales area
• Development of a new algorithm for calculating reference prices and price reductions, and their display in all store formats.
• Further development of the sharing economy platform and the app for Collect&Go Drivers, where private individuals deliver online orders to customers’ homes.
• Expansion to about thirty intuitive functionalities on the Digital Shop Assistant used by 22.000 store employees. Thus, they are perfectly connected to each other and to the central services, and equipped to help customers. Now that they can also read all their mail digitally, much less paper mail goes from the head office to the shops, resulting in an annual saving of 273.000 euros.
• Introducing scale computing for the unmanned Okay Direct store concept, extremely reliable store servers with three modules that back each other up in the event of a malfunction or defect.
IT talent wanted
In a competitive job market, IT took many initiatives to attract and retain new talent.
• Inspiration fair, job tastings and career paths to give colleagues a taste of the various job opportunities.
• More than 40 people joined traineeships. The range has been broadened, in terms of both entry points and functions, and now includes business analysis and data & information.
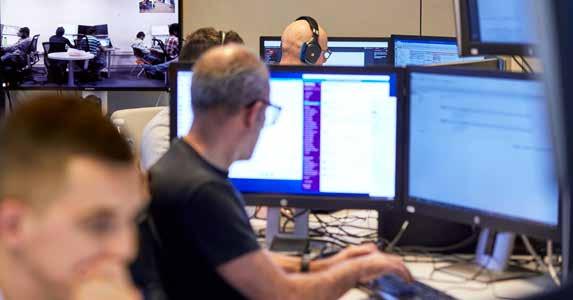

• Participation in job fairs and the ‘Young Potential Boostcamp’ networking and coaching event. Intensive collaboration with higher education via guest lectures, internships, workplace learning and thesis supervision.
• Headhunting to attract professionals.
111
ACTIVITIES | Retail • Wholesale • Foodservice • Other activities • Group support activities
Group support activities
Technics
Featuring some 1.600 employees, the technical department is active in Belgium and Luxembourg and offers a complete service, from study and design via purchasing, construction and installation to maintenance and prevention. Not just for stores, offices, data centres, distribution centres and production buildings, but also for vehicles and machines. Opting for innovative solutions and sustainable techniques, Technics meticulously monitors environmental management and often goes beyond the prescribed legal standards.
Focus on energy efficiency and savings
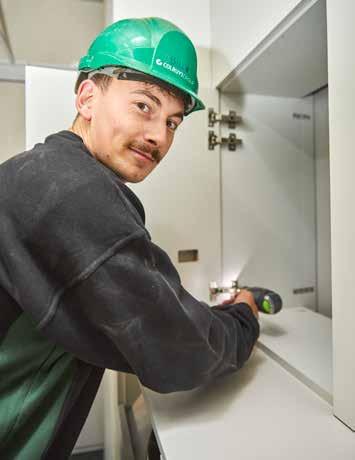
In the past financial year, special attention was paid to the energy efficiency of buildings, machines and processes. Campaigns were launched encouraging employees to save energy in simple ways in their everyday work as well. With success: some fifty initiatives between October and December 2022 significantly cut energy consumption. The stores consumed 30% less gas, while the distribution centres and offices more than halved their consumption.
• The stores are on track to phase out fossil fuels for heating. All new stores are low-energy buildings, while existing stores will be further energy-renovated to a proven recipe. This involves improving insulation and airtightness and the application of sustainable technologies like propane cooling, heat recovery and heat pumps for heating, ventilation and cooling. Where possible, the installation of solar panels is being accelerated.
• Stores took additional temporary measures to save energy, like lowering indoor temperatures and light intensity, or temporarily placing back the flaps at the entrance to the cooled fresh food sections in Colruyt stores.
• In the offices too, the temperature was lowered. The heating starts later in the morning and is reduced to a minimum at weekends. Adjusted motion detection on the lighting ensures that lights are switched off faster.
• In various distribution centres, the large central boilers were replaced by more economical systems with multiple heating units.
Worksites in 2022/23
13 new stores
22 renovations
13.400 m² additon store area
Energy-efficient distribution centre
Solucious’ new fresh foods distribution centre in Bornem excels in energy efficiency.
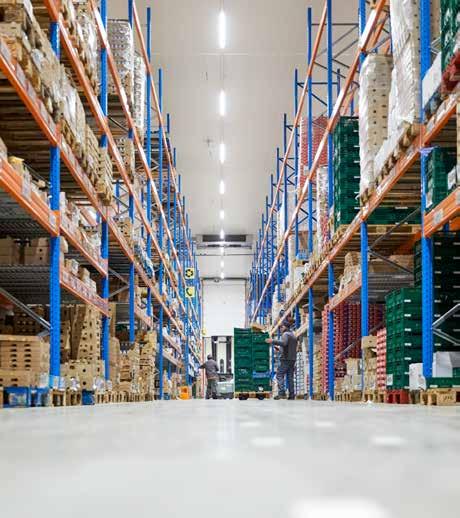
• Two separate cooling rooms with adjusted temperatures: 12 °C for fruit and vegetables and 4 °C for dairy and meat, among other things.
• Optimum insulation, including inflatable dock shelters to seal the gaps between quay gates and trucks.
• Heat recovery: the residual heat from the cooling system covers 80% of the heating needs in the offices.
• 640 solar panels on the roof, charging area for 25 electric cars …
ACTIVITIES | Retail • Wholesale • Foodservice • Other activities • Group support activities Group support activities 112
Towards emission-free transport
In the spring of 2023, we took a major step towards the electrification of our truck fleet. We have commissioned a 44-tonne electric truck for transport between distribution centres and stores. At the same time, our food service company Solucious has commissioned five electric refrigerated trucks. We have formed valuable partnerships with manufacturers Volvo and Scania and built a brand-new rapid charging infrastructure.
The electric trucks allow us to deliver emission-free and almost silently in the long term, which is an attractive extra for city deliveries. This investment fits in with the Brussels Green Deal ‘Low-emission city logistics’ and with Colruyt Group’s commitment to reducing greenhouse gas emissions from its incoming and outgoing goods transport to zero by 2035.
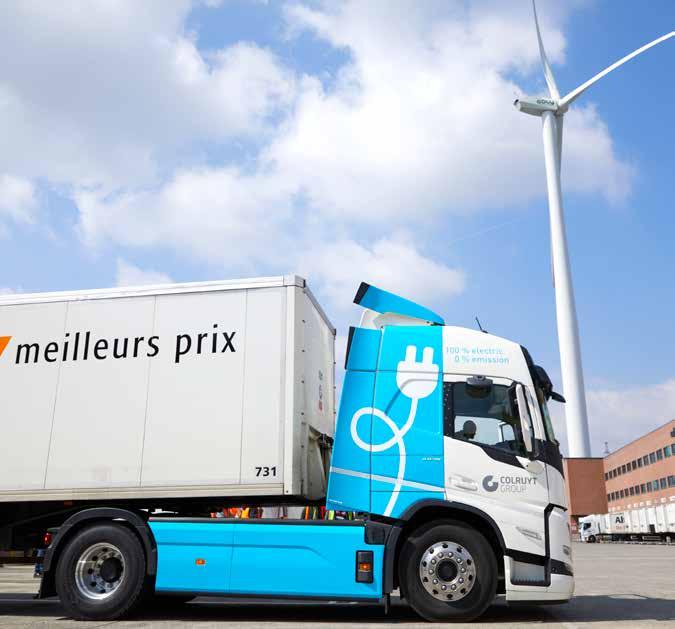
Hypermodern Zwijnaarde office
In September 2022, we opened a new regional office in Zwijnaarde, just outside Ghent. The site, with over 9.500 m² of office space and 261 parking spaces, replaced the rented offices in Deinze and Merelbeke. The outdated former headquarters of Thomas Cook was thoroughly renovated into a modern, energyefficient and pleasant workplace for almost 400 employees of the IT and personnel department, Bike Republic, SmartWithFood and Jims. There is also room for flexible work, while the right-hand wing (2.000 m²) is rented to third parties. Maximum use was made of sustainable materials and technologies in this circular construction project:
Real Estate
Real Estate is responsible for meeting the group’s real estate needs for stores, offices, production and distribution centres in Belgium, Luxembourg and France. The team searches for building land, takes care of all environmental permits, writes the specifications and manages the development of the buildings. Striving for the optimal social and urban integration of the properties, Real Estate has in recent years been implementing more mixed projects, combining stores with residential units.
• LED lighting, rainwater recovery, heat recovery and heat pump boiler, natural coolants, green roof …
• 524 solar panels and 48 charging points for electric cars.
• Easily accessible by public transport and by bicycle. Shuttle service to and from Gent-Sint-Pieters station.
113
ACTIVITIES | Retail • Wholesale • Foodservice • Other activities • Group support activities
Group support activities
Corporate Marketing
Corporate Marketing defines the brand and communications strategy for Colruyt Group and corporate sub-brands like the Collibri Foundation. The department provides press and PR, marketing and communication, market research and trend watching services, and also supports our store formats with their brand and marketing strategies.
Group support activities
Maintaining trust
Corporate Marketing worked hard in the past financial year to maintain the high level of trust in Colruyt Group that is widely shared in society.
• More intensive internal communication, so as to create greater inter-connection between employees in a large and diverse company, especially between management and employees. To capture their needs and concerns, this included organising more than twenty lunch sessions, during each of which fifteen employees exchanged ideas with members of management.

• New initiatives to share the Colruyt Group story with business partners. On the very first business partner day at the end of May, 150 direct suppliers received an insight into the group’s strategic plan and into how we want to grow further as an innovative, sustainable and Belgian company. From mid-2023, we will also be informing the same partners by email about relevant evolutions and achievements in the group.
• In a challenging, competitive job market we updated our employer branding proposition, with the aim of maintaining our image as the best employer in Belgian retail.
• We continued our rollout of the Eco-score, making it ever easier for our customers to consume consciously. The simple colour and letter code indicating products’ environmental impact features clearly on the packaging of more than 500 privatelabel products and on the electronic price labels in our stores. Customers can consult the scores on all our digital media. We also encourage our national brand suppliers to mark their products with Eco-scores. In May 2023, Danone was the first to commit to using the Eco-Score in order to encourage customers to make more environmentally conscious purchases.
Saving points for the environment
• At the end of 2022, we launched a programme that allows customers to save points every time they purchase products with Eco-score A or B. They can use the points for the environment, like for planting a tree, laying out a piece of flower meadow or following a workshop at Colruyt Group Academy.

• We consulted experts for selecting a group of environmental projects and partners, including BeeOdiversity, GoodPlanet and Nassonia. Later we will go on to choose projects that match our other sustainability themes of animal welfare, health and society.
• We are positioning the savings programme more firmly in the market, including spotlighting products with good environmental scores and making them more visible on the shelf. We also encourage customers to use their points effectively, for example through notifications in their Xtra app.
• Corporate Marketing streamlines the communication on the Eco-score, in collaboration with the store formats, numerous internal departments and Collibri Foundation, our foundation that will eventually manage all projects from the sustainable savings programme.

ACTIVITIES | Retail • Wholesale • Foodservice • Other activities • Group support activities
114
Group support activities
Marketing Communication Services
Marketing Communication Services translates the marketing objectives of the group and all the various brands into targeted offline and online marketing communication. The department has around 230 permanent employees, from designers, copywriters, photographers and video specialists to marketing communication experts. For producing and sending communications, we rely on our print and document specialist Symeta Hybrid.
Remarkable creations
• New inspiration brochure for Colruyt Lowest Prices, with the weekly planner as a common thread.
• New Spar promo folder with maximum focus on the promos, new mascot, simplified layout process and cheaper format.
• New quarterly inspirational magazine ‘Helemaal Okay’, in association with an external specialist content marketing partner.
• Campaign with printed job newspaper for recruiting store employees in Antwerp. This has boosted the number of applications and recruitments in the region.
• Letter campaign to activate Colruyt Group Academy sleeping customers, with an excellent conversion rate of 4,5%.
Flexible organisation
• In the past financial year, Marketing Communication Services’ production volumes fell markedly, with reduced demand from our store formats for leaflets and other marketing communication. The department exhibited the necessary flexibility in handling the fluctuating work volumes, like by using freelancers. A number of communications requiring specific know-how were outsourced to external communications agencies under longer-term arrangements.
• Significant savings have been achieved, among them in the cost of digital storage of photos and videos. Overall, images are now automatically removed from the servers more rapidly.
Creating and collaborating more efficiently
The department and all group marketing services will start using a comprehensive programme in the course of 2023, with major efficiency gains for more than 400 employees. This programme will support the creation processes, from briefing to correction rounds to final approval and archiving. The reuse of existing content will also become a lot easier, for example via an accessible image bank and fixed templates for recurring communications.

115
ACTIVITIES | Retail • Wholesale • Foodservice • Other activities • Group support activities
Anders werken Gezocht: Antwerpseveelzijdige handjes Colruyt opent nieuwe winkels in regio Antwerpen en zoekt hiervoor 300 nieuwe collega’s voor de winkels en beenhouwerijen. jobs.colruytgroup.com/antwerpen
Our public benefit purpose foundation Collibri Foundation aims to offer socially vulnerable young people in Belgium and abroad more opportunities for a successful future. To this end, we support training projects that offer the young people a good education (educate), help them grow as a person (develop) and foster a sense of initiative, cooperation and entrepreneurship (empower). Collibri Foundation fosters connection and exchange between the young people, develops a learning network and involves employees and customers as much as possible.
Colruyt Group funds all operating costs and a large part of project expenses. The group doubles the money raised in in-store fundraising campaigns and individual donations (capped at a certain amount). Tax statements for donors are issued by the King Baudouin Foundation.
New projects in Belgium
In 2023, new partnerships were launched with four Belgian organisations, each for a five-year period. The four were carefully selected following a call for projects resulting in some sixty applications.
• Story-me guides Brussels young people from technical and vocational education in their learning paths and career choices with the help of an innovative educational programme.
• Via individual coaching, Make it Work supports each year 132 Belgian young people with criminal records towards employment or (re)starting their education.
• Sport2Be promotes the social and professional integration of young people from disadvantaged neighbourhoods in Brussels through regular sports activities.
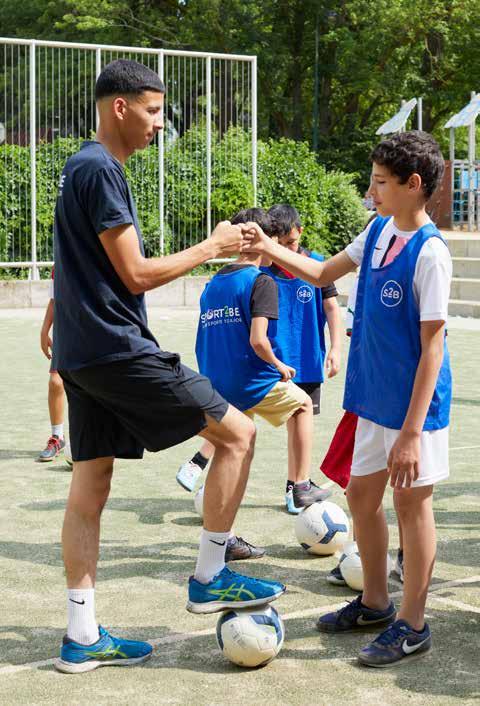
• Rising You organises programmes for young refugees not speaking the local languages. These programmes focus on language acquisition and orientation towards various (technical) professions.
Abroad: auditing for greater impact
• In the course of 2022, the foundation commissioned third party audits of a number of foreign projects after their third year of operation. After thorough evaluations of the impact and goals achieved, one partnership in Burundi was temporarily discontinued. Three others were extended, with renewed contracts and adjusted substantive conditions based on the insights gained.
• Audits provide a wealth of data and insights both for adjusting current projects and for establishing good practices for other projects.
18 training projects in 8 countries
ACTIVITIES | Retail • Wholesale • Foodservice • Other activities • Group support activities
Group support activities
“We believe in a world in which all young people have the opportunity to become entrepreneurs of their lives.”
116
Fruitful interaction
Collibri Foundation wants to systematically link a training project to each of the group’s sustainable agricultural chain projects abroad. A chain project already generates local economic impact in a relatively short term, while the training initiative in the same region produces longer-term socio-economic benefits. A mutually enriching and sustainable interaction can come about between the two initiatives. Today, nine training projects are linked to chain projects, including for the production of coffee, honey and quinoa.
EUR 1.152.935
Donations to projects, 74.665 euro of which from fundraising campaigns and private donations
Greater involvement
Collibri Foundation establishes connections and exchanges between partner organisations, the participating young people and employees. In this context, the foundation is increasingly granting non-financial support to its partners or directly to the young people. For partners this may involve sharing expertise, for young people access to the Colruyt Group network, or organising visits, internships and student jobs in central services, distribution or logistics. Many employees are involved in the operation in various ways:
• Colleagues volunteer to act as mentors for young people in Belgian projects, helping them practice a language, write their theses or find their way on the job market.
• Every year employees and their families host Indonesian students arriving for one-month internships in the company, a unique experience for everyone.

• Colleagues from Finance organised a second sports challenge, in which the group sponsors every kilometre travelled for the benefit of Collibri Foundation.
www.collibrifoundation.org
11.200 young people directly reached
Networking
• After two digital editions, the Tomorrow’s Voices network event once again brought together some forty young people physically with employees and partner organisations.
• Collibri is a member of the Belgian Federation of Philanthropic Foundations, with around a hundred members, and of the European Venture Philanthropy Network. Consisting of more than 300 organisations, the network gathers and shares expertise, data and insights about impact investments
117 ACTIVITIES | Retail • Wholesale • Foodservice • Other activities • Group support activities Group support activities
Corporate governance
This chapter contains information about the governance, operation and internal controls of Colruyt Group and about all aspects of corporate governance. We divide ‘Corporate Governance’ into three main sections. One about governance, supervision and management, another about sustainable corporate governance and a third about share ownership.
CORPORATE GOVERNANCE | Governance, supervision and management • Sustainable corporate governance • Share ownership
118
Governance, supervision and management
1. Board of Directors
1.1. Composition of the Board of Directors - 2022/23 financial year
Representative of the principal shareholders, executive director
• Jef Colruyt (Chairman) 2026
Representatives of the principal shareholders, non-executive directors
• Korys NV, permanently represented by: Griet Aerts X 2024
• Korys Business Services I NV, permanently represented by: Hilde Cerstelotte
2025
• Korys Business Services II NV, permanently represented by: Frans Colruyt 2025
• Korys Business Services III NV, permanently represented by: Wim Colruyt
2026
• Korys Management NV, permanently represented by: Lisa Colruyt 2026
• 7 Capital SRL, permanently represented by: Chantal De Vrieze
2023
In addition to their appointments as directors of Colruyt Group companies, Messrs Jef Colruyt, Frans Colruyt, Wim Colruyt and Dirk Van den Berghe, as well as Ms Griet Aerts, Ms Chantal De Vrieze and Ms Rika Coppens, also hold other external directorships. However, in accordance with the recommendations of the Belgian Corporate Governance Code 2020, the above-mentioned directors do not exceed the maximum number of five directorships in listed companies.
Independent directors
• Fast Forward Services BV, permanently represented by: Rika Coppens
• Dirk JS Van den Berghe BV, permanently represented by: Dirk Van den Berghe
2025
2023
Secretary
• Kris Castelein
119 CORPORATE GOVERNANCE | Governance, supervision and management • Sustainable corporate governance • Share ownership
Name Member Audit comitee Member Rem.Comitee Mandate expires at GM of
Position
X
X
X
X
X
1.2. Statutory auditor
ERNST&YOUNG BEDRIJFSREVISOREN BV (B00160), indirectly represented by Eef Naessens (A02481), appointed until and including the General Meeting of 2025.
1.3. Reappointment and appointment of directors at the General Meeting of 27 September 2023
Ms. Chantal De Vrieze’s mandate as a director expires at the General Meeting of 27/09/2023. The Board of Directors proposes to extend her mandate for two years until the 2025 General Meeting.
The mandate of Dirk Van den Berghe, permanent representative of Dirk JS Van den Berghe BV, expires at the General Meeting of 27 September 2023 and will not be renewed. The board would like to take this opportunity to thank Mr. Dirk Van den Berghe, in his role as independent director, for his contribution to executing the group’s longterm strategy.
The board will propose to the General Meeting of 27 September 2023 the appointment of a new independent director with a two-year mandate to expire after the 2025 General Meeting.
Subject to their approval by the General Meeting of 27 September 2023, the composition of the Board of Directors will then be as follows:
Representatives of the principal shareholders, non-executive directors
•
NV, permanently represented by: Griet Aerts
• Korys Business Services I NV, permanently represented by: Hilde Cerstelotte
• Korys Business Services II NV, permanently represented by: Frans Colruyt
• Korys Business Services III NV, permanently represented by: Wim Colruyt
• Korys Management NV, permanently represented by: Lisa Colruyt
• 7 Capital SRL, permanently represented by: Chantal De Vrieze
Independent directors
• Fast Forward Services BV, permanently represented by: Rika Coppens
• New independent director to be appointed
Secretary
• Kris Castelein
CORPORATE GOVERNANCE | Governance, supervision and management • Sustainable corporate governance • Share ownership
Position Name Audit Comittee Member Rem. Comittee Member Mandate expires at GM of
Jef Colruyt (Chairman) 2026
X 2024
•
Korys
X 2025
2025
X 2026
2026
X 2025
X 2025
X 2025
120
After the closing of the financial year, Colruyt Group announced that Jef Colruyt is transferring the day-to-day management of the group from 1 July 2023 to a new non-family CEO, Stefan Goethaert. Jef Colruyt remains Chairman of the Board of Directors of the Company, a role he will exercise from July 2023 in a non-executive capacity.
1.4. Honorary director
• Director François Gillet (for a period of five years as of the end of his mandate in 2020).
2. Colruyt Group Management
2.1. Changes to Senior Management in the reporting period
The following manager or deputy manager appointments and changes were made in the past financial year:
• Wim BAUWENS Sales Manager RPCG as of 01/01/2023
• Jo WILLEMYNS General Manager Colruyt Lowest Prices as of 01/04/2023
• Bart DE SCHOUWER Marketing Services Manager as of 01/04/2023
• Tom DE PRATER Collect&Go Manager as of 01/04/2023
Members of management who have ended their positions as managers in the group and whom we would like to thank for their commitment and valued contribution to the sustainable growth of Colruyt Group:
• Guy ELEWAUT Marketing Manager Colruyt Lowest Prices as of 15/12/2022
• Guido SORET Deputy Sales Manager RPCG (in retirement as of 31/12/2022)
• Dieter STRUYE General Manager Non-Food Retail as of 27/01/2023
• Chris VAN WETTERE General Manager Colruyt Lowest Prices (in retirement as of 01/04/2023)
At the end of March 2023, Chris Van Wettere entered retirement after a rich 40-year career with Colruyt Group. Throughout his career, he was guided by the ‘Customer is King’ adage, whether working in sales at Colruyt Lowest Prices, managing Okay and Bio-Planet, or starting up our own bakery. From 2015 onwards, he was responsible for the successful expansion of our largest food brand, Colruyt Lowest Prices. Colruyt Group is very grateful to him for his 40 years of commitment and his contribution to developing the Group’s activities as a whole.
121 CORPORATE GOVERNANCE | Governance, supervision and management • Sustainable corporate governance • Share ownership
2.2. Management Committee –as at 01/04/2023
• Jef COLRUYT Managing Director and CEO
• Jo WILLEMYNS COO Food Retail and Marketing Services as well as General Manager Colruyt Lowest Prices
• Stefan GOETHAERT COO Fine Food, Business and Group Services
• Stefaan VANDAMME CFO
• Bart DE SCHUTTER General Manager Colruyt France (integrated and affiliated stores)
• Christophe DEHANDSCHUTTER General Manager Okay
• Johan VERMEIRE General Manager Retail Partners Colruyt Group (RPCG) and Foodservice
• Liesbeth SABBE Manager People & Organisation, Operate & Improve and Learning & Development
• Peter VANBELLINGEN IT Manager
• Koen BAETENS Manager Technics, Real Estate and DATS 24
2.3. Future Board – as at 01/04/2023
In addition to the above-mentioned Management Committee members, the following (deputy) managers also participate in the Colruyt Group Future Board:
• Geert ROELS Purchasing Manager Colruyt Lowest Prices
• Koen DE VOS Supply Chain Manager Colruyt Lowest Prices
• Fabrice GOBBATO Sales Manager Colruyt Lowest Prices
• Rudi DEWULF Sales Manager Colruyt West Colruyt Lowest Prices
• Jean-Christophe BURLET Deputy Sales Manager Colruyt Centre-West Colruyt Lowest Prices
• André GIGLIO Deputy Sales Manager Colruyt South-East Colruyt Lowest Prices
• Geert GILLIS Deputy Sales Manager Colruyt Centre-North Colruyt Lowest Prices
• Bart DE SCHOUWER Marketing Services Manager
• Tom DE PRATER Collect&Go Manager
• Wim BAUWENS Sales Manager RPCG
• André CERON Deputy Manager Logistics RPCG
• Gunther UYTTENHOVE Manager Colruyt Group Fine Food
• Wim MERTENS Deputy Manager Social Relations People & Organisation
• Antonio LOPEZ GUTIERREZ Deputy Sales Manager Colruyt Prix Qualité (integrated stores)
• Anthony MEILLER Deputy Manager Codifrance (affiliated stores)
CORPORATE GOVERNANCE | Governance, supervision and management • Sustainable corporate governance • Share ownership
122
Sustainable corporate governance
1. Sustainable corporate governance statement
The following is the corporate governance statement for the financial year ended 2022/23 which contains the information in line with the Code on Companies and Associations and the provisions of the 2020 Code. The Corporate Governance Charter as well as the internal regulations of the committees can be consulted on the Company’s website.
1.1. Reference code
As a Belgian listed company (Euronext Brussels - COLR), Colruyt Group has followed the 2020 Belgian Corporate Governance Code (1) in application of the Royal Decree of 12 May 2019 indicating the code to be followed by listed companies with regard to corporate governance, as a mandatory frame of reference for sustainable corporate governance in Colruyt Group in the sense of Article 3:6, § 2, 4th paragraph of the Code on Companies and Associations.
The updated Code on Companies and Associations has been in force since 1 May 2019 and applies to all Belgian companies. In October 2020, the Extraordinary General Meeting of Etn. Fr. Colruyt NV approved the aligning of the Company’s articles of association with the updated Code. The articles of association of all other group companies will be adjusted to the new Code on Companies and Associations no later than 1 January 2024.
The transposition into Belgian law of Directive 2017/828/EU of the European Parliament and of the Council of 17 May 2017 amending Directive 2007/36/EC on the promotion of long-term involvement of shareholders and containing various provisions
regarding companies and associations came into force on 6 May 2020. The new provisions regarding the remuneration report and remuneration policy apply to the Company as of the 2020/21 financial year. The remuneration policy was approved for the first time at the General Meeting of 29 September 2021 and is valid for four years.
For positions during the 2022/23 financial year that are not in line with the 2020 Code, the reasons for deviating from the 2020 Code have been stated by the Board under the comply or explain principle. We give below the following disclosures and deviations from the principles and provisions of the 2020 Belgian Code on Corporate Governance as applicable to listed companies. Most of the deviations are due to the fact that the Colruyt family is the main reference shareholder of Colruyt Group. The Colruyt family wants to concentrate fully on guiding all companies of the group and wants to propagate in them the values of sustainability and sustainable entrepreneurship. In addition, the reference shareholder places stability and long-term vision above short-term profit.
• Principle 1 - For managing the Company, the Board has opted to continue the existing one-tier board model, consisting of a Board of Directors that can perform all actions with the exception of those reserved for the General Meeting. The Board of Directors has delegated part of its decisionmaking powers to a managing director for operational implementation. Every five years, the Board will conduct a thorough reflection on the governance structure.
• Principle 2 - The powers of the members of the Management Committee, other than the CEO, are determined by the CEO and not by the Board of Directors. This deviation from provision 2.19 of the 2020 Code is explained by the fact that the members of the Management Committee exercise their duties under the leadership of the CEO, to whom day-today management and additional specific powers have been delegated by the Board of Directors.
• Principle 3 - In line with the longstanding tradition of Colruyt Group, Jef Colruyt is simultaneously Managing Director, Chairman of the Board of Directors and Chairman of the Colruyt Group Management Committee and the Future Board. This departure from provision 3:1 of the 2020 Code is justified in the light of the history of Colruyt Group and the desire of the reference shareholders to entrust the leadership of the Management Committee to one of their own. Where appropriate, strict application of the conflict of interest rules protects all shareholders from any abuse. In addition, within the Board of Directors the Chairman applies the rule of a unanimous vote for every decision or investment with material consequences for the future of the group.
• Principle 3 - At the end of financial year 2022/23, the Board of Directors is composed of one executive director and eight non-executive directors, three of whom are independent directors. The three independent directors meet the independence criteria as set out in the 2020 Code and the Code on Companies and Associations. The Board of Directors believes that any increase in the number of members should be accompanied by an enrichment in experience and skills, without jeopardising its efficient operation.
123 CORPORATE GOVERNANCE | Governance, supervision and management • Sustainable corporate governance • Share ownership
(1) https://www.corporategovernancecommittee.be/en/about-2020-code
Since the Board functions and takes its decisions as a collegial body, only the general attendance rate of the Board and its committees is given, with no information about the attendance rate of each director individually.
The Board does not consider it opportune for the non-executive directors to meet annually without the CEO, because Jef Colruyt, in his capacity as executive director, is both Chairman of the Board of Directors and Chairman of the Colruyt Group Management Committee, and therefore has contacts with directors and senior management as well as access to the documentation and records of all bodies.
• Principle 4 - The Board of Directors has appointed an Audit Committee composed of one independent and two nonexecutive directors. Based on the current composition of the board as well as the various skills present, this composition is optimal for the efficient operation of this committee.
• Principle 4/5 - Notwithstanding provision 4.19 of the 2020 Code, the Board of Directors has not established an Appointments Committee. Appointments therefore remain the responsibility of the entire Board of Directors. Prospective directors are proposed to the General Meeting by the entire Board of Directors. Managers are appointed at the proposal of the Chairman of the Management Committee, with the approval of the entire Board of Directors. The limited number of directors means that this procedure works perfectly well.
• Principle 7 - The Board of Directors has opted not to grant share-related payments to directors or executive management. Non-executive directors do not receive remuneration in the form of shares of the company and members of the executive management are not required to hold a minimum threshold of shares in the company.
This deviation from provisions 7.6 and 7.9 of the 2020 Code is justified, since the Board of Directors has a dual role in our one-tier board model, which is to support entrepreneurship on the one hand and to ensure effective supervision and control on the other. To avoid the granting of shares to nonexecutive directors increasing the likelihood of a conflict of interest, these persons do not receive performance-related remuneration or share-related compensation. The Board of Directors is of the opinion that the directors and executive
management are sufficiently focused on sustainable longterm value creation.
With regard to provision 7.12 of the 2020 Code, the Board of Directors has decided for the time being not to avail itself of the option to reclaim variable compensation paid or to withhold payment of the same, as considerable uncertainty remains as to the legal validity and enforceability under Belgian law of a right of recovery of variable remuneration in favour of the company.
The Board of Directors will reassess the outlines of the remuneration policy, including the share-based compensation, on an annual basis.
• Principle 9 - With a view to the efficient and effective functioning of its governing bodies, the Board evaluates its own performance as well as that of the committees on an ongoing basis. To ensure their commitment and constructive involvement in decision-making, the performance of the directors is also evaluated on an ongoing basis.
• Pursuant to the new Code on Companies and Associations, the articles of association may provide for double voting rights for registered shares that have been held by the shareholder for a minimum of 2 years. In view of their administrative complexity, the Board of Directors has decided not to propose double voting rights at this stage.
1.2. Corporate Governance Charter
The Corporate Governance Charter has been updated to a limited extent. As of the annual report for financial year 2022/23, it is included as a separate document and as such is available for consultation on the Company’s website at www. colruytgroup.com/content/dam/colruytgroup/investeren/ aandeelhouders/kapitaalsverhoging-personeel/pdf/en/ Sustainable%20corporate%20governance.pdf . This Charter explains the main aspects of corporate governance in Colruyt Group including the governance structure, the functioning of the general meetings, the governing bodies and its committees as well as information on remuneration policy and the shareholder structure.
1.2.1. Ordinary General Meeting
As required by the articles of association, the Annual General Meeting is held on the last Wednesday of the month of September at 4 pm at the company’s registered office. In past years, more than 70% of the shares were present or represented. For a summary of the votes taken at the General Meetings, please refer to the reports on the Company’s website under https://www.colruytgroup.com/en/invest/stakeholderinformation.
The rules and procedures applicable to shareholder meetings are described in the Corporate Governance Charter which is consultable on the Company’s website at https://www. colruytgroup.com/en/invest/stakeholder-information.
1.2.2. Board of Directors
With the introduction of the 2020 Corporate Governance Code, the Board of Directors chose to operate under a monistic governance model in which the Board assumes the dual role of supporting entrepreneurship on the one hand and ensuring effective supervision and control on the other. The Board is empowered to take all actions relevant to the Company’s purpose and with the exception of those assigned by law to the General Meeting.
CORPORATE GOVERNANCE | Governance, supervision and management • Sustainable corporate governance • Share ownership
124
COMPOSITION
The composition of the Board of Directors is the result of the structure of the share ownership of the company, in which family shareholders are reference shareholders. As evidenced by the past, the family shareholders ensure the stability and continuity of the company, and thus protect the interests of all shareholders. They choose to propose a limited number of representatives with diverse backgrounds, extensive experience and sound knowledge of the company as directors. The directors form a small team with the necessary flexibility and efficiency to be able to adapt constantly to market events and opportunities.
There are no rules in the articles of association regarding the appointment of the directors and the renewal of their appointments. However, the Board of Directors has decided to nominate candidates for terms of no more than four years, which may or may not be renewed. The General Meeting has the exclusive right to appoint the directors. Directors can be dismissed ad nutum, but the General Meeting can, on dismissing them, grant a severance payment or notice period.
Since March 2019, three independent directors have been active on the Board. The Board of Directors believes that an increase in the number of members should be accompanied by an enrichment in skills and experience supporting the development of Colruyt Group. At the end of financial year 2022/23, the Board of Directors is composed of one executive director and eight non-executive directors, three of whom are independent directors.
In line with the longstanding tradition of Colruyt Group, Jef Colruyt is both Chairman of the Board of Directors and Chairman of the Colruyt Group Management Committee and the Future Board. This departure from the recommendations of the Belgian Corporate Governance Code 2020 is justified in the light of the history of Colruyt Group and the desire of the reference shareholders to entrust the leadership of the Management Committee to one of their own.
COMMITTEES WITHIN THE BOARD OF DIRECTORS
The Board of Directors has had an Audit Committee since September 2006 and a Remuneration Committee since 2011. The work of both committees is explained in the Corporate Governance Charter, which is consultable on the company’s website.
Both the Audit Committee and the Remuneration Committee perform their duties based on the relevant internal rules of procedure, which can also be consulted on the company’s website at https://www.colruytgroup.com/en/invest/ stakeholder-information.
In view of the small number of members of the Board of Directors, there is currently no Appointments Committee
REMUNERATION
The remuneration of the directors and CEO (individually) and members of the Management Committee (collectively) is published in the remuneration report under item 2.5.
1.2.3. Day-to-day management
The day-to-day management of the company is in the hands of managing director Jef Colruyt, who in turn delegates a number of powers internally.
Under the chairmanship of Jef Colruyt, the Colruyt Group Management Committee consists of the general managers of the various commercial and production activities of the group and the managers of the support services. The Colruyt Group Management Committee determines general strategy and policy options at group level and coordinates the group’s various activities and corporate services.
The General Future Board consists of all senior Colruyt Group managers. As a consultation and contact platform, it focuses primarily on the group’s long-term development and consults on Colruyt Group’s common vision and objectives. For meaningful and relevant business topics, all business unit managers and division managers may also be invited to join Colruyt Group’s Future Board.
Management Committee and Future Board meetings are scheduled at fixed intervals, every four and eight weeks respectively, and are chaired by the Chairman of the Management Committee.
With the exception of Jef Colruyt, the members of the Colruyt Group Management Committee are bound to their employer by employment contract.
1.2.4. Diversity policy
Colruyt Group carefully applies Article 3:6 (§2.6° and §4) of the Code on Companies and Associations regarding information on the diversity policy pursued. In general terms, an equality principle is applied within Colruyt Group, whereby each employee is selected and coached in their career development based on factors such as competences, talents and skills. As a result, our diversity policy forms part of our DNA and emanates from our core value ‘respect’. The group is convinced that diversity of employees (including in terms of age, gender, cultural and professional background) is an absolute asset for a fresh, agile and growing company. A company which also operates in a society characterised by diversity. We endeavour to display this throughout the organisation, including in the management teams. Aiming for teams that are as diverse as possible at all levels of management raises the quality of leadership and therefore inherently contributes to the realisation of the group’s strategy.
At the end of financial year 2022/23, the Company’s Board of Directors was composed of representatives with sufficient diversity in backgrounds, competences and experience to support the development of Colruyt Group. In this way, the board members representing the family shareholders can present a thorough knowledge of the company. Director Jef Colruyt has held several roles in the company since 1984, becoming Chairman of the Board of Directors at the end of 1994 and since then managing the entire operation as CEO. Director Wim Colruyt has an IT-technical background and is well versed in business architecture. Director Hilde Cerstelotte is an expert in work simplification and director Lisa Colruyt is well versed in strategic marketing. Directors Frans Colruyt and Griet Aerts have played active roles within the group in the past. As COO Retail, Frans Colruyt managed all retail activities in the group, while Griet Aerts led Colruyt Group Academy and is now CFO of the family holding company Korys. The independent directors can also present solid credentials. As CEO, Chantal De Vrieze is at home in general management and the IT world. Rika Coppens also has CEO experience both in retail and in HR services, and also brings comprehensive financial expertise. And Dirk Van den Berghe has extensive knowledge of retail, having led the general management of retail chains both in Belgium and internationally.
125 CORPORATE GOVERNANCE | Governance, supervision and management • Sustainable corporate governance • Share ownership
Moreover, the three independent directors on the Board of Directors meet the independence criteria of Article 7:87 of the Code on Companies and Associations and the 2020 Corporate Governance Code.
The Board also scores well on gender diversity, currently having five female directors: (i) Hilde Cerstelotte, permanent representative of Korys Business Services I NV, (ii) Griet Aerts, permanent representative of Korys NV, (iii) Lisa Colruyt, permanent representative of Korys Management NV, (iv) independent director Chantal De Vrieze, permanent representative of 7 Capital SRL and (v) independent director Rika Coppens, permanent representative of Fast Forward Services BV. The Board thus complies with Article 7:86 of the Code on Companies and Associations which stipulates that, from 2017 onwards, at least one third of the members of the Boards of Directors of listed companies must be of a different gender than that of the other members. Since October 2015, the Management Committee has one female member.
For more detailed information on diversity in Colruyt Group and the non-financial information required to be included, please refer to the Corporate Governance Charter on the company’s website and the chapters ‘Who we are’ and ‘Corporate Sustainability’ in this annual report.
1.2.5. Shareholders
TRANSPARENCY NOTIFICATION
Every shareholder who holds at least 5% of the voting rights must comply with the Act of 2 May 2007 on the disclosure of significant holdings, the Royal Decree of 14 February 2008 and the Code on Companies and Associations. The statutory thresholds per 5% bracket apply. To this end, those concerned must send a notification to the Financial Services and Markets Authority (FSMA) and to the Company. The latest transparency notice received before the close of financial year 2022/23 is always published in the Company’s annual report and at https://www.colruytgroup.com/en/invest/stakeholderinformation.
INSIDE INFORMATION - MEASURES TO PREVENT MARKET ABUSE AND THE USE OF INSIDE INFORMATION
Etn. Fr. Colruyt NV has drawn up a Dealing Code in which, in accordance with the Market Abuse Regulation (MAR) of 03/07/2017, measures are set forth to prevent market abuse and the use of insider information. A brief description of this is included in the Corporate Governance Charter consultable on the company’s website.
1.2.6. Information for shareholders
All useful information for shareholders is published on our website at colruytgroup.com/en/invest/stakeholderinformation. Any interested persons may register with the Company to be informed automatically by email alerts whenever the website is updated or when new financial information is published on the website.
CORPORATE GOVERNANCE | Governance, supervision and management • Sustainable corporate governance • Share ownership
126
2. Activity report of the Board of Directors and committees in financial year 2022/23
2.1. Audit Committee
Since the end of September 2020, the Audit Committee has been chaired by Rika Coppens, permanent representative of Fast Forward Services BV. Non-executive directors Wim Colruyt, permanent representative of Korys Business Services III NV, and Griet Aerts, permanent representative of Korys NV (who took over from Dries Colpaert after the General Meeting of September 2022), are the other permanent members of the committee.
The internal regulations of the Audit Committee are available on the company’s website at colruytgroup. com/en/invest/ stakeholder-information.
Chaired by Rika Coppens, the Audit Committee met on 3 June 2022, 16 September 2022, 2 December 2022 and 20 March 2023. All committee members were present at each meeting.
On each occasion, the figures in the working document for the meeting of the Board of Directors were examined in detail and explained by the finance department. The statutory auditor is invited to attend all meetings and also presents his audit approach and his findings from the audit of the half-yearly and annual results. The Colruyt Group’s Risk and Compliance Unit (internal audit) also drafted a quarterly report for the Audit Committee on each occasion. Members of the Accounting and Consolidation departments are also present to explain the accounting treatment of participations and new companies in the consolidation scope, as well as the application of new IFRS standards. The findings and recommendations of the Audit Committee are a fixed item on the agenda of Board meetings.
2.2. Remuneration Committee
The Remuneration Committee was formed in September 2011. Independent director Chantal De Vrieze, permanent representative of 7 Capital SRL, has chaired the committee since the end of September 2021. Non-executive director Hilde Cerstelotte, permanent representative of Korys Business Services I NV, and independent director Dirk Van den Berghe, permanent representative of Dirk JS Van den Berghe BV, join her as permanent members of the Remuneration Committee.
The internal regulations of the Remuneration Committee are available on the company’s website at colruytgroup.com/en/ investment/stakeholder-information.
Chaired by Chantal De Vrieze, the Remuneration Committee held its regular meetings on 3 June 2022, 16 September 2022, 2 December 2022 and 6 April 2023. The attendance rate at each meeting was 100%. All meetings could also be followed via videoconference if necessary.
The main objective of the meetings was to define, formalise and evaluate the general group remuneration policy at the proposal of the Chairman of the Management Committee of Colruyt Group. The fixed and variable remuneration components for the CEO (Jef Colruyt) and the entire Management Committee were also discussed by the Committee.
The Committee also formulated proposals concerning the remuneration of the members of the Board of Directors. The proposed resolutions of the committee are submitted for approval to the Board of Directors.
The result of all this work is also recorded in a Remuneration Report that is published in full under item 2.5. The final version of this report was finalised during the Remuneration Committee meeting of 2 June 2023. The general principles of the remuneration policy were approved for the first time, as
provided by law, at the General Meeting of 29 September 2021 and are valid for four years.
The Compensation & Benefits unit of the People & Organisation department assisted the Committee at each meeting.
2.3. Meetings of the Board of Directors
The Board of Directors held its four ordinary quarterly meetings in this financial year on 9 and 10 June 2022, 22 and 23 September 2022, 8 and 9 December 2022 and 23 and 24 March 2023. The main discussion points at the meetings were the evolution of the performance of the group’s various store formats and trading activities. Board meetings generally took place at the Halle headquarters and could also be followed via videoconference if necessary.
As an exception, the March 2023 board meeting also took place in Halle and not in France as each year. The June and December meetings were preceded by half a day of information on the half-yearly and annual results presented by the finance department. The average attendance rate of directors at the aforementioned ordinary quarterly meetings can be summarised as follows: 100% in June and December 2022, 84% in September 2022 and 97% in March 2023.
Furthermore, the board held additional sessions on 5 May 2022 to discuss the Virya Energy convertible bond and on 13 June 2022 to approve the increase of the stake in Newpharma to 100% (through the acquisition of the shares held by Korys, the Colruyt family’s investment company). See also item 2.3.1. below. During these meetings, the intra-group conflict of interest procedure of Article 7:97 of the Code on Companies and Associations was applied. All non-conflicted directors were present at these meetings, resulting in an attendance rate of 100%.
127 CORPORATE GOVERNANCE | Governance, supervision and management • Sustainable corporate governance • Share ownership
In a brief board meeting held on 6 October 2022, the board removed the item on the cancellation of treasury shares from the agenda of the October 2022 Extraordinary General Meeting. On 27 January 2023, the board discussed issuing five-year fixedrate green retail bonds for a total of EUR 250 million. At both meetings, the attendance rate was 89%. Finally, the board also held an additional board meeting on 21 March 2023 to discuss Virya Energy’s sale of all shares in Parkwind, the offshore wind platform, to Jera Co. All directors were present at this meeting.
Other than the remuneration and variable pay of Jef Colruyt and the Virya Energy and Newpharma projects (cf. item 2.3.1. below), no other situations of possible conflicts of interest were reported by the directors. The fixed and variable remuneration of Jef Colruyt as a member of the Management Committee was discussed and finalised by the Remuneration Committee and approved by the Board of Directors, each time in the absence of the person concerned, who did not participate in the deliberations or the decision. The result of these decisions is described in the Remuneration Report.
Finally, in the light of the mission and values of the group, at all meetings, the board evaluated the internal cooperation but also the interactions with the Audit and Remuneration Committees on a permanent basis.
2.3.1. Transactions with application of the conflict of interest rules
In accordance with Articles 7:96 and 7:97 of the Belgian Code on Companies and Associations, each member of the Board of Directors is required to inform the Board of Directors of any item on the agenda that gives rise to a direct or indirect conflict of interest of a financial nature. The director(s) concerned shall not participate in the deliberation and vote on this agenda item.
In financial year 2022/23, there were two conflicts of interest pursuant to Article 7:97 of the Belgian Code on Companies and Association.
2.3.1.1. . Virya Energy convertible bond project – Extract from the minutes of the Board meeting of 5 May 2022, with the decision of the committee of three independent directors – application of Art 7:97 of the Code on Companies and Associations
1 COMPOSITION OF THE MEETING
The following directors are present at the meeting: Dirk JS Van den Berghe VOF (permanently represented by Dirk Van den Berghe); Fast Forward Services BV (permanently represented by Rika Coppens) and 7 Capital BV (permanently represented by Chantal De Vrieze). The directors present establish that the following directors are not present at the meeting: Jef Colruyt (Chairman); Korys NV (permanently represented by Dries Colpaert); Korys Business Services I NV (permanently represented by Hilde Cerstelotte); Korys Business Services II NV (permanently represented by Frans Colruyt) and Korys Business Services III NV (permanently represented by Wim Colruyt). Mr Kris Castelein is present in his capacity as secretary of the Board of Directors. Mr. Charles-Antoine Leunen (Linklaters LLP) is present in his capacity as legal adviser.
2 AGENDA
(i) Acknowledgement of the opinion (the “Opinion”) of the committee of independent directors established pursuant to Article 7:97 of the Code on Companies and Associations (the “CCA” and the “Committee”) regarding the proposed conversion of all convertible bonds held by the Company in Virya Energy NV (the “Conversion”).
(ii) Discussion and vote on the approval of the Conversion.
(iii) Receipt and acknowledgement of the assessment of the statutory auditor pursuant to Article 7:97 CCA.
(iv) Approval of disclosure pursuant to Article 7:97, §4/1 CCA.
(v) Power of attorney.
3 BACKGROUND
In 2020, the Company and Korys Investments NV (“Korys Investments”) provided financing to Virya Energy NV (“Virya”) by subscribing in two tranches to convertible bonds issued by Virya (the “Bonds”) in proportion to their respective holdings in Virya (the “Subscription”). The Company hereby subscribed to Bonds totalling 97.388.629,52 euros and Korys Investments to Bonds totalling 62.610.799,00 euros. The issuing terms of the Bonds provide that the Company and Korys Investments may independently convert their respective Bonds into newly issued shares of Virya, with each Bond entitling the holder to one ordinary share in Virya. Korys Investments has informed the Company of its intention to convert all of its Bonds in accordance with the issuing terms of the Bonds. It is now proposed that the Company should similarly proceed with the Conversion.
The Committee has reviewed the Conversion and issued an opinion on it to the Board of Directors, in accordance with Article 7:97 CCA. The Board of Directors thus establishes that the procedure prescribed by Article 7:97 CCA has been fully complied with.
4 CONFLICT OF INTEREST
The directors present take note of the fact that (i) Korys NV (with Dries Colpaert as permanent representative), (ii) Jef Colruyt, (iii) Hilde Cerstelotte, (iv) Frans Colruyt and (v) Wim Colruyt are each (indirectly) shareholders in Korys Investments. Consequently, (a) Korys NV and Jef Colruyt have, in their capacity as directors, and (b) Hilde Cerstelotte, Frans Colruyt and Wim Colruyt have, in their capacity as permanent representatives of directors Korys Business Services I NV, Korys Business Services II NV and Korys Business Services III NV, an interest of a financial nature that conflicts with the interest of the Company within the meaning of Article 7:96 CCA. Korys NV, Jef Colruyt, Hilde Cerstelotte, Frans Colruyt and Wim Colruyt have thus each declared that they will not participate in the deliberation or voting on the items on the agenda.
The directors present establish that they can validly deliberate and resolve on all items on the agenda, as stipulated in Article 18 of the Company’s articles of association.
CORPORATE GOVERNANCE | Governance, supervision and management • Sustainable corporate governance • Share ownership
128
After having taken note of the background and the conflicts of interest of Korys NV, Jef Colruyt, Hilde Cerstelotte, Frans Colruyt and Wim Colruyt, the directors present take note of the Opinion and of the decision formulated by the Committee as follows:
“Given the above considerations, the Committee is of the opinion that the Conversion is not obviously unlawful in nature and that it is unlikely that the Conversion would lead to disadvantages for the Company that are not offset by benefits gained by the Company from the Conversion. The Committee therefore issues a favourable opinion on the proposed Conversion.”
After deliberating on the Conversion, the directors present have unanimously resolved to approve the Conversion by the Company.
After deliberating on the terms and conditions of the Shareholders’ Agreement, the directors present have unanimously resolved to approve the conclusion of the Shareholders’ Agreement by the Company.
Furthermore, the directors present have taken note of the assessment presented by the statutory auditor pursuant to Article 7:97 CCA, which reads as follows:
“Based on our assessment, conducted in accordance with the International Standard on Review Engagements 2410 “Review of Interim Financial Information Performed by the Independent Auditor of the entity”, nothing has come to our attention that causes us to believe that the accounting and financial data included in the minutes of the Board of Directors of 5 May 2022 and in the advice of the independent directors of 5 May 2022, both prepared in accordance with the requirements of Article 7:97 of the Code on Companies and Associations, might contain material inconsistencies compared to the information available to us in the course of our engagement. We do not express an opinion on the suitability or expediency of the transaction, nor on whether the transaction is lawful and fair (“no fairness opinion”).”
Furthermore, the directors present have taken note of the draft disclosure that the Company must publish pursuant to Article 7:97, §4/1 CCA, in the form as submitted to the Board
of Directors. The directors present unanimously resolved to approve this publication.
The directors present further unanimously decided to grant a power of attorney to Stefaan Vandamme, Pieter-Jan Vandevelde and Ruben Brandt to take all actions and steps, complete formalities and sign documents necessary or useful in connection with the Conversion.
In accordance with Article 7:97, §4 of the Code on Companies and Associations, we also refer to the press release published on 14 June 2022, which can be consulted on our website colruytgroup.com/en/invest/financial-press-releases.
2.3.1.2. Newpharma project – Extract from the minutes of the Board of Directors meeting of 13 June 2022, with the decision of the committee of three independent directors – application of Art 7:97 of the Code on Companies and Associations
1 COMPOSITION OF THE MEETING
The following directors are present at the meeting: Dirk JS Van den Berghe BV (permanently represented by Dirk Van den Berghe); Fast Forward Services BV (permanently represented by Rika Coppens) and 7 Capital BV (permanently represented by Chantal De Vrieze). The directors present establish that the following directors are not present at the meeting: Jef Colruyt (Chairman); Korys NV (permanently represented by Dries Colpaert); Korys Business Services I NV (permanently represented by Hilde Cerstelotte); Korys Business Services II NV (permanently represented by Frans Colruyt) and Korys Business Services III NV (permanently represented by Wim Colruyt). Mr Kris Castelein is present in his capacity as secretary of the Board of Directors. Mr. Charles-Antoine Leunen (Linklaters LLP) is present in his capacity as legal adviser.
2 AGENDA
(i) Acknowledgement of the opinion (the “Opinion”) of the committee of independent directors established pursuant to Article 7:97 of the Code on Companies and Associations (the “CCA” and the “Committee”) regarding the proposed acquisition by the Company of all shares held by Korys Investments NV in Newpharma Group NV and related transactions (the “Newpharma Transaction”).
(ii) Discussion and vote on approval of the Newpharma Transaction.
(iii) Receipt and acknowledgement of the assessment of the statutory auditor pursuant to Article 7:97 CCA.
(iv) Approval of disclosure pursuant to Article 7:97, §4/1 CCA.
(v) Power of attorney.
3 BACKGROUND
In July 2021, the Company together with Korys Investments NV (“Korys Investments”) acquired a package of shares in Newpharma Group NV (“Newpharma”) from the founders of Newpharma (the “2021 Acquisition”). Following completion of the 2021 Acquisition, the Company holds 61% of the shares in Newpharma, while Korys Investments holds the remaining 39%.
In connection with the 2021 Acquisition, the Company and Korys Investments entered into a shareholders’ agreement governing their relationship as shareholders in Newpharma (the “Shareholders’ Agreement”). The Shareholders’ Agreement states, inter alia, that the Company has a purchase option on all Newpharma shares of Korys Investments, which the Company may exercise, pursuant to the Shareholders’ Agreement, between 1 June 2023 and 30 September 2023, at a price determined in accordance with the pre-agreed formula contained in the Shareholders’ Agreement (the “Purchase Option”).
The Company and Korys Investments now intend to exercise the Purchase Option at an earlier date, allowing the Company to exercise the Purchase Option even before the period stipulated in the Shareholders’ Agreement, under which the Company intends to actually exercise the Purchase Option. Accordingly, the Company would acquire all 26.329 shares held by Korys Investments in Newpharma (the “Shares”) for a price calculated based on Newpharma’s sales and contribution margin (which is expected to be in the range of EUR 95.000.000) (the “Share Price”). Furthermore, as part of the Newpharma Transaction, the Company would also post a receivable totalling EUR 2.340.000,00 in principal and interest held by Korys Investments against Newpharma on the basis of a shareholder loan (the “Receivable”).
129 CORPORATE GOVERNANCE | Governance, supervision and management • Sustainable corporate governance • Share ownership
5 DELIBERATIONS AND DECISIONS
The Committee reviewed the Newpharma Transaction and issued an opinion on it to the Board of Directors, in accordance with Article 7:97 CCA. The Board of Directors thus establishes that the procedure prescribed by Article 7:97 CCA has been fully complied with.
4 CONFLICT OF INTEREST
The directors present take note of the fact that (i) Korys NV (with Dries Colpaert as permanent representative), (ii) Jef Colruyt, (iii) Hilde Cerstelotte, (iv) Frans Colruyt and (v) Wim Colruyt are each (indirectly) shareholders in Korys Investments. Consequently, (a) Korys NV and Jef Colruyt have, in their capacity as directors, and (b) Hilde Cerstelotte, Frans Colruyt and Wim Colruyt have, in their capacity as permanent representatives of directors Korys Business Services I NV, Korys Business Services II NV and Korys Business Services III NV, an interest of a patrimonial nature that conflicts with the interest of the Company within the meaning of Article 7:96 CCA. Korys NV, Jef Colruyt, Hilde Cerstelotte, Frans Colruyt and Wim Colruyt have thus each declared that they will not participate in the deliberation or voting on the items on the agenda.
The directors present establish that they can validly deliberate and resolve on all items on the agenda, as stipulated in Article 18 of the Company’s articles of association.
5 DELIBERATIONS AND DECISIONS
After having taken note of the background and the conflicts of interest of Korys NV, Jef Colruyt, Hilde Cerstelotte, Frans Colruyt and Wim Colruyt, the directors present take note of the Opinion and of the decision formulated by the Committee as follows:
“Given the above considerations, the Committee is of the opinion that the Transaction is not obviously unlawful in nature and that it is unlikely that the Transaction would lead to disadvantages for the Company that are not offset by benefits gained by the Company from the Transaction. The Committee therefore advises favourably on the proposed Transaction.”
After deliberating on the Newpharma Transaction, the directors present voted unanimously to approve the Newpharma Transaction by the Company.
Furthermore, the directors present have taken note of the assessment presented by the statutory auditor pursuant to Article 7:97 CCA, which reads as follows:
“Based on our assessment, conducted in accordance with the International Standard on Review Engagements 2410 “Review of Interim Financial Information Performed by the Independent Auditor of the entity”, nothing has come to our attention that causes us to believe that the accounting and financial data included in the minutes of the Board of Directors of 13 June 2022 and in the advice of the independent directors of 13 June 2022, both prepared in accordance with the requirements of Article 7:97 of the Code on Companies and Associations, might contain material inconsistencies compared to the information available to us in the course of our engagement. We do not express an opinion on the suitability or expediency of the transaction, nor on whether the transaction is lawful and fair (“no fairness opinion”).”
Furthermore, the directors present have taken note of the draft disclosure that the Company must publish pursuant to Article 7:97, §4/1 CCA, in the form as submitted to the Board of Directors. The directors present unanimously resolved to approve this publication.
The directors present have also unanimously resolved to grant power of attorney to Stefaan Vandamme, Pieter-Jan Vandevelde and Ruben Brandt to sign the Takeover Agreement and the Shareholders’ Agreement , and to take any further action and sign any documents that are necessary or useful in this connection.
In accordance with Article 7:97, §4 of the Code on Companies and Associations, we also refer to the press release published on 14 June 2022 which can be consulted on our website colruytgroup.com/en/invest/financial-press-releases.
CORPORATE GOVERNANCE | Governance, supervision and management • Sustainable corporate governance • Share ownership
130
2.4. Remuneration policy
INTRODUCTION
ROLE OF THE REMUNERATION COMMITTEE
Remuneration Committee
The Remuneration Committee is responsible for assessing and drawing up Colruyt Group’s remuneration policy.
INFORMATION ON THE GENERAL PRINCIPLES OF THE REMUNERATION POLICY
GENERAL PRINCIPLES OF THE COLRUYT GROUP REMUNERATION POLICY
With its remuneration policy, Colruyt Group strives to contribute to its business strategy, to the realisation of both short and longterm objectives, to promoting sustainable value creation for the company and to safeguarding the group’s ability to recruit and retain employees and motivate them on a daily basis.
Board of Directors
The Board of Directors decides on the proposals elaborated by the Remuneration Committee General Meeting
In the event of a material change and at least every four years, the remuneration policy is submitted to the General Meeting of Shareholders of Colruyt Group for approval.
The Remuneration Committee also makes recommendations regarding the level of the remuneration of directors, including the Chairman of the Board of Directors, as reported in the remuneration report. These recommendations are subject to approval by the entire Board of Directors and subsequently by the General Meeting. The policy as described here was submitted for approval for the first time to the General Meeting of 29 September 2021 and was approved. Given the approval, the policy is valid for the next 4 years, i.e. up to and including the 2024-25 financial year.
The Remuneration Committee has also submitted recommendations to the Board of Directors for approval regarding the remuneration of the CEO and the COO and, on the recommendation of the Chairman of the Management Committee, with regard to the other members of the Management Committee.
Colruyt Group is a family business operating various food and non-food formulas in Belgium and abroad. At the same time, these different business formats share a single common identity and culture which is translated into our mission statement and nine core values. With the Colruyt Group remuneration policy, we are therefore committed to maximally stimulating the group’s interests and achieving our strategic objectives. For this reason, the Colruyt Group remuneration policy is based on the following principles:
One policy for the whole group
The remuneration policy applies to all employees. For example, all business formulas follow the same guidelines, and we strive to maximise internal job mobility.
Everyone shares in the result
Everyone shares in the collective result of Colruyt Group. We are committed to a collective variable wage for all employees.
Fair remuneration for all employees
At Colruyt Group, we strive for a fair salary for every employee linked to their responsibilities and work context. We compare each salary package with both
the internal and external market to arrive at a fair remuneration.
Individual performance and growth potential are valued
We want to honour visible individual performance and growth potential. That is why we focus on various remuneration elements (both financial and non-financial.
Remuneration is more than just salary
At Colruyt Group, opportunities for growth and development, a sustainable context, and a work-life balance, in addition to salary, are an essential part of the total remuneration package..
COMPOSITION OF THE REMUNERATION PACKAGE MANAGEMENT COMMITTEE
The total remuneration package of the members of the Management Committee consists of the following components:
1. Gross annual salary
2. Benefits
3. Education and training
4. Sustainable context
The remuneration framework is presented in greater detail below.
Sustainable context
1. Organisation
2. Work
3. Relations
Education & training
1. Professional training
2. Personal growth
3. Orientation & Coaching
Beneftis
1. Insurances
2. Mobility
3. Net compensations ANNUAL
Gross annual salary
1. Basic salary & performance meter
2. Collective variable pay
3. Individual variable pay
4. Bonuses
Gross annual salary consists of two main elements:
• Basic salary and;
• Variable pay.
131 CORPORATE GOVERNANCE | Governance, supervision and management • Sustainable corporate governance • Share ownership
TOTALE REMUNERATION
TOTAL REWARD
SALARY
To ensure the fair remuneration to the members of the Management Committee, gross annual salary is compared with that of a relevant basket of companies. The companies whose remuneration practices are consulted include large Belgian companies and foreign companies with significant operations in Belgium, which are sufficiently comparable to Colruyt Group in terms of size and complexity. The market comparison is intended to aim the gross annual salary, consisting of the basic salary and the variable pay if targets are met, at the median of the market so as to achieve a remuneration package that is sustainable in the long term.
The remuneration package also includes a market-based package of benefits, namely:
• Group insurance;
• Disability insurance;
• Hospitalisation insurance;
• Company car and;
• Flat-rate expense allowance.
The diagram below shows the relative portions of the fixed salary, the variable pay and the group insurance in the target remuneration package (assuming 100% achievement of the target performance criteria) for the CEO and the members of the Management Committee (excluding CEO). The ratio of fixed
salary/variable pay/group insurance may vary between the members of the Management Committee.
At Colruyt Group, we believe that people make the difference and that they are intrinsically motivated to become better at what they do, to learn and develop themselves, both professionally and personally. Colruyt Group Academy provides an extensive collective training offering. We also offer individual counselling and orientation programmes. Finally, we also consider it crucial to offer our people a sustainable context where a pleasant working atmosphere, room for initiative and a balanced work-life balance are paramount.
In order to establish a direct link between remuneration and performance of both employee and organisation, a significant part of the remuneration package consists of a variable remuneration.
In order to establish a direct link between remuneration and performance of both employee and organisation, a significant part of the remuneration package consists of a variable remuneration:
Collective variable pay - individual variable pay.
CORPORATE GOVERNANCE | Governance, supervision and management • Sustainable corporate governance • Share ownership
Members of the Management Committee 32,39% 57,29% 10,31% Fixed Group insurance Variable VARIABLE PAY
• TARGET LEVEL
42% 49% 9% CEO Category Total target variable pay (% of basic annual salary) % Collective (C) % Individual (I) Collective target variable pay (% of basic annual salary) Individual target variable pay (% of basic annual salary) CEO 85% 70% (C) 30% (I) (85% x 70%) = 59,50% (85% x 30%) = 25,50% COOs/CFO/General Manager Colruyt Lowest Prices 62,5% 70% (C) 30% (I) (62,5% x 70%) = 43,75% (63% x 30%) = 18,75% Other members of the Management Committee 50% 70% (C) 30% (I) (50% x 70%) = 35% (50% x 30%) = 15% 132
-
• PERFORMANCE CRITERIA
70% of the annual variable remuneration of the CEO and the other Management Committee members is determined according to collective criteria based on the operating profit targets of Colruyt Group. The Board of Directors determines every four years what level of operating profit we set as the target level. In setting this target level, performance relative to other retail companies is also taken into account.
Operating profit as the financial performance criterion reflects Colruyt Group’s ambition to create added value in a sustainable way. Any good company needs to generate a profit to continue to grow in a sustainable way. By focusing on profitability, we generate sufficient cash to continue investing in the long term and thus realise our strategy. In order to give priority to the group interest, these performance criteria apply to the entire Management Committee and also form the basis for determining the level of profit-sharing for all employees of Colruyt Group Belgium.
The remaining 30% is determined by individual criteria including, in particular:
− Assisting in defining Colruyt Group’s mission & strategy, with a focus on sustainability and value creation
− Translating the group’s mission and making the vision, mission, ambition, strategy explicit in one’s own management area and/or operating unit
− Creating connections centred on mission, ambition and strategy
− Attention to own development
− Continuous attention to the sustainable creation and development of human potential, including own succession
− Mentoring and coaching employees
− Creating commitment and promoting Colruyt Group’s values and culture
Finally, an additional sum may be addressed by the Chairman of the Management Committee on top of the aforementioned variable pay. This sum can amount to a maximum of 10% of the fixed basic compensation. Management Committee members can earn an additional bonus if they meet pre-set targets.
These are linked to:
− Qualitative business KPIs at the level of the management area and/or operating unit being managed. These KPIs, where relevant, are linked to sustainability.
The individual performance criteria and KPIs are determined annually for each individual and embody the various levers identified from the strategic objectives. For the CEO and COO, these performance criteria are drawn up by the Board of Directors. For the other Management Committee members, these are proposed by the Remuneration Committee on the basis of recommendations from the CEO/COO and validated by the Board of Directors.
• EVALUATION
If the group’s EBIT falls for the relevant financial year below a certain threshold, then, on the recommendation of the Board of Directors, no collective or individual variable pay is paid.
Depending on Colruyt Group’s EBIT percentage, a multiplier is applied to the collective variable pay at target level. It can therefore be higher or lower than 1 but at most 1,75.
In addition to EBIT, individual performance also plays a role in determining total variable pay. The CEO and Management Committee members are evaluated annually, in the first few
months following the end of the financial year. For the CEO and COO, performance is evaluated by the Board of Directors. For the other Management Committee members, their performance, on the basis of recommendations from the CEO/COO, is evaluated by the Remuneration Committee and validated by the Board of Directors.
The amount of the variable remuneration of each Management Committee member is determined as follows, depending on their individual evaluation:
− If the Management Committee member has achieved less than half of the individual performance criteria:
o up to half the collective variable remuneration can be awarded
o but no individual variable remuneration will be awarded
− If the Management Committee member has achieved half of the individual performance criteria:
o up to half the collective variable remuneration can be awarded
o half of the variable remuneration resulting from the achievement of the individual performance criteria can be awarded
− If the Management Committee member has achieved more than half of the individual performance criteria:
o the collective variable remuneration can be awarded in full
o the variable remuneration resulting from the achievement of the individual performance criteria can be granted only pro rata to the criteria achieved.
133 CORPORATE GOVERNANCE | Governance, supervision and management • Sustainable corporate governance • Share ownership
Relative weight Lower limit Upper limit Payout 2022/23 (based on 2021/22 results ) criterion impact variable remuneration criterion impact variable remuneration Collective 70% EBIT lower limit Collective target x 0 EBIT upper limit Target x 1,75 Target x 0,3890 Individual 30% EBIT lower limit < 50% individual target achieved Collective target x 0 Individual target x 0 AND collective payout x 0,5 Individual target 100% achieved Target x 1 Average score: target x 1
In the event of the additionally agreed KPIs being achieved, the CEO may award an additional bonus from the discretionary budget. It is evaluated in the same way as the individual performance criteria.
OTHER PROVISIONS
The Extraordinary General Meeting of 13 October 2011 decided to make use of the authorisation provided by Article 7:91 of the Code on Companies and Associations (formerly Article 520ter of the Companies Code) and expressly decided not to apply the provision regarding the permanent acquisition of shares and share options or the provision regarding the staged payment of the variable remuneration to all persons covered by these provisions. Article 13 of the articles of association was amended accordingly. The company will therefore not be bound by the restrictions stipulated by Article 7:91 of the Code on Companies and Associations regarding the staged payment of the variable remuneration to the executive management. In Belgian law, there is still considerable uncertainty as to the legal validity and enforceability of a right of recovery, in favour of the company, of variable remuneration. For this reason, Colruyt Group has opted to refrain for the time being from regulating on a right of recovery of the variable remuneration.
The variable remuneration of the members of the Management Committee does not include any share-related remuneration. The long-term focus is part and parcel of our day-to-day operations, in part because of our focus on sustainability.
DIRECTORS
The directors are remunerated with a fixed remuneration (emolument), regardless of the number of meetings of the Board of Directors or one of its committees. We assume that a director works between 20 and 25 days a year in his or her director’s role. We believe that structuring the board and its committees with a single clear and transparent remuneration for the efforts of the directors is more desirable for corporate governance in a listed company. The Board of Directors has a collective responsibility and we also want to approach the remuneration of the directors from this perspective.
In line with previous years, non-executive directors at Colruyt Group did not receive any share-based remuneration. This deviation from the recommendations of the Belgian Corporate Governance Code 2020 is in our view justified, since the Board of Directors has a dual role in our one-tier board model, which is to support entrepreneurship on the one hand and to ensure effective supervision and control on the other. To avoid the granting of shares to non-executive directors increasing the likelihood of a conflict of interest, these persons do not receive performance-related remuneration or share-related compensation.
2.5. Remuneration report for the 2022/23 financial year INTRODUCTION
A general overview of the company’s performance and the main environmental factors, relevant events, developments and decisions that have influenced this can be found in the management report (pages 25-41).
REMUNERATION OF THE CEO (CHAIRMAN OF THE MANAGEMENT COMMITTEE)
The remuneration paid directly or indirectly to the CEO in financial year 2022/23 comprised:
(1) The CEO benefits from a supplementary pension plan. This supplementary pension plan is of a defined contribution type, with Colruyt Group paying an annual contribution of 18% of the basic remuneration.
(2) Other components consist solely of a flat-rate expense allowance. This is not included in the above table.
CORPORATE GOVERNANCE | Governance, supervision and management • Sustainable corporate governance • Share ownership
Fixed Group insurance Variable 58% 31% 10% Basic remuneration EUR 751.137 Variable remuneration in cash EUR 402.765 Contributions paid for group insurance (1) EUR 135.205 Other components (2) EUR
Total EUR
7.920
1.297.029
134
The basic salary was increased by 3,58% as of the 2022/23 financial year. The increase is entirely due to indexation. This indexation is equal to the indexation implemented for Joint Committee 200 in January 2022. This joint committee defines the applicable indexation once a year in January.
The variable remuneration in cash for services in financial year 2021/2022 and paid out to the CEO in financial year 2022/23 dropped by 38,2% in comparison to that paid in financial year 2021/22.
The lower variable remuneration is due to the extent to which the collective target, EBIT ratio, was not achieved for financial year 2021/22. Variable pay did not fall proportionately as much as the collective performance criterion, operating profit, because of, on the one hand, the granted individual variable pay component and, on the other, the increase in basic salary due to indexation. Allocation of the individual variable compensation component is in line with the remuneration policy. The individual performance criteria in terms of strategy, sustainable value creation and succession planning were, as in the previous financial year, positively assessed given the achievement of predefined objectives.
The pay ratio within Colruyt Group is 2,34%. This is the ratio of the lowest Belgian salary in the group to the CEO’s salary. When using the average salary for the comparison, this pay ratio is 3,42%. The pay ratio increased significantly compared to financial year 2021/22. This is due to:
- On the one hand, the decrease in the CEO’s total package because of the decrease in variable pay, and on the other hand - The general increase in workers’ pay through indexation because of high inflation.
It should be noted that, as in previous years, the CEO’s remuneration (under his service contract) is taken here as the cost of the package, while for employees this is the gross pay excluding employer’s social security contributions. In this calculation, we have included only employees in Belgium who worked continuously for a full year during the 2022/23 financial year.
REMUNERATION OF THE OTHER MEMBERS OF THE MANAGEMENT COMMITTEE
We list the changes in composition and responsibilities of the Management Committee that occurred during financial year 2022/23:
• Marc Hofman transferred his responsibilities as COO Food Retail as of 1/4/2022 and has not been a member of the Management Committee since then.
• Jo Willemyns assumed these responsibilities on the Management Committee as COO Food Retail & Marketing Services as of 1/4/2022
• Stefan Goethaert assumed responsibilities on the Management Committee as COO Fine Food, Business & Group Services as of 1/4/2022
• Jef Colruyt assumed additional responsibilities as COO Non-Food, Real Estate & Energy & Corporate Services on the Management Committee as of 1/4/2022.
• Dieter Struye had been a member of the Management Committee as General Manager Non-Food Retail since financial year 2017/18. He will no longer serve on the Management Committee as of 1/2/2023.
The remuneration paid directly or indirectly to the other members of the Management Committee in financial year 2022/23 comprised overall:
(1) This basic remuneration also includes the remuneration granted to the General Manager Non-food (Dieter Struye) following the termination of the cooperation on 31 January 2023.
(2) The members of the Management Committee benefit from a supplementary pension plan. This supplementary pension plan is of the defined contribution type, with Colruyt Group paying an annual contribution of 18% of the monthly salary x 13,92. This amount includes additional individual pension commitments.
(3) Other components consist solely of a flat-rate expense allowance. The members of the Management Committee are also entitled to other benefits, such as disability insurance, hospitalisation insurance and a company car. These are not included in the above table.
These figures show the remuneration in gross amounts for a complete financial year.
All Management Committee members included in the overview above are salaried persons. Social security contributions are paid by Colruyt Group on their gross salaries. Total basic remuneration increased 10% over last financial year. Underlying this, the fact that Marc Hofman was no longer a member of the Management Committee as of financial year 2022/23 is offset by the termination of the collaboration with Dieter Struye in the last quarter of the financial year. The basic remuneration of the other members of the Management Committee increased by just over 10%, mainly explained by the statutory indexation of the basic remuneration due to high inflation.
The variable remuneration covers payment for services rendered to the group during financial year 2021/22. Compared to the last financial year, the number of Management Board members on which the figures are based remained stable. We saw a sharp decline in the collective performance criterion, operating profit, for financial year 2021/22, resulting in a decreased variable remuneration. Variable pay did not fall proportionately as much as the collective performance criterion, operating profit, because of, on the one hand, the granted individual variable pay component and, on the other, the increase in basic salary due to indexation.
The decrease in employer contributions for the group insurance of members of the Management Committee, despite inflation, is due to the decrease in the number of FTEs in the Management Committee, with Marc Hofman’s responsibilities being redistributed among other members of the Management Committee. The same factor also explains the decrease in flat-rate expense allowances granted to members of the Management Committee during financial year 2022/23.
135 CORPORATE GOVERNANCE | Governance, supervision and management • Sustainable corporate governance • Share ownership
Fixed Group insurance Variable 65% 26% 9% Basic remuneration (1) EUR 3.747.585 Variable remuneration in cash EUR 1.500.885 Contributions paid for group insurance (2) EUR 544.603 Other components (3) EUR 38.339 Total EUR 5.831.413
INFORMATION ON SEVERANCE PAYMENTS
Managers who are members of the Management Committee and bound to their employer by employment contracts have no individual contractual claims with respect to Colruyt Group regarding their severance payment.
EVOLUTION OF THE REMUNERATION OF CEO AND MANAGEMENT COMMITTEE MEMBERS AND OF THE PERFORMANCE OF COLRUYT GROUP
FY 2020/21 vs FY 2019/20
FY 2021/22 vs FY 2020/21
section under SDG 13 - Climate Action in the annual report for financial year 2022/2023.
(3) This is based on the total remuneration as stated in the consolidated annual report divided by the total number of FTEs.
As mentioned in footnote (1), we work with the accumulated salary in the above table.
The basis for this is that the variable remuneration paid in financial year 2022/23 is determined on the basis of performance in financial year 2021/22. This approach simplifies comparison between the group’s results and the remuneration paid. In this way, the total remuneration stated above for financial year 2021/22 consists of the fixed salary, contributions to group insurance and other components received in financial year 2021/22, supplemented by the variable pay received in financial year 2022/23.
EMOLUMENTS RECEIVED IN 2022/23 (1)
Korys NV
(with permanent representative Dries Colpaert) (2) EUR 47.000
Korys NV
(with permanent representative Griet Aerts) (3) EUR 47.000
Korys Business Services I NV
(with permanent representative Hilde Cerstelotte) EUR 94.000
Korys Business Services II NV
(with permanent representative Frans Colruyt) EUR 94.000
Korys Business Services III NV
(with permanent representative Wim Colruyt) EUR 94.000
Korys Management NV
(with permanent representative Lisa Colruyt) (4) EUR 47.000
Total Remuneration (1)
CEO 4,34% -14,33%
Senior management 14,94% -13,27%
Variable pay (1)
CEO 3,14% -38,21%
Senior management 2,60% -29,61%
Performance Colruyt Group
EBIT margin -0,07% -1,53%
Social added value
Employment FTE 7,34% 0,07%
CO2 per million EUR sales (tonnes) (2) -18,14% -1,02%
Food donated to social organisations (tonnes) 5,68% 24,82%
Average pay FTE Colruyt Group (3)
Wage mass / FTE 0,05% 4,44%
(1) For the calculation of total remuneration and variable remuneration, we operate here with the accumulated salary. This means that we always take into account the variable remuneration paid in year X+1, which was accumulated in year X.
(2) The method used to calculate greenhouse gas emissions (incl. CO2) was adjusted for the past and present. We refer for more detail to the Corporate Sustainability
The variable remuneration in cash for services in financial year 2021/2022, paid out in financial year 2022/23, dropped sharply in comparison to that paid in financial year 2021/22. The lower variable remuneration is primarily due to the decrease in the financial year 2021/22 EBIT ratio compared to financial year 2020/21. The EBIT ratio is the basis for collective variable remuneration. Consequently, we see, for both the CEO and other Management Board members, a decrease at the level of total remuneration.
Average remuneration per FTE increased during the past financial year because of high inflation and related index increases combined with a more or less stable number of employees.
In addition to financial results, Colruyt Group focuses strongly on the creation of social added value and sustainability. We refer to the Corporate Sustainability section for more details on the sustainability objectives and results achieved.
REMUNERATION OF MEMBERS OF THE BOARD OF DIRECTORS EMOLUMENTS
All directors of the group receive emoluments as payment for their mandates. On the advice of the Remuneration Committee, the Board of Directors decided to keep the directors’ individual emoluments for financial year 2022/23 at the same level as the previous financial year.
Thus, in financial year 2022/23, the members of the Board of Directors received the following emoluments:
Jef Colruyt (Chairman) (5) EUR 282.000
7 Capital SRL (with permanent representative
Chantal De Vrieze, independent director) EUR 94.000
Fast Forward Services BV (with permanent representative
Rika Coppens, independent director) EUR 94.000
Dirk JS Van den Berghe BV (with permanent representative
Dirk Van den Berghe, independent director) EUR 94.000
TOTAL EUR 987.000
(1) Gross amounts on an annual basis.
(2) Directorship ended after the General Meeting of 28 September 2022.
(3) Directorship commenced after the General Meeting of 28 September 2022.
(4) Directorship commenced after the General Meeting of 28 September 2022.
(5) On 1 January 2020, Jef Colruyt, as a natural person, assumed the chairmanship of the Board of Directors.
OPINION FROM SHAREHOLDERS
In accordance with Article 7:149 of the Belgian Code on Companies and Associations, we inform you that the previous remuneration report as part of the annual report for the 2021/22 financial year was presented at the General Meeting of Shareholders of 28 September 2022, and was approved by 86,08% of those present and shareholders represented by proxies. The Remuneration Policy was approved by 91,70% of votes at the Annual General Meeting of Shareholders on 29 September 2021 and is valid for four years.
CORPORATE GOVERNANCE | Governance, supervision and management • Sustainable corporate governance • Share ownership 136
3. Risk management and internal controls
3.1. Risk philosophy
Colruyt Group aims to pursue a policy of sustainable entrepreneurship. In practice, this policy is converted into the strategic and operational objectives of the group and of each division within the group. Colruyt Group’s activities are exposed to a number of internal and external risks, or uncertainty factors that may affect the group’s ability to achieve these strategic and operational objectives.
The Group believes that risk management should be an integral part of the organisation’s culture . Thus, it creates an environment in which people are motivated to recognise and deal with risks with the necessary transparency.
The Group as a whole has a low to medium risk appetite, while each business unit within the Group has its own risk appetite in line with its objectives.
The Group’s risk management focuses on the one hand on risk awareness and on controlling and/or limiting the most serious risks or threats, while also giving room to take manageable risks in pursuit of strategic objectives.
Controlling these strategic risks is a core task of each member of the Management Committee, within their domain of responsibility. To assist management, the group has set up a series of risk management systems with the aim of providing reasonable certainty in the following domains:
• realisation of strategic objectives
• protecting the health and safety of consumers and staff
• safeguarding the reputation of Colruyt Group and its brands
• effectiveness and efficiency of business processes
• reliability of financial reporting
• compliance with applicable laws and regulations
• monitoring the impact of Colruyt Group on its environment
This section of the annual report covers the main features of these systems. The principles enshrined in the COSO and ISO reference frameworks have served as a source of inspiration for the group in setting up these risk management systems.
3.2. Components of risk management and internal control systems
3.2.1. Governance
The Board has overall responsibility for monitoring risks and maintaining a robust system of risk management and internal control. The Board recognises the importance of identifying and actively monitoring market, strategic, operating, financial and compliance risks and other longer-term threats, trends and challenges to the company. The Audit Committee supports the Board of Directors in risk management and is responsible for assessing the effectiveness of risk management and internal control processes throughout the year.
Members of the Management Committee are responsible for day-to-day risk management within their respective business units. Management Committee members thus identify, together with their respective teams, key and emerging risks and ensure their internal follow-up and monitoring. In addition, the Management Committee focuses on evaluating proposed risk management strategies, as well as the design, implementation and evaluation of internal control.
3.2.2. Risk management process
A. BACKGROUND AND OBJECTIVE
Colruyt Group has developed a group-wide risk management system based on the principles of Enterprise Risk Management (ERM) under the name of ‘CORIS’ (Colruyt Group Opportunity & Risk Management). The main objectives are to increase the risk awareness of management and to draw up an inventory of the risks to which the group and its subsidiaries are exposed, with a view to controlling them.
We want to encourage our employees to take controlled risks, especially as entrepreneurship is based on conscious risk-taking. All group operating units have gone through the C process described below, and update this on a regular basis.
B. RISK CULTURE
Colruyt Group applies an integrated risk management approach based on the ‘three lines of defence model’. This model determines how specific responsibilities can be assigned within the organisation to achieve Colruyt Group’s objectives and manage the associated risks. This approach contributes to strengthening the risk culture, taking responsibility for the management of risk and internal control, and further optimising and integrating independent control functions (risk management compliance, internal audit).
First line - ownership and management of risks and their control: The company itself is responsible for all the risks emanating from its own processes and must ensure their identification and effective controls. In this area, the company ensures that proper controls are in place, that the company’s selfassessment is of sufficient quality, that adequate risk awareness exists, and that sufficient resources are assigned to risk issues.
137 CORPORATE GOVERNANCE | Governance, supervision and management • Sustainable corporate governance • Share ownership
Risk management is an integral part of the Group’s operations. It ranges from day-to-day financial and operational management - including the four-eye principle -, the analysis of new investment cases to the formulation of strategy and objectives.
Risk management is thus the responsibility of all levels of the organisation, with different responsibilities at each level.
Second line - continuous monitoring of risks and their control: These functions provide support to the business and management by applying expertise and making independent judgements of the risks faced by Colruyt Group. These functions provide assurance that the business itself (through first-line management) is in control of its risks. Naturally, primary responsibility still lies with the first line.
Third line - provision of an independent audit system: Internal Audit can be understood as an independent assessment function embedded in the organisation and tasked with investigating and evaluating the proper functioning, effectiveness and efficiency of Colruyt Group’s processes, procedures and activities. This may cover areas such as operating processes, financial transactions and compliance with applicable accounting and other regulations and management. Through this independent review, Internal Audit provides assurance to the Audit Committee on the operational effectiveness of the first- and second-line risk management and internal control processes. In addition, the risk management function is evaluated once a year by an independent consultant, with the results presented to the Board of Directors.
C. PROCESS AND METHODOLOGY
The entire group is divided into Operating Units (OUs). Each operating unit must go through the following process steps in a structured manner. This process is also performed at Colruyt Group level.
A risk coordinator is appointed for each operating unit, tasked with providing support to the risk owners. Moreover, a knowledge-sharing network spanning Colruyt Group ensures that risk management is kept alive within the organisation.
1. Risk identification
Evaluate Plan Mitigate
owner who is responsible for the design and implementation of action plans.
Critical risks should be avoided as much as possible; if not possible, mitigation plans should be provided immediately. High risks must be accompanied by an action plan. Moderate risks should be monitored periodically, with action plans implemented if necessary. Low risks are generally accepted; quick wins may be implemented.
All risks are recorded in the risk log of the operating unit concerned, specifying any relevant KRIs (Key Risk Indicators).
4. Risk monitoring
The risk owner is responsible for monitoring action plans and for reassessment. They report on this at least once a year to the management team of their assigned risks.
Risk identification is done on a regular basis in preparation for OUs’ new strategic plans. The evolution of the risks already identified and any new risks arising internally or as a result of changes in the outside world are reviewed on an annual basis. Every major incident is also analysed with a focus on its possible recurrence and then included or not as a risk in the risk log.
2. Risk assessment
After each risk identification, the risks are assessed. This assessment involves mapping out the causes and consequences of a risk. Taking into account the effectiveness of the control measures introduced, the risks are scaled according to likelihood and impact. The impact scale is based on the risk appetite established in consultation with the respective operating unit and with the Board of Directors for the group. In order to assess the scale of the impact, four impact criteria are used: economic impact, reputational impact, and the impact on the health and safety of both consumers and employees.
Reputation is interpreted here very broadly as the response of all possible stakeholders, whether consumers, employees, shareholders and suppliers, or local resident or interest groups.
3. Risk management
A risk matrix is then created for each operating unit based on the risk scores, with risks divided into critical, high, medium, low and insignificant categories. Each risk is assigned to a risk
5. Internal & external risk reporting
The entire process is coordinated and facilitated by the Risk and Compliance department, in consultation with the Management Committee. Reporting takes place on a quarterly basis to the Management Committee and, via the Audit Committee, to the Board of Directors. The members of the Management Committee are instructed to include risk management as an explicit chapter in their periodic activity reports.
The highest Colruyt Group risks are documented annually in the annual report. This contains an overview of the risk factors specific and important to Colruyt Group with their description and a brief overview of the management measures already in place to mitigate this risk. This is both for global risks and specifically for the sustainability risks we have identified.
CORPORATE GOVERNANCE | Governance, supervision and management • Sustainable corporate governance • Share ownership
Identify
138
3.2.3. Measures regarding risk management and internal controls
A. MAIN RISKS AND MANAGEMENT MEASURES OF COLRUYT GROUP
The main risks relating to Colruyt Group’s operations are reflected in a risk universe divided into five categories:
• strategic risks: such as market dynamics, governance, planning and the allocation of resources, major initiatives, acquisitions and communication
• financial risks: these comprise risks associated with the financial markets (interest rates, currencies, commodities), liquidity and loans, capital structure, accounting and financial reporting
• operational risks: these cover marketing and sales, purchasing, stocks and production, people and organisation, information technology, fixed assets and theft
• legal risks: rules of conduct (ethics, fraud), legal risks and regulations
• risks of force majeure: natural disasters, fires, acts of terrorism and power cuts
Risk Why is this a risk for us?
Data and digitisation risk
What are our mitigating actions?
STRATEGIC RISKS
Colruyt Group is committed to constantly updating its data systems and their use. The group's history and specific structure mean that IT changes frequently involve heavy expenditure. In the past, we largely self-managed our applications. These evolved at their own pace, not always in step with the outside world. We are now converting to new systems, but integrating with our existing systems is intensive work. This also demands that the organisation consciously deploy time and money in all the various projects it wants to carry out.
In addition, the world is becoming increasingly digital and we want to continue to work to evolve with the times and to use digital resources where this can help us and our employees. This is necessary to remain relevant to our customers.
Relevance risk Our customers are constantly evolving. Colruyt Group wants to constantly stand out from the competition with its brands in order to continue to attract our target group (customers). We do this with our various store formats and our brands (products we offer of which we are the producer/exclusive distributor).
On top of this, consolidation in the food retail industry is likely to continue due to increased competition from larger companies.
The sector in which the group operates is also exposed to changing consumer behaviour. In the event of a significant demographic change and/or if the Group fails to anticipate or identify changes in consumer preferences or trends or to respond to them in a timely manner (e.g. by quickly offering new and improved products), this may result in reduced demand for the group's products and adversely affect our sales.
The current economic and energy crisis is putting further pressure on consumers' purchasing power. This may lead to a decrease in the share of customer spending in the group’s stores. Changing consumer behaviour may also require the Group to adjust its existing product range or add new products in order to maintain or increase sales.
Risks related to market dynamics
An important strategic risk of Colruyt Group relates to trends in consumer spending and cost inflation. Given the group’s aim to guarantee in its Colruyt stores the lowest prices on the market, competitors’ actions and the economic impact of the geopolitical situation can affect the group’s profitability. While Colruyt Group's share of the retail market has remained stable in recent years, this market remains highly competitive.
Colruyt Group continuously attaches importance to data and digitisation skills, for all group employees, both in the business and in our IT and Data & Analytics departments This takes the form of e-learning the basic digital skills that we expect of 8.000 of our employees.
We have invested in a major project to make data available faster and more efficiently, which we will now be converting into value.
The organisation is questioned about the strategic needs for data and digitisation. We continue to canvas our customers about their needs, and remain committed to digital evolution.
Phygital is one of the biggest changes in our strategic plan.
We continuously focus on both our store formats and our brands. We continue to ask what customers’ expectations are and how we can fulfil them.
Every 2 years, we undertake a detailed analysis of customer needs, behaviour, our reputation,... From this we derive the objectives that we need to apply at customer, store format or brand level so as to remain relevant to our customers.
In this way, Colruyt Group is responding to changing customer needs with innovative digital concepts and services such as Okay Direct, the first self-service store where customers can shop completely autonomously 24/7, as well as the option of home deliveries via Collect&Go in densely populated cities like Brussels and Antwerp. However, anticipating consumer trends and preferences requires research, development and marketing initiatives.
With our departments continuously scanning the market and communicating with the management team, the group makes sure that it is aware as quickly as possible of market trends that are ahead of us or are becoming reality. We make sure we anticipate this as well as possible in the various parts of the organisation. Colruyt Group is therefore constantly looking to implement efficiency improvements and, where necessary, to question its cost structure.
139 CORPORATE GOVERNANCE | Governance, supervision and management • Sustainable corporate governance • Share ownership
Risk of physical climate change
STRATEGIC RISKS (CONTINUATION)
The impact of climate change is already visible today, also in our group. Special attention must be paid to physical impacts (e.g. heavy rainfall, persistent heat, ...) that could interrupt Colruyt Group’s critical operational processes. A recent extensive risk analysis with scenarios up to 2050 once again confirmed that we have this risk well under control for the time being and that the existing adaptation solutions are indeed effective. However, especially when it comes to climate, it will be important to continue to carefully monitor the risk and adjust our approach where necessary.
A thorough climate assessment has been made; from this we conclude that none of the risks associated with climate change leads to a relatively high risk level for the business impact or the asset value of Colruyt Group.
Flooding appears to carry the highest level of risk. We provide the necessary monitoring for this and have already drawn up corresponding risk management and business continuity plans.
Further details can be found on our website: https://www.colruytgroup.com/en/sustainable-entrepreneurship/our-12-sites/ atmosphere.
On the basis of studies and regular evaluations of adaptation measures, we work on specific local as well as overarching measures. Business continuity plans are drawn up and regularly updated.
We are working on new adaptation measures like additional water buffer capacity, adequate water drainage and/or collection and extra cooling in critical installations so as to be in a position to confront current and future physical climate risks. Adaptation solutions have been implemented against physical impacts of climate change (storm, heat, flooding, ...), e.g. cooling of data centres, water buffers, insulation, ...
Supply Chain climate risk
The impact of climate change, but also biodiversity loss, is becoming increasingly tangible today. This impact is also manifested in the Colruyt Group value chain. With a view to the long term, we are keen to anticipate in good time the challenges in this direction and in particular for our supply chains. In other words, climate change and biodiversity loss represent risks that must be monitored and mitigated in order to guarantee the continuous supply of products in our stores at the right price into the future. Maintaining the necessary flexibility in our purchasing processes appears to be of great importance here.
We already spread our suppliers for our food products, today mainly for economic reasons, but also to limit ecological and geopolitical risks.
Our own brands allow us to easily switch suppliers in case of supply problems.
Our involvement in product chains can vary. First of all, we opt for the local delivery of products. In this way, we have greater impact on improving production and distribution conditions. Despite our own willingness to invest in sustainability, there is a risk of receiving insufficient support from other actors in the value chain.
We prefer products that are certified with a focus on good management and restoration of existing ecosystems.
We are committed to new and long-term collaboration models in existing and new production chains. (cf. Smart Farming).
We have a purchasing branch in Asia, which makes it easier to get in touch with local suppliers.
We are planning a study of climate-sensitive sourcing areas, which will help us anticipate potential supply issues.
FINANCIAL RISKS
Liquidity risk Colruyt Group maintains its long-term focus and will continue to invest in a targeted manner in sustainability and efficiency, digital transformation and innovation, employees and private-label products. This may require the group to raise financing on debt and capital markets. The macroeconomic context, evolving interest rates, but also changing investor expectations (e.g. with regard to sustainability) result in a continuously changing risk. The level of the group's outstanding financial debt may affect its ability to issue new debt or securities or borrow additional funds. In addition, changes in interest rates may affect the group's financial position, in particular with regard to possible future financing agreements at variable interest rates. Should Colruyt Group fail to raise new financial resources for reasons of creditworthiness or macroeconomic conditions, the risk exists of it having insufficient financial resources to invest and consequently to implement its longterm strategy.
Staffing risk
In February 2023, Colruyt Group raised EUR 250 million in new financing through a green retail bond. We also signed a EUR 530 million credit facility, which will allow us to borrow under this facility at any time. In addition, an intensive working capital exercise was held at group level.
OPERATIONAL RISKS
The loss of management and other key personnel or the failure to attract and retain qualified personnel can adversely affect the ability to successfully execute the business strategy and remain competitive. Human capital is an important business asset.
To achieve our objectives, we depend largely on the experience, commitment and skills of the employees and the management team.
The group may experience difficulties in recruiting and retaining suitable employees, particularly in the current difficult labour market, both for expanding operations and for replacing departing employees.
Our organisation is committed to estimating its short, medium and long-term personnel requirements. On the basis of these forecasts, actions are taken to obtain and retain the right people. Examples of actions: training for specific profiles that are proving difficult to find on the labour market, structuring certain services to allow us to do the work with the current employees, focusing on retention,...
We are also focusing on the culture of personal growth: growing in the current position and growing into the next position. HR supports this with an overview of action plans available for managers to use for each employee in their service.
We are also constantly looking for ways to acquire hard-to-find profiles or to adapt our organisation as best we can to minimise the need for these profiles.
CORPORATE GOVERNANCE | Governance, supervision and management • Sustainable corporate governance • Share ownership
140
Bargaining power risk
Product liability risk
OPERATIONAL RISKS (CONTINUATION)
In the changing context, our position as Belgian market leader is less and less relevant. All our competitors are international companies with turnovers up to 10 times those of Colruyt Group. We are also seeing concentrations in the supplier market, both in brands and in Private Label. With fewer decisions taken in Belgium, Colruyt no longer ranks first in the distribution of budgets.
The manufacture, packaging and sale of goods for resale may involve product liability risks and obligations to take back and/or replace goods. The group is exposed to risks related to accidental or malicious product contamination, food spoilage, the availability and cost of product liability insurance coverage and the potential cost and disruption involved in product withdrawals and recalls.
The risks of food contamination and spoilage exist at every stage of the production cycle: from the purchase and delivery of raw materials to the production, packaging, transport, storage and delivery processes.
Products can be soiled, contaminated or defective and still be unintentionally distributed by the group. The large number of products sold and their nature (such as fresh or frozen products) increase Colruyt Group’s exposure to this risk.
As a result, the group may be exposed to product liability claims. Even if such claims are unsuccessful, Colruyt Group may still suffer reputational damage.
Health and safety risks
By the very nature of their activities, employees are exposed to all kinds of situations that can result in occupational accidents or damage to their health.
Data transparency risk associated with sustainability
To effectively make the value chain more sustainable together with our business partners, increased transparency, reliable information and the processing of that information are crucial. As a retailer, for Colruyt Group, this involves a multitude of raw materials and product chains. Collecting, managing and analysing the relevant information is a major challenge in our sector, which is heavily dependent on other actors further along the chain.
This is requiring us to organise ourselves differently, internally and externally. We secure our position by offering the right partnerships, excellent services and strong negotiation skills at all brand layers and for all categories.
Colruyt Group is actively involved in product and process quality, with a focus on the food and product safety of the products on its shelves.
For this, our food and product safety is continuously monitored and analysed, including an active focus on quality standards, certifications, norms and controls.
Food Defence, Food Fraud and Food Safety Culture are also conscious points of attention.
In addition to the internal policy, agreements for permanent quality monitoring are also worked out with suppliers. The group also has insurance against the risks of product liability and recalls.
The group strives to avoid health and safety incidents as much as possible through extensive safety and prevention programmes.
We pro-actively work to minimise absence from work, with particular attention to reintegrating long-term sick employees in a sustainable way.
The risks associated with occupational accidents and obligations towards personnel are covered by insurance policies with external insurers.
The Sustainability domain is working on an information system to collect and process as much data as possible. Footprinting (life cycle assessment) calculations are made with secondary data (based on assumptions). In collaboration with suppliers, we want to be able to link this data to their own data.
The Business Partner domain is working hard on linking suppliers’ sustainability initiatives to our objectives to clarify the contribution to our objectives.
The Purchasing Direct Goods domain provides insight into the product categories and the corresponding sustainability risks (e.g. CO2, water, forced labour, ...) so that buyers know the environmental impact aspects they need to be aware of for their particular categories.
We are constantly making our private-label products more sustainable.
Here too, we focus on measuring and mapping in order to make progress.
Changing sustainability risks in the chain
To make our own activities and our products more sustainable, we work closely with numerous large and smaller business partners. They too are confronted with new standards or realities. Taking these into account Is is not always obvious for them either. From our market leader position, we are keen to initiate a positive spiral and dialogue for the benefit of the entire chain. For this, collaboration with our business partners is absolutely crucial. Only in this way can we really make a difference.
Supply risk
Clear roles and responsibilities for sustainability are introduced in our purchasing department to ensure that the necessary actions are taken and processes adapted and installed.
We are continuing to dialogue and work together with our suppliers (including supplier days).
Together with our suppliers we are examining how they can adapt to the new standard.
Sustainable transport goals have already been agreed with our partners.
The group’s sustainability objectives, undergirding the entire collaboration, have been defined.
FORCE MAJEURE RISKS
The continuous supply of our distribution centres and stores is essential to be able to service our customers and to achieve our profit objectives:
Colruyt Group may be faced with interruptions in the delivery of goods to distribution centres and stores, but also with unavailability or inaccessibility of distribution centres. This may lead to a higher cost of replacement goods and may have an impact on customer spending and the number of customers in the stores, which may affect the continuity of the group’s activities.
The continuous supply of goods to distribution centres and stores is vital to achieving performance targets. If a supplier is temporarily or permanently unable to deliver goods, we may experience operational disruptions. Replacement goods may be more expensive than the originally needed goods. In such case, we will not be able to pass on these cost increases to the customers, certainly not in the Colruyt stores given the strategy of guaranteeing the lowest prices on the market.
To reduce supply risks, the group strives for transparent long-term relationships with all its suppliers. Moreover, no single supplier has a dominant position that could jeopardise the supply process. Finally, scarcity or supply problems can be cushioned within the network of the AgeCore purchasing association. In addition, the unavailability or inaccessibility of the distribution centres can also have a significant impact on the continuity of our activities. In order to mitigate this risk as effectively as possible, the group has introduced the required continuity programmes and contingency measures.
141 CORPORATE GOVERNANCE | Governance, supervision and management • Sustainable corporate governance • Share ownership
FORCE MAJEURE RISKS (CONTINUATION)
IT risk A failure in the IT systems can negatively impact our business and reputation. The group is highly dependent on infrastructure, networks, operating systems, applications and databases. These relate, among other things, to cash register systems, payment terminals, logistics programs, inventory management systems and financial systems.
These IT systems may be subject to damage or unexpected disruptions from security breaches, computer system or network failures, fire, flood, storms and other natural disasters, power outages, operator negligence, physical or electronic loss of data, telecommunications failures, vandalism or other extraordinary events.
Failure of these systems can lead, for example, to incorrect inventory determinations with consequent shortages in the stores, incorrect prices, the inability to collect electronic payments and the inability to identify customers.
LEGAL RISKS
The group seeks to safeguard the continuity of data processing by means of various mirror and back-up systems, continuity planning and contingency scenarios. By monitoring all systems 24/7, we try to detect problems and/or possible risks as quickly as possible.
In addition, the group invests in various transformation programmes and projects to renew and strengthen its current infrastructure. Disaster recovery and business continuity play an important role here.
We keep our systems up to date through maintenance and upgrades. In this way we remain supported and also eliminate security risks.
To ensure the availability of all our IT systems, we have the necessary processes in place to avoid disruptions in the event of changes.
Regulatory risk
Colruyt Group is subject to the laws and regulations that apply in each country where it operates, as well as to the laws and regulations emanating from the EU. These laws and regulations are becoming stricter and more complex and are changing faster and more often than before. Compliance with those laws and regulations may result in additional costs or investments, which may adversely affect our ability to develop our business.
Moreover, given the high degree of complexity of this legislation, there is a risk that the issuer/bank inadvertently violates certain regulations. Violations of these laws and regulations can lead to fines, criminal sanctions against the group, the cessation of certain business activities, the introduction of compliance programmes and a ban on Colruyt Group’s business operations.
Changing laws and regulations may also require us to invest further in potentially expensive administrative or other processes.
Information & privacy risk
Colruyt Group uses information and communication technologies that are typically subject to data security risks, such as confidentiality, availability and integrity.
The group may obtain sensitive personal data from customers (e.g. in the context of Xtra regarding their purchasing behaviour, intolerances and dietary preferences). Any inadvertent disclosure of personal data may lead to damage and reputational risks.
Colruyt Group maintains a continuous watch for potential new laws and regulations, and assesses their potential impact on our organisation, in order to make conscious choices and to manage our regulatory risks once they are implemented.
Colruyt Group focuses on mirror and back-up systems, continuity planning and emergency scenarios. On top of this, the group invests in transformation programmes and projects to update and strengthen the current infrastructure, including disaster recovery.
In addition, Colruyt Group has appointed a DPO and has a privacy policy to consciously and transparently manage the privacy of customers, employees and other stakeholders.
We are committed to confidentiality of information (and classification) in order to be able to take appropriate technical measures.
Fraud
& bribery risk
Even at Colruyt Group, fraud and bribery-related risks are not inconceivable. Colruyt Group runs on its employees, and people can sometimes be tempted to overstep boundaries by, for example, accepting a bribe or stealing goods.
The group actively monitors the corruption risk in its Enterprise Risk Management (ERM) in the form of a fraud dashboard. This dashboard has been developed on the basis of 13 different fraud risks. For each risk the causes and consequences are analysed and the necessary control measures provided, with periodical monitoring.
The group disseminates the group values, policy frameworks and codes of conduct across the organisation. All employees take training on values perception and ethics.
New buyers sign an ethics charter, with explicit guidelines for gifts, hospitality benefits and screening of suppliers in high-risk countries.
Buyers switch jobs, product areas or business units regularly and there is a strict segregation of functions within the different steps of the purchase process.
Purchasing takes place centrally, with systematic application of the four-eyes principle.
Finally, buyers undergo continuous training, including mandatory compliance training and annual testing.
Risk
in respect of sustainability regulations
Sustainability legislation is gaining momentum, especially at European level. This can range from strict conditions that certain raw materials or products have to meet to extensive, standardised reporting obligations. Although Colruyt Group often endorses the underlying ambitions with conviction, the concrete implementation of this legislation in practice is not always clear, mainly because of the volume of this legislation and the speed with which it is being implemented.
We are in continuous proactive and constructive dialogue with our stakeholders and make sure we are always up to date with legislative developments.
The right governance and organisational structure must ensure that information flows smoothly and abreast with implementation, from strategic to tactical to operational level.
CORPORATE GOVERNANCE | Governance, supervision and management • Sustainable corporate governance • Share ownership
142
B. RISKS AND CONTROL MEASURES ASSOCIATED WITH THE NON-FINANCIAL REPORTING OF COLRUYT GROUP
Risks related to environmental matters
(SDG 2, 6, 7, 12 and 13)
More specific and mitigation-based approach: as a retailer, we have a major impact on the environment through the product chains. To keep this impact to a minimum, we dedicate a lot of effort to measuring and mapping. Increasing transparency appears to be a challenge for the entire food and non-food sector. A possibility exists that the actors in the chain will be unwilling or unable to share their data, or will pass on incorrect data. From our strategic position in the chain, we want to exert leverage by pointing to the importance of measuring, collecting and analysing the impact of each actor in the chain on the environment and on animal welfare.
In addition, we are taking steps to make the product chains and activities more sustainable in a systematic way. Our involvement in product chains can vary. First of all, we opt for the local delivery of products.
In addition, we are taking steps to make the product chains and activities more sustainable in a systematic way. Our involvement in product chains can vary. First of all, we opt for the local delivery of products.
In this way, we have greater impact on improving production and distribution conditions. Despite our own willingness to invest in sustainability, there is a risk of receiving insufficient support from other actors in the value chain. In addition, we are very much committed to new and long-term collaboration models in existing and new production chains. We prefer products that are certified with a focus on good management and restoration of existing ecosystems. There is a risk of our being unable to source sustainably in an optimal way owing to excessive dependence on one or a limited number of suppliers. With a lack of control on environmental and animal welfare matters, there is a risk of accidental environmental damage being caused by the group. As a result, we can suffer reputational damage and be perceived as an organisation that fails to realise its sustainability goals. Natural disasters caused by climate change can damage both supply chains and our own infrastructure. We provide the necessary monitoring for this and have drawn up risk management and business continuity
plans. In order to limit our impact on climate change and pollution, we are focusing, among other things, on greening the vehicle fleet and at the same time avoiding and reducing our energy consumption, and on renewable energy.
More information can be found under supply chain risk and supply chain climate risk.
Sustainability risks related to social affairs (SDG 2, 3 and 8)
More specific and mitigation-based approach: Colruyt Group is strongly anchored in the social fabric. Both through its own production and retail sites as well as through local and international supply chains. Local anchoring points to the importance of close contact with consumers, producers and site neighbours. Social unrest can arise from the activities we carry out. It is important to capture this in time and enter into dialogue. Supply chains involving foreign players are more difficult to control.
For example, social unrest can arise due to political and economic instability in countries from which products are supplied. There is a risk that goods can no longer be sourced or distributed locally. We have the necessary monitoring for this and have drawn up business continuity plans.
More information can be found under supply chain risk and supply chain climate risk.
Sustainability risks related to corruption and bribery
More specific and mitigation-based approach: in the field of corruption and bribery, Colruyt Group may run the risk of becoming involved in unwanted influence, conflicts of interest, non-objective pricing and subjective awarding of contracts. We monitor this risk within our Enterprise Risk Management. More information can be found under fraud and bribery risk.
Sustainability risks related to personnel matters (SDG 3 and 8)
More specific and mitigation-based approach: we seek to organise the work of all our employees in a safe and physically and mentally healthy way. Even so, risks of (occupational) diseases, occupational accidents and psychosocial risks are inherent to the company’s activities. The group therefore pays the necessary attention to ensure that the current jobs can be performed optimally with a view to physical and mental wellbeing. Important factors are the nature and meaningfulness of the work, as well as the degree of work pressure. We provide our employees with a wide range of training courses to broaden their professional competences or for further personal growth.
In addition, different types of social unrest among own employees may influence the objectives of the group. We are committed to maintaining a constructive social dialogue to manage this risk. Finally, with regard to personnel policy, we may experience difficulties in recruiting suitable employees.
Insufficient influx of properly trained and experienced staff, especially in shortage professions, can result in a lack of new insights and potentially jeopardise business continuity. We are therefore committed to offering a stimulating career policy and a supportive remuneration package.
More information can be found under the staffing risk and health and safety risk.
Sustainability risks related to human rights (SDG 8 and 12)
More specifically and mitigation-based approach: in a peopleoriented organisation, respect for human rights is always paramount. And that applies as much to our own employees as right along the value chain. The biggest challenge in terms of risk management lies here in monitoring compliance with human rights. Initially with regard to our own brands, but also in the product chains of the brands that we distribute as a retailer. When human rights violations by chain actors come to light, we run the risk of being held liable and suffering reputational damage. The group manages this risk, among other things, by working with suppliers of private-label products with the amfori BSCI Code of Conduct that subscribes to universal human rights principles.
143
CORPORATE GOVERNANCE | Governance, supervision and management • Sustainable corporate governance • Share ownership
3.2.4. Information and communication
In order to enable employees at different hierarchical levels of the group to perform their jobs properly and to assume their responsibilities, the group has extensive and intensive information and communication flows. This ranges from transactional data used to support the completion of individual transactions, to operational and financial information with regard to the performance of processes and activities, from department to group level. The general principle that applies here is that employees receive the information they need to perform their work, while supervisors receive information regarding the elements on which they have an impact. The main control information concerns cockpit reporting on performance versus expectation for the main financial and operational KPI’s:
• financial scorecards: revenue, gross profit, wage costs, other direct and indirect costs and depreciation, EBIT and EBITDA
• operational reporting: detailed reporting on revenue, gross profit, wage costs, store contribution, store productivity
• project reporting for the purpose of project monitoring
3.2.5. Monitoring
The Board of Directors supervises the proper functioning of the risk management systems through the Audit Committee. For this, the Audit Committee uses the information provided by the external auditors as well as the interaction with the Risk & Compliance (Internal Audit) department. The latter reports on a quarterly basis on the activities performed and results.
Both external audit and the Risk & Compliance department assess the design and operation of the internal controls contained in processes and systems from their respective perspectives: for external audit this concerns the certification of the group’s financial statements, while for risk management the emphasis is on controlling process risks and their possible negative consequences.
Day-to-day monitoring is done by management itself based on supervision, analysis and follow-up of the information mentioned in the previous paragraph, the follow-up of exception reports and monitoring in the context of the CORIS programme (Key Risk Indicators). If necessary, corrective
measures are initiated. It is generally the process manager who performs these monitoring activities. In this regard, the financial controllers fulfil a reporting and advisory role with respect to the operational managers.
3.3. Risk management and internal controls regarding the financial reporting process
Late or incorrect reporting of financial figures can have a considerable impact on Colruyt Group’s reputation. In order to ensure the quality and timeliness of the financial figures produced and reported, the group has introduced the following management measures and internal controls:
3.3.1. Closing process
While the accounts are closed on a monthly basis, mainly for management reporting, the group financial figures are consolidated four times per year based on a formalised closing process. This process specifies the various steps with their respective timelines, the figures and other information to be supplied, as well as the roles and responsibilities of and the interaction between the different parties in the process. The process is monitored by a closing coordinator who has no further involvement in the process. At the end of each closure, the process is evaluated and adjusted if necessary. During the half-yearly and annual closure, the process also provides for coordination with external auditors at regular points in time. To support the closing process, a reporting manual has been prepared and introduced and an IFRS competence cell set up.
3.3.2. Monitoring of the quality of the figures supplied
The closing process passes through different departments such as Accounting, Financial Controlling, Consolidation and Investor Relations, the purpose of the last two being to provide information to the Board of Directors. Each department
performs quality control as a separate function, both on the figures obtained from the previous process step and on the self-produced figures. These quality controls mainly concern links (for example with the various ledgers), reconciliations (for example of accounts), alignment of financial reporting with management and operational reporting, variance analyses and validation rules (for example of consolidation flows and consolidated figures).
At the end of the closing process, the consolidated figures are analysed with respect to previous periods and fluctuations must be substantiated. The financial results achieved are also checked against the expectations in this respect. In the case of figures for publication, the printer’s proofs are aligned with the system figures provided. Lastly, there is a final check for validation by the financial management.
3.3.3. Communication of financial reporting
In order to communicate and publish information as transparently as possible, Colruyt Group publishes financial press releases on pre-agreed dates. The communication efforts of management also find expression via financial roadshows and regular telephone contacts, as well as actual visits by and with investors and analysts. Finally, analysts publish reports containing financial information about Colruyt Group at regular points in time.
CORPORATE GOVERNANCE | Governance, supervision and management • Sustainable corporate governance • Share ownership 144
Share ownershipColruyt shares and bonds
1. Calendar for shareholders
13/09/2023 Record date for depositing shares for participation in the annual General Meeting of Shareholders
27/09/2023 (16h00) General Meeting of Shareholders for the 2022/23 financial year 28/09/2023
10/10/2023
Dividend for financial year 2022/23 (coupon no. 13)
Cum dividend date (last trading day on which the stock including dividends is traded)
Ex-date (posting of coupons)
Record date (centralisation of coupons)
Payability
Certificates relating to exemption from or reduction of withholding tax on dividends must be in our possession
Extraordinary General Meeting Capital increase Etn. Fr. Colruyt NV reserved for employees of Colruyt Group (Art. 7:204 of the Belgian Code on Companies and Associations)
12/12/2023
13/12/2023
11/06/2024
Publication of consolidated half-yearly information for financial year 2023/24
Information meeting for financial analysts
Publication of consolidated annual information for financial year 2023/24
12/06/2024 Information meeting for financial analysts
31/07/2024
Publication of the Annual Report for financial year 2023/24
25/09/2024 General Meeting of Shareholders for financial year 2023/24
145 CORPORATE GOVERNANCE | Governance, supervision and management • Sustainable corporate governance • Share ownership
02/10/2023 03/10/2023 13/10/2023
29/09/2023
2. Dividend for financial year 2022/2023 (1)
At the proposal of the Board of Directors, the General Meeting may decide to allocate the distributable profit entirely or partially to a free reserve or to carry it forward to the following financial year.
The Board of Directors endeavours to have the annual dividend per share evolve in proportion to the changes in group profit. Although this is not a fixed rule, and subject to the company posting a positive result, at least one third of the economic group profit is paid out annually.
The Board of Directors therefore proposes that a gross dividend of EUR 0,80 be allocated to the shares of Etn. Fr. Colruyt NV participating in the profits of the 2022/23 financial year. Of the gross dividend of EUR 0,80, shareholders will receive a net amount of EUR 0,56, after deduction of 30% withholding tax.
Under current tax regulations, 30% withholding tax is due on income from movable assets such as dividends. The rate of withholding tax on dividends was originally 15%, but was subsequently increased several times, first to 21% and then to 25% and 27%. At the end of 2016, the standard withholding tax rate was raised one last time to 30% for dividends and interests granted or made payable from 1 January 2017 onwards. Since 1 January 2018, Belgian taxpayers - natural personscan annually recover the withholding tax withheld on certain dividends from their Belgian and foreign shares up to a limited amount via the personal income tax return (for the 2022 income year, a maximum of 240 euros in withholding tax on dividends can be recovered, equivalent to gross dividends of 800 euros). The amount of the net dividend for foreign shareholders may vary, depending on the double taxation treaties applying
between Belgium and the various countries. The necessary certificates must be in our possession by 13 October 2023 at the latest.
The dividend for financial year 2022/23 will be made payable as of 3 October 2023, against (electronic) submission of coupon no. 13 at the counters of the financial institutions. BNP Paribas Fortis Bank will act as the Principal Paying Agent for the dividends.
Since the stock market flotation in 1976, the Colruyt share has been split a number of times. The most recent split dates from 15 October 2010 when the share was divided by five. Since 15 October 2010 only shares with ISIN code BE0974256852 have been listed on Euronext Brussels. Referring to the Act of 14 December 2005 abolishing bearer securities, as amended by the Act of 21 December 2013, Colruyt sold its remaining bearer shares (in total 28.395 shares) on the regulated market of Euronext Brussels on 24 March 2015. As of 1 January 2016, persons who are still in possession of old paper Colruyt shares and who can demonstrate their capacity as shareholders of these documents, can obtain the exchange value in cash within the legal limits from the Deposit and Consignment Office. They can seek assistance from the issuer for the collection of dividends on these (sold) paper shares (with attached coupons), again within the legal limits.
CORPORATE GOVERNANCE | Governance, supervision and management • Sustainable corporate governance • Share ownership
Dividend yield Financial year 2022/23 (1) Financial year 2021/22 Financial year 2020/21 Gross dividend per share 0,80 1,10 1,47 Dividend yield 2,97% 2,93% 2,89% Payout ratio 51,0% 50,8% 48,0%
146
(1) Subject to the approval of the General Meeting of Shareholders of 27 September 2023
Colruyt share information
Market listing:
Euronext Brussel (since 1976)
Member of the Bel Mid index since 20/03/2023 (member Bel20 index until 19/03/2023)
Share ticker COLR
ISIN code
BE0974256852
As of 20 March 2023, Colruyt stock is no longer part of the Bel20, the leading Belgian stock index in which 20 stocks are listed, based primarily on free market capitalisation and the tradeability of the shares. The falling stock price is the main reason why Colruyt stock is no longer listed there. As of 20 March 2023, Colruyt shares are listed in the Bel Mid index, the index of Belgian stocks with medium market capitalisation.

Colruyt belonged to the Bel20 for 30 years and was the last remaining retailer there. Inclusion in this index was never an end in itself and has no direct impact on the value of Colruyt stock. As a group, we continue to work in a manner respecting people and the environment, maintaining our focus on the long term.
Change in Colruyt share price over the previous financial year
2022
2023
Change in Colruyt share price over the last five financial years
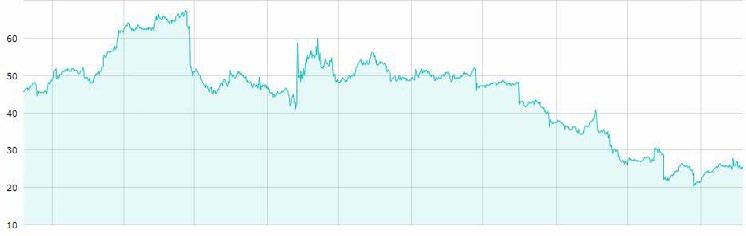
source: www.euronext.com
147 CORPORATE GOVERNANCE | Governance, supervision and management • Sustainable corporate governance • Share ownership
2022 2021 2020 2019
2023
3. Overview of Etn. Fr. Colruyt NV shares
At 31 March 2023, the Company’s capital amounted to EUR 370.171.405.73, fully paid up and represented by 134.077.688 shares without par value, which may be registered or dematerialised.
4. Bonds
On 8 February 2023, Colruyt Group announced an issue of fixedrate green retail bonds in the name of Etn. Fr. Colruyt NV for a total of EUR 250 million. The bonds are listed on the regulated market of Euronext Brussels over a five-year period until 21 February 2028. The bonds were issued in denominations of 1.000 euros at an issue price of 101,875%. The market price on 31 March 2023 was 1.010,60 euros per denomination.
Supported by the internally developed Sustainable Financing Framework, that governs sustainability in financing, the issue of this green retail bond allows Colruyt Group to continue its longterm investments, in particular those in sustainability, in a targeted manner, as well as to set up a diversified financing mix by optimally handling all possible interest and liquidity risks.
Colruyt Group will report annually, until full allocation and, if necessary, thereafter in the event of significant developments, on the allocation of the amounts equal to or equivalent to the net proceeds of these sustainable financing instruments. Depending on the evolution of expenditure on green investment projects, an initial report will be published no later than February 2024.
For more information, please refer to the prospectus on the company’s website under www.colruytgroup.com/en/invest/debt-financing.
(1) Situation on 9/06/2023 and 10/06/2022 respectively.
(2) Calculated on the basis of the number of shares participating in the profit, after deduction of the shares participating in profit owned by the company and subsidiaries.
CORPORATE GOVERNANCE | Governance, supervision and management • Sustainable corporate governance • Share ownership
Overview of changes 2022/23 Total number of shares at 01/04/2022 133.839.188 Creation of new shares following the capital increase reserved for employees on 19/12/2022 + 238.500 Total number of shares at 31/03/2023 134.077.688 Number of shares (1) 2022/23 2021/22 Ordinary shares 134.077.688 133.839.188 Shares participating in profit 134.077.688 133.839.188 Treasury shares - 6.687.980 - 4.845.853 Shares held by subsidiaries 0 0 Balance of profit-participating shares in June 127.389.708 128.993.335 Gross dividend 0,80 1,10 Net dividend 0,56 0,77 Profit 1,57 2,16 Calculation base (weighted average) (2) 127.967.641 shares 132.677.085 shares Market
Market price on 31 March 26,92 37,50 Highest price of the financial year (closing price) 40,89 52,02 Lowest price of the financial year (closing price) 20,37 34,16 Market value on 31 March (in million EUR) 3.609,37 5.018,97
price in Brussels (in EUR)
Issuer ISIN code Nominal amount Issue date Due date Annual gross return Etn. Fr. Colruyt NV BE0002920016 EUR 250 million 21 February 2023 21 February 2028 4,25% 148
5. Purchase of treasury shares
For several years, the Extraordinary General Meeting of Shareholders has authorised the Board of Directors of Etn. Fr. Colruyt NV to acquire its own shares (treasury shares). These acquisitions of shares take place in accordance with article 7:215 of the Code on Companies and Associations and in accordance with Articles 8:3 and 8:4 of the Royal Decree of 29 April 2019.
Purchases of treasury shares are carried out by an independent intermediary under a discretionary mandate, making it possible to purchase shares during both open and closed periods.
The Extraordinary General Meeting of Shareholders of 10 October 2019 decided to renew the aforementioned authorisation of the Board of Directors for a period of five years. In accordance with Article 8:4 of the Royal Decree of 29 April 2019, information on purchasing transactions executed is reported to the Financial Services and Markets Authority (FSMA), at the latest on the seventh trading day following the date of the transaction, and is published by the company simultaneously through a press release on our website www.colruytgroup.com.
Within the mandate granted by the Extraordinary General Meeting of 10 October 2019, Colruyt Group has repurchased a total of 3.169.026 treasury shares over the period from 1 April 2022 to 31 March 2023.
On 31 March 2023, Etn. Fr. Colruyt NV held 6.687.980 treasury shares. These represent 4,99% of the total number of issued shares (134.077.688) at the end of the reporting period.
In accordance with Article 7:217, § 1 of the Code on Companies and Associations, the Board of Directors decided that the dividend rights attached to the shares or certificates held by Etn. Fr. Colruyt NV continue to be suspended and lapse for the period that they are held. Consequently, no dividends are paid and the voting rights attached to these shares are also suspended.
149 CORPORATE GOVERNANCE | Governance, supervision and management • Sustainable corporate governance • Share ownership
During the reporting period 2022/23 Total treasury shares held at the start of the reporting period (01/04/2022) 3.518.954 Purchase of treasury shares in 2022/23 +3.169.026 Total treasury shares held at the end of the reporting period (31/03/2023) 6.687.980 After the reporting period 2023/24 Total treasury shares held at the start of the reporting period (01/04/2023) 6.687.980 Purchase of treasury shares in the period from 01/04/2023 to 09/06/2023 +397.921 Total treasury shares in our possession on 09/06/2023 7.085.901 Overview of treasury share purchases
6. Structure of share ownership
In the 2022/23 financial year, the following communications and transparency notifications were made, reflecting the evolution of the company’s shareholding structure.
6.1. Notice of an agreement to act in concert dated 26/08/2022 (Art. 74 Act of 1 April 2007 on public takeover bids)
On 26 August 2022, Korys NV, in the name of the parties acting in concert (Korys NV, Colruyt family and relatives and Colruyt Group), communicated an update of holdings in the company to the Financial Services and Markets Authority (FSMA).
The aforementioned parties had on that date entered into an agreement of mutual consultation pursuant to Art. 74 §7, paragraph 3 of the law of 1 April 2007 on public takeover bids.
Under the same law, an update of the holdings concerned must be communicated once per year at the end of August. The full letter can be found on our website colruytgroup.com/en/invest.
Shareholding structure based on the latest update following the notification of acting in concert dated 26/08/202
CORPORATE GOVERNANCE | Governance, supervision and management • Sustainable corporate governance • Share ownership
Parties involved Situation at 26/08/2021 Situation at 26/08/2022 Korys NV 68.812.959 71.323.770 Korys Investments NV 1.435.520 1.435.520 Sofina NV 2.332.064 0 Etn. Fr. Colruyt NV 2.828.421 6.244.505 Korys Business Services I NV 1.000 1.000 Korys Business Services II NV 1.000 1.000 Korys Business Services III NV 1.000 1.000 Stiftung Pro Creatura, foundation under Swiss law 146.755 146.755 Impact Capital NV 60.000 60.000 Natural persons (who directly or indirectly own less than 3% of the voting securities of the Company 8.527.097 8.532.134 TOTAL 84.145.816 87.745.684
As of 26 August 2022, the number of shares involved represented 65,56% of the total number of Colruyt shares.
150
6.2. Transparency notifications (Act of 2 May 2007)
Transparency notification of 27/03/2023 (Act of 2 May 2007)
In the context of the Act of 2 May 2007 and the Royal Decree of 14 February 2008 (disclosure of significant participations in listed companies), Korys NV, the Colruyt family and relatives, acting in concert, together with Colruyt Group, published a final notification of holdings on 27 March 2023. This transparency notification showed that the shareholders Korys, Colruyt family and relatives acting in concert together with Colruyt Group held a total of 89.657.320 Colruyt shares on 21 March 2023, representing 66,87% of the total number of shares issued by the company (134.077.688).
The denominator of 134.077.688 shares takes into account the capital increase reserved for Colruyt Group employees, for whom 238.500 new shares were issued on 19 December 2022.
The company has no knowledge of other agreements between shareholders. The statutory thresholds per 5% bracket apply. All transparency notifications are available on the website colruytgroup.com/en/invest/stakeholder-information.
Complete chain of controlled companies through which the holding is actually held:
• Etablissementen Fr. Colruyt NV is controlled by Korys NV which in turn is controlled by Stichting Administratiekantoor Cozin.
• Korys Investments NV as well as Korys Management Investments BV are controlled by Korys NV.
• Korys Business Services I NV, Korys Business Services II NV and Korys Business Services III NV are controlled by Korys NV.
• Stiftung Pro Creatura, a foundation under Swiss law, and Impact Capital NV are controlled by natural persons who directly or indirectly hold less than 3% of the securities with voting rights of the Company.
151 CORPORATE GOVERNANCE | Governance, supervision and management • Sustainable corporate governance • Share ownership
Holders of voting rights Previous notification Afterr the transaction # voting rights # voting rights attached to securities % voting rights attached to securities Stichting Administratiekantoor Cozin 0 0 0,00% Korys NV 73.268.770 72.758.801 54,27% Korys Investments NV 1.435.520 1.241.605 0,93% Korys Management Investments BV 0 193.915 0,145% Korys Business Services I NV 1.000 1.000 0,0007% Korys Business Services II NV 1.000 1.000 0,0007% Korys Business Services III NV 1.000 1.000 0,0007% Stiftung Pro Creatura 146.755 146.755 0,11% Impact Capital NV 60.000 60.000 0,04% Familie-aandeelhouders Colruyt 8.532.134 8.565.264 6,39% Etn. Fr. Colruyt NV 6.687.980 6.687.980 4,99% TOTAL 90.134.159 89.657.320 66,87%
Denominator: 134.077.688
6.3. Updating of share ownership at end of financial year 2022/23
Based on the shareholding structure following the above-mentioned transparency notification by the reference shareholders of 21 March 2023 and the treasury shares held by the company as of 31 March 2023, the distribution of the total number of shares at the end of the 2022/23 financial year as known to us is:
As of 31 March 2023, the shareholders acting in concert held 67% (rounded figure) of the company’s shares. The remaining shares (free float of 33%) are held by institutional or individual shareholders who, individually or in concert, do not exceed the statutory threshold of 5% for making a transparency notification.
CORPORATE GOVERNANCE | Governance, supervision and management • Sustainable corporate governance • Share ownership
Shareholders acting in concert 89.657.320 Colruyt family and Korys companies 82.969.340 Colruyt Group 6.687.980 Free float 44.420.368 TOTAL 134.077.688 Shareholders acting in concert Free float 67% 33% 152
Corporate sustainability
Thanks to our unique position in the supply chain, we are able to create a positive spiral on a social and ecological level driven by our economic impetus, yielding long-term results. We believe that our entrepreneurship is the engine for a sustainable evolution and a source of inspiration for everyone associated with us.
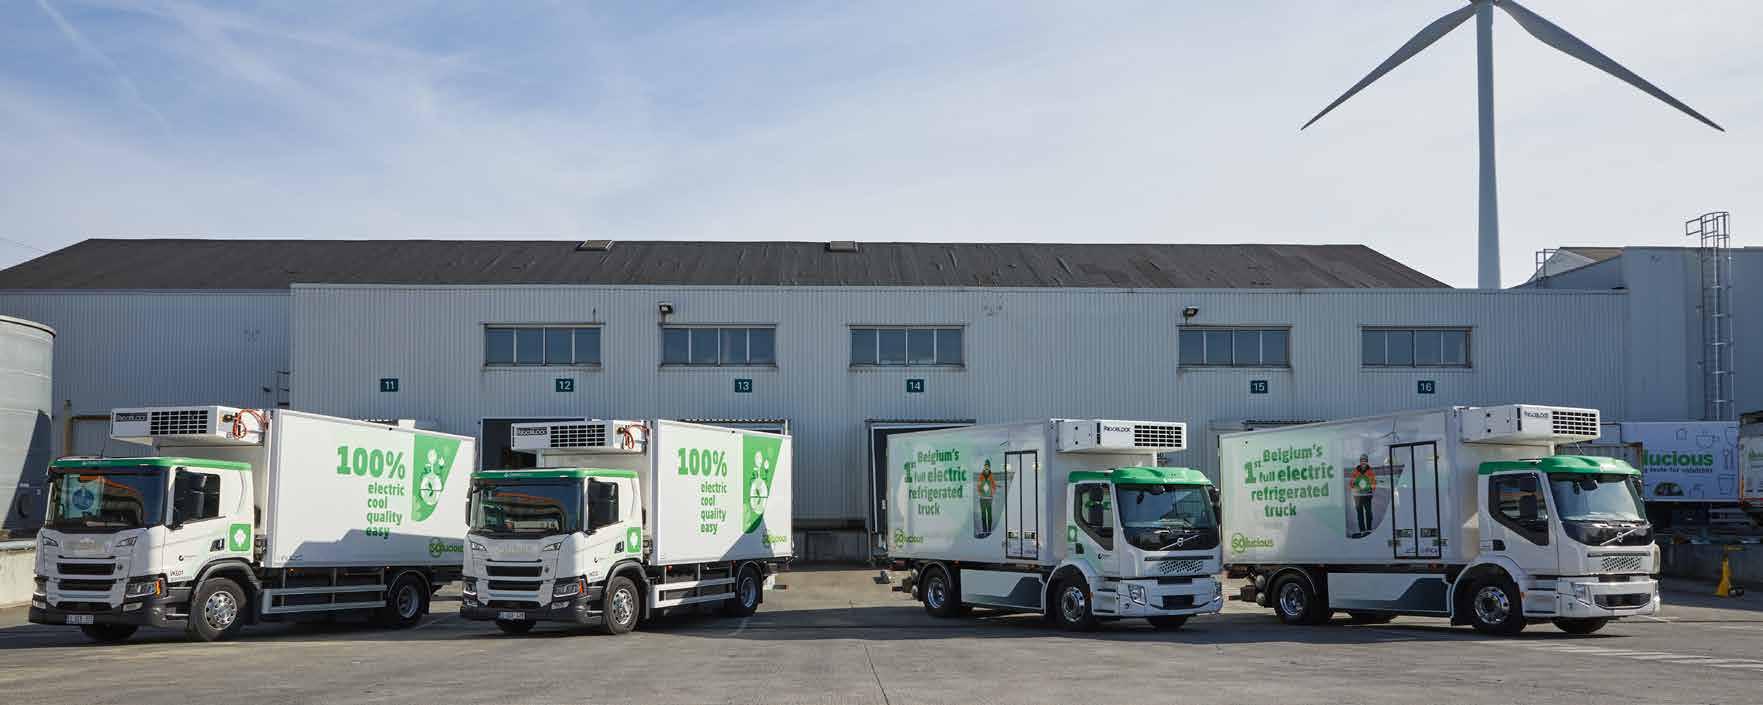
You can find our sustainability strategy at the beginning of this annual report, starting on p. 14. There we tell what sustainable entrepreneurship means to us, which topics we focus on and how we organise to achieve our sustainability goals.
Our sustainability reporting has been prepared in the framework of the Sustainable Development Goals (SDGs) of the United Nations. Starting from our strategy, we have selected seven SDGs that are most ‘material’ to our company. In this chapter, we explain our vision, approach and concrete results for each topic.
Discover even more of our sustainable achievements at www.colruytgroup.com
153
SUSTAINABILITY | SDG 2 • SDG 3 • SDG 6 • SDG 7 • SDG 8 • SDG 12 • SDG 13 • Sustainability indicators • EU Taxonomy
SDG 2 1 Balanced nutrition for all
We want to help end hunger by making safe, nutritious and sufficient food available to all, throughout the year.

Our goal is to make balanced and healthy food accessible to everyone, especially those struggling (financially). We do this not only through the product ranges in our stores, but also by donating food to social organisations and a project for socially vulnerable families with children.
To ensure food security, we work directly with Belgian farmers, with our joint efforts focusing on sustainable farming practices and agreements on quality and volumes.
Food donations to social organisations
In 2022, we sold 96,8% of our fresh produce. We are constantly on the lookout for beneficial ways of distributing the remaining food. For example, we donated 6.649 tonnes of unsold food to social organisations such as the Food banks, Foodsavers, les Restos du Cœur, the Red Cross and others. The organisations receive the products straight from 346 Bio-Planet, Colruyt, Cru and Okay stores or pick them up at our distribution centres and Collect&Go pick-up centres.
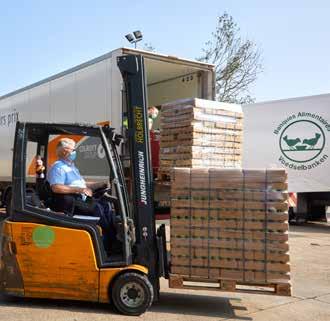
Dinner is served at 1-2-3 euros
Helping families struggling financially to put a balanced, tasty and budgetfriendly meal on the table every day is the aim of the ‘Dinner is served at 1-2-3 euros’ project, a collaboration between Colruyt Lowest Prices, various social agencies and local authorities. Those who sign up receive a recipe booklet every two weeks with six easy, kid-friendly recipes, together with the corresponding shopping lists. Each recipe costs a maximum of 1, 2 or 3 euros per portion. Since 2016, more than 9.200 families in over 280 municipalities have taken part.
Food donations to social organisations in Belgium (tonnes)
SUSTAINABILITY | SDG 2 • SDG 3 • SDG 6 • SDG 7 • SDG 8 • SDG 12 • SDG 13 • Sustainability indicators • EU Taxonomy
2014 251 490 797 1.956 3.297 4.262 4.504 5.622 6.649 2015 2016 2017 2018 2019 2020 2021 2022 You can find the overview of all our SDG 2 sustainability indicators on p. 180.
154
2 Partnerships with Belgian farmers
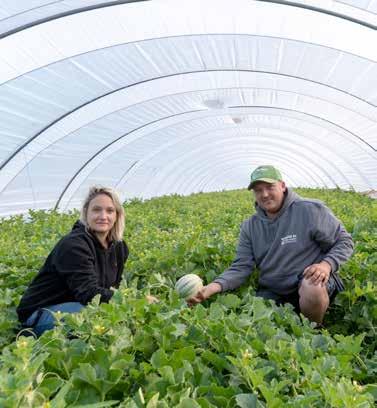
To ensure sustainable food production, we work closely with various partners in the Belgian agri-food sector through a series of supply chain and innovation projects. Within these partnerships, we sign clear agreements on quality, volumes and sustainable farming methods, enabling us to meet our consumers’ demand for more local produce, fewer food miles and a more sustainable product range
Continuing strong partnerships
• The direct and exclusive cooperation with 17 Belgian poultry farmers allows us to offer chickens meeting higher animal welfare standards in our Colruyt and Okay stores. Read more on p. 170.
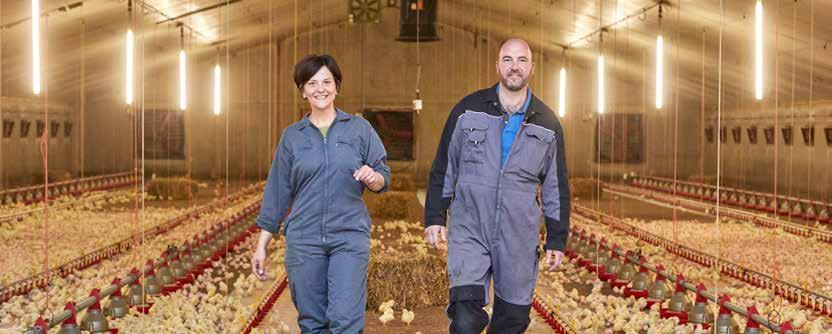
• At Colruyt, Okay and Spar, customers will find 13 dairy products coming from our partnership with the Belgian dairy company Inex and 330 dairy farmers. They receive a set price for their milk for five years. In 2022, they sold 22,5% of their milk within this partnership, up from 18,8% in 2019.
• For some of the organic vegetables, Bio-Planet, Colruyt and Okay work together with De Lochting, a non-profit sheltered workshop and organic farm in Roeselare. Together, we have taken steps over the past two years to minimise food loss by better matching order and production volumes.
• For 35% of their beef, Colruyt and Okay work together with 185 cattle farmers belonging to the producer organisations Vlaams Hoeverund, En Direct De Mon Elevage and Les Saveurs d’Ardenne.
• Three Belgian fruit growers grow the apple varieties Magic Star and Coryphée exclusively for Colruyt Group. To support them in developing a profitable crop, we provide them with a sales guarantee and a correct price. We process any fruit not suitable for sale into apple juice, apple cake, sorbet or crisps.
• Together with 17 Belgian potato growers, we select varieties which thrive in our local soils, with a view to extending the Belgian potato season.
• Working together with seven organic wheat growers, the Molens van Oudenaarde flour mill and the Atelier du Pain and De Trog bakeries, we grow high-quality organic baking wheat, which is processed into four types of sourdough bread. These loaves are available at Bio-Planet.
• To always be able to offer Belgian organic pork at Bio-Planet and Colruyt, we work directly with six organic pig breeders
Innovative Belgian crops
In its desire to play a pioneering role in innovative crops, Colruyt Group actively supports farmers moving in this direction. As a result of these test projects, in the summer of 2022 we sold Belgian apricots at Cru and for six weeks on a larger scale Charentais melons at Colruyt, Okay and Spar. Okay customers could purchase fresh Belgian ginger in the autumn, while Cru also offered varieties such as ginger syrup, jam and pickles. We are also co-funding research projects to grow Belgian soy and quinoa.
155 SUSTAINABILITY | SDG 2 • SDG 3 • SDG 6 • SDG 7 • SDG 8 • SDG 12 • SDG 13 • Sustainability indicators • EU Taxonomy
SDG 3 1 Balanced nutrition tailored to customer needs
We offer our customers a balanced range of products, tailored as far as possible to individual needs and requirements. We offer recipes with a specific focus on a balanced diet, both online and through flyers and cookery books.
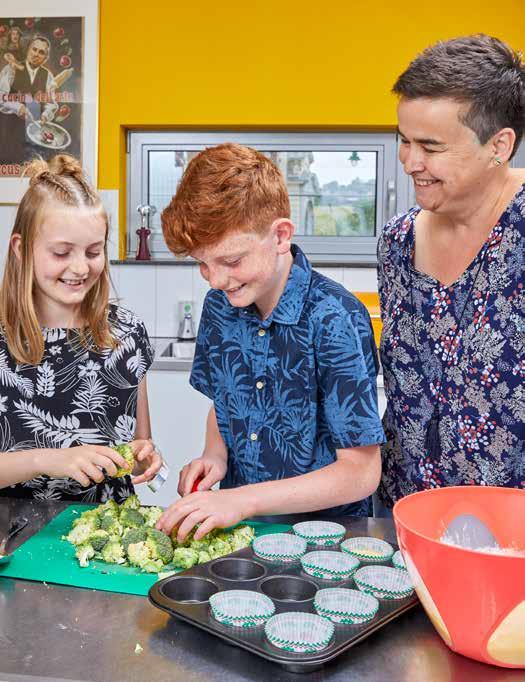
41
Our retail activities enable us to contribute to the (preventive) health and well-being of our customers and employees. We want to play a pioneering role in this, helping to strengthen support for health and making it easier to make healthier choices, whether physically, mentally or socially.
Our health efforts involve both our product range and our services such as personalised advice, digital tools and educational activities.
Healthier product range
Together with our suppliers and our own production departments, we have improved the nutritional composition and nutritional value of many private label products, across all product categories, resulting in 171 improved products and accounting for:
167 tonnes less sugar
112 tonnes less fat
15 tonnes less salt
39 tonnes of added fibres
66 tonnes less saturated fats
Boni products achieved a better Nutri-Score.
SUSTAINABILITY | SDG 2 • SDG 3 • SDG 6 • SDG 7 • SDG 8 • SDG 12 • SDG 13 • Sustainability indicators • EU Taxonomy
You can find the overview of all our SDG 3 sustainability indicators on p. 181. 156
2 Guidance for a healthier lifestyle
By informing, inspiring and guiding, we are helping our customers and employees adopt a healthier lifestyle. We are doing this in a user-friendly and transparent manner based on scientific research, providing them with the tools to make their own conscious choices and adopt permanent, healthy habits.
Employee health programmes

We believe that healthy employees form the basis of a healthy organisation. Going by the name ‘Hello Health’, we have bundled three preventive health programmes for employees. These programmes are available both to our own employees and other companies.
Making conscious choices with the Nutri-Score

The Nutri-Score translates the nutritional value of a product into a clear letter and colour code, allowing customers to easily compare products within the same range and make conscious food choices. All Boni and Spar private-label products list the Nutri-Score on their packaging, with the exception of some articles in the ‘fresh fruits and vegetables’ category.
(OTC) pharmaceuticals
Via the online pharmacy Newpharma and in nearly all Colruyt stores in Belgium, we offer a wide range of (OTC) pharmaceutical products in such categories as baby and mama, vitamins and nutritional supplements, in addition to specialised products for e.g. first aid, home care and animals. Customers can also have their Newpharma orders delivered to a collection point at Colruyt and Okay.
• Lifestyle Check: using a scientifically based questionnaire on nutrition, exercise, sleep and mental well-being, we want to map employee lifestyles at company level, allowing us to further align our health policy with the actual needs of our employees. Those who choose to participate also receive a personal report and practical tips for a healthier lifestyle, with which they can work individually.
After conducting a successful test in 2022 to extend it from office staff to employees in logistics and sales, Lifestyle Check will be rolled out step by step over the next few years.
• Medical Lifestyle Programme: in 2022, 400 of our employees were given a medical check-up with the help of the Lifestyle Check and a blood test, followed by an online consultation with a doctor and lifestyle coach. Despite the challenging times for our company, we have decided to continue rolling out this programme.
• Hello Health programme: the aim of this programme is to improve health parameters related to the metabolic syndrome through a healthier lifestyle. A total of 100 people have already completed this process.
The Hello Health programme was tested and validated in 2021 by a study conducted by Hello Health with the support of the European EIT Food and EIT Health, in collaboration with KU Leuven and Ghent University. Following a personal lifestyle analysis and intensive guidance from a coach, an app and an online community, 58% experienced significant improvements in metabolic health parameters such as waist size, cholesterol, triglycerides and glucose.
Newpharma is testing an energy and stress barometer to monitor employees’ mental health using a smartwatch and BioRICS’ Mindstretch app, an app allowing users to track their mental energy balance and providing personalised advice to improve it. 74% of Newpharma employees are participating in this test.
157 SUSTAINABILITY | SDG 2 • SDG 3 • SDG 6 • SDG 7 • SDG 8 • SDG 12 • SDG 13 • Sustainability indicators • EU Taxonomy
Regional Innovation Scheme
3 Safe and healthy working environment
As an employer, we want to create a safe and healthy working environment for our employees, where attention is paid to mental and social well-being and a healthy work-life balance.
Physical well-being
• We aim for zero occupational accidents by prioritising risk analysis and prevention, an approach that has paid off. 916 occupational accidents occurred in 2022, inducing 417 fewer lost-time days than in the previous year.
• Colruyt store employees are testing an ergonomics sensor from SpineWise. Sensors attached to working clothes measure the position of the back in relation to an upright position, emitting a vibration signal if the position is too stressful.
• All Colruyt Lowest Prices stores replaced the ladders used to fill shelves with a safer and more ergonomic alternative: the UP.
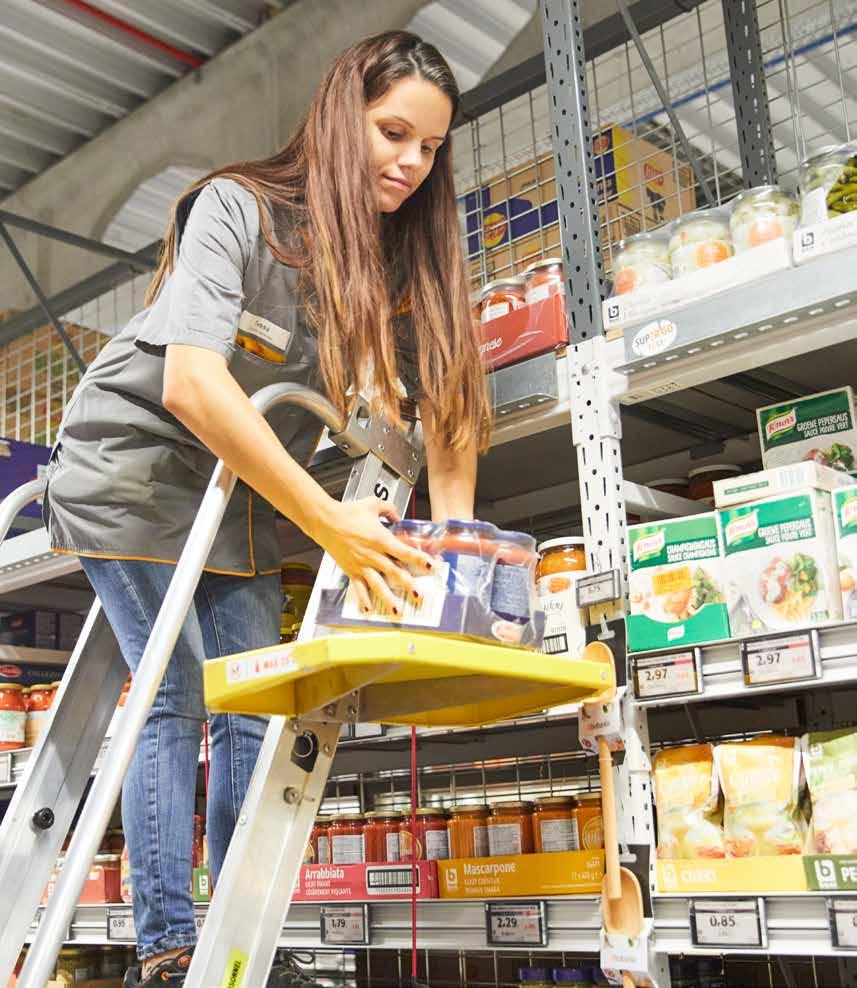
• Jims launched a pilot project to prevent injuries and accidents among logistics workers by teaching them on-the-job warm-up exercises and ergonomic lifting techniques
• Colruyt Group staff get a 30% discount on a Jims fitness subscription
• Each autumn, employees can sign up for a free flu vaccination In 2022, 3.840 employees did so.
SUSTAINABILITY | SDG 2 • SDG 3 • SDG 6 • SDG 7 • SDG 8 • SDG 12 • SDG 13 • Sustainability indicators • EU Taxonomy
158
Comment demander une intervention ?
je tegemoetkoming aan?
emoetkoming aanvragen vanaf van 125 euro. moeilijkheden (ten gevolge van de tegemoetkoming hoger zijn, volledig ingevulde financiële enquête en onderzoek. aanvraagformulier in (doc.9454).
Mental well-being
• The Connection assists employees with personal or family problems. While not directly providing psychological support, this neutral service offers a listening ear and can refer employees to external professional help if necessary.

• The Connection contacted 2.911 employees on long-term sick leave last financial year, outside the statutory reintegration process.
• Confidential advisers help with problems at work such as conflicts, stress or mobbing.
• Our ‘Shocking Events’ support team helps employees cope with a shocking event at work, such as an accident, a hold-up or a death.
• Our office buildings are equipped with quiet rooms, used inter alia for yoga and mindfulness sessions.
• Our group is fully committed to an extensive in-house training programme focused on the personal growth of our employees. Read more on p. 166.
Solidariteitsfonds
• Vous pouvez demander une intervention à partir d’un montant de 125 euros. Lors de difficultés financières (suite à la maladie), l’intervention peut être plus élevée, après une enquête sociale et une enquête financière dûment complétées Complétez un formulaire de demande (doc.9454).
• Rassemblez les preuves - factures originales - attestation officielle de cohabitation (si pour le partenaire) - décomptes originaux de l’assurance hospitalisation - facture originale de la pharmacie - attestation officielle de revenus de remplacement (si pour le partenaire) - décomptes de la mutualité
Solidarity Fund
Renvoyez le formulaire complété et signé, ainsi que les preuves au service Le Relais avec la mention « Fonds de solidarité ».
Personnes de contact : Pour des questions relatives au contenu •Le Relais (tél. 72777)
•E-mail à SOLFO

Pour la soumission de dossiers
bewijsstukken: facturen attest van samenwonen voor partner) afrekeningen van de hospitalisatieverzekering rekening van de apotheek attest van vervangingsinkomen voor partner) eningen van de mutualiteit volledig ingevulde en ondertekende formulier samen met de bewijsstukken dienst De Schakel met de vermelding ‘Solidariteitsfonds’.
•Toujours par la poste (destinataire Le Relais) Pour le paiement de dossiers
67,6% of our employees have voluntarily joined the Solidarity Fund, our social fund assisting them in situations such as long-term sickness. Last year, the fund disbursed 1.348.064 euros.
•Contact Center Personnel (tél. 5566)
•E-mail à info.perso@colruytgroup.com
Contactpersonen: inhoudelijke vragen: Schakel (tel. 72777)
naar SOLFO
indienen dossiers: Steeds via post (bestemmeling De Schakel) uitbetaling van dossiers:
•Contact Center Personeel (tel. 5566) •Mail naar info.perso@colruytgroup.com
een overzicht van alle andere contactpersonen en kanalen i.v.m. privé- en werkgerelateerde problemen, raadpleeg doc205.927
Verantwoordelijke uitgever: N.V. Colruyt Group Services S.A., Edingensesteenweg 196, B-1500 Halle.
159
Éditeur responsable N.V. Colruyt Group Services S.A., Edingensesteenweg 196, B-1500 Halle. SUSTAINABILITY | SDG 2 • SDG 3 • SDG 6 • SDG 7 • SDG 8 • SDG 12 • SDG 13 • Sustainability indicators • EU Taxonomy
Afin d’obtenir un aperçu de toutes les autres personnes de contact et des autres canaux destinés aux problèmes personnels et professionnels, consultez le doc.205.927
SDG 6 1 Circular water management
In 2022, our main activities in Belgium consumed 598.066 m³ of water. By maximising the reuse of rainwater and wastewater, our dependence on mains water and water from wells decreased to 63,9%.
Reusing rain- and wastewater
As water is an indispensable resource, both for humans and nature, it is crucial to use it sparingly.
For our own operations, we apply circular water management, reflecting our commitment to avoiding and reducing water consumption. As long as the water quality can be guaranteed, we choose to use (treated) rainwater and wastewater. We replenish water supplies by letting rainwater filter down into the aquifer. We only discharge into the sewer system as a last resort. We also aim for the production of our products not to cause any irresponsible water pollution or water shortages in the countries of origin.
By
(1) We are exploring ways of including a greater proportion of the buildings we operate in the scope of this goal by 2030. As of our next annual report, we will be reporting on this new target.
• At the end of 2021, we commissioned a new water treatment plant in Halle, which treats industrial and sanitary wastewater, as well as rainwater for three sites: our Dassenveld distribution centre, the Elbeek site and our Wilgenveld headquarters. Together, these sites account for a quarter of our total water consumption. This initiative has already proved its worth: during the very dry period from 1 July to 18 August 2022, we reduced the mains water consumption of the connected sites by 8.000 m³, or three well-filled Olympic-sized swimming pools. For 2022 as a whole, the plant treated 34.569 m³ of water, turning it into drinking water.
• The capacity of the water basin for collecting rainwater at our Dassenveld distribution centre was expanded to 9.500 m³.
• In 2022, we produced 114.961 m³ of drinking water from wastewater from our meat processing company Fine Food Meat, representing a recovery rate of 51%.
Avoiding and reducing water consumption
In every new construction or renovation project, we look at ways of minimising our water footprint in the design phase. We are optimising our processes and facilities to use water more economically.
The right kind of water for each application
We only use drinking water when this is absolutely necessary. Thanks to our ‘Water Balance’ project, we now have smart data about how much of each type of water we consume, how much water is left in our buffers, how much rainfall …
25% wastewater
56,3% mains water
11,1% rainwater
7,6% water from wells
2025, 50% of our largest (1) water consumption in Belgium (excluding drinking water for sale) is to come from rainwater and wastewater.
SUSTAINABILITY | SDG 2 • SDG 3 • SDG 6 • SDG 7 • SDG 8 • SDG 12 • SDG 13 • Sustainability indicators • EU Taxonomy 36,1% 2025 target: 50%
Origin of our water
By 2022, we were already at 36,1%.
160
You can find the overview of all our SDG 6 sustainability indicators on p. 181.
2 Preserving and protecting water supplies
Our goal is to keep as much water as possible within the natural water cycle and out of the sewer system.
• To allow rainwater to filter into the ground, we opt for permeable hard surfaces, wadis, infiltration trenches and wells on our sites.
• In cases where the subsoil is unsuitable for letting water filter down through it, we buffer the water on our own sites during downpours before gradually discharging it later.
• We use green roofs on our buildings to ensure that some of the rainwater falling on the roof is retained and evaporates.
• We also make careful use of groundwater in water catchment areas where we pump up water to produce drinking water.
• Naturally, we also always meet wastewater discharge standards.
3 Reducing the water footprint of our offerings
Water is indispensable for the production of our products. To ensure the availability and quality of water worldwide – and especially in high-risk areas –, we are systematically striving to reduce the water footprint of our products and services, working with producers and partners to ensure that our footprint does not exceed the natural capacity of local catchment areas.
Water consumption for growing fruit and vegetables
Colruyt Group is part of the Sustainability Initiative Fruit and Vegetables (SIFAV), through which we are actively contributing to a more sustainable supply chain for fresh vegetables and fruit.
• In three selected water catchment areas in Peru, South Africa and Spain, our aim is to reduce water consumption for growing fruit and vegetables to best-practice levels. We spent last year mapping how to collect data to monitor water consumption in these areas.
• We want to implement independent audits or water standards for 70% of the volume of fruit and vegetables coming from high-water-risk countries.
Read more about the SIFAV sector initiative on p. 169.
Scaling up sustainability goals
Building on insights and experiences from sector initiatives and supply chain projects, we have set new water targets which we intend to integrate into all our commercial chains. By 2025, 70% of our products from high-water-risk regions should fulfil a water standard.
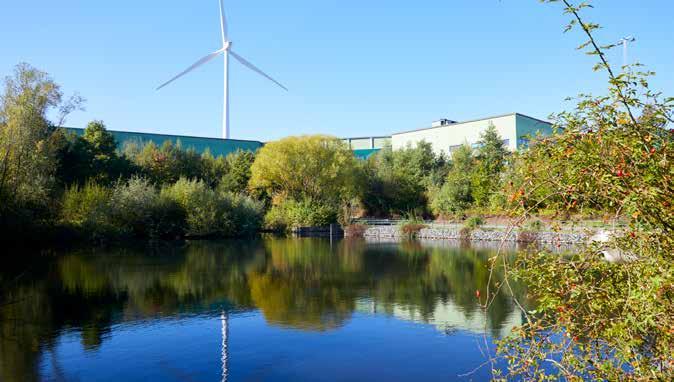
161
SUSTAINABILITY | SDG 2 • SDG 3 • SDG 6 • SDG 7 • SDG 8 • SDG 12 • SDG 13 • Sustainability indicators • EU Taxonomy
SDG
7 1 Avoiding and reducing energy consumption
With the help of our energy reduction plan, we intend to reduce the energy consumption of our activities in Belgium and Luxembourg by 20% by 2030 compared to base year 2009, relative to our – continuously growing – revenue. Our reduction plan provides for a structural approach to the largest energy consumers: heating, cooling, lighting and mobility
Raising awareness
Our energy policy focuses on avoiding and reducing consumption. In addition, we consciously choose sustainable alternatives such as renewable electricity (from wind turbines and solar panels) and green hydrogen as energy carrier.
Heating
By 2022, we were already consuming 10,4% less energy (normalised). 2030 target: - 20%
In 2022, we reduced our energy consumption for heating by 16%. This impressive drop is the result of both warmer outdoor temperatures and the energy-saving measures introduced due to the energy crisis. For example, Colruyt Lowest Prices reintroduced the insulating flaps in the fresh food market and the thermostats in our buildings were turned down.
Low-energy stores
For more than a decade, all our new stores have been constructed as lowenergy stores combining excellent insulation and airtightness properties with energy-efficient cooling technologies (such as cold rooms and freezer cases), heat recovery and LED lighting. In short: they consume very little energy. We now have 146 newly built and 112 renovated energy-saving stores
Through campaigns focusing on energy-saving, we are raising our employees’ awareness to the fact that they too can contribute to reducing energy consumption through their behaviour. We focus on simple actions that make a difference, such as keeping doors closed, de-icing freezers or turning off lights.
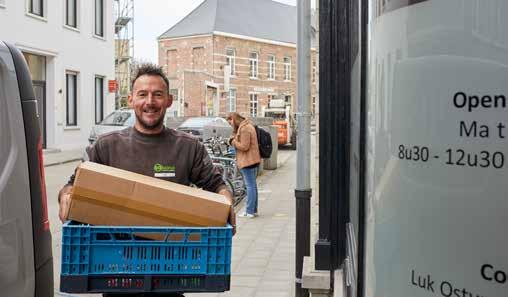
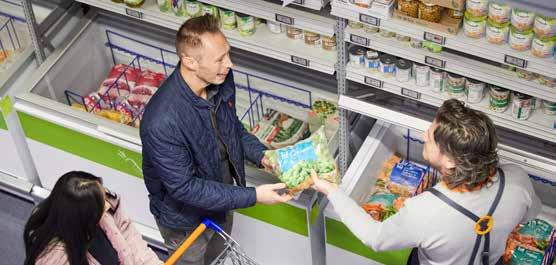
Lower mileage
Through smart transport planning and a load factor of 93,9% for the lorries delivering goods to our Colruyt stores, we are able to avoid unnecessary journeys and fuel consumption. Solucious is conducting tests to maximise the load factor of return trips as well. Our office staff are able to work two days a week at home or in a regional office. In addition, we offer employees with company cars a course in eco-driving.
By 2030, we consume 20% less energy than in 2009, relative to our revenue.
- 10,4% SUSTAINABILITY | SDG 2 • SDG 3 • SDG 6 • SDG 7 • SDG 8 • SDG 12 • SDG 13 • Sustainability indicators • EU Taxonomy You can find the overview of all our SDG 7 sustainability indicators on p. 182. 162
2 Using energy smartly
By 2030, at least 90% of our electricity generation and consumption at our central sites in Halle, Lot, Ollignies and Ghislenghien should occur simultaneously.
The rate achieved in 2022 was already 75,8%.
We believe that energy consumers, in addition to generation facilities, play an important role in balancing the load of the public distribution grid. In our case, we are as much as possible shifting our energy consumption to times when green power production is high. One way we achieve this is by flexibly controlling our generation and energy-consuming facilities.
3 Producing and using renewable energy
In 2022, this figure was 45,1%.
45,1%
2030 target: 60%
We remain committed to increasing the share of renewable energy, for instance by greening our vehicle fleet and using non-fossil heating. Our electricity consumption is 99% green. By 2030, we aim for 100% of the renewable energy we consume being either self-generated or locally generated. By doing so, we are reducing the need to transport energy and the associated environmental impact.
• Solar electricity generated by Colruyt Group: 13.166 MWh
• Green electricity generated by Virya Energy on behalf of Colruyt Group: 925.315 MWh
Read more about Virya Energy’s renewable energy generation from p. 95.
4 Offering renewable energy
Via DATS 24, we are helping make green electricity and green hydrogen available to the residential and business market.
• DATS 24 has been supplying green electricity to residential customers since April 2021.
• We accelerated the rollout of our charging stations network, both at our stores and offices and at external customers. At the end of the financial year, we had 373 electric charging stations – almost each with two charging points – at 230 sites.
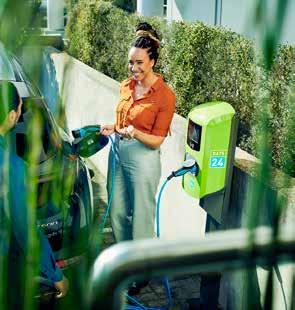
• DATS 24 has already opened three hydrogen filling stations Further stations are set to follow in 2023 in Herve, Erpe-Mere and Ollignies (for HGVs).
Read more about DATS 24’s renewable energy offerings from p. 91.
163
By 2030, 60% of our total energy consumption should come from non-fossil energy sources.
Evolution of the average simultaneity of our electricity generation and consumption 75,8% 70% 73% 72% 78,5% 2030 target: 90% 2019 2018 2020 2021 2022
SUSTAINABILITY | SDG 2 • SDG 3 • SDG 6 • SDG 7 • SDG 8 • SDG 12 • SDG 13 • Sustainability indicators • EU Taxonomy
SDG 8 1 Working at Colruyt Group
We consciously opt for creating long-term jobs and offering decent work, to which every employee can make a positive contribution. By creating a work context where everyone can be the best version of themselves, we strive to build long-term relationships with each of our employees.
Long-term workforce
We conduct our business in an inclusive and people-oriented manner, based on integrity, trust and respect for everybody’s rights. Our core focuses in this respect are decent work, a stimulating working environment and decent working conditions, both for our own employees and at producers, suppliers and partners.
As a development-oriented organisation, we believe it is important that we continue to grow together, as humans, as a company and as society. Via an extensive training programme, we provide our employees with numerous opportunities to develop their personal and professional skills. Young and old can attend the Colruyt Group Academy offering a wide range of workshops, lectures and webinars. And via our Collibri Foundation, we are investing in the education and training of young people in Belgium and abroad.
In a large company like ours – with a diverse brand portfolio and a wide range of support services –, there are many opportunities for career development. We actively support our employees in this through numerous training courses, reflection documents, talent exercises, personal development plans, etc. We also pay close attention to a healthy work-life balance
• On 31 March 2023, the Colruyt Group workforce totalled 33.384 employees, 388 more than the previous financial year.
• Average length of service was 11 years.
• 78,8% of our employees work full-time
• 99% have an open-ended contract
• In financial year 2022/23, 3.030 employees did a job switch.
An inclusive workplace where everyone counts
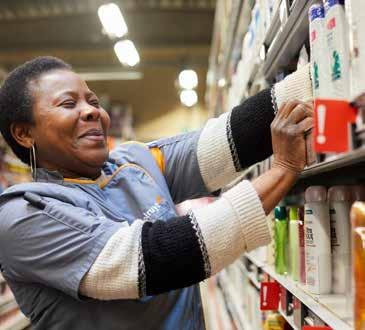
We strive to be an inclusive organisation where everyone is welcome, feels heard and can be themselves. Inclusion is essential to allow diversity to grow. We acknowledge and value that each individual is a mix of unique characteristics, whether visible (such as age, language, ethnicity, etc.) or less visible (such as character traits, beliefs, competences, needs, illness, disability, work style, sexual orientation, religion, etc.).
As an organisation, we aim to remove as many barriers as possible and do not tolerate discrimination or racism. We are convinced that the constructive interplay of our employees’ diverse talents, skills, personalities and experiences constitutes fertile ground for creating added value together.
• 94 different nationalities are to be found within Colruyt Group.
• In our training offerings, we focus on multicultural teams and intercultural communication.
Number of FTE employees (full-time equivalent) Headcount development Financial year 2021/22 Financial year 2022/23 Belgium 28.215 28.332 117 Luxembourg 147 157 10 France 2.320 2.369 49 Other countries 528 677 149 Total Colruyt Group 31.210 31.535 325 SUSTAINABILITY | SDG 2 • SDG 3 • SDG 6 • SDG 7 • SDG 8 • SDG 12 • SDG 13 • Sustainability indicators • EU Taxonomy
164
You can find the overview of all our SDG 8 sustainability indicators from p. 183.
• Managers are equipped to discuss the risk of poverty among employees and to refer them to internal and external counselling channels.
• Our selection process is open to all, regardless of age, cultural background, disability, ethnicity, gender identity, marital status, political beliefs, religion or sexual orientation. We also focus on alternative selection procedures targeting people further away from the regular labour market.
• Solucious was awarded the prize ‘Inclusive Enterprise 2022’ by workplace architect JES vzw, for the way the food service specialist provides opportunities to people who find it harder to enter the job market. Read more on p. 90.
More than just remuneration
Our employees can count on a competitive salary package. In addition, we want them to benefit financially from the company’s growth.
• Via an annual capital increase in operation since 1987, our employees are able to purchase shares in Etn. Fr. Colruyt NV, on attractive subscription terms. These capital increases are proposed by the Board of Directors and approved by an Extraordinary General Meeting. The shares remain blocked for five years. In 2022, 1.489 employees subscribed to 238.500 shares, resulting in a capital contribution of 5,4 million euros.
• Every year since the 1990s, Colruyt Group has let all employees in Belgium share in the profits – insofar as the financial results allowed such – as a token of appreciation for their efforts. However, given the significant drop in operating results in financial year 2022/23, the conditions for profitsharing were not met this year.
Overview of payroll costs in Belgium (financial year 2022/23)
Total
Employer social security contributions and insurances: EUR 292,6 million
payroll costs: EUR 1.447,7 million
Employee social security contributions: EUR 120,5 million
Withholding tax on wages, including burden reductions: EUR 151,3 million
Gross wages and salaries: EUR 1.155,1 million
Net wages and salaries: EUR 883,3 million
165
Men White collars Women Blue collars 59,3% 79,5% 20,5% 40,7% 0,7% 17,8% 28,6% 25% 23,3% 4,6% Younger than 20 Between 20 and 30 Between 30 and 40 Between 40 and 50 Between 50 and 60 Older than 60 Demographic composition of the workforce SUSTAINABILITY | SDG 2 • SDG 3 • SDG 6 • SDG 7 • SDG 8 • SDG 12 • SDG 13 • Sustainability indicators • EU Taxonomy
61% 80% 20% 11% 8%
Year Amount (in million EUR) Number of shares 2019 15,9 380.498 2020 10,3 222.372 2021 7,3 184.228 2022 5,4 238.500
of
contribution
Evolution
employees’ capital
2 Learning and developing together
As a consciously development-oriented organisation, we encourage lifelong learning and development for everyone, both professionally and personally.
Employee training and learning programmes
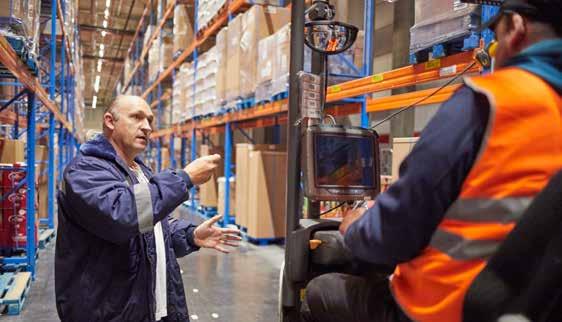
We are continuously optimising our employee training offerings to boost their quality and meet current learning needs. Our 2022 focus was on training for middle and senior management, on-the-job training, digital skills and learning tools, data analysis and standardisation within our group.
In addition to professional training, we are investing in training focused on our staff’s personal, mental, emotional, physical and spiritual development. Employees who know themselves and their stress factors show greater resilience and are better able to anticipate difficult situations.
• In financial year 2022/23, we invested 37,7 million euros in staff training and education, a figure corresponding to 2,6% of payroll.
• In the past financial year, 2.702 employees attended one of the 82 different training courses for personal growth and health.
Inspiring consumers via Colruyt Group Academy
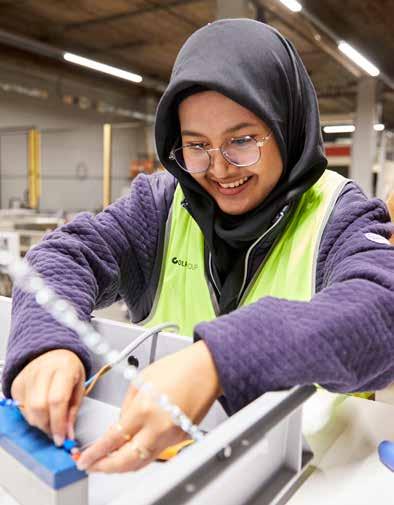
In financial year 2022/23, 41.458 people participated in Colruyt Group Academy workshops, lectures, webinars and events. Read more on p. 106.
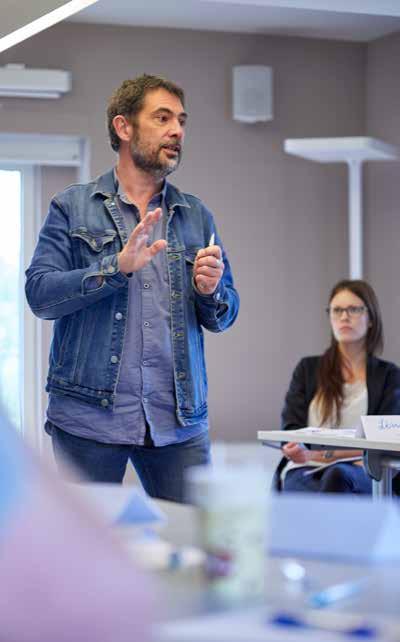
Training for young people via our Collibri Foundation
Via our Collibri Foundation, we contribute to the education and training of young people in socially vulnerable contexts. In 2022, we invested 1.152.935 euros in 18 training projects in eight countries, giving 11.202 young people a better chance for a successful future. Read more from p. 116.
SUSTAINABILITY | SDG 2 • SDG 3 • SDG 6 • SDG 7 • SDG 8 • SDG 12 • SDG 13 • Sustainability indicators • EU Taxonomy 166
3 Decent working conditions in the supply chain
As a player on the international market, we take responsibility for decent working conditions among the producers of our private-label products, especially in high-risk countries.
Amfori BSCI for universal human rights
We are members of amfori BSCI, an international platform of companies seeking to improve working conditions at producers worldwide. We call on our suppliers of imported and private-label products to sign the amfori BSCI code of conduct, undertaking to respect universal human rights principles related to the minimum age of workers, proper remuneration, the exclusion of child and forced labour, safe and healthy working conditions, the prohibition of discrimination, etc.
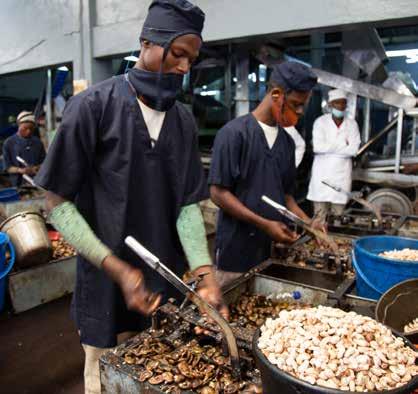
Read more about our human rights policy at www.colruytgroup.com, under ‘Shareholders’ information’.
Sector initiatives
Via sector initiatives, we join forces with other players to bring about positive changes throughout the supply chain.
Sustainability Initiative Fruit and Vegetables (SIFAV)

Together with the other partners, we are contributing to a more sustainable supply chain for fresh fruit and vegetables, both ecologically and socially. Within SIFAV, we subscribe to the following social targets for 2025:
• 90% of our fruit and vegetables from medium- to high-risk areas to meet specific social standards verified by a third party.
• We intend to map the differences in living wages for at least one of our chains and to work with our chain partners to test strategies to close the gap.
Our reporting exercise for financial year 2022/23 revealed that gathering correct data from the chains is a challenging task. To better understand sustainability risks in supply chains and to fine-tune our database, we recently started using the AgriPlace risk database.
Social audits
Using social audits conducted by accredited auditing agencies, we check whether our trading partners respect the amfori BSCI code of conduct. When a producer fails to comply with the guidelines, the first thing we look at is how we can provide support to make the necessary improvements so that we can continue the cooperation, inter alia through training. In the absence of any
Together with Delhaize and the Belgian divisions of Aldi, Lidl and Jumbo, we have signed a commitment to guarantee a living wage to workers on banana plantations by 2027. We are already taking this into account in purchasing negotiations.
Beyond Chocolate
The aim of the ‘Beyond Chocolate’ sector agreement, which we co-signed in 2018, is to improve the living conditions of cocoa producers by 2030, inter alia by guaranteeing them a living income. The cocoa farmers in our chain project in Ivory Coast already receive a living income reference price from us.
Read more about the sector initiatives in which we participate on p. 169.
improvements after a subsequent audit, we discontinue the cooperation.
In 2022, 260 of the 404 producers we work with were given a social audit – a decrease from 81% last year to 64,4%. This can be explained by a lack of data and the not yet optimal functioning of amfori BSCI’s new audit platform. For 90% of producers in high-risk countries, the audit resulted in a positive assessment.
167
SUSTAINABILITY | SDG 2 • SDG 3 • SDG 6 • SDG 7 • SDG 8 • SDG 12 • SDG 13 • Sustainability indicators • EU Taxonomy
SDG
12 1 Responsible sourcing
We want to use our economic ‘clout’ to promote positive social, environmental and animal-friendly practices among the producers, farmers and suppliers from whom we purchase our raw materials and products, both at home and abroad.
We hold human rights in high regard and expect the same from our partners. We apply due diligence whenever possible to prevent, limit or stop human rights violations. Read more about our human rights policy at www.colruytgroup.com, under ‘Shareholders’ information’.
As a retailer with its own production departments, our impact extends to the whole supply chain: from sourcing, via production, to distribution and consumption.
Through certification, sector initiatives and international supply chain projects, we are making a long-term difference in the regions where we source raw materials and products. Closer to home, we are committed to sustainable production, lower waste and food loss, circular packaging and construction methods, and attention to animal welfare.
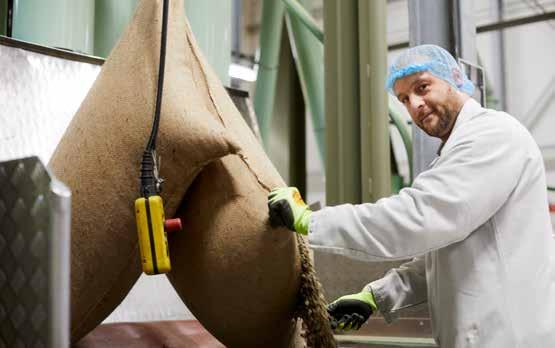
Finally, we encourage conscious consumption by informing our customers properly and via our sustainable savings programme.
Certification of private-label products
For raw materials known to pose significant sustainability risks, we systematically opt for sustainability certificates focused on social and environmental aspects for the private-label products we sell in Belgium and Luxembourg.
• Wild-caught fish, shellfish and crustaceans: 98,9% have an MSC (Marine Stewardship Council) label, a positive assessment from the ILVO (Flanders Research Institute for Agriculture, Fisheries and Food) or a positive assessment by the ISSF (International Seafood Sustainability Foundation) for canned tuna.
• Farmed fish, shellfish and crustaceans: 98,1% are certified with ASC (Aquaculture Stewardship Council) or BIO.
• Coffee: 100% certified (Rainforest Alliance (incl. UTZ), BIO, Fairtrade).
• Products containing cocoa: 99,5% certified (Rainforest Alliance (incl. UTZ), BIO, Fairtrade).
• Palm oil and palm kernel oil: 100% RSPO-certified (Roundtable on Sustainable Palm Oil).
• Soy in animal feed: 100% offset by RTRS (Round Table on Responsible Soy) credits.
• Soy in food: 100% of the soy coming from Asia and South America – where soy farming is associated with a risk of deforestation – and 100% of soy derivatives are certified (RTRS, ProTerra, BIO) or offset by purchased RTRS credits.
• Wood, charcoal and paper: 100% certified with FSC (Forest Stewardship Council), PEFC (Programme for Endorsement of Forest Certification Schemes) or Der Blaue Engel (specifically paper).
• Cotton: 100% of Dreambee’s cotton products are certified with BC (Better Cotton) or GOTS (Global Organic Textile Standard). 80 items at Colruyt Lowest Prices (underpants, vests, socks) are certified with GOTS.

SUSTAINABILITY | SDG 2 • SDG 3 • SDG 6 • SDG 7 • SDG 8 • SDG 12 • SDG 13 • Sustainability indicators • EU Taxonomy
overview
SDG 12
indicators from p. 185. 168
You can find the
of all our
sustainability
International chain projects
Via international chain projects, we are working with family farmer organisations in developing regions to bring the most sustainable product to market. Transparency is key. In 2022, we were active in eight international supply chain projects that resulted in 41 private-label products. We are linking these supply chain projects to training projects for local young people under the flag of our Collibri Foundation
Cocoa from Ivory Coast
Starting in August 2020, we have been supporting 102 farmer families in Ivory Coast for three years. They supply the cocoa for our Boni 72% dark chocolate bar. They receive a living income reference price, as well as support for increasing biodiversity and resilience to climate change. This project is running in collaboration with the IDH Sustainable Trade Initiative, the producer Puratos, development organisation Rikolto, certification organisation Fairtrade, the Ivorian cooperative ECSP and the training centres Agro-Insight and Access Agriculture. In so doing, we fulfil the goals of the Beyond Chocolate sector agreement. When the project ends in summer 2023, we plan to scale up this model to the full range of Boni chocolate bars.
Organic honey from Brazil

Starting in February 2023, Colruyt Lowest Prices and Bio-Planet have been selling liquid organic honey from our chain project in Brazil, a collaboration with farmer cooperative Coopemapi, international NGO Trias and supplier Meli. Colruyt Group guarantees local beekeepers a fair, transparent and stable price in line with the cost of honey production. Through their beekeeping combined with growing organic vegetables, fruit and herbs, the beekeepers are also helping restore the Cerrado savanna’s natural ecosystem.
Scaling up sustainability goals
Building on insights and experiences from sector initiatives and chain projects, we have set new targets which we intend to integrate into all our commercial chains.
Sector initiatives
Sector initiatives see us joining forces with other chain players to bring about positive changes throughout the supply chain, in particular in the regions where we source raw materials and products. This allows us to raise the sustainability bar a lot higher while maintaining a level playing field
Sustainability Initiative Fruit and Vegetables
Representing Belgian retailers, Colruyt Group is part of the sector initiative SIFAV (Sustainability Initiative Fruit and Vegetables). Together with the other supply chain partners, we are contributing to a more sustainable supply chain for fresh fruit and vegetables.
Some SIFAV 2025 goals:
• 25% less CO2 emissions for three products.
• 25% reduction in food loss and waste for three products.
• A reduction in water consumption to best-practice levels in three selected catchment areas in Peru, South Africa and Spain.
• Independent audits or water standards for 70% of the volumes of vegetables and fruit from high-water-risk countries.
• 90% of the fruit and vegetables from mediumto high-risk areas to meet specific environmental and social standards verified by a third party.
Beyond Chocolate
The aim of the ‘Beyond Chocolate’ sector agreement which we co-signed in 2018, is to sustainably improve the living conditions of cocoa producers by 2030.
Beyond Chocolate goals:
• By 2025, all Belgian chocolate must meet a certification standard. 100% of our own chocolate bars are already certified.

• By 2030, cocoa farmers should earn a living income.
• By 2030, there should be no further deforestation due to cocoa cultivation for the Belgian chocolate industry.
169
By 2025, 70% of our products from high-water-risk regions should fulfil a water standard.
By 2030, we should eliminate deforestation and land use conversion for products from high-risk chains.
SUSTAINABILITY | SDG 2 • SDG 3 • SDG 6 • SDG 7 • SDG 8 • SDG 12 • SDG 13 • Sustainability indicators • EU Taxonomy
More animal welfare
We continuously strive for better living conditions for all animals intended for consumption – including by-products – and do so primarily for our private-label products.
• 100% of our private-label fresh and prepared meat products comes from animals stunned before slaughter. In 2022, all Belgian slaughterhouses supplying our meat processing company Fine Food Meat or our stores were subject to unannounced animal welfare inspections.
• Colruyt Lowest Prices and Okay were the first Belgian retailers to commit to higher animal welfare criteria for broiler chickens by 2026. In July 2022, the first welfare chickens reared to these criteria arrived on Colruyt meat shelves (20% of chicken items, 7% of the total volume) and at Okay (15% of fresh chicken items, 3,6% of the total volume). Most of them stem from a new, exclusive partnership with 17 Belgian chicken farmers who are applying the criteria of the Better Chicken Commitment (BCC) step by step. The animals enjoy daylight and 40% more space, there has been a switch to a slower-growing breed, and the eggs are hatched on-farm (NestBorn).
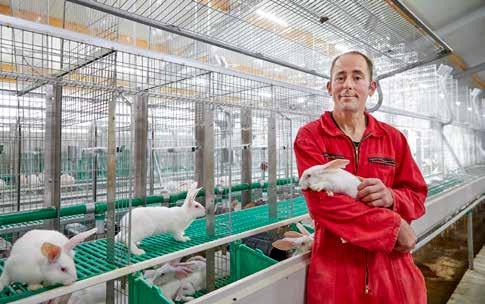
• As the first Belgian retailer, Bio-Planet sells only eggs from male-chick-friendly hatcheries without chick culling. Millions of male chicks are killed every year in Europe because they are of little economic or ecological interest. Thanks to the Seleggt method, a chick’s sex can be determined in the egg after only nine days of incubation, without damaging the egg. The male chick eggs are removed from the hatching circuit and processed into animal feed.
• For 35% of their beef Colruyt Lowest Prices and Okay work together with three Belgian producer organisations. Together with the breeders, we are committed to cow welfare, requiring that cows be able to graze outside for at least half the year. Moreover, the animals spend all their lives on the farm where they were born.
• All fresh rabbit meat at Colruyt, Spar and Solucious comes from rabbits reared in animal-friendly park systems. The meat for Colruyt and Solucious is also 100% Belgian, meaning that the rabbits do not spend too much time in a lorry. To guarantee sufficient supply, Spar park-bred rabbits come from the Netherlands as well.
2 Resource-saving use of raw materials
As a retailer, we use resources to produce products and materials and to run our stores and operations. We are committed to reducing our residual waste and avoiding food loss.
We do this by making our range of products, packaging and services more circular and enhancing the value of our residual streams, working to the principles of the circular economy, and recycling and reusing the available resources again and again. In doing so, we use the R-ladder as a guide: refuse, rethink, reduce, reuse, recircle, recycle and recover.
Smarter packaging
For our private labels, we opt for the most environment-friendly packaging. Whenever possible, we just do away with packaging. For those products that do get packaged, we try to replace or reduce (part of) the packaging. In addition, our packaging is made with a view to easily recycling or reusing it after use. Finally, we opt for packaging made with recycled, renewable or certified materials. And through innovative packaging, we are managing to extend the shelf life of fresh produce.
• Waste sorting centres often have difficulty identifying products completely wrapped by a printed ‘sleeve’. As of 2022, therefore, Boni syrups are being given a perforated sleeve that is easy to tear off, and contains clear sorting instructions for consumers. Dessert sauces and drinking yoghurt containers are set to follow in 2023. Together, they annually account for 140 tonnes of packaging material, which can thus be sorted correctly.
• By 2022, the Boni beverage range switched from coloured PET bottles to transparent PET, enabling transparent bottles to be made from them again.
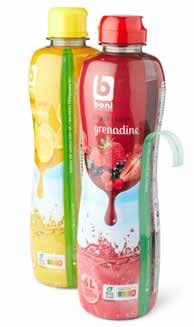
SUSTAINABILITY | SDG 2 • SDG 3 • SDG 6 • SDG 7 • SDG 8 • SDG 12 • SDG 13 • Sustainability indicators • EU Taxonomy 170
By 2025, all household packaging of our private-label products should be reusable or recyclable.
By 2025 our PET beverage containers should consist of 50% recycled PET.
34,7% Target: 50%
Avoiding and reducing food loss
We are constantly looking for ways to reduce food waste. In 2022, we sold 96,8% of our fresh food products in Belgium, thanks to efficient stock management and optimal preservation, meaning that we did not achieve our target of 97,4% – a percentage linked to our revenue – this year. Nevertheless, our volume of food loss decreased by 1.911 tonnes in absolute terms, a significant decrease of 11,2% compared to 2021.
We aim to sell at least 97,4% of our fresh food products (in Belgium).
Target: 97,4%
• Boni fresh herbs are now packaged in innovative packaging with microperforations. This keeps moisture in and oxygen out, keeping the contents fresh for a longer time.
• Boni Spanish cucumbers are provided with packaging as a moisture barrier to extend their shelf life. Okay also sells Boni radish bunches and carrots packed for a longer shelf life.
• Boni iceberg lettuce comes in packaging with an extra weld in the middle, allowing customers to open only the compartment they need. This way, the other part is not yet exposed to oxygen and can be stored longer.
38,3% of our unsold but still consumable products were destined for human consumption or animal feed. The proportion of surplus food going to human consumption rose to 20,1%, while that without any useful application (incineration) fell to 6,7 %. We thus made good progress in our efforts to circularise surplus food.
• Our store employees are trained and coached to donate as much unsold product as possible to social organisations. As a result, we were able to donate a record amount of 6.649 tonnes of surplus food in 2022.
• Together with two suppliers, we are growing mushrooms on bread leftovers from Bio-Planet. Following test-marketing at Cru in 2021, we scaled up sales last year: Bio-Planet customers were able to buy two varieties of mushrooms from this circular project in their supermarket. Moreover, any unsold leftovers are used in a new innovative burger. Read more on p. 59.
171
96,8%
Destination of food surpluses 2022 54,6% 20,1% 18,2% 6,7% 2021 58,1% 15,9% 18,8% 6,9% 2020 59,8% 12,7% 20% 7,1% Fermentation Human consumption Animal feed Incineration Biochemistry 0,4% 0,3% 0,4%
By 2025, at least 40% of our unsold but still consumable products should be consumed by humans or animals (in Belgium).
38,3% Target: 40%
SUSTAINABILITY | SDG 2 • SDG 3 • SDG 6 • SDG 7 • SDG 8 • SDG 12 • SDG 13 • Sustainability indicators • EU Taxonomy
Avoiding and reducing waste
Our waste decreased by 6.943 tonnes (-8,65%) to 73.301 tonnes (excluding construction waste). At 85,5%, we achieved our highest recycling rate ever. Residual waste incinerated decreased to 11.562 tonnes, the lowest level since we started measuring it in 2003.
Circular construction and renovation
In all our construction and renovation projects, we try to reuse as much material as possible. Where this is not possible, high-quality recycling is the preferred alternative. We are testing new materials and techniques for circular construction, such as click facade systems, flexible interior walls, dismountable roof panels, etc. We use life cycle assessments (LCAs) to map the full environmental impact. This allows us to structurally address our reuse and recycling process, in full transparency with all construction partners.
• One key aspect of circular building involves having a good inventory of all materials used, their lifecycles and their environmental impact. Year for year, we are building up our inventory for both construction and furnishing materials when constructing, renovating or demolishing buildings.
• In cooperation with VITO and OVAM, we are working on optimising the Belgian Totem tool for measuring the environmental impact of our building stock. Together with producers and recycling companies, we are introducing material passports and mapping our circularity with the European Levels tool.
• In the construction of the Colruyt store in Zoersel, we were the first in Belgium to apply the ‘ClickBrick Pure’ technique: a ‘Lego’ system for installing facing bricks, without mortar or adhesives. This makes the bricks easy to reuse. We intend to implement this successful technique on a larger scale.
• We commit ourselves to a Kamp C project, looking for bio-based building materials deriving from our own waste streams
• Colruyt Group signed the Flemish Concrete Agreement to reduce the use and environmental impact of concrete. With the Living Lab Circular Concrete, we are examining how we can find the most sustainable concrete mixture for each application, using as much as possible recycled materials and re-usable prefabricated elements.
• As part of the European ICEBERG project, we are conducting research with 34 partners from ten countries on the recycling of building materials from demolition (urban mining). When the Colruyt store in Deinze was demolished in 2022, we recovered the concrete to make carbonation blocks, which absorb CO2 during production instead of emitting it. We are currently examining possible applications for these blocks.
The EU ICEBERG project receives funding from the European Union’s Horizon 2020 research and innovation programme under grant agreement no. 869336.


• In 2019, we signed the Green Deal on ‘Circular Construction’. As a ‘Doer in Flanders’, we are pioneering the high-quality recycling of aerated concrete, recovering and analysing the concrete from the demolition of our buildings in 2022, which we will re-use as recycled aerated concrete afterwards.
This project receives support from Vlaanderen Circulair in collaboration with the Innovation & Enterprise Agency (VLAIO).
residual
85,5% Target:
Evolution of the amount of residual waste (tonnes) 2022 2021 2020 2019 2018 11.562 tonnes 12.842 tonnes 13.028 tonnes 13.484 tonnes 14.031 tonnes SUSTAINABILITY | SDG 2 • SDG 3 • SDG 6 • SDG 7 • SDG 8 • SDG 12 • SDG 13 • Sustainability indicators • EU Taxonomy 172
We reduce our amount of waste per million euros of revenue
every
year. We recycle at least 85% of our
streams.
85%
3 Conscious consumption
We are helping our customers consume more consciously through our range of products and services. Using visual labels such as our ‘Step by step’ icons, the Nutri-Score and the Eco-score, we inform and inspire them in a quick and easy way.
Saving points for the environment
In November 2022, Colruyt Group launched a savings programme rewarding customers for buying lowimpact products. Any product with an A or B Eco-score earns points. Once they have gained 100 points, customers can have a tree planted, a square metre of natural land or meadow made available, or can attend a workshop at Colruyt Group Academy on a sustainability topic. For this, we are joining forces with BeeOdiversity, GoodPlanet, Bûûmplanters and Nassonia.
Eco-score
To guide our customers towards a diet with a lower environmental impact, in March 2021 we were the first retailer to introduce the Eco-score in Belgium: a simple colour and letter code representing a product’s environmental impact. Today, of all Belgian retailers, we have made the most progress in its rollout.
• The Eco-score is already to be found on the packaging of more than 500 private-label products.

• At Colruyt Lowest Prices, Bio-Planet and Okay, the Eco-score is to be found on the price label.
• Customers can consult the Eco-score on various apps and on all Colruyt Group websites
• We are backing the Eco-score with advertising on TV, radio, online and in our stores. Our brochures are listing the Eco-score and the story behind it for more and more products.
• Market research shows that 41% of Belgian consumers know the Eco-score, with 73% correctly linking it to a product’s ecological footprint.
Between 3 November 2022 and 31 March 2023, 7.280 customers made use of their collected points. As a result of these joined efforts, 4.320 trees were planted, 7.125 m² of flower meadow was sowed and 2.610 m² of natural area was made available to black storcks.
= 2 points = 1 point = 6 points
173
SUSTAINABILITY | SDG 2 • SDG 3 • SDG 6 • SDG 7 • SDG 8 • SDG 12 • SDG 13 • Sustainability indicators • EU Taxonomy
SDG 13
We work day-in, day-out to minimise our impact on climate change, always with an eye to long-term results. We monitor our greenhouse gas emissions (such as CO2, methane and nitrous oxide) in accordance with the three scopes of the internationally recognised Greenhouse Gas (GHG) Protocol.
• Scope 1: direct emissions caused by our own building-, transport- and production-related activities.
• Scope 2: indirect emissions released when generating the energy we purchase.
• Scope 3: the indirect emissions – linked to our activities – that take place in the value chain, both at our suppliers and customers.
1 Avoiding and reducing greenhouse gas emissions: scopes 1 and 2
Thanks to the many projects within our CO2 reduction plan, we have already been able to present very good results in recent years: between 2008 and 2020, we reduced our relative greenhouse gas emissions in scopes 1 and 2 by more than 40%, relative to our revenue. To continue our efforts in a credible manner, we set new emission reduction targets approved by the Science Based Targets initiative (SBTi). This validation confirms that our goals are contributing to the Paris climate agreement to limit global temperature rise to maximum 1,5 °C.
Our scope 1 and 2 action plans focus on three decarbonisation levers emitting the most greenhouse gases. The bulk of our efforts aim to reduce these emissions. These levers are cooling, heating and mobility.
By 2022, we had already achieved 7,9% or 7.183 tonnes of CO2eq.
- 7,9%
2030 target: - 42%
Climate-friendly cooling
In 2017, we started switching to natural refrigerants in our Bio-Planet, Colruyt and Okay stores. Since then, 193 stores have been equipped with installations running on propane or propene cooling. These emit 90% less CO2 than installations running on synthetic refrigerants. The switch is expected to be completed by 2030. Thanks to our leak detection system based on artificial intelligence, we can detect refrigerant leaks early, thereby also cutting our climate impact. In our logistics chain, we use self-developed liquid ice containers for fresh produce and frozen foods, with a much smaller climate footprint than refrigerated carts running on CO₂. We now avoid more than 36.000 tonnes of CO2eq emissions a year compared to 2016, when we used only CO₂ cooling carts.
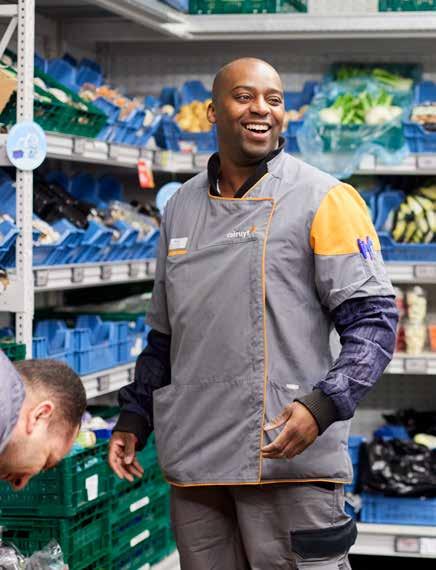
SUSTAINABILITY | SDG 2 • SDG 3 • SDG 6 • SDG 7 • SDG 8 • SDG 12 • SDG 13 • Sustainability indicators • EU Taxonomy
By 2030, we aim to emit 42% less direct greenhouse gases (in absolute values) than in 2021.
174
You can find the overview of all our SDG 13 sustainability indicators from p. 188.
Heating
In 2022, we emitted 16% less greenhouse gases for heating than the previous year. This sharp drop is due to aboveaverage outdoor temperatures and the conservation measures introduced because of the energy crisis. For example, Colruyt Lowest Prices reintroduced the insulating flaps in the fresh food market and we turned down the heating in our buildings. At the same time, we continue to renovate and add further insulation to our buildings, turning them into lowenergy stores. In addition, 123 stores are now equipped with a heat recovery system. 89 stores do not even use fossil fuels at all.
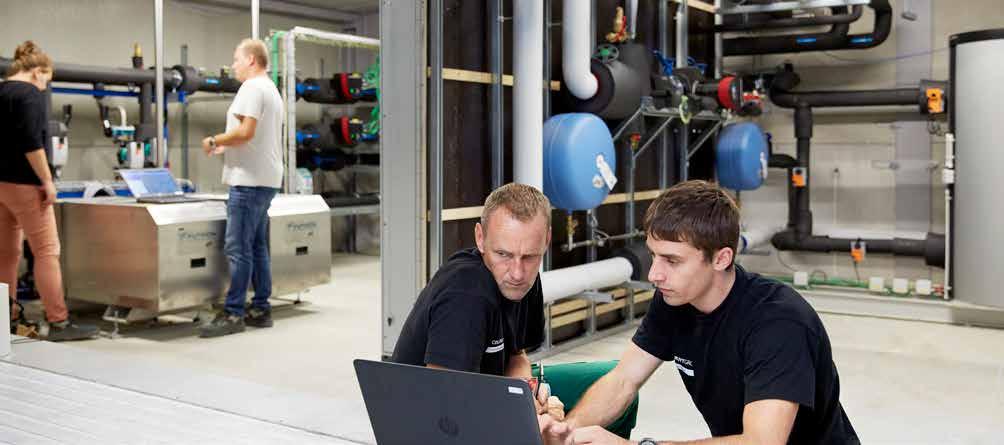
175
SUSTAINABILITY | SDG 2 • SDG 3 • SDG 6 • SDG 7 • SDG 8 • SDG 12 • SDG 13 • Sustainability indicators • EU Taxonomy 75 99 128 158 193 2018 2019 2020 2021 2022 Stores with refrigeration systems running on natural refrigerants 12 35 64 88 123 2018 2019 2020 2021 2022 Stores with heat recovery 5,19% 4,09% 3,96% 3,81% 3,97% 2018 2019 2020 2021 2022 Refrigerant leaks (%) 6.600 142 6.600 2.000 7.040 2.049 7.176 2.411 7.278 2.611 2018 2019 2020 2021 2022 Liquid ice containers for fresh products for frozen products 91 Total 119 28 116 Total 154 38 129 Total 182 53 133 Total 221 88 146 Total 258 112 2018 2019 2020 2021 2022 Low-energy stores new construction renovated
Zero-emission freight transport
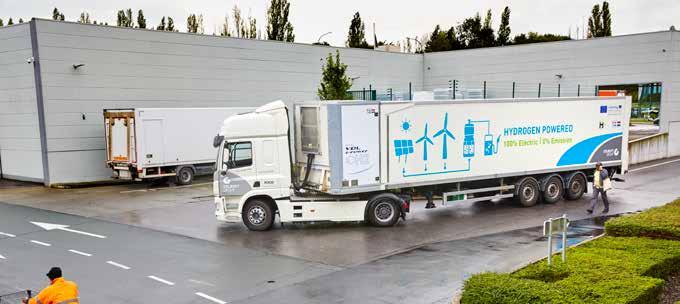
All transportation performed by our own drivers, suppliers and transport partners for Colruyt Group will be completely emission-free by 2035. Specifically, this covers the delivery of goods to our distribution centres, stores and customers. We will make our own freight transport zero-emission by 2030 using battery-electric and hydrogenelectric vehicles: i.e., no emission of CO2, nitrogen or particulate matter. By 2035, we intend to have taken the next step: our freight transport will then run entirely on green electricity and green hydrogen.
Zero-emission company vehicles
In financial year 2022/23, emissions from our company vehicles were higher than the previous year. With the corona crisis behind us, we are now seeing more employees coming to the office. Moreover, due to the high cost of CNG, we were forced to temporarily run our CNG vehicles on petrol. We expect a decrease in our emissions next year due to the continued shift to electric cars. We naturally support the federal government’s goal of a complete switch to zero-emission company vehicles by 2026, provided that sufficient charging points are available. We are already assuming our responsibility by supporting the accelerated rollout of charging points at our offices, stores and employees’ homes.
Renewable energy
Wherever possible, the energy we use comes from renewable sources. We ourselves produce green electricity from solar panels and are investing in onshore and offshore wind energy via Virya Energy. 99% of our electricity consumption is green. Read more about our sustainable energy policy from p. 162.
SUSTAINABILITY | SDG 2 • SDG 3 • SDG 6 • SDG 7 • SDG 8 • SDG 12 • SDG 13 • Sustainability indicators • EU Taxonomy
2022 2023/24 2021 2020 2019 2018 4,1% 21% 26,6% 79% 16,5% 11,6% 4,3% 42,7% 46% 46% 45,1% 41,2% 25,8% 35,1% 41% 49,2% 57,1% Diesel
CNG
Company vehicles in our fleet
cars
cars Hybrid cars Electric cars
Hydrogen cars Petrol cars
By 2035, all freight transport – by and for Colruyt Group – throughout the value chain should be zero-emission.
Orders for 2023/24 176
2 Avoiding and reducing greenhouse gas emissions: scope 3
Our operations also generate indirect greenhouse gas emissions, accounting for some 99% of our total emissions. We are identifying the processes and product categories with the greatest climate footprint, with these levers being tackled first, in close coordination with our suppliers.
Every two years, we conduct an Organisational Environmental Footprint (OEF) audit, in accordance with the European Commission’s recognised methodology. This allows us to assess the environmental footprint of our activities and products more broadly than when just looking at the impact category ‘Climate Change’.
How we go about reducing our indirect greenhouse gas emissions
Climate-conscious consumption
• Our food stores offer more than 520 fresh plant-based products as an alternative to animal protein, nearly double what it was five years ago. Through product development, we are continuing to broaden our range of vegetarian products. For example, Bio-Planet has developed three innovative burgers with less meat. Read more on p. 59. We are participating in several Belgian research projects on legumes, soy and protein-rich animal feed based on alfalfa and clover. Finally, we are motivating our customers to opt for plant-based alternatives through Colruyt Group Academy workshops, inspiring recipes and as the main sponsor of the VeggieChallenge.
• By displaying the Eco-score on our products, we are encouraging our customers to shop in an environment-friendlier way. In November 2022, we launched a savings programme that rewards customers for purchasing products with a low environmental impact. With the points saved, they can then support an ecological project. Read more on p. 173.
• For products and raw materials with known deforestation problems (such as wood, paper, cocoa, palm oil, soy and coffee), we opt for sustainability certificates for our own brands that guarantee sustainable forest management. Read more on p. 168.
Mobility of goods and employees
• The lorries delivering goods to our Colruyt stores have a load factor of 93,9%, thereby avoiding unnecessary mileage.
• Modal shift: wherever possible, we choose modes of transportation with a lower climate footprint, such as trains and barges. Thanks to Belgium’s canal network, we were able to avoid 4.448 lorry trips this year. All employees commuting by bicycle, on foot, by public transport or by carpool together saved 40.531.080 car miles.
• As of the beginning of 2022, our office workers can now work two days a week away from their base office (at home or in a regional office).
177 SUSTAINABILITY | SDG 2 • SDG 3 • SDG 6 • SDG 7 • SDG 8 • SDG 12 • SDG 13 • Sustainability indicators • EU Taxonomy
Distribution of greenhouse gas emissions in scope 3 67,4% Upstream purchasing 26,4% 0,1% 0,5% 5,6% Financial investments Employee mobility Freight transport Downstream products sold By
By 2022, we had already achieved
2027 target: 77% 28,5%
2027, 77% of our suppliers (by purchase figures) in the category ‘purchased products and services’ should have scientifically validated climate targets within the framework of the Science Based Targets initiative.
28,5%.
3 Removing greenhouse gases from the atmosphere
In addition to the measures to reduce our greenhouse gas emissions, we are committed to CO2capture via natural solutions.
As of 2030, we aim to have net zero emissions within scopes 1 and 2. We will then be removing at least as many greenhouse gases from the atmosphere as we emit.
Forest in the Democratic Republic of the Congo
Trees extract CO2 from the air by storing it in their biomass, making them one of the most efficient solutions to halt climate change. In 2021, we therefore started planting 10.000 hectares of forest in the Democratic Republic of the Congo. By the end of March 2023, we had already planted 3,8 million trees on 3.000 hectares, accounting for an estimated capture of 384 tonnes of CO2eq in financial year 2022/23. The largest trees are already more than four metres high.
Both ecologically and socially, we want to create added value for and with the local communities of the Kwango province.
• Employment: to plant the forest, we are employing several hundred local workers for at least three years. This number rises to 1.000 in peak periods.
• Agro-economy: we are encouraging local agricultural production by establishing production chains in and around our plots. For example, we have set up 11 cassava mills and started distributing fruit trees to villagers. We are looking at opportunities for vegetable growing and honey production.
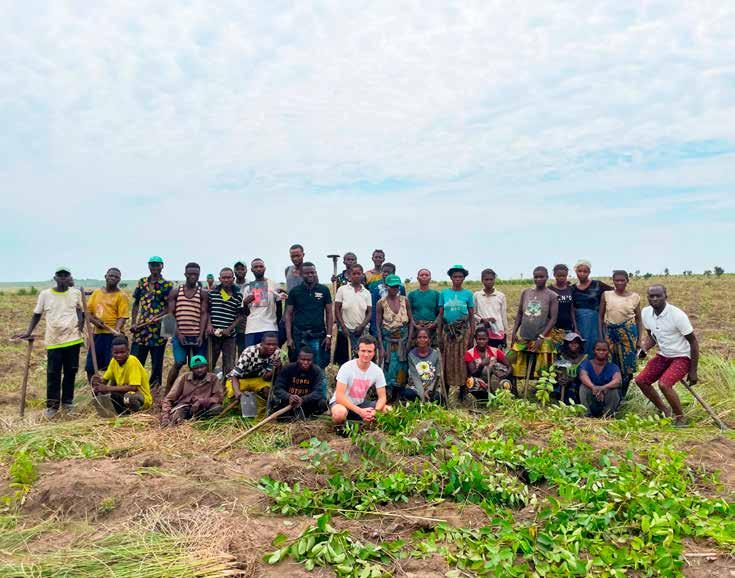
• Infrastructure: we are building a bridge over the Konzi River to connect the communities on its two banks, and are currently conducting demographic studies for the construction of schools and medical centres.
• Biodiversity: by planting different (native) tree species, we are creating four height levels for flora and varied habitats for animals. To prevent illegal practices (logging and burning), we have recruited a dozen local brigadiers responsible for preventing and extinguishing small fires and controlling firebreaks.
SUSTAINABILITY | SDG 2 • SDG 3 • SDG 6 • SDG 7 • SDG 8 • SDG 12 • SDG 13 • Sustainability indicators • EU Taxonomy
Expected capture by forest project Past emissions Expected emissions CO2 CO2 Our greenhouse gas emissions and capture 2021 2022 2023 2024 2025 2026 2027 2028 2029 2030 0 20.000 40.000 60.000 80.000 Tonnes of CO 2 eq (scopes 1 and 2) 178
Carbon farming
Together with the cooperative Vlaams Hoeverund, we launched several pilot projects in 2022 around ‘carbon farming’ or ‘carbon-aware agriculture’, a way to bind carbon in agricultural soils through alternative crop rotations and new cultivation techniques. This not only removes carbon from the air, but also makes the soil more fertile and resistant to erosion, drought and flooding: killing two birds with one stone. Based on the initial test results regarding carbon storage and yields, we have adjusted our approach for 2023.
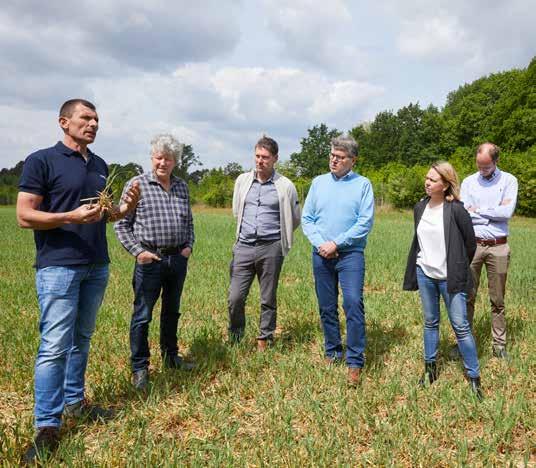
Two promising initiatives:
• Using woodchips as bedding for beef cattle and subsequently spreading it on fields along with farmyard manure to boost soil quality.
• Sowing fields with a mix of triticale, winter peas and vetches not only results in good carbon storage, but also replaces soy as a high-protein feed for young cattle.
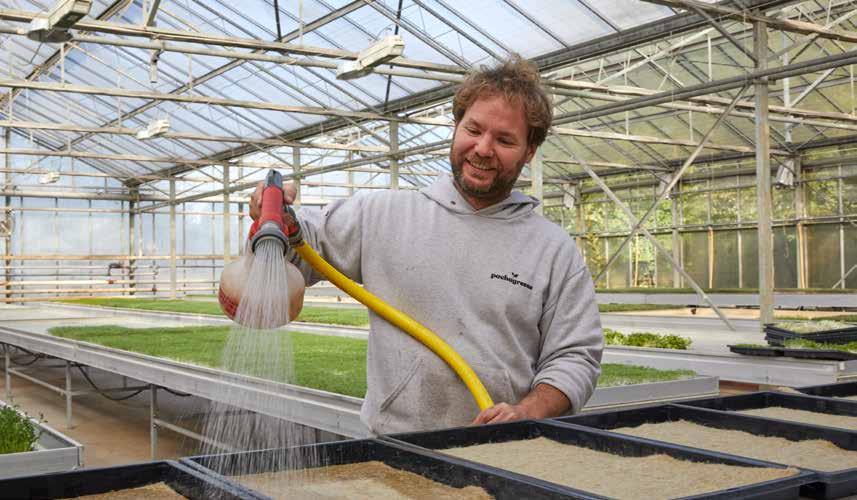
4 Adapting to climate change
At Colruyt Group, we have long been committed to mitigating the effects of climate change, primarily heatwaves, water shortages and flooding. This year, for the first time, we identified the physical and transition risks of climate change on our company, using inter alia a scenario analysis for our own operations, in accordance with RCP scenarios 2.6 and 8.5, with 2030 and 2050 as horizons. Based on these analyses, we can better target our actions.
• Circular water management: by collecting, treating and reusing wastewater and rainwater, we are less dependent on mains water. Read more on p. 160.
• Protecting water resources: by making hard surfaces permeable, buffering water and allowing targeted infiltration, we are maintaining the natural water cycle and avoiding flooding. Read more on p. 161.
• Climate-conscious building: when constructing our buildings, we consider factors such as flooding and orientation to the sun.
• Resilient cooling systems: we choose cooling systems that can withstand high peak temperatures, especially for our key facilities. Read more about our risk management from p. 137.
179 SUSTAINABILITY | SDG 2 • SDG 3 • SDG 6 • SDG 7 • SDG 8 • SDG 12 • SDG 13 • Sustainability indicators • EU Taxonomy
Our sustainability indicators
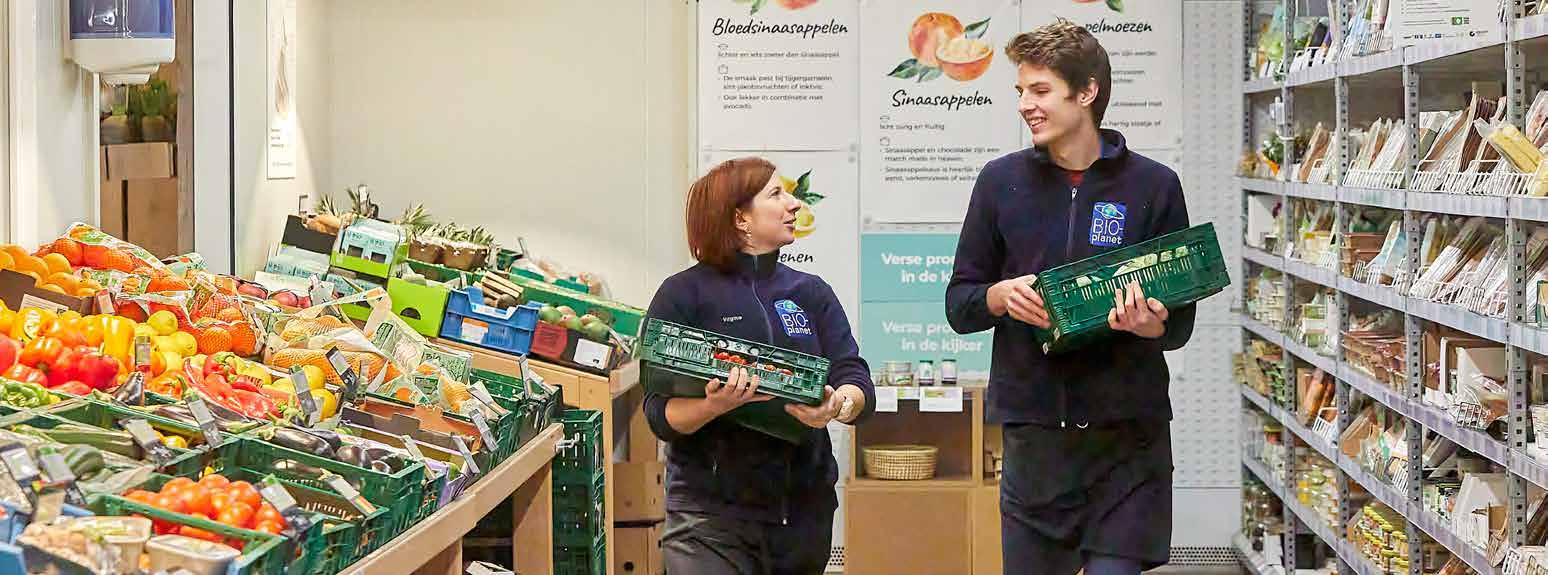
(1) 2020 2021 2022 Balanced nutrition for all Food donated to social organisations (in tonnes) Calendar year 4.504 5.622 6.649 % fresh produce actually sold Calendar year 97,33 96,98 96,83 (1) These indicators relate to
SUSTAINABILITY | SDG 2 • SDG 3 • SDG 6 • SDG 7 • SDG 8 • SDG 12 • SDG 13 • Sustainability indicators • EU Taxonomy
180
SDG 2 indicators
the food stores of Bio-Planet, Colruyt and Okay in Belgium.
SDG 2
(1) The indicators on nutritional composition cover our private-label brands Boni Selection and Everyday and the meat products in the butcher’s section and meat aisles of Colruyt and Okay.
SDG 3 - SDG 6
(1) These indicators relate to the water consumption of all sites in Belgium managed by Colruyt Group Technics. Drinking water for sales is not included.
181 SDG 3 indicators 2020 2021 2022 Balanced nutrition tailored to customer needs # products with improved nutritional composition (1) Calendar year 206 240 171 Reduction in fats (in tonnes) Calendar year 151,1 251,1 112,3 Reduction in saturated fats (in tonnes) Calendar year 109,5 116,8 66,1 Reduction in sugar (in tonnes) Calendar year 88,4 228,1 166,9 Reduction in salt (in tonnes) Calendar year 38,4 34,4 14,8 Added fibre (in tonnes) Calendar year 38 39,1 39 # Boni items with an improved Nutri-Score Calendar year 87 50 41 Guidance for a healthier lifestyle % of Boni products featuring the Nutri-Score on the packaging Calendar year 91 100 100 % of Spar products featuring the Nutri-Score on the packaging Calendar year 29 100 100 Safe and healthy working environment % employees who have joined the Solidarity Fund Financial year 65,0 69,0 67,63 Amount paid out by the Solidarity Fund (in EUR) Financial year 1.128.950 1.400.162 1.348.064 # occupational accidents Financial year 860 969 916 Frequency rate of occupational accidents Financial year 22,72 25,30 22,75 Severity rate of occupational accidents Financial year 0,59 0,69 0,54 # long-term sick employees contacted by The Connection Financial year 1.814 2.935 2.911
6 indicators (1) 2020 2021 2022
water management Total water consumption (in m³) Calendar year 592.468 560.578 598.066 % rainwater and wastewater Calendar year 29 33,4 36,11 Recycled wastewater (in m³) Calendar year 109.199 101.943 149.530
SDG
Circular
SUSTAINABILITY | SDG 2 • SDG 3 • SDG 6 • SDG 7 • SDG 8 • SDG 12 • SDG 13 • Sustainability indicators • EU Taxonomy
Using
avoided through our investments in green energy via our shareholding in Virya
(1) These indicators relate to the entire Colruyt Group, unless stated otherwise.
(2) Compared to previous years, the scope of this indicator has been expanded to include the consolidated scope of the entire Colruyt Group, in line with our climate reporting. This year we also report separately for Colruyt Group in Belgium and Luxembourg.
(3) To avoid double counting, the own produced and consumed electricity and heat from the co-generation installations are included only under the natural gas consumption to operate the CHP installations.
(4) After an update of the emission factors used, the historic data were also recalculated.
SUSTAINABILITY | SDG 2 • SDG 3 • SDG 6 • SDG 7 • SDG 8 • SDG 12 • SDG 13 • Sustainability indicators • EU Taxonomy SDG 7 indicators (1) 2020 2021 2022
and reducing energy consumption Total energy consumption of Colruyt Group (in MWh) (2) Calendar year – 633.200 606.013 Total energy consumption of Colruyt Group in Belgium and Luxembourg (in MWh) Calendar year – 580.015 556.281 Energy intensity (in MWh per million EUR revenue), normalised Calendar year – 62,6 58,5 Energy intensity in Belgium and Luxembourg (in MWh per million EUR revenue), normalised Calendar year – 61,0 57,9
Avoiding
energy smartly Average synchronisation level for central sites (in %) Calendar year 72 78,5 75,8 Producing and using renewable energy Total energy consumption from fossil sources (in MWh) (3) Calendar year – 356.483 328.190 Fuel consumption from crude oil and petroleum products (in MWh) Calendar year – 91.947 104.065 Fuel consumption from natural gas (in MWh) Calendar year – 263.181 219.393 Fuel consumption from other non-renewable sources (in MWh) Calendar year – 1.021 1.430 Energy consumption from nuclear sources (in MWh) Calendar year – 0 0 Consumption of purchased electricity, heat, steam and cold from non-renewable sources (in MWh) Calendar year – 334 3.301 Total energy consumption from non-fossil sources (in MWh) Calendar year – 276.717 277.823 Fuel consumption from renewable sources (incl. biogas, green hydrogen, etc.) (in MWh) Calendar year – 77 84 Consumption of purchased electricity, heat, steam and cold from renewable sources (in MWh) Calendar year – 276.641 277.739 Consumption of self-produced renewable energy (excl. fuels) (in MWh) Calendar year – 10.485 13.166 % renewable sources in our total energy consumption Calendar year – 43,7 45,8 % renewable electricity in our total electricity consumption Calendar year – 99,8 99 Green electricity production by Virya Energy on behalf of Colruyt Group (in MWh) Calendar year 1.135.562 949.336 925.315 CO2 emissions
(in tonnes) Calendar year 187.368 (4) 156.640 (4) 152.677 Offering renewable energy # DATS 24 electric charging stations Financial year 147 232 373 # Colruyt Group sites with charging stations Financial year 135 159 230 # public DATS 24 hydrogen filling stations Financial year 1 1 3
Energy
182
SDG 7
SDG 8
183 SUSTAINABILITY | SDG 2 • SDG 3 • SDG 6 • SDG 7 • SDG 8 • SDG 12 • SDG 13 • Sustainability indicators • EU Taxonomy SDG 8 indicators (1) 2020 2021 2022 Working at Colruyt Group # employees at Colruyt Group as a whole Financial year 32.945 32.996 33.384 Evolution of employee count for the entire Colruyt Group (net growth) Financial year 2.314 51 388 % full-time employees Financial year 78,56 78,43 78,76 % part-time employees Financial year 21,44 21,57 21,24 Average length of service (in years) Financial year 9,84 10,27 11 # student workers who have worked for Colruyt Group in the past year Financial year 8.484 8.949 10.432 # nationalities Financial year 89 89 94 # over-45s recruited Financial year 506 410 565 % women in leadership positions Financial year 27 28,01 28,57 Average gender pay gap (incl. fringe benefits)/FTE (in %) Financial year – – 2,27 Median gender pay gap (incl. fringe benefits)/FTE (in %) Financial year – – 1,6 # job switches Financial year 791 727 3.030 # employees subscribing to the capital increase Financial year 2.205 1.606 1.489 Total profit-sharing amount (in million EUR) Financial year 28,5 20,4 0 % employees represented by a social consultative body Financial year 94,4 94,0 93,4 % employees covered by a collective labour agreement Financial year – 100 100
(1) These indicators relate to Colruyt Group in Belgium, unless stated otherwise.
terminated due to a violation of the
(1) These indicators relate to Colruyt Group in Belgium, unless stated otherwise.
(2) The indicators on correct working conditions in the supply chain relate to producers of our private-label products.
SUSTAINABILITY | SDG 2 • SDG 3 • SDG 6 • SDG 7 • SDG 8 • SDG 12 • SDG 13 • Sustainability indicators • EU Taxonomy SDG 8 indicators (1) 2020 2021 2022 Learning and developing together Investment in education and training (in million EUR) Financial year 32,1 39,1 37,74 % payroll invested in education and training Financial year 2,41 2,82 2,61 # individual participants in personal growth and health training courses Financial year 1.562 1.548 2.702 # various personal growth and health training courses Financial year 73 55 82 # employees in a dual learning programme Financial year 185 211 240 # trainees Financial year 395 710 476 # traineeship programmes Financial year 10 14 8 # Colruyt Group Academy locations (incl. digital) Financial year 10 11 11 # participants in Colruyt Group Academy events for consumers Financial year 5.361 23.501 41.458 # various Colruyt Group Academy events for consumers Financial year 192 152 149 Investment amount Collibri Foundation (in EUR) Calendar year 798.860 907.846 1.152.935 # training projects supported by Collibri Foundation Calendar year 14 18 18 # young people directly involved in Collibri Foundation training projects Calendar year 9.350 10.480 11.202 Average number of training hours per employee Financial year – 27 37,26 Total number of training hours during the year (in millions) Financial year – 1,02 1,12 Correct working conditions in the supply chain (2) # producers monitored in at-risk countries Calendar year 487 485 404 % producers in at-risk countries receiving at least one audit Calendar year 97 81 64,35 % producers in at-risk countries with an acceptable social audit result Calendar year 95 96 90 # producers moving up from poor to acceptable results compared with previous year Calendar year 19 5 7 # producers with whom
has been
BSCI Code of Conduct Calendar year 3 5 1
cooperation
amfori
184
SDG 8 (continuation)
185 SUSTAINABILITY | SDG 2 • SDG 3 • SDG 6 • SDG 7 • SDG 8 • SDG 12 • SDG 13 • Sustainability indicators • EU Taxonomy SDG 12 indicators 2020 2021 2022 Responsible sourcing Fish # wild-caught fish, shellfish and crustacean products Calendar year 197 199 199 % wild-caught fish, shellfish and crustacean products certified with MSC Calendar year 84,3 85,4 82,4 % wild-caught fish, shellfish and crustacean products certified with MSC or verified by ILVO or ISSF Calendar year 96,4 98,5 98,9 # farmed fish, shellfish and crustacean products Calendar year 102 111 106 % farmed fish, shellfish and crustacean products ASC- or BIO-certified Calendar year 92,2 94,6 98,1 Coffee # coffee products Calendar year 125 105 141 % purchased coffee beans with certification (Rainforest Alliance (incl. UTZ), BIO, Fairtrade) Calendar year 99,6 100 100 % purchased coffee products with certification (Rainforest Alliance (incl. UTZ), BIO, Fairtrade) Calendar year 97 100 100 Cocoa # products containing cocoa Calendar year 301 310 329 % products containing cocoa with certification (Rainforest Alliance (incl. UTZ), BIO, Fairtrade) Calendar year 98 99,5 99,5 % chocolate bars and tablets with certification (Rainforest Alliance (incl. UTZ), BIO, Fairtrade) Calendar year 100 100 100 Soy for food Soy in food products (in tonnes) Calendar year 1.046,7 882,7 923,9 % GMO-free soy in food products (without
of GMO technologies) Calendar year 100 100 100 Soy for food in TIER 1 (at least 5% soy present in the product) (in tonnes) Calendar year 619 455 518 % TIER 1 soy for food with sustainability certification (RTRS, ProTerra, BIO) Calendar year 49 64,3 54,3 % TIER 1 soy for food with sustainability certification and/or from Europe or North America Calendar year 91 88,8 87,8 % TIER 1 soy for food offset by purchased RTRS credits Calendar year 9 11,2 12,2 Soy for food in TIER 5 (less than 5% soy present in the product) (in tonnes) Calendar year 428 428 406 % TIER 5 soy for food certified or offset by purchased RTRS credits Calendar year 100 100 100 Soy for feed Soy for feed used in meat and dairy production (in tonnes) Calendar year 33.100 41.246 37.778 Soy for feed purchased in Brazil or Argentina with purchased RTRS credits (in tonnes) Calendar year 33.100 41.246 37.778 % soy for feed offset by
RTRS
Calendar year 100 100 100 % RTRS credits purchased
Calendar year – 67,8 77,5
use
purchased
credits
from a cooperative that we have supported in its transition to more sustainable soy
SDG 12
SDG 12 indicators 2020 2021 2022 Palm oil and palm kernel oil Palm oil marketed (in tonnes) Calendar year 4.947,3 4.661 4.899,5 % RSPO-certified palm oil: mass balance Calendar year 12,8 1,1 1,5 % RSPO-certified palm oil: segregated Calendar year 84,9 98,6 98 % conventional palm oil offset by purchased RSPO credits Calendar year 2,3 0,3 0,5 % palm oil RSPO-certified or offset by purchased RSPO credits Calendar year 100 100 100 Palm kernel oil marketed (in tonnes) Calendar year 485,3 1.009,3 499,3 % RSPO-certified palm kernel oil: mass balance Calendar year 23,4 41,9 72 % RSPO-certified palm kernel oil: segregated Calendar year 30,2 58,1 28 % conventional palm kernel oil offset by purchased RSPO credits Calendar year 46,4 0 0 % RSPO-certified palm kernel oil Calendar year 100 100 100 Wood # products containing at least 60% wood Calendar year 235 246 237 % wood products with FSC or PEFC certification Calendar year 100 100 100 Paper # paper products Calendar year 233 295 314 % certified paper products (FSC, PEFC or Der Blaue Engel) Calendar year 99,6 100 100 Cotton % Dreambee cotton products, GOTS- or BC-certified Calendar year 91 100 100 # cotton products (briefs, vests, socks) at Colruyt, GOTS-certified Calendar year 12 64 80 International chain projects # active supply chain projects Calendar year 7 8 8 # products from supply chain projects in our stores Calendar year 40 46 41 # farmers indirectly involved in the supply chain projects (via cooperatives) Calendar year 43.864 49.864 45.011 # farmers directly involved in the supply chain projects (directly in the chain) Calendar year 2.174 2.320 2.176 SUSTAINABILITY | SDG 2 • SDG 3 • SDG 6 • SDG 7 • SDG 8 • SDG 12 • SDG 13 • Sustainability indicators • EU Taxonomy 186
SDG 12 (continuation)
(1) The packaging indicators relate to our private-label products.
(2) In the calculation of the 2022 figures, an error was found in the calculation for 2021. This has been corrected.
(3) The food loss and waste indicators relate to the retail activities of Colruyt Group in Belgium and Luxembourg: our retail formats, our distribution centres and the production centres of Fine Food, as well as the (limited) waste flows from our office buildings in Halle. Construction waste is not included.
187 SDG 12 (continuation) SDG 12 indicators 2020 2021 2022 Animal welfare % fresh eggs from cage-free or free-range hens Calendar year 100 100 100 % products containing eggs from cage-free or free-range hens Calendar year 100 100 100 % fresh rabbit meat from parks (excluding ready-made dishes) supplied via Fine Food Meat Calendar year 100 100 100 % fresh rabbit meat from parks (excluding preparations) Calendar year 100 100 100 Resource-saving use of raw materials Smarter packaging (1) Packaging material transitioned to sustainable materials (in kg) Calendar year – 2.030.888 (2) 2.480.220 Packaging material transitioned from non-recyclable to recyclable packaging (in kg) Calendar year – 82.861 1.490.078 Packaging material removed from the market (in kg) Calendar year 88.804 20.669 113.792 % recycled PET in beverage packaging Calendar year 22 32,62 34,67 Avoiding and reducing food loss (3) % fresh produce actually sold Calendar year 97,33 96,98 96,83 % unsold food incinerated or fermented Calendar year 66,8 65 61,3 % unsold food for human consumption Calendar year – 15,9 20,1 % unsold food to animal feed Calendar year – 18,8 18,2 % unsold food used in the biochemical industry Calendar year – 0,3 0,4 Avoiding and reducing waste (3) Recycling rate (in %) Calendar year 85,27 85,06 85,54 Conscious consumption % Belgian consumers indicating they know the Eco-score Financial year – – 41 % Belgian consumers indicating they link the Eco-score to the ecological footprint Financial year – – 73
SUSTAINABILITY | SDG 2 • SDG 3 • SDG 6 • SDG 7 • SDG 8 • SDG 12 • SDG 13 • Sustainability indicators • EU Taxonomy
(1) The data for base year 2021 have been recalculated compared to last year. Read more about this on p. 190.
(2) The indicators for stores using natural refrigerants, heat recovery and not using fossil fuels refer to the food stores of Bio-Planet, Colruyt and Okay in Belgium and Luxembourg.
(3) The indicators for low-energy stores refer to the stores of Bio-Planet, Colruyt, Cru, Dreambaby, Dreamland and Okay in Belgium and Luxembourg.
(4) The indicator on liquid ice containers relates to the food retail trade of Bio-Planet, Colruyt and Okay in Belgium and Luxembourg.
2020 2021 2022 Greenhouse gas emissions Greenhouse gas emissions scope 1 (in tonnes CO2eq) Calendar year – 90.889 (1) 83.194 % greenhouse gas emissions scope 1, regulated through emission allowances trading Calendar year 0 0 0 Greenhouse gas emissions scope 2: location-based (in tonnes CO2eq) Calendar year – 31.634 (1) 35.935 Greenhouse gas emissions scope 2: market-based (in tonnes CO2eq) Calendar year – 232 (1) 744 Greenhouse gas intensity scopes 1 and 2 (in tonnes CO2eq per million EUR turnover) Calendar year – 9,1 (1) 7,8 Greenhouse gas emissions scope 3 (in tonnes CO2eq) Calendar year – 8.226.920 (1) 8.159.641 Upstream purchasing Calendar year – 5.504.874 5.499.518 Downstream products sold Calendar year – 2.249.942 2.152.627 Freight transport Calendar year – 430.720 460.127 Employee mobility Calendar year – 39.698 40.205 Financial investments Calendar year – 1.686 7.164 Total greenhouse gas emissions: location-based (in tonnes CO2eq) Calendar year – 8.349.443 (1) 8.278.770 Total greenhouse gas emissions: market-based (in tonnes CO2eq) Calendar year – 8.318.041 (1) 8.243.579 % of suppliers affiliated to the Science Based Targets initiative (by purchase rate) Calendar year – – 28,5 Avoiding and reducing greenhouse gas emissions: scopes 1 and 2 % food stores equipped with natural refrigerants (2) Financial year – 35,7 43 % food stores equipped with heat recovery (2) Financial year – 19,9 27,4 % food stores without fossil fuels (2) Financial year – 10,2 19,8 % low-energy stores in total retail building stock (3) Financial year – 42,5 47,3 % rotations with liquid ice containers (4) Financial year 85,83 93,9 97,6 Refrigerant leakage rate (in %) Financial year 3,96 3,81 3,97 % zero-emission company vehicles Financial year – – 4,4
SDG 13 indicators
SUSTAINABILITY | SDG 2 • SDG 3 • SDG 6 • SDG 7 • SDG 8 • SDG 12 • SDG 13 • Sustainability indicators • EU Taxonomy 188
SDG 13
SDG 13 (continuation)
189 SDG 13 indicators 2020 2021 2022 Avoiding and reducing greenhouse gas emissions: scope 3 % employees cycling to work Financial year – 19,5 21 % employees coming to work by public transport Financial year – 5,8 6,3 % employees carpooling to work Financial year – 4 4 # truck journeys saved by the use of barges in Belgium Financial year 5.062 4.836 4.448 % outgoing deliveries in early mornings/late evenings and at night Financial year - 46,2 46 Load factor outgoing deliveries for Colruyt Lowest Prices (in %) Financial year 94,0 94 93,9 Removing greenhouse gases from the atmosphere # trees planted in the Democratic Republic of the Congo Financial year – 1.678.341 3.780.000 # hectares trees planted in the Democratic Republic of the Congo Financial year – – 3.000 Estimated CO2 absorption through forest planting in the Democratic Republic of the Congo (in tonnes CO2) Financial year – – 384
SUSTAINABILITY | SDG 2 • SDG 3 • SDG 6 • SDG 7 • SDG 8 • SDG 12 • SDG 13 • Sustainability indicators • EU Taxonomy
Restatement of base year figures
A significant part of emissions from natural gas consumption for 2021 was based on calculations. This has since been corrected in the historical data based on the actual invoices. Some errors in the fuel consumption of the company cars have also been rectified. In 2022, Roelandt Group and Newpharma were fully included in the consolidation scope. For the entities that were added to Colruyt Group throughout the reported year, the emissions of a complete year were considered. A few emission factors were updated. The data for base year 2021 has been recalculated to reflect these changes. For scope 3 also, a number of methodological improvements (mainly for the calculation of the product portfolio) led to a recalculation and thus a slightly adjusted base year. The threshold for recalculation is 5%.
Methodology
We report our scope 1, 2, and 3 carbon emissions data based on the Greenhouse Gas (GHG) Protocol Corporate Standard. CO2 emission data are in the form of a calculated CO2 equivalent, defined as actual CO2 emitted plus equivalent emissions of other relevant GHGs defined by the GHG Protocol.
Emission factors
The emission factors used in our calculation are applied in a hierarchical manner. This means that when looking for an emission factor we first consult the ADEME database (version Base Carbone 22.0). We source location-based electricity emission factors from the International Energy Agency (IEA, 2022 edition; 2020 data) and GWP values of refrigerants from the Intergovernmental Panel for Climate Change Assessment Report (2021). For numbers relating to production processes, we use primarily ECO Invent. For emission factors not found in any of the above we use DEFRA. For the impact of our product portfolio, we mainly use Agribalyse (through Simapro). The databases used in this exercise are updated regularly. We are working towards integrating more primary supplier data to increase the quality of our data.
Organisational boundaries
To identify the entities and activities of Colruyt Group included in the scopes, we have applied the ‘Financial Control’ principle. This principle states that operations that are fully consolidated in the financial accounts should be included in the scopes. Emissions from non-consolidated joint ventures and associated companies are accounted for in the ‘Financial investments’ category in scope 3.
SUSTAINABILITY | SDG 2 • SDG 3 • SDG 6 • SDG 7 • SDG 8 • SDG 12 • SDG 13 • Sustainability indicators • EU Taxonomy SDG
190
13 (continuation)
EU Taxonomy
Classification system for sustainable activities
The European Taxonomy Regulation (‘EU Taxonomy’) is part of the European Commission’s action plan for funding the European Green Deal. In this Green Deal, the European Union states among other things its ambition to reduce greenhouse gas emissions to net zero by 2050, making the EU climate-neutral. To achieve its targets, the European Commission foresees redirecting capital flows toward sustainable economic activities.
The EU Taxonomy is a classification system to determine whether an economic activity can be considered sustainable. In addition, the regulation also includes a financial reporting requirement for listed companies (cf. NFRD).
Although a ‘social taxonomy’ is set to follow, the term currently used is a ‘green taxonomy’. The EU Taxonomy Regulation currently defines six environmental objectives to which economic activities should contribute:
1. Climate change mitigation
2. Climate change adaptation
3. The sustainable use and protection of water and marine resources
4. The transition to a circular economy
5. Pollution prevention and control
6. The protection and restoration of biodiversity and ecosystems
Reporting year 2022/23
For reporting year 2022/23, companies are asked to identify which of their economic activities are potentially environmentally sustainable (‘eligible activities for the taxonomy’) with regard to the first two environmental objectives: climate change mitigation and adaptation – since only these two objectives have as yet been fully developed by the European Commission.
This year we also reviewed these eligible activities against the technical screening criteria and minimum social safeguards defined in the EU Taxonomy. In so doing, we identified the activities that are effectively environmentally sustainable according to the EU Taxonomy (‘aligned activities with the taxonomy’).
Finally, the Delegated Regulation (EU) 2021/2178 (‘Delegated Regulation’) requires companies to report the share of net turnover, capital expenditure (CapEx) and operating expenditure (OpEx) related to these eligible and aligned economic activities.
The EU Taxonomy is new and quite complex. As this legislation is still under development, we are closely monitoring evolutions and organising ourselves as best as possible to comply with the new reporting requirement. In assessing our economic activities, we deliberately opted for a conservative approach.
Scope of application for Colruyt Group
We evaluated the economic activities of all our fully consolidated companies Colruyt Group also invests indirectly in many sustainable economic activities whose disclosure is required by the Delegated Climate Regulation (EU) 2021/2139 (‘Delegated Climate Regulation’), but these investments are in associated companies outside the group of fully consolidated companies. For example, together with Korys, we are investing in the energy holding company Virya Energy whose main activity is the production of renewable energy and hydrogen. In our eligible activities, we refer briefly and separately to Virya Energy’s voluntary EU Taxonomy reporting
191
SUSTAINABILITY | SDG 2 • SDG 3 • SDG 6 • SDG 7 • SDG 8 • SDG 12 • SDG 13 • Sustainability indicators • EU Taxonomy
Eligible activities
Within the first two environmental objectives of the EU Taxonomy, the European Union is prioritising the economic activities emitting the most CO2, as well as activities facilitating their transformation. Colruyt Group is mainly active in food and non-food retail and wholesale, as well as food service. As these economic activities were not included in the Delegated Climate Regulation, our group’s main activities are outside its scope. One exception is Bike Republic, our bike chain In addition, within Colruyt Group we perform several important group support activities that do qualify for EU Taxonomy reporting on environmental objectives related to climate mitigation and adaptation.
Last year, we started by identifying our eligible activities, i.e. those activities primarily contributing to climate mitigation. Building on that exercise, we will now annually review the list of eligible activities.
For reporting year 2022/23, we have identified the following activities as eligible activities and thus as potentially environmentally sustainable according to the Delegated Climate Regulation:
8.1 Data processing, hosting and related activities
8.2 Computer programming, consultancy and related activities
7.2 Renovation of existing buildings
7.3 Installation, maintenance and repair of energy efficiency equipment
7.4 Installation, maintenance and repair of charging stations for electric vehicles in buildings (and parking spaces attached to buildings)
7.6 Installation, maintenance and repair of renewable energy technologies
7.7 Acquisition and ownership of buildings
Water supply, sewerage, waste management and remediation
6.4 Operation of personal mobility devices, cycle logistics
6.5 Transport by motorbikes, passenger cars and light commercial vehicles
6.6 Freight transport services by road
6.15 Infrastructure enabling low-carbon road transport and public transport
3.6 Manufacture of other low-carbon technologies
3.10 Manufacture of hydrogen
4.30 High-efficiency co-generation of heat/cool and power from fossil gaseous fuels
5.3 Construction, extension and operation of waste water collection and treatment
5.5 Collection and transport of non-hazardous waste in source segregated fractions
Zie de tabel op de volgende
voor toelichting. SUSTAINABILITY | SDG 2 • SDG 3 • SDG 6 • SDG 7 • SDG 8 • SDG 12 • SDG 13 • Sustainability indicators • EU Taxonomy
pagina
Transport
1.1 Afforestation Energy Construction and real estate activities
Manufacturing Information and communication Forestry
192
1.1 Forestry Afforestation
3.6 New Manufacturing Manufacture of other low-carbon technologies
3.10 Manufacturing Manufacture of hydrogen
4.30 New Energy
5.3 (Climate adaptation) New Water supply, sewerage, waste management and remediation
5.5 Water supply, sewerage, waste management and remediation
6.4 Transport
6.5 Transport
High-efficiency co-generation of heat/cool and power from fossil gaseous fuels
Construction, extension and operation of waste water collection and treatment
Collection and transport of non-hazardous waste in source segregated fractions
Operation of personal mobility devices, cycle logistics
Transport by motorbikes, passenger cars and light commercial vehicles
Forest planting in the Democratic Republic of the Congo
Liquid ice container: a type of refrigerated cart developed by Colruyt Group based on a frozen but liquid mixture (‘liquid ice’)
Hydrogen production by electrolysis
Co-generation installations at three Colruyt Group sites
Expansion of our in-house water treatment plant at Halle
Waste management
• Activities of Bike Republic, our bike chain
• Making purchased bicycles available to employees within the ‘Bike to work’ programme and leasing bicycles through a flex budget
Company vehicles, particularly company cars
6.6 Transport Freight transport services by road Company goods vehicles
6.15 Transport
Infrastructure enabling low-carbon road transport and public transport
• Hydrogen filling stations (including hydrogen storage) of DATS 24 NV
• Charging infrastructure for electric box vans run by Solucious
193 Activity number Sector Activity name Colruyt Group’s main activities
SUSTAINABILITY | SDG 2 • SDG 3 • SDG 6 • SDG 7 • SDG 8 • SDG 12 • SDG 13 • Sustainability indicators • EU Taxonomy
7.2
7.3
7.4
7.6
Construction and real estate activities
Construction and real estate activities
Construction and real estate activi-ties
Construction and real estate activities
Renovation of existing buildings
Installation, maintenance and repair of energy efficiency equipment
Installation, maintenance and repair of charging stations for electric vehicles in buildings (and parking spaces attached to buildings)
Installation, maintenance and repair of renewable energy technologies
Renovation of branches and sites
LED lighting
Charging stations for electric cars and towing tractors
Solar panels
7.7
8.1
Construction and real estate activities
Information and communication
8.2 (Climate adaptation) Information and communication
Acquisition and ownership of buildings
Data processing, hosting and related activities
Computer programming, consultancy and related activities
Colruyt Group also states a number of other economic activities reflected in the Delegated Climate Regulation, but which did not contribute in the past reporting year to net turnover, capital expenditure (CapEx) or operating expenditure (OpEx) as determined by the EU Taxonomy. This concerns the following economic activities:
• 3.3 Manufacture of low-carbon technologies for transport
• 7.5 Installation, maintenance and repair of instruments and devices for measuring, regulation and controlling energy performance of buildings
• 8.2 Data-driven solutions for GHG emissions reductions
• 9.1 Close to market research, development and innovation
• 9.3 Professional services related to energy performance of buildings
• Acquisition of buildings and buildings under own management, as well as the rights of use of buildings recognised in our balance sheet pursuant to IFRS 16
• New construction projects for own use
Data centre management
Software we develop ourselves
Voluntary EU Taxonomy reporting by Virya Energy
Virya Energy is not part of our consolidated reporting and is therefore not included in Colruyt Group’s EU Taxonomy reporting. Although the energy holding company is not currently within the scope of the EU Taxonomy, Virya Energy itself voluntarily reports on its eligible activities. For reporting year 2022/23, the eligible CapEx and OpEx total 99,0% and 99,7% respectively. Eligible turnover is 84,0%. For more information on this voluntary reporting, see www.virya-energy.com.
SUSTAINABILITY | SDG 2 • SDG 3 • SDG 6 • SDG 7 • SDG 8 • SDG 12 • SDG 13 • Sustainability indicators • EU Taxonomy
Activity number Sector Activity name Colruyt Group’s main activities
194
Aligned activities
Technical screening criteria
To determine whether eligible activities are effectively aligned with the Delegated Climate Regulation, we thoroughly analysed each activity, assessing them against the technical screening criteria. For each environmental objective, these ambitious criteria set the conditions for determining that an activity:
• makes a substantial contribution to one of the six environmental goals (‘substantial contribution’),
• and does not significantly harm the five other environmental objectives (‘do no significant harm’)
For reporting year 2022/23, we assessed our activities against the technical screening criteria of the first two environmental objectives: climate change mitigation and adaptation. Most of our eligible activities are related to the mitigation objective. Solely the activities ‘5.3 Construction, extension and operation of waste water collection and treatment’ and ‘8.2 Computer programming, consulting and related activities’ come under the adaptation objective.
The following table provides an overview of the activities and their assessment against the
technical screening criteria
For the requirements listed in Annex A of the Delegated Climate Regulation, we refer to the comprehensive risk assessment
exercise we conducted this reporting year regarding the physical impact of climate change on our corporate activities and their corresponding assets. In this, we considered climate projections until 2050 and evaluated both existing and future adaptation measures. Read more about the risk assessment from p. 137.
3.10 Manufacture of hydrogen
Forest planting in the Democratic Republic of the Congo
Liquid ice container: a type of refrigerated cart developed by Colruyt Group based on a frozen but liquid mixture ('liquid ice’)
Hydrogen production by electrolysis
•
technical screening criteria
Working closely with the project team, the technical screening criteria were extensively reviewed and positively assessed, thanks to a well-supported afforestation plan and appropriate documentation. Among other things, the project is leading to a demonstrable improvement in terms of biodiversity and water management.
Our liquid ice refrigerated carts are making a substantial contribution to reducing greenhouse gas emissions, as also demonstrated by an externally verified environmental impact study. In addition, the principles of circular economy are met, while the use of hazardous materials is avoided.
High-efficiency
•
•
The production of hydrogen by electrolysis at one of our logistics sites was not retained, in part because the reduction in greenhouse gas emissions has not been verified by an independent third party. The activity was therefore not considered aligned.
Our co-generation plants predate reporting year 2022/23 and do not meet all technical screening criteria. For example, these facilities did not replace any of the facilities listed in the criteria, while, among other things, the requirement for thirdparty verification was also not met. The activity was thus not considered aligned.
195
Activity number Activity name Colruyt Group’s main activities Net turnover CapEx OpEx Assessment
1.1
using the
Afforestation
3.6 New Manufacture of other low-carbon technologies
• •
4.30 New
co-generation of heat/cool and power from fossil gaseous fuels
Co-generation installations at three Colruyt Group sites
SUSTAINABILITY | SDG 2 • SDG 3 • SDG 6 • SDG 7 • SDG 8 • SDG 12 • SDG 13 • Sustainability indicators • EU Taxonomy
5.3 (Climate adaptation) New
Construction, extension and operation of waste water collection and treatment Expansion of in-house water treatment plant at Halle
•
Our water treatment plant purifies wastewater into drinking water. Because this process requires more energy than described in the technical screening criteria, this activity cannot be retained for the environmental climate mitigation objective. The activity does meet the criteria of the environmental climate adaptation objective, including the comprehensive analysis of physical climate risks and their monitoring.
5.5
Collection and transport of non-hazardous waste in source segregated fractions Waste management
• Activities of Bike Republic, our bike chain
For many years, we have been committed to separately collecting and transporting non-hazardous waste. This is evidenced in part by our annual reporting of our recycling rate. The technical screening criteria are thus met.
6.4
Operation of personal mobility devices, cycle logistics
•
The activities of our bike chain Bike Republic meet the criteria of the environmental climate mitigation objective primarily due to the nature of its activities. This also applies to the bike programmes for our employees. In performing these activities, we take measures in line with the principles of the circular economy: both by properly maintaining the bikes and by reusing the bikes themselves, parts or materials.
6.5
Transport
by motorbikes, passenger cars and light commercial vehicles Company vehicles, particularly company cars
6.6 Freight transport services by road Company goods vehicles
6.15 Infrastructure enabling low-carbon road transport and public transport
Hydrogen filling stations (including hydrogen storage) of DATS 24 NV
Charging infrastructure for electric box vans run by Solucious
•
SUSTAINABILITY | SDG 2 • SDG 3 • SDG 6 • SDG 7 • SDG 8 • SDG 12 • SDG 13 • Sustainability indicators • EU Taxonomy 196
Activity number Activity name Colruyt Group’s main activities Net turnover CapEx OpEx Assessment using the technical screening criteria
• •
• Making purchased bikes available to employees within the ‘Bike to work’ programme and leasing bikes through a flex budget • •
• •
The electric cars, plug-in hybrids and hydrogen cars in our fleet meet the substantial contribution criteria because they emit less than 50 grams of CO2/km. In coordination with suppliers, the DNSH criteria ('do no significant harm') were also assessed positively, such as those of the circular economy (e.g., % recyclable) and pollution (e.g., requirements relating to rolling noise emissions).
• • Our electric delivery vans and tractors meet both the substantial contribution criteria and the DNSH criteria. The criteria have a similar structure to activity 6.5.
•
•
•
The technical screening criteria for the hydrogen filling stations run by DATS 24 NV received a positive assessment, thanks in part to close monitoring by the environmental department, the obligation for contractors to demolish selectively and the handling of hazardous materials by a specialised external party. The charging infrastructure for Solucious' electric box vans was not retained.
7.2
Renovation of existing buildings
Renovation of branches and sites
• •
After in-depth consultations, we have decided not to recognise a positive assessment for the renovation of our existing buildings yet. We prefer to take a conservative approach and trust that we will meet these criteria sufficiently quickly. The activity is thus not considered aligned.
7.3
Installation, maintenance and repair of energy efficiency equipment
LED lighting
• For LED lighting, the prescribed DNSH criteria for climate adaptation as wel as pollution have been met. The activity is considered aligned.
7.4
Installation, maintenance and repair of charging stations for electric vehicles in buildings (and parking spaces attached to buildings)
Charging stations for electric cars and towing tractors
•
•
Our activities related to charging stations (installation, maintenance and repair) for electric cars and towing tractors meet the technical screening criteria mainly because of the nature of the activities.
7.6
Installation, maintenance and repair of renewable energy technologies Solar panels
•
•
Our solar panel activities (installation, maintenance and repair) meet the technical screening criteria, in particular the requirements set forth in Annex A. The solar panels we have installed as part of the new construction projects aligned with activity 7.7 are included under that activity.
7.7
Acquisition and ownership of buildings
8.1 Data processing, hosting and related activities
• Acquisition of buildings and buildings under own management, as well as the rights of use of buildings recognised in our balance sheet pursuant to IFRS 16
• New construction projects for own use
•
The alignment of these activities with the EU Taxonomy is, for now, limited to new construction projects carried out in the past reporting year. Those buildings are intended for own use and not for sale. These activities are aligned with the technical screening criteria of activity 7.7, with a particular focus on building energy performance.
Data centre management
• •
This activity was not considered aligned because not all technical screening criteria were met. Again, for the substantial contribution criteria, verification by an independent third party was lacking.
8.2 (Climate adaptation) Computer programming, consultancy and related activities
Software we develop ourselves
• •
Although the technical screening criteria for these IT-related activities were initially assessed positively, at the time the annual report was being prepared there was still uncertainty as to which CapEx and OpEx expenditure could be included as aligned with the environmental climate adaptation objective (cf. question 19 of the second Commission Notice Dec/2022). We are deliberately taking a conservative approach and do not yet consider this activity aligned.
197 Activity number Activity name Colruyt Group’s main activities Net turnover CapEx OpEx Assessment using the technical screening criteria
SUSTAINABILITY | SDG 2 • SDG 3 • SDG 6 • SDG 7 • SDG 8 • SDG 12 • SDG 13 • Sustainability indicators • EU Taxonomy
Minimum social safeguards
In addition to the technical screening criteria, the EU Taxonomy’s minimum social safeguards must also be met. These mainly relate to human rights, anticorruption, taxation and fair competition. The minimum social safeguards require organisations to establish processes in alignment with the OECD Guidelines for Multinational Enterprises and UN Guiding Principles on Business and Human Rights
Colruyt Group’s commitment to the social minimum safeguards of the EU Taxonomy is resolutely in line with these guidelines. We evaluated the minimum social safeguards at both aggregate level and the level of our economic activities pursuant to the EU Taxonomy. Supplementing the Delegated Regulation, the report of the ‘Platform on Sustainable Finance’, an advisory body to the European Commission, was also taken into account.
Consult p. 123 for more information on sustainable corporate governance at Colruyt Group. Read more about our human rights, bribery and corruption policies at www.colruytgroup.com, under ‘Shareholders’ information’.
EU Taxonomy key performance indicators (KPIs)
Finally, the EU Taxonomy legislation includes a financial reporting requirement on the allocation of financial flows to eligible and aligned activities. The Delegated Regulation requires companies to report the share of net turnover, capital expenditures (CapEx) and operating expenditures (OpEx) in each case.
As mentioned earlier, our main activities do not currently come under the scope of the EU Taxonomy. As a result, a large share of our corporate activities does not currently qualify for calculating the KPIs. That said, our ambition for our retail activities is to be a point of reference for sustainable business and an inspiration for conscious consumption, throughout the value chain.
To avoid double counting, we have always followed our financial reporting processes, eliminating intra-group transactions at the consolidated level. The complete overview of all financial information for our eligible and aligned activities is available from p. 201.
Turnover
Turnover in terms of the EU Taxonomy definition corresponds to the consolidated revenue of Colruyt Group, to be found in the consolidated income statement in the financial report (1) on p. 207. In accordance with accounting policies and IFRS standards, revenue from discontinued operations (activities related to DATS 24 NV) has not been included. Our valuation rules can be found in Note 1. Significant accounting policies from p. 223.
For reporting year 2022/23, eligible turnover relates to the operations of our bike chain Bike Republic. This represents 0,42% of our total consolidated turnover. Since the activities of our bike chain passed the test against the technical screening criteria, the aligned turnover also corresponds to 0,42%.
(1) “Turnover” in terms of the EU Taxonomy definition is referred to as “revenue” by Colruyt Group in its financial report.
SUSTAINABILITY | SDG 2 • SDG 3 • SDG 6 • SDG 7 • SDG 8 • SDG 12 • SDG 13 • Sustainability indicators • EU Taxonomy
198
The CapEx reported under the EU Taxonomy includes capital expenditure and investments resulting from business combinations for tangible and intangible assets, including capitalised development costs and assets corresponding to a right of use and excluding goodwill. The investments in DATS 24 NV that meet the CapEx definition have been taken into account until the date they were classified as discontinued operations.
Reported CapEx as part of the EU Taxonomy may differ from other investments listed in the annual report. Colruyt Group also uses other ‘alternative performance measures’ to provide insight into its investments.
The total CapEx for calculating the financial KPIs can be reconciled directly with the items reported in Note 10. Intangible assets on p. 247 and 11. Property, plant and equipment on p. 249 and is composed as follows:
For reporting year 2022/23, total CapEx for the EU Taxonomy was EUR 524,0 million.
Total eligible CapEx ended up at 64,64%, of which 12,46% was aligned CapEx.
(1) Note 11 includes under revaluation both the effect of indexations and changes in the lease portfolio. As part of the EU Taxonomy, CapEx includes only new additions to our lease portfolio.
In February 2023, Colruyt Group went ahead with issuing a green retail bond for the first time, following the principles of the International Capital Market Association (ICMA). Read more about the issue on p. 148. The allocation process related to the retail bond was ongoing at the time the annual report was being prepared. Any adjustments to the financial KPIs, as required by the Delegated Regulation, will therefore only be included as of reporting year 2023/24.
199 (in million EUR) Note 2022/23 Intangible assets 10. Acquisitions 69,6 Acquisitions through business combinations 0,7 Property, plant and equipment 11. Revaluation of right-of-use assets (1) 30,5 Acquisitions 406,6 Acquisitions through business combinations 16,6 Total CapEx EU Taxonomy 524,0
CapEx
Aligned CapEx 12,46% Non-eligible CapEx 35,36% Eligible CapEx (excluding aligned CapEx) 52,18% SUSTAINABILITY | SDG 2 • SDG 3 • SDG 6 • SDG 7 • SDG 8 • SDG 12 • SDG 13 • Sustainability indicators • EU Taxonomy
The OpEx definition for the EU Taxonomy is limited to:
• research and development,
• building renovation measures,
• short-term leases,
• maintenance and repair,
• and other direct expenses related to the day-to-day maintenance of property, plant and equipment by the company or third parties, which are necessary to ensure the continued and effective operation of these assets.
In accordance with accounting policies and IFRS standards, the operating costs of discontinued operations (activities related to DATS 24 NV) were not included.
The above interpretation does not correspond to how Colruyt Group monitors and reports OpEx in the annual financial report. For the EU Taxonomy, the composition of the reported OpEx in the current annual report differs from that of reporting year 2021/22, which included total OpEx as reported in the annual financial report. If we were to reapply last year’s method of calculation, this would lead to the following composition for reporting year 2022/23:
Following further fine-tuning of our EU Taxonomy reporting, the OpEx composition was brought more in line with the definition set forth in the EU Taxonomy. The OpEx for reporting year 2022/23 can be aligned with the items reported in Notes 5 and 10 and is composed as follows:
The OpEx of the eligible activities would then total 4,92% and that of the aligned activities 0,32%.
For reporting year 2022/23, total eligible OpEx with this new definition amounted to EUR 113,0 million or 54,20% of total OpEx. Of that, 3,36% is aligned OpEx
Not all financial flows related to OpEx can currently be extracted from our systems. As a result, some of the reported OpEx was calculated based on financial and operational parameters.
OpEx
(in million EUR) Note 2022/23 Other operating income and expenses 4. -119,5 Services and miscellaneous goods 5. 717,4 Employee benefit expenses 6. 1.611,3 Total OpEx EU Taxonomy 2.209,2
(in million EUR) Note 2022/23 Rental and rental-related charges 5. 35,4 Maintenance and repairs 5. 86,1 Other direct expenditure related to the daily maintenance (esp. personnel costs) 35,3 Non-activated costs related to research and development 10. 55,9 Elimination double countings -4,3 Total OpEx EU Taxonomy 208,5
SUSTAINABILITY | SDG 2 • SDG 3 • SDG 6 • SDG 7 • SDG 8 • SDG 12 • SDG 13 • Sustainability indicators • EU Taxonomy
200
Overview of financial KPIs
Turnover
Substantial contribution criteria
DNSH
(‘Does Not Significantly Harm’)
A.2 Taxonomy-eligible but not environmentally sustainable activities (not Taxonomy-aligned activities)
of Taxonomy-eligible but not environmentally sustainable activities (not Taxonomy-aligned activities)
B. TAXONOMY-NON-ELIGIBLE ACTIVITIES
201 SUSTAINABILITY | SDG 2 • SDG 3 • SDG 6 • SDG 7 • SDG 8 • SDG 12 • SDG 13 • Sustainability indicators • EU Taxonomy
criteria
Economic activities (1) Code(s) (2) Absolute turnover (3) Proportion of turnover (4) Climate change mitigation (5) Climate change adaptation (6) Water and marine resources (7) Circular economy (8) Pollution (9) Biodiversity and ecosystems (10) Climate change mitigation (11) Climate change adaptation (12) Water and marine resources (13) Circular economy (14) Pollution (15) Biodiversity and ecosystems (16) Minimum safeguards (17) Taxonomy-aligned proportion of turnover, year N (18) Taxonomy-aligned proportion of turnover, year N-1 (19) Category ('enabling activity' (E)) (20) Category ('transitional activity' (T)) (21) in million EUR % % % % % % % Y/N Y/N Y/N Y/N Y/N Y/N Y/N % % E T
TAXONOMY-ELIGIBLE ACTIVITIES
Environmentally sustainable activities (Taxonomy-aligned) Operation of personal mobility devices, cycle logistics 06.04 41,7 0,42% 100,00% 0,00% N/A N/A N/A N/A N/A Y N/A Y N/A N/A J 0,42% N/A Turnover of environmentally sustainable activities (Taxonomy-aligned) (A.1) 41,7 0,42% 0,42% N/A
A.
A.1
Turnover
(A.2) 0,0 0,00% 0,00% N/A Total (A.1 + A.2) 41,7 0,42% 0,42% N/A
Turnover of Taxonomy-non-eligible activities (B) 9.891,9 99,58% Total (A + B) 9.933,6 100,00%
CapEx
A. TAXONOMY-ELIGIBLE ACTIVITIES
A.1
SUSTAINABILITY | SDG 2 • SDG 3 • SDG 6 • SDG 7 • SDG 8 • SDG 12 • SDG 13 • Sustainability indicators • EU Taxonomy
Substantial contribution criteria DNSH criteria (‘Does Not Significantly Harm’) Economic activities (1) Code(s) (2) Absolute CapEx (3) Proportion of CapEx (4) Climate change mitigation (5) Climate change adaptation (6) Water and marine resources (7) Circular economy (8) Pollution (9) Biodiversity and ecosystems (10) Climate change mitigation (11) Climate change adaptation (12) Water and marine resources (13) Circular economy (14) Pollution (15) Biodiversity and ecosystems (16) Minimum safeguards (17) Taxonomy-aligned proportion of CapEx, year N (18) Taxonomy-aligned proportion of CapEx, year N-1 (19) Category ('enabling activity' (E)) (20) Category ('transitional activity' (T)) (21) in million EUR % % % % % % % Y/N Y/N Y/N Y/N Y/N Y/N Y/N % % E T
(Taxonomy-aligned) Afforestation 01.01 1,0 0,18% 100,00% 0,00% N/A N/A N/A N/A N/A Y Y N/A Y Y Y 0,18% N/A Manufacture of other low-carbon technologies 03.06 1,1 0,21% 100,00% 0,00% N/A N/A N/A N/A N/A Y Y Y Y Y Y 0,21% N/A E Construction, extension and operation of waste water collection and treatment 05.03 0,5 0,10% 0,00% 100,00% N/A N/A N/A N/A Y N/A Y N/A Y Y Y 0,10% N/A Collection and transport of non-hazardous waste in source segregated fractions 05.05 0,0 0,01% 100,00% 0,00% N/A N/A N/A N/A N/A Y N/A Y N/A N/A Y 0,01% N/A Operation of personal mobility devices, cycle logistics 06.04 6,4 1,22% 100,00% 0,00% N/A N/A N/A N/A N/A Y N/A Y N/A N/A Y 1,22% N/A Transport by motorbikes, passenger cars and light commercial vehicles 06.05 21,1 4,03% 100,00% 0,00% N/A N/A N/A N/A N/A Y N/A Y Y N/A Y 4,03% N/A T Freight transport services by road 06.06 1,3 0,25% 100,00% 0,00% N/A N/A N/A N/A N/A Y N/A Y Y N/A Y 0,25% N/A Infrastructure enabling low-carbon road transport and public transport 06.15 1,0 0,20% 100,00% 0,00% N/A N/A N/A N/A N/A Y Y Y Y Y Y 0,20% N/A E Installation, maintenance and repair of energy efficiency equipment 07.03 0,4 0,07% 100,00% 0,00% N/A N/A N/A N/A N/A Y N/A N/A Y N/A Y 0,07% N/A E Installation, maintenance and repair of charging stations for electric vehicles in buildings (and parking spaces attached to buildings) 07.04 4,6 0,88% 100,00% 0,00% N/A N/A N/A N/A N/A Y N/A N/A N/A N/A Y 0,88% N/A E Installation, maintenance and repair of renewable energy technologies 07.06 2,5 0,47% 100,00% 0,00% N/A N/A N/A N/A N/A Y N/A N/A N/A N/A Y 0,47% N/A E Acquisition and ownership of buildings 07.07 25,4 4,84% 100,00% 0,00% N/A N/A N/A N/A N/A Y N/A N/A N/A N/A Y 4,84% N/A CapEx of environmentally sustainable activities (Taxonomy-aligned) (A.1) 65,3 12,46% 12,46% N/A 202
Environmentally sustainable activities
CapEx (continuation)
203 SUSTAINABILITY | SDG 2 • SDG 3 • SDG 6 • SDG 7 • SDG 8 • SDG 12 • SDG 13 • Sustainability indicators • EU Taxonomy
contribution criteria DNSH criteria (‘Does Not Significantly Harm’) Economic activities (1) Code(s) (2) Absolute CapEx (3) Proportion of CapEx (4) Climate change mitigation (5) Climate change adaptation (6) Water and marine resources (7) Circular economy (8) Pollution (9) Biodiversity and ecosystems (10) Climate change mitigation (11) Climate change adaptation (12) Water and marine resources (13) Circular economy (14) Pollution (15) Biodiversity and ecosystems (16) Minimum safeguards (17) Taxonomy-aligned proportion of CapEx, year N (18) Taxonomy-aligned proportion of CapEx, year N-1 (19) Category ('enabling activity' (E)) (20) Category ('transitional activity' (T)) (21) in million EUR % % % % % % % Y/N Y/N Y/N Y/N Y/N Y/N Y/N % % E T
Substantial
sustainable activities (not Taxonomy-aligned
Transport by motorbikes, passenger cars and light commercial vehicles 06.05 11,4 2,17% Freight transport services by road 06.06 1,7 0,32% Infrastructure enabling low-carbon road transport and public transport 06.15 0,0 0,01% Renovation of existing buildings 07.02 88,0 16,80% Acquisition and ownership of buildings 07.07 111,4 21,25% Data processing, hosting and related activities 08.01 0,1 0,01% Computer programming, consultancy and related activities 08.02 60,9 11,62% CapEx of Taxonomy-eligible but not environmentally sustainable activities (not Taxonomy-aligned activities) (A.2) 273,5 52,18% 0,00% N/A Total (A.1 + A.2) 338,8 64,64% 12,46% N/A B. TAXONOMY-NON-ELIGIBLE ACTIVITIES CapEx of Taxonomy-non-eligible activities (B) 185,3 35,36% Total (A + B) 524,0 100,00%
A.2 Taxonomy-eligible but not environmentally
activities)
OpEx
A.1
DNSH
Substantial contribution criteria
SUSTAINABILITY | SDG 2 • SDG 3 • SDG 6 • SDG 7 • SDG 8 • SDG 12 • SDG 13 • Sustainability indicators • EU Taxonomy
criteria (‘Does Not
Economic activities (1) Code(s) (2) Absolute OpEx (3) Proportion of OpEx (4) Climate change mitigation (5) Climate change adaptation (6) Water and marine resources (7) Circular economy (8) Pollution (9) Biodiversity and ecosystems (10) Climate change mitigation (11) Climate change adaptation (12) Water and marine resources (13) Circular economy (14) Pollution (15) Biodiversity and ecosystems (16) Minimum safeguards (17) Taxonomy-aligned proportion of OpEx, year N (18) Taxonomy-aligned proportion of OpEx, year N-1 (19) Category ('enabling activity' (E)) (20) Category ('transitional activity' (T)) (21) in million EUR % % % % % % % Y/N Y/N Y/N Y/N Y/N Y/N Y/N % % E T A. TAXONOMY-ELIGIBLE ACTIVITIES
Significantly Harm’)
Environmentally
activities (Taxonomy-aligned) Manufacture of other low-carbon technologies 03.06 1,2 0,60% 100,00% 0,00% N/A N/A N/A N/A N/A Y Y Y Y Y Y 0,60% N/A E Collection and transport of non-hazardous waste in source segregated fractions 05.05 0,0 0,01% 100,00% 0,00% N/A N/A N/A N/A N/A Y N/A Y N/A N/A Y 0,01% N/A Operation of personal mobility devices, cycle logistics 06.04 0,7 0,33% 100,00% 0,00% N/A N/A N/A N/A N/A Y N/A Y N/A N/A Y 0,33% N/A Transport by motorbikes, passenger cars and light commercial vehicles 06.05 2,2 1,06% 100,00% 0,00% N/A N/A N/A N/A N/A Y N/A Y Y N/A Y 1,06% N/A T Freight transport services by road 06.06 0,2 0,10% 100,00% 0,00% N/A N/A N/A N/A N/A Y N/A Y Y N/A Y 0,10% N/A Infrastructure enabling low-carbon road transport and public transport 06.15 0,6 0,30% 100,00% 0,00% N/A N/A N/A N/A N/A Y Y Y Y Y Y 0,30% N/A E Installation, maintenance and repair of charging stations for electric vehicles in buildings (and parking spaces attached to buildings) 07.04 1,9 0,95% 100,00% 0,00% N/A N/A N/A N/A N/A Y N/A N/A N/A N/A Y 0,95% N/A E Installation, maintenance and repair of renewable energy technologies 07.06 0,1 0,06% 100,00% 0,00% N/A N/A N/A N/A N/A Y N/A N/A N/A N/A Y 0,06% N/A E OpEx of environmentally sustainable activities (Taxonomy-aligned) (A.1) 7,0 3,36% 3,36% N/A 204
sustainable
OpEx (continuation)
A.2
205 SUSTAINABILITY | SDG 2 • SDG 3 • SDG 6 • SDG 7 • SDG 8 • SDG 12 • SDG 13 • Sustainability indicators • EU Taxonomy
DNSH criteria (‘Does Not Significantly Harm’) Economic activities (1) Code(s) (2) Absolute OpEx (3) Proportion of OpEx (4) Climate change mitigation (5) Climate change adaptation (6) Water and marine resources (7) Circular economy (8) Pollution (9) Biodiversity and ecosystems (10) Climate change mitigation (11) Climate change adaptation (12) Water and marine resources (13) Circular economy (14) Pollution (15) Biodiversity and ecosystems (16) Minimum safeguards (17) Taxonomy-aligned proportion of OpEx, year N (18) Taxonomy-aligned proportion of OpEx, year N-1 (19) Category ('enabling activity' (E)) (20) Category ('transitional activity' (T)) (21) in million EUR % % % % % % % Y/N Y/N Y/N Y/N Y/N Y/N Y/N % % E T
Substantial contribution criteria
Taxonomy-eligible
sustainable activities (not Taxonomy-aligned activities) Manufacture of hydrogen 03.10 0,1 0,06% High-efficiency co-generation of heat/cool and power from fossil gaseous fuels 04.30 0,0 0,01% Transport by motorbikes, passenger cars and light commercial vehicles 06.05 6,9 3,37% Freight transport services by road 06.06 8,2 3,98% Renovation of existing buildings 07.02 45,5 22,17% Data processing, hosting and related activities 08.01 1,1 0,55% Computer programming, consultancy and related activities 08.02 44,1 21,14% OpEx of Taxonomy-eligible but not environmentally sustainable activities (not Taxonomy-aligned activities) (A.2) 106,0 50,84% 0,00% N/A Total (A.1 + A.2) 113,0 54,20% 3,36% N/A B. TAXONOMY-NON-ELIGIBLE ACTIVITIES OpEx of Taxonomy-non-eligible activities (B) 95,5 45,80% Total (A + B) 208,5 100,00%
but not environmentally

FINANCIAL REPORT | Consolidated statements • Statement • Independent auditor’s report • Notes • Definitions Consolidated statements 207 ..... Consolidated income statement 208 ..... Consolidated statement of comprehensive income 209 ..... Consolidated statement of financial position 210 ..... Consolidated statement of cash flows 211 ..... Consolidated statement of changes in equity 213 ..... Management responsibility statement 214 ..... Independent auditor’s report 222 ..... Notes to the consolidated financial statements 297 ..... Definitions Financial report 206
Consolidated income statement
(1) As adjusted due to discontinued operations. See note 16 for more information on the restatement of comparative information.
207 FINANCIAL REPORT | Consolidated statements • Statement • Independent auditor’s report • Notes • Definitions (in million EUR) Note 2022/23 2021/22(1) Revenue 3. 9.933,6 9.251,1 Cost of goods sold 3. (7.074,2) (6.546,4) Gross profit 3. 2.859,4 2.704,7 Other operating income 4. 148,5 135,5 Services and miscellaneous goods 5. (717,4) (611,9) Employee benefit expenses 6. (1.611,3) (1.473,1) Depreciation, amortisation and impairment of non-current assets (399,3) (356,9) Other operating expenses 4. (29,0) (35,2) Operating profit (EBIT) 250,9 363,1 Finance income 7. 10,7 11,3 Finance costs 7. (21,5) (9,8) Net financial result 7. (10,8) 1,5 Share in the result of investments accounted for using the equity method 12., 13. 1,7 6,0 Profit before tax 241,8 370,6 Income tax expense 8. (62,2) (92,6) Profit for the financial year from continuing operations 179,6 278,0 Profit for the financial year from discontinued operations 16. 20,9 10,0 Profit for the financial year 200,5 288,0 Attributable to: Non-controlling interests (0,1) 0,7 Owners of the parent company 200,6 287,3 Earnings per share - basic and diluted (in EUR) - from continuing operations 22. 1,40 2,09 Earnings per share - basic and diluted (in EUR) - from discontinued operations 22. 0,16 0,07 Earnings per share – basic and diluted (in EUR) 22. 1,57 2,16
Consolidated statement of comprehensive income
ITEMS OF OTHER COMPREHENSIVE INCOME FROM FULLY CONSOLIDATED SUBSIDIARIES
ITEMS OF OTHER COMPREHENSIVE INCOME FROM INVESTMENTS ACCOUNTED FOR USING THE EQUITY METHOD
(1) Mainly reflects the impact of increased discount rates, partly offset by salary indexation.
(2) Mainly relates to the interest rate swap contracts held by Virya Energy NV.
FINANCIAL REPORT | Consolidated statements • Statement • Independent auditor’s report • Notes • Definitions (in million EUR) Note 2022/23 2021/22 PROFIT FOR THE FINANCIAL YEAR 200,5 288,0
Items that will not be reclassified to profit or loss Revaluation of liabilities related to long-term post-employment benefits, after taxes(1) 8., 24. 13,8 20,8 Net change in fair value of financial assets at fair value through other comprehensive income, after taxes 14. (4,1) (1,1) Total of the items that will not be reclassified to profit or loss 9,7 19,7 Items that may be reclassified subsequently to profit or loss Profit/(loss) from currency translation of foreign subsidiaries, after taxes (0,9) 0,3 Net change in fair value of derivative financial instruments, after taxes 8. (2,0) 6,2 Total of the items that may be reclassified subsequently to profit or loss (2,9) 6,5
Items that will not be reclassified to profit or loss Revaluation of liabilities related to long-term post-employment benefits, after taxes 8. (0,3)Total of the items that will not be reclassified to profit or loss (0,3)Items that may be reclassified subsequently to profit or loss Net change in fair value of derivative financial instruments, after taxes(2) 12., 13. 88,5 16,4 Total of the items that may be reclassified subsequently to profit or loss 88,5 16,4 OTHER COMPREHENSIVE INCOME FOR THE FINANCIAL YEAR 95,0 42,6 TOTAL COMPREHENSIVE INCOME FOR THE FINANCIAL YEAR 295,5 330,6 Attributable to: Non-controlling interests (0,1) 0,7 Owners of the parent company 295,6 329,9
208
Consolidated statement of financial position
(1) Includes, among other things, the green retail bond in the amount of EUR 250 million on 31 March 2023.
(2) Includes, among other things, EUR 299 million of short-term financing at 31 March 2023 (EUR 207 million at 31 March 2022). The short-term financing includes a committed credit facility for a 5-year term amounting to EUR 530 million with an outstanding position of EUR 150 million at 31 March 2023.
209 FINANCIAL REPORT | Consolidated statements • Statement • Independent auditor’s report • Notes • Definitions (in million EUR) Note 31.03.23 31.03.22 Goodwill 9. 374,5 157,6 Intangible assets 10. 340,0 329,4 Property, plant and equipment 11. 2.820,8 2.745,0 Investments accounted for using the equity method 12., 13. 542,6 464,3 Financial assets 14. 10,8 14,7 Deferred tax assets 17. 18,2 17,5 Other receivables 19. 38,3 46,0 Total non-current assets 4.145,2 3.774,5 Inventories 18. 826,5 815,6 Trade receivables 19. 534,7 602,4 Current tax assets 22,7 35,2 Other receivables 19. 97,8 81,4 Financial assets 14. 31,3 128,3 Cash and cash equivalents 20. 358,6 176,2 Assets from discontinued operations 16. 130,8Total current assets 2.002,4 1.839,1 TOTAL ASSETS 6.147,6 5.613,6 Share capital 370,2 364,7 Reserves and retained earnings 2.140,1 2.097,4 Total equity attributable to owners of the parent company 2.510,3 2.462,1 Non-controlling interests 0,1Total equity 21. 2.510,4 2.462,1 Provisions 23. 8,5 15,4 Liabilities related to employee benefits 24. 87,9 107,2 Deferred tax liabilities 17. 86,3 91,6 Interest-bearing and other liabilities(1) 25., 26. 880,9 650,7 Total non-current liabilities 1.063,6 864,9 Provisions 23. 0,9 0,7 Bank overdrafts 20. 8,4 0,2 Interest-bearing liabilities(2) 25. 471,1 349,8 Trade payables 26. 1.295,8 1.283,6 Current tax liabilities 20,4 24,9 Liabilities related to employee benefits and other liabilities 26. 687,8 627,4 Liabilities from discontinued operations 16. 89,2Total current liabilities 2.573,6 2.286,6 Total liabilities 3.637,2 3.151,5 TOTAL EQUITY AND LIABILITIES 6.147,6 5.613,6
Consolidated statement of cash flows
The amounts shown below include both continuing and discontinued operations. (in
Profit before tax is inclusive of discontinued operations. For 2022/23, this is the sum of the profit for the financial year for the continuing operations (EUR 241,8 million) and the profit for the financial year for the discontinued operations (EUR 27,8 million) as specified in note 16.
(2) At 31 March 2022, the category ‘Other’ includes impairments and reversals of impairments on inventories, trade receivables and other receivables.
FINANCIAL REPORT | Consolidated statements • Statement • Independent auditor’s report • Notes • Definitions
million EUR) Note 2022/23(1) 2021/22 OPERATING ACTIVITIES Profit before tax 269,7 382,7 Adjustments for: Depreciation, amortisation and impairment of non-current assets 406,8 365,4 Finance income and finance costs 7. 10,5 (1,5) Share in the result of investments accounted for using the equity method 12., 13. (1,7) (6,0) Losses/(gains) on the sale of property, plant and equipment, intangible and financial assets 4. (9,2) (4,5) Discount on capital increase reserved for personnel 1,2 1,3 Other(2) (0,1) (13,3) Cash flow from operating activities before changes in working capital and provisions 677,2 724,1 Decrease/(increase) in trade and other receivables 26,5 (47,7) Decrease/(increase) in inventories (17,2) (60,3) (Decrease)/increase in trade payables and other liabilities 74,8 (49,3) (Decrease)/increase in provisions and liabilities related to employee benefits 8,1 (6,4) Dividends received 5,5 4,9 Income tax paid (70,2) (69,5) Cash flow from operating activities 704,7 495,8 INVESTING ACTIVITIES Acquisition of property, plant and equipment and intangible assets (463,0) (484,5) Business combinations (net of cash and cash equivalents acquired) (111,5) (65,0) Business disposals (net of cash and cash equivalents disposed of) 0,6Increase in investment in capital of associates and joint ventures 12., 13. (4,1) (74,8) Proceeds from capital reimbursements of associates and joint ventures 12., 13. 0,1 0,7 (Purchases)/sales of financial assets 14. 0,2 13,1 (Payment of)/proceeds from repayment of loans granted 3,7 (13,7) Proceeds from sale of property, plant and equipment and intangible assets 22,7 17,2 Cash flow from investing activities (551,3) (607,0) FINANCING ACTIVITIES Proceeds from the issue of share capital 21. 5,4 7,3 Acquisition of non-controlling interests 0,1 0,1 Purchase of treasury shares (95,0) (199,1) New borrowings 25. 637,2 655,7 Repayment of borrowings 25. (326,0) (215,7) Interest paid (11,1) (2,3) Interest received 7,0 5,3 Payment of lease liabilities 25. (58,8) (51,2) Dividends paid 21. (139,9) (196,3) Cash flow from financing activities 18,9 3,8 NET INCREASE/(DECREASE) OF CASH AND CASH EQUIVALENTS 172,3 (107,4) Cash and cash equivalents at 1 April 176,0 283,3 Effect of changes in foreign currency rates (0,1) 0,1 Effect of changes in consolidation scope 4,5CASH AND CASH EQUIVALENTS AT 31 MARCH 20. 352,7 176,0
(1)
210
Consolidated statement of changes in equity
Attributable to the owners of the parent company
Other reserves
(in million EUR, except number of shares)
211 FINANCIAL REPORT | Consolidated statements • Statement • Independent auditor’s report • Notes • Definitions
Note Number of shares Share capital Number of treasury shares Treasury shares Revaluation reserves of liabilities related to longterm post-employment benefits Cumulative translation adjustments Cash flow hedge reserves Fair value reserves of financial assets through Other comprehensive income Retained earnings Total Non-controlling interests Total equity AT 1 APRIL 2022 133.839.188 364,8 3.518.954 (143,8) (21,3) (1,8) (8,4) 8,6 2.264,0 2.462,1 - 2.462,1 Total comprehensive income for the financial year - - - - 13,5 (0,9) 86,5 (4,1) 200,6 295,6 (0,1) 295,5 Profit for the financial year - - - - - - - - 200,6 200,6 (0,1) 200,5 Other comprehensive income for the financial year - - - - 13,5 (0,9) 86,5 (4,1) - 95,0 - 95,0 Transactions with the owners 238.500 5,4 3.169.026 (94,8) - - - - (158,0) (247,4) 0,2 (247,2) Capital increase 21. 238.500 5,4 - - - - - - 1,2 6,6 0,2 6,8 Treasury shares purchased - - 3.169.026 (94,8) - - - - (0,1) (94,9) - (94,9) Transactions with non-controlling interests at associated companies - - - - - - - - (20,6) (20,6) - (20,6) Dividends 21. - - - - - - - - (139,9) (139,9) - (139,9) Other - - - - - - - - 1,4 1,4 - 1,4 AT 31 MARCH 2023 134.077.688 370,2 6.687.980 (238,6) (7,8) (2,7) 78,1 4,5 2.306,6 2.510,3 0,1 2.510,4
Consolidated statement of changes in equity (continued)
Attributable to the owners of the parent company
FINANCIAL REPORT | Consolidated statements • Statement • Independent auditor’s report • Notes • Definitions • Statement
Other reserves
Number of shares Share capital Number of treasury shares Treasury shares Revaluation reserves of liabilities related to longterm post-employment benefits Cumulative translation adjustments Cash flow hedge reserves Fair value reserves of financial assets through Other comprehensive income Retained earnings Total Non-controlling interests Total equity AT 1 APRIL 2021 136.154.960 357,4 1.368.388 (65,3) (42,1) (2,0) (31,1) 9,7 2.296,4 2.523,0 4,2 2.527,2 Total comprehensive income for the financial year - - - - 20,8 0,3 22,6 (1,1) 287,3 329,9 0,7 330,6 Profit for the financial year - - - - - - - - 287,3 287,3 0,7 288,0 Other comprehensive income for the financial year - - - - 20,8 0,3 22,6 (1,1) - 42,6 - 42,6 Transactions with the owners (2.315.772) 7,3 2.150.566 (78,5) - - - - (319,6) (390,8) (4,9) (395,7) Capital increase 184.228 7,3 - - - - - - 1,3 8,6 - 8,6 Treasury shares purchased - - 4.650.566 (198,2) - - - - (1,1) (199,3) - (199,3) Cancellation of treasury shares (2.500.000) - (2.500.000) 119,7 - - - - (119,7) - -Change in ownership percentage - - - - - - - - (7,5) (7,5) (4,0) (11,5) Dividends - - - - - - - - (195,4) (195,4) (0,9) (196,3) Other - - - - - - - - 2,8 2,8 - 2,8 AT 31 MARCH 2022 133.839.188 364,7 3.518.954 (143,8) (21,3) (1,7) (8,5) 8,6 2.264,1 2.462,1 - 2.462,1 212
(in million EUR, except number of shares)
Management responsibility statement
Jef Colruyt, Chairman of the Board of Directors, and Stefaan Vandamme, Chief Financial Officer, declare in the name and on behalf of the company, that to the best of their knowledge:
• the consolidated financial statements for the financial years 2022/23 and 2021/22, prepared in accordance with ‘International Financial Reporting Standards’ (IFRS) as adopted by the European Union up until 31 March 2023, give a true and fair view of the net assets, the financial position and the results of Etn. Fr. Colruyt NV and the entities included in the consolidation scope.
• the annual report related to the consolidated financial statements gives a true and fair view of the development and the results of Colruyt Group’s activities, as well as of the position of the company and the entities that are included in the consolidation scope, together with a description of the main risks and uncertainties that Colruyt Group faces.
Jef Colruyt
Stefaan Vandamme Chairman of the Board of Directors Chief Financial Officer
213 FINANCIAL REPORT | Consolidated statements • Statement • Independent auditor’s report • Notes • Definitions
Independent auditor’s report to the general meeting of Etn. Fr. Colruyt NV for the year ended 31 March 2023
Independent auditor’s report to the general meeting of Etn. Fr.
2023
In the context of the statutory audit of the Consolidated Financial Statements of Etn. Fr. Colruyt NV (the “Company”) and its subsidiaries (together the “Group”) , we report to you as statutory auditor . This report includes our opinion on the consolidated statement of the financial position as at 31 March 2023, the consolidated income statement and the consolidated statement of comprehensive income, the con solidated statement of changes in equity and the consolidated statement of cash flows for the year ended 31 March 2023, and notes to the financial statements, including a summary of significant accounting policies , and the disclosures (all elements together the “Consolidated Financial Statements”) as well as our report on other legal and regulatory requirements. These two reports are considered one report and are inseparable.
In the context of the statutory audit of the Consolidated Financial Statements of Etn. Fr. (together the “Group”) , we report to you as statutory auditor . This report includes our opinion position as at 31 March 2023, the consolidated income statement and the consolidated statement of changes in equity and the consolidated statement of cash flows for the year statements, including a summary of significant accounting policies , and the disclosures Statements”) as well as our report on other legal and regulatory requirements. These two inseparable.
We have been appointed as statutory auditor by the shareholders’ meeting of 28 September 2022, in accordance with the propositi on by the Board of Directors following recommendation of the Audit Committee and following recommendation of the workers’ council. Our mandate expires at the shareholders’ meeting that will deliberate on the Consolidated Financial Statements for the year ending 31 March 2025. We performed the audit of the Consolidated Financial Statements of the Group during 7 consecutive years.
We have been appointed as statutory auditor by the shareholders’ meeting of 28 September Board of Directors following recommendation of the Audit Committee and following recomm expires at the shareholders’ meeting that will deliberate on the Consolidated Financial Statements performed the audit of the Consolidated Financial Statements of the Group during 7 consecutive
Report on the audit of the Consolidated Financial Statements Unqualified opinion
We have audited the Consolidated Financial Statements of Etn. Fr. Colruyt NV, that comprise of the Consolidated statement of the financial position on 31 March 2023, the Consolidated income statement and the Consolidated statement of comprehensive income, the Consolidated statement of changes in equity and the Consolidated statement of cash flows of the year and the disclosures, which show a consolidated balance sheet total of € 6.147,6 million and of which the consolidated income statement shows a profit for the year of € 200,5 million.
Report on the audit of the Consolidated Financial Statements
Unqualified opinion
In our opinion, the Consolidated Financial Statements give a true and fair view of the consolidated net equity and financial position as at 31 March 2023, and of its consolidated results for the year then ended, prepared in accordance with the International Financial Reporting Standards as adopted by the European Union (“IFRS”) and with applicable legal and regulatory requirements in Belgium.
Basis for the unqualified opinion
We conducted our audit in accordance with International Standards on Auditing (“ISA’s”) applicable in Belgium. In addition, we have applied the ISA's approved by the International Auditing and
We have audited the Consolidated Financial Statements of Etn. Fr. Colruyt NV, that comprise of the Consolidated statement of the financial position on 31 March 2023, the Consolidated income statement and the Consolidated statement of comprehensive income, the Consolidated statement of changes in equity and the Consolidated statement of cash flows of the year and the disclosures, which show a consolidated balance sheet total of € 6.147,6 million and of which the consolidated income statement shows a profit for the year of € 200,5 million.
In our opinion, fair view of the 31 March 2023, ended, prepared Reporting Standards with applicable Basis for the We conducted on Auditing (“ISA’s”) applied the ISA's
FINANCIAL REPORT | Consolidated statements • Statement • Independent auditor’s report • Notes • Definitions
Besloten vennootschap Société à responsabilité limitée RPR Brussel - RPM Bruxelles - BTW-TVA BE0446.334.711-IBAN N° BE71 2100 9059 0069 *handelend in naam van een vennootschap:/agissant au nom d'une société A member firm of Ernst & Young Global Limited EY Bedrijfsrevisoren EY Réviseurs d’Entreprises De Kleetlaan 2 B - 1831 Diegem Tel: +32 (0) 2 774 91 11 ey.com
Independent auditor’s report
Besloten
Société à responsabilité limitée RPR Brussel - RPM Bruxelles - BTW-TVA BE0446.334.711-IBAN N° BE71 2100 9059 0069 *handelend in naam van een vennootschap:/agissant au nom d'une société A member firm of Ernst & Young Global Limited EY Bedrijfsrevisoren EY Réviseurs d’Entreprises De Kleetlaan 2 B - 1831 Diegem Tel: +32 (0) 2 774 91 11 ey.com
vennootschap
Colruyt
214
Assurance Standards Board (“IAASB”) that apply at the current yearend date and have not yet been approved at national level. Our responsibilities under those standards are further described in the “Our responsibilities for the audit of the Consolidated Financial Statements” section of our report.
We have complied with all ethical requirements that are relevant to our audit of the Consolidated Financial Statements in Belgium, including those with respect to independence.
We have obtained from the Board of Directors and the officials of the Company the explanations and information necessary for the performance of our audit and we believe that the audit evidence we have obtained is sufficient and appropriate to provide a basis for our opinion.
Key audit matters
Key audit matters are those matters that, in our professional judgment, were of most significance in our audit of the Consolidated Financial Statements of the current reporting period. These matters were addressed in the context of our audit of the Consolidated Financial Statements as a whole and in forming our opinion thereon, and consequently we do not provide a separate opinion on these matters.
Compensations received from suppliers
Description of the key audit matter
The Group receives significant amounts of discounts and compensations from its suppliers, mainly for promotions in the stores, joint publicity, introduction of new products, and volumebased incentives. The determination of such supplier discounts is
Audit report dated 27 July 2023 on the Consolidated Financial Statements of Etn. Fr. Colruyt NV as of and for the year ended 31 March 2023 (continued)
mainly based on the actual supplier purchases of the related period, which are also confirmed by the Group with the concerned suppliers. In order to be able to determine these discounts accurately and completely, management needs to have a detailed insight in the contractual arrangements and extent to which any conditions of certain promotional programs are fulfilled. A change in these contracts and/or conditions could have a material impact on the Consolidated Financial Statements. For these reasons and because of the size of the related amounts, the recognition of the compensations from suppliers is a key audit matter. We refer to note 1 of the Consolidated Financial Statements for the valuation rules in this respect.
Summary of the procedures performed
• We gained an insight in the company’s internal processes around supplier interventions.
• Substantive procedures on settled compensations from suppliers; this work consists of a reconciliation, on a sample basis, to supplier contracts and/or equivalent supporting documentation such as invoices, credit notes, receipts or supplier confirmations of the received compensations from suppliers.
• Substantive procedures regarding the correctness and completeness of the outstanding compensations from suppliers; these tests include the evaluation of the appropriateness of applied purchase or sales volumes, as well as the discount rates applied by reconciling these, on a sample basis, to the Group's underlying supplier agreements and accounting records.
215 FINANCIAL REPORT | Consolidated statements • Statement • Independent auditor’s report • Notes • Definitions
2
• Evaluation of the presentation of the compensations from suppliers in accordance with the valuation rules included in note 1 of the Consolidated Financial Statements.
Impairment of goodwill and property, plant and equipment
Description of the key audit matter
The Group operates stores in Belgium, France and Luxembourg. The carrying amount of the property, plant and equipment mainly relates to the stores and related assets as detailed in note 11 of the Consolidated Financial Statements. The total net book value amounts to € 2.820,8 million as of 31 March 2023. In addition, as a result of various acquisitions in the past, the Group recorded goodwill. The book value of this goodwill amounts to € 374,5 million as at 31 March 2023. The valuation of goodwill is described in note 9 of the Consolidated Financial Statements; the valuation of property, plant and equipment in note 11.
In accordance with IAS36 'Impairment of assets', these assets are reviewed by management at least once a year by cash-generating unit and examined for indications of impairment. This review is heavily influenced by the future expectations of the management regarding the expected growth, in particular the turnover and the operating result, and by other assumptions, such as the discount rate and long-term growth rate. A change in these assumptions or the use of inappropriate future expectations could have a material impact on the Consolidated Financial Statements. For these reasons, the impairment of goodwill and property, plant and equipment are a key audit matter.
Audit report dated 27 July 2023 on the Consolidated Financial Statements of Etn. Fr. Colruyt NV as of and for the year ended 31 March 2023 (continued)
Summary of the procedures performed
• We gained an insight in the company’s internal processes around the goodwill impairment exercise, more specifically management’s review process of the discounted cashflow model.
• Evaluation of the mathematical accuracy and conformity with IAS36 of the valuation model used by the Group, with the support of a valuation expert from our firm.
• Evaluation of the most important assumptions used (long-term growth rate and discount rate), with the support of a valuation expert from our firm.
• Evaluation of the reasonableness of the projected cash flows, as well as the estimated future revenue growth and growth of the operating result by comparing with, and an evaluation of, the budget approved by the Board of Directors, and an assessment of the Group's historical forecasting accuracy.
• Verification of the existence of any additional impairment indicators, through reading the minutes of the Board of Directors, through an independent evaluation of publicly available market data, and through regular discussions with the management.
FINANCIAL REPORT | Consolidated statements • Statement • Independent auditor’s report • Notes • Definitions
3
216
• Evaluation of the adequacy and completeness of notes 9 and 11 of the Consolidated Financial Statements.
Valuation of transformation programs with a long-term character
Description of the key audit matter
The Group invests significant amounts in transformation programs with a long-term character, which are developed internally. The book value of the capitalized transformation programs with a long-term character amount to € 264,8 million as of 31 March 2023. The valuation is described in note 10 of the Consolidated Financial Statements. Development costs are only capitalized in accordance with IAS38 if several conditions are met, including the capacity of the transformation program to generate future economic benefits that exceed the costs incurred. Management's estimates with respect to these expected future economic benefits are inherently complex. Changes in these estimates or the use of inappropriate future expectations could have a material impact on the Consolidated Financial Statements. For these reasons, the valuation of change programs with a long-term character is a key audit matter.
Summary of the procedures performed
• We gained an insight in the company’s internal processes around the transformation programs with long-term character;
• Substantive testing, on a sample basis, for each of these programs regarding the determination and allocation of the relevant development expenditure to the assets.
Audit report dated 27 July 2023 on the Consolidated Financial Statements of Etn. Fr. Colruyt NV as of and for the year ended 31 March 2023 (continued)
• Evaluation of the model used by the Group to determine the future economic benefits of these programs, in accordance with the conditions of IAS38, and of the main underlying assumptions.
• Periodical discussion of the estimated future economic benefits with management, as set out in the individual business cases of the relevant change programs, and comparison of earlier estimates with historical achievements afterwards.
• Verification of the existence of any impairment indicators, among others by reading minutes of the Board of Directors and through regular discussions with management.
• Evaluation of the adequacy and completeness of note 10 of the Consolidated Financial Statements.
Responsibilities of the Board of Directors for the preparation of the Consolidated Financial Statements
The Board of Directors is responsible for the preparation of the Consolidated Financial Statements that give a true and fair view in accordance with IFRS and with applicable legal and regulatory requirements in Belgium and for such internal controls relevant to the preparation of the Consolidated Financial Statements that are free from material misstatement, whether due to fraud or error.
As part of the preparation of Consolidated Financial Statements, the Board of Directors is responsible for assessing the Company’s ability to continue as a going concern, and provide, if applicable, information on matters impacting going concern, The Board of Directors should prepare the financial statements using the going concern basis of accounting, unless the Board of Directors either intends to liquidate the Company or to cease business operations, or has no realistic alternative but to do so.
217 FINANCIAL REPORT | Consolidated statements • Statement • Independent auditor’s report • Notes • Definitions
4
Our responsibilities for the audit of the Consolidated Financial Statements
Our objectives are to obtain reasonable assurance whether the Consolidated Financial Statements are free from material misstatement, whether due to fraud or error, and to express an opinion on these Consolidated Financial Statements based on our audit. Reasonable assurance is a high level of assurance, but not a guarantee that an audit conducted in accordance with the ISA’s will always detect a material misstatement when it exists. Misstatements can arise from fraud or error and considered material if, individually or in the aggregate, they could reasonably be expected to influence the economic decisions of users taken on the basis of these Consolidated Financial Statements.
In performing our audit, we comply with the legal, regulatory and normative framework that applies to the audit of the Consolidated Financial Statements in Belgium. However, a statutory audit does not provide assurance about the future viability of the Company and the Group, nor about the efficiency or effectiveness with which the board of directors has taken or will undertake the Company's and the Group’s business operations. Our responsibilities with regards to the going concern assumption used by the board of directors are described below.
As part of an audit in accordance with ISA’s, we exercise professional judgment and we maintain professional skepticism throughout the audit. We also perform the following tasks:
• identification and assessment of the risks of material misstatement of the Consolidated Financial Statements, whether due to fraud or error, the planning and execution of audit procedures to respond to these risks and obtain audit evidence
Audit report dated 27 July 2023 on the Consolidated Financial Statements of Etn. Fr. Colruyt NV as of and for the year ended 31 March 2023 (continued)
which is sufficient and appropriate to provide a basis for our opinion. The risk of not detecting material misstatements resulting from fraud is higher than when such misstatements result from errors, since fraud may involve collusion, forgery, intentional omissions, misrepresentations, or the override of internal control;
• obtaining insight in the system of internal controls that are relevant for the audit and with the objective to design audit procedures that are appropriate in the circumstances, but not for the purpose of expressing an opinion on the effectiveness of the Company’s internal control;
• evaluating the selected and applied accounting policies, and evaluating the reasonability of the accounting estimates and related disclosures made by the Board of Directors as well as the underlying information given by the Board of Directors;
• conclude on the appropriateness of the Board of Directors’ use of the going-concern basis of accounting, and based on the audit evidence obtained, whether or not a material uncertainty exists related to events or conditions that may cast significant doubt on the Company’s or Group’s ability to continue as a going concern. If we conclude that a material uncertainty exists, we are required to draw attention in our auditor’s report to the related disclosures in the Consolidated Financial Statements or, if such disclosures are inadequate, to modify our opinion. Our conclusions are based on audit evidence obtained up to the date of the auditor’s report. However, future events or conditions may cause the Company to cease to continue as a going-concern;
FINANCIAL REPORT | Consolidated statements • Statement • Independent auditor’s report • Notes • Definitions
5
218
• evaluating the overall presentation, structure and content of the Consolidated Financial Statements, and evaluating whether the Consolidated Financial Statements reflect a true and fair view of the underlying transactions and events.
We communicate with the Audit Committee within the Board of Directors regarding, among other matters, the planned scope and timing of the audit and significant audit findings, including any significant deficiencies in internal control that we identify during our audit.
Because we are ultimately responsible for the opinion, we are also responsible for directing, supervising and performing the audits of the subsidiaries. In this respect we have determined the nature and extent of the audit procedures to be carried out for group entities.
Audit report dated 27 July 2023 on the Consolidated Financial Statements of Etn. Fr. Colruyt NV as of and for the year ended 31 March 2023 (continued)
We provide the Audit Committee within the Board of Directors with a statement that we have complied with relevant ethical requirements regarding independence, and to communicate with them all relationships and other matters that may reasonably be thought to bear on our independence, and where applicable, related safeguards.
From the matters communicated with the Audit Committee within the Board of Directors, we determine those matters that were of most significance in the audit of the Consolidated Financial Statements of the current period and are therefore the key audit matters. We describe these matters in our report, unless the law or regulations prohibit this.
219 FINANCIAL REPORT | Consolidated statements • Statement • Independent auditor’s report • Notes • Definitions
6
Report on other legal and regulatory requirements
Responsibilities of the Board of Directors
The Board of Directors is responsible for the preparation and the content of the Board of Directors’ report on the Consolidated Financial Statements, the non-financial information attached to the Board of Directors’ report, and other information included in the annual report.
Responsibilities of the auditor
In the context of our mandate and in accordance with the additional standard to the ISA’s applicable in Belgium, it is our responsibility to verify, in all material respects, the Board of Directors’ report on the Consolidated Financial Statements, the non-financial information attached to the Board of Directors’ report, and other information included in the annual report, as well as to report on these matters.
Aspects relating to Board of Directors’ report and other information included in the annual report
In our opinion, after carrying out specific procedures on the Board of Directors’ report, the Board of Directors’ report is consistent with the Consolidated Financial Statements and has been prepared in accordance with article 3:32 of the Code of companies and associations.
In the context of our audit of the Consolidated Financial Statements, we are also responsible to consider whether, based on the information that we became aware of during the performance of our audit, the Board of Directors’ report and other information included in the annual report, being:
Audit report dated 27 July 2023 on the Consolidated Financial Statements of Etn. Fr. Colruyt NV as of and for the year ended 31 March 2023 (continued)
• Key figures contain any material inconsistencies or contains information that is inaccurate or otherwise misleading. In light of the work performed, there are no material inconsistencies to be reported.
The non–financial information required by article 3:32, § 2, of the Code of companies and associations has been included in the Board of Directors’ report on the Consolidated Financial Statements. The Company has prepared this non-financial information based on Sustainable Development Goals. However, we do not comment on whether this non-financial information has been prepared, in all material respects, in accordance with Sustainable Development Goals.
Independence matters
Our audit firm and our network have not performed any services that are not compatible with the audit of the Consolidated Financial Statements and have remained independent of the Company during the course of our mandate.
The fees related to additional services which are compatible with the audit of the Consolidated Financial Statements as referred to in article 3:65 of the Code of companies and associations were duly itemized and valued in the notes to the Consolidated Financial Statements.
FINANCIAL REPORT | Consolidated statements • Statement • Independent auditor’s report • Notes • Definitions
7
220
Audit report dated 27 July 2023 on the Consolidated Financial Statements of Etn. Fr. Colruyt NV as of and for the year ended 31 March 2023 (continued)
European single electronic format (“ESEF”)
N/A English is not an official language in Belgium
Other communications.
• This report is consistent with our supplementary declaration to the Audit Committee as specified in article 11 of the regulation (EU) nr. 537/2014.
Diegem, 27 July 2023
EY Bedrijfsrevisoren BV
Statutory auditor
Represented by

Eef Naessens * Partner
*Acting on behalf of a BV/SRL
24EN0013
221 FINANCIAL REPORT | Consolidated statements • Statement • Independent auditor’s report • Notes • Definitions
8
Notes to the consolidated financial statements
FINANCIAL REPORT | Consolidated statements • Statement • Independent auditor’s report • Notes • Definitions
1. Significant accounting policies .............................................................................................. 223 1.1. Basis of presentation 223 1.2. Significant accounting estimates and assumptions 223 1.3. Statement of compliance ..................................................................................................... 224 1.4. Consolidation principles 225 1.5. Other significant accounting policies ............................................................................. 227 2. Segment information................................................................................................................... 236 2.1. Operating segments 236 2.2. Geographical information .................................................................................................... 239 3. Revenue and gross profit 240 3.1. Revenue by cash-generating unit 240 4. Other operating income and expenses .............................................................................. 241 5. Services and miscellaneous goods 241 6. Employee benefit expenses...................................................................................................... 242 7. Net financial result......................................................................................................................... 243 8. Income tax expense 244 8.1. Income taxes recognised in profit or loss ..................................................................... 244 8.2. Tax impacts recognised in other comprehensive income 244 9. Goodwill 245 10. Intangible assets .......................................................................................................................... 247 11. Property, plant and equipment 249 12. Investments in associates ...................................................................................................... 251 13. Investments in joint ventures 254 14. Financial assets 255 14.1. Non-current assets ............................................................................................................... 255 14.2. Current assets 256 15. Business combinations ............................................................................................................ 257 16. Assets held for sale, disposal of subsidiaries and discontinued operations 258 16.1. Assets held for sale 258 16.2. Disposal of subsidiaries...................................................................................................... 259 16.3. Discontinued operations 259 17. Deferred tax assets and liabilities ...................................................................................... 260 17.1. Net carrying amount............................................................................................................. 260 17.2. Change in net carrying amount 261 18. Inventories ...................................................................................................................................... 261 19. Trade and other receivables 262 19.1. Other non-current receivables 262 19.2. Current trade and other current receivables............................................................. 263 20. Cash and cash equivalents 264 21. Equity.................................................................................................................................................. 265 21.1. Capital management............................................................................................................ 265 21.2. Share capital 265 21.3. Treasury shares....................................................................................................................... 265 21.4. Dividends 265 21.5. Shareholder structure 266 22. Earnings per share ...................................................................................................................... 266 23. Provisions 267 24. Non-current liabilities related to employee benefits ............................................. 268 24.1. Defined contribution plans with a legally guaranteed minimum return 268 24.2. Benefits related to ‘Unemployment regime with company supplement’ 271 24.3. Other post-employment benefits .................................................................................. 272 25. Interest-bearing liabilities 273 25.1. Terms and repayment schedule ..................................................................................... 273 25.2. Repayment schedule lease liabilities ........................................................................... 274 25.3. Repayment schedule bank borrowings and others 274 25.4. Changes in liabilities arising from financing activities ......................................... 275 26. Trade payables, liabilities related to employee benefits and other liabilities 276 27. Risk management 277 27.1. Risks related to financial instruments ......................................................................... 277 27.2. Other risks 282 28. Off-balance sheet rights and commitments ................................................................ 283 29. Contingent liabilities and contingent assets ............................................................... 284 30. Dividends paid and proposed 285 31. Related parties .............................................................................................................................. 285 31.1. Related party transactions excluding key management personnel compensation 286 31.2. Key management personnel compensation 287 32. Events after the reporting date ........................................................................................... 287 33. Independent auditor’s remuneration 288 34. List of consolidated entities .................................................................................................. 289 34.1. Company ................................................................................................................................... 289 34.2. Subsidiaries 289 34.3. Joint ventures .......................................................................................................................... 292 34.4. Associates 292 34.5. Changes in consolidation scope 293 35. Condensed (non-consolidated) financial statements of Etn. Fr. Colruyt NV, in accordance with Belgian accounting standards......... 294 222
Notes to the consolidated financial statements
1. Significant accounting policies
Etn. Fr. Colruyt NV (hereinafter referred to as the ‘Company’) is domiciled in 1500 Halle, Belgium and is publicly traded on NYSE Euronext Brussels under the code COLR. The consolidated financial statements for the 2022/23 financial year, which closed on 31 March 2023, cover the Company, its subsidiaries and its interests in associates and joint ventures (hereinafter referred to collectively as ‘Colruyt Group’).
Colruyt Group is a family business which, over three generations, has grown into a retail group with a diverse portfolio of food and non-food formulas, in Belgium and abroad. Its main activity is the operation of supermarkets under the brand name ‘Colruyt Lowest Prices’. Colruyt Group operates in the retail sector and has many different store formulas, both physical and online, each with its own brand promise, mainly in Belgium, Luxembourg and France, though it is also active on the African continent. Colruyt Group also engages in food services and wholesale trade. Finally, certain aspects of technology, IT and communication are handled by Colruyt Group itself, as is the case with the processing and/or packaging of meat, coffee, cheese and wine.
The consolidated financial statements for the 2022/23 financial year were authorised for issue on 9 June 2023 by the Board of Directors, subject to the approval of the statutory nonconsolidated financial statements by the shareholders during the Annual General Meeting of Shareholders, which will be held on 27 September 2023. In accordance with Belgian law, the consolidated financial statements will be presented for information purposes to the shareholders of Colruyt Group during that same meeting. The consolidated financial statements are not subject to changes, unless decisions of the shareholders regarding the statutory non-consolidated financial statements impact the consolidated financial statements.
1.1. Basis of presentation
The consolidated financial statements are expressed in millions of EUR rounded to one decimal place. As a result of rounding, the totals of certain figures in the tables may differ from those in the main statements or between disclosure notes. The consolidated financial statements include comparative figures from the previous financial year.
The consolidated financial statements describe the financial position as of 31 March and are prepared using the historical cost method, with the exception of certain line items, including derivative financial instruments, financial assets at fair value through other comprehensive income and financial assets at fair value through profit or loss, which are measured at fair value. Net liabilities related to Belgian defined contribution plans with a legally guaranteed minimum return, which are accounted for as defined benefit plans, are not measured at historical cost either but are measured using the projected unit credit method. Colruyt Group has prepared the consolidated financial statements on the assumption that it will continue its operations as a going concern, as there are no material uncertainties and there are sufficient resources to continue operations. In the income statement, the figures for financial year 2021/22 were restated in line with IFRS 5, Non-current Assets Held for Sale and Discontinued Operations’. For more information, see note 16. Assets held for sale, disposal of subsidiaries and discontinued operations.
The consolidated financial statements are prepared before any distribution of profits of the Company as proposed to the Annual General Meeting of Shareholders.
The significant accounting policies listed below have been applied consistently for all the periods presented in these consolidated financial statements.
1.2. Significant accounting estimates and assumptions
Preparing the consolidated financial statements requires Colruyt Group’s management to make judgements, estimates and assumptions. In most cases, estimates and related assumptions are based on past experience and various other factors that are believed to be reasonable given the circumstances. Actual results may differ from these estimates. The estimates and underlying assumptions are assessed and adjusted annually. Revisions to accounting estimates are recognised in the period in which the estimate is revised, where the revision affects only that period, or in the period of the revision and future period(s) when the revision affects both current and future period(s).
Key sources of estimation uncertainty incurring a risk of material adjustments in the next financial year are:
Impairment of assets
Each year, and also whenever there are indications that their net carrying amount may exceed their recoverable amount, cashgenerating units to which goodwill or intangible assets with indefinite useful lives are assigned are tested for impairment. This analysis requires management to calculate the recoverable amount. The recoverable amount is the higher of the fair value less costs to sell and the value in use. The value in use is the present value of estimated future cash flows using a relevant discount rate (WACC) and terminal growth rate. For more information on the assumptions used and the sensitivity of the carrying amounts to the assumptions, please see note 9. Goodwill
Recognition and measurement of internally developed intangible assets
Colruyt Group invests in internally developed innovative change programmes and IT investments. An important condition for the recognition of intangible assets related to this is the future economic benefits of these programmes. These future economic benefits are based on estimates by management and programme managers, which are validated and discussed on a regular
223 FINANCIAL REPORT | Consolidated statements • Statement • Independent auditor’s report • Notes • Definitions
basis. For more information on the carrying amount of these programmes, see note 10. Intangible assets
Income tax and deferred taxes
Deferred tax assets are recognised only to the extent that it is probable that future profits will be available against which the tax losses carried forward and any unused tax credits able to be carried forward can be offset. Colruyt Group sets a time horizon of five years for these estimates. The carrying amount of deferred tax assets is reviewed at each reporting date, based on estimates of future profits. For more information on the carrying amount of deferred tax assets and unrecognised deferred tax assets (or liabilities), see note 17. Deferred tax assets and liabilities.
Employee benefits – IAS 19
Each year, the defined contribution plan liabilities and annual costs are determined on the basis of actuarial assumptions. Discount rates and inflation rates are set at group level by management. The other assumptions (such as expected future wage increases and the chances of employees leaving) are determined at local level. All employee benefit plans are reviewed annually by independent actuaries. For additional information regarding the assumptions and the sensitivity of the carrying amount of the liabilities to the assumptions, see note 24. Noncurrent liabilities related to employee benefits.
Key sources of assumptions in the next financial year are:
Calculating the present value of lease payments and determining the lease term of contracts with renewal options
Determining the lease term requires a certain degree of assessment. Factors considered relate to the probability that early termination options or renewal options will be exercised. All facts and circumstances relevant to assessing the lease terms are considered. Lease terms are determined with the help of the departments with relevant knowledge thereof. Based on past experience and the fact that it is commercially important to be present in a location for a longer period of time, the lease term is typically set at 9 years.
Colruyt Group cannot readily determine the interest rate implicit in the leases. As a result, the Incremental Borrowing Rate (IBR) is used to measure lease liabilities. The IBR is the interest rate that Colruyt Group would have to pay to borrow over a similar term, and with a similar security, the funds necessary to obtain an asset of a similar value to the right-of-use asset. Colruyt Group estimates the IBR using observable data (such as market interest rates) and certain entity-specific parameters.
Consolidation principles
Determining whether Colruyt Group has control, joint control or significant influence is based on the specific facts and circumstances. These conclusions can differ from judgements purely based on the ownership percentage held by Colruyt Group.
Colruyt Group owns the majority of the shares in Virya Energy NV and considers it an associate, as in previous years. As Korys Investments NV and Colruyt Group are related parties, Colruyt is of the opinion that it exercises only significant influence on Virya Energy NV and not joint control, as Korys Investments NV has the power to influence decisions at Colruyt Group level.
1.3. Statement of compliance
Colruyt Group’s consolidated financial statements are prepared in accordance with the ‘International Financial Reporting Standards (IFRS)’, as issued by the ‘International Accounting Standards Board (IASB)’ and adopted by the European Union.
A. New standards and interpretations effective in 2022/23
While the following (amended) standards and improvements are effective for Colruyt Group as of 1 April 2022, none has any significant impact on Colruyt Group’s consolidated financial statements:
• IAS 16 (Amendment), ‘Property, Plant and Equipment - Proceeds before Intended Use’. The amendment prohibits entities deducting from the cost of an item of property, plant and equipment, any proceeds from selling items produced while bringing that asset to the location and condition necessary for it to be capable of operating in the manner intended by
management. An entity shall recognise such proceeds and the cost of producing those items in profit or loss.
• IAS 37 (Amendment), ‘Provisions, Contingent Liabilities and Contingent Assets - Onerous Contracts — Cost of Fulfilling a Contract’. The amendment specifies which costs an entity needs to include when assessing whether a contract is onerous or loss-making. A ‘directly related cost approach’ is applied.
• IFRS 3 (Amendment), ‘Business Combinations - References to the Conceptual Framework’. The amendments replace references to an old version of the IASB’s Conceptual Framework with references to the current version issued in March 2018. An exception was also added to the recognition criteria in IFRS 3 with respect to liabilities and contingent liabilities that would be within the scope of IAS 37 or IFRIC 21. The amendment further added an explicit statement that an acquirer cannot recognise contingent assets acquired in a business combination.
B. Standards and interpretations published but not yet effective for 2022/23
Colruyt Group did not early adopt the following published (amended) standards, interpretations and improvements relevant to the group and effective only after 31 March 2023. Colruyt Group intends to apply these standards when they become effective; none of them, however, has any significant impact on Colruyt Group’s consolidated financial statements.
• IAS 1 (Amendment), Presentation of Financial Statements –Classification of Liabilities as Current or Non-current’ (effective date for Colruyt Group 1 April 2024). The amendments clarify the criteria for determining whether to classify a liability as current or non-current. The amendments clarify that if an entity’s right to defer settlement of a liability is subject to the entity complying with future covenants, the entity has a right to defer settlement of the liability even if it does not comply with those covenants at the end of the reporting period. The amendments clarify that classification of a liability is unaffected by the likelihood that the entity will exercise its right to defer settlement of the liability for at least twelve months after the reporting period. The amendments clarify that there is an exception to the requirement that settlement of liabilities by way of own equity instruments impacts the classification of liabilities. The amendments further require additional
FINANCIAL REPORT | Consolidated statements • Statement • Independent auditor’s report • Notes • Definitions
224
disclosures by an entity that classifies liabilities arising from loan arrangements as non-current when it has the right to defer settlement of those liabilities that are subject to the entity complying with future covenants within twelve months.
• IAS 1 (Amendment), ‘Presentation of Financial Statements and IFRS Practice Statement 2: Disclosure of Accounting Policies’ (effective date for Colruyt Group 1 April 2023). The amendments provide guidance on the application of materiality judgements to accounting policy disclosures. The amendments to IAS 1 replace the requirement to disclose “significant” accounting policies with a requirement to disclose “material” accounting policies. The Practice Statement includes guidance and illustrative examples that assist in applying the materiality concept when making judgements about accounting policies.
• IAS 8 (Amendment), ‘Accounting Policies, Changes in Accounting Estimates and Errors - Definition of Accounting Estimates and IAS 1 (Amendment), ‘Presentation of Financial Statements’ (effective date for Colruyt Group 1 April 2023). This amendment clarifies how a company should distinguish between changes in accounting estimates and changes in accounting policies. A company is also required to disclose information about ‘material’ accounting policies rather than ‘significant’ accounting policies.
• IAS 12 (Amendment), Income Taxes - Deferred Tax related to Assets and Liabilities arising from a Single Transaction’ (effective date for Colruyt Group 1 April 2023). This amendment clarifies that where payments that settle a liability are deductible for tax purposes, it is a matter of judgement (having considered the applicable tax law) whether such deductions are attributable for tax purposes to the liability recognised in the financial statements (and interest expense) or to the related asset component (and interest expense). This judgement is important in determining whether any temporary differences exist on initial recognition of the asset and liability.
• IFRS 16 (Amendment), ‘Leases - Lease Liability in a Sale and Leaseback’ (effective date for Colruyt Group 1 April 2024). The amendments specify how a seller-lessee measures the lease liability arising in a sale and leaseback transaction in a way that it does not recognise any amount of the gain or loss that relates to the right of use retained. The amendment does not prescribe specific measurement requirements for lease liabilities arising from a leaseback. The initial measurement
of the lease liability arising from a leaseback may result in a seller-lessee determining `lease payments’ that are different from the general definition of lease payments in Appendix A of IFRS 16. The seller-lessee will need to develop and apply an accounting policy that results in information that is relevant and reliable in accordance with IAS 8, Accounting Policies, Changes in Accounting Estimates and Errors’.
• IFRS 17 (Amendment), Insurance Contract - Initial Application of IFRS 17 and IFRS 9 - Comparative Information’ (effective date for Colruyt Group 1 April 2023). For some insurers, temporary accounting mismatches could arise, during the transition period, between financial assets and insurance contract liabilities in the comparative information they are required to present in their financial statements. This amendment will help avoid temporary accounting mismatches and in this way increase the usefulness of comparative information for investors.
• IFRS 17 (Publication), ‘Insurance Contracts (effective date for Colruyt Group 1 April 2023). This new standard will replace the existing standard IFRS 4, ‘Insurance Contracts’. It will apply to all types of insurance contracts, regardless of the type of entities that issue them, as well as to certain guarantees and financial instruments with discretionary participation features.
1.4. Consolidation principles
Colruyt Group’s consolidated financial statements include the financial statements of the Company, its subsidiaries after elimination of intragroup transactions and balances and Colruyt Group’s interest in associated entities and joint ventures.
A. Subsidiaries
Subsidiaries are those entities over which Colruyt Group has control. Control exists if Colruyt Group is exposed or has rights to variable returns from its involvement with the investee and if Colruyt Group has the ability to use its power over the investee to affect the amount of these returns. In assessing whether control exists, all facts and circumstances are considered. The financial statements of subsidiaries are included in the consolidated financial statements from the date that control effectively commences until the date that control effectively ceases.
Non-controlling interests in subsidiaries are identified separately from Colruyt Group’s equity. The interest of non-controlling shareholders can initially be measured at fair value or at the noncontrolling interests’ proportionate share of the fair value of the acquiree’s identifiable net assets. The choice of measurement basis is made on a case-by-case basis. Subsequent to the acquisition, the carrying amount of non-controlling interests is the amount of those interests at initial recognition plus the noncontrolling interests’ share of subsequent changes in equity. The total result is attributed to non-controlling interests even if this results in the non-controlling interests having a deficit balance.
Changes in Colruyt Group’s interest in a subsidiary that do not result in a loss of control are accounted for as transactions between owners. The carrying amounts of Colruyt Group’s interests and the non-controlling interests are subsequently adjusted directly in equity to reflect the changes in their relative interests in the subsidiary.
When Colruyt Group loses control of a subsidiary, the profit or loss on disposal is calculated as the difference between:
• the aggregate of the fair value of the consideration received and the fair value of any retained interest; and
• the previously recognised carrying amount of the assets (including goodwill) and liabilities of the subsidiary and any non-controlling interests.
Amounts previously recognised in other comprehensive income in relation to the subsidiary are accounted for in the same manner (i.e. reclassified to profit or loss or transferred directly to retained earnings) as would be required if the relevant assets or liabilities were disposed of. The fair value of any investment retained in the former subsidiary at the date when control is lost, is regarded as the fair value on initial recognition for subsequent accounting under IFRS 9, Financial Instruments’ or, if applicable, the cost on initial recognition of an investment in an associate or joint venture.
B. Associates
Associates are those entities in which Colruyt Group has significant influence on the financial and operational policies but which it does not control or jointly control.
225 FINANCIAL REPORT | Consolidated statements • Statement • Independent auditor’s report • Notes • Definitions
The initial recognition of these investments is at cost including transaction costs. These investments are incorporated into the consolidated financial statements using the equity method from the date on which the significant influence begins until the date on which the significant influence ceases. In the event an indication of impairment arises after the application of the equity method, Colruyt Group calculates the amount of the impairment loss as the difference between the recoverable amount and the carrying amount of the investment in the associate. If Colruyt Group’s share of the associate’s losses exceeds the carrying amount of Colruyt Group’s interests in the associate, the carrying amount is reduced to nil in Colruyt Group’s statement of financial position and no further losses are taken into account, except to the extent that Colruyt Group incurred obligations in respect of that associate. When the associate becomes profitable again, the group’s share of the associate’s profit is recognised only when the profit cancels out the unrecognised losses.
C. Joint ventures
Joint ventures are those entities in which Colruyt Group has joint control and where such control is established by an agreement, conferring upon Colruyt Group rights to the net assets of the agreement, but no rights to the assets of the agreement and no liabilities arising from debts of the agreement. Joint control implies that the decisions about the relevant activities require the unanimous consent of all parties sharing control.
The initial recognition of these investments is at cost including transaction costs. Colruyt Group’s interests in joint ventures are accounted for using the equity method, from the date that joint control first exists until the date it ceases. In the event an indication of impairment arises after the application of the equity method, Colruyt Group calculates the amount of the impairment loss as the difference between the recoverable amount and the carrying amount of the investment in the joint venture. If Colruyt Group’s share of the joint venture’s loss exceeds the carrying amount of Colruyt Group’s interest in the joint venture, the carrying amount is reduced to nil in Colruyt Group’s statement of financial position and no further losses are taken into account, except to the extent that Colruyt Group incurred obligations on behalf of that joint venture. When the joint venture becomes profitable again, the group’s share of the joint venture’s profit is recognised only when the profit cancels out the unrecognised losses.
D. Transactions eliminated on consolidation
Intragroup balances and transactions, including unrealised results on intragroup transactions, are eliminated when preparing the consolidated financial statements.
Unrealised gains from transactions with associates or joint ventures are eliminated in proportion to Colruyt Group’s interest in the associates or joint ventures. Unrealised losses are eliminated in the same way as unrealised gains, except that they are only eliminated to the extent that there is no evidence of impairment.
E. Business combinations
Acquisitions of businesses (as defined by IFRS 3, ‘Business Combinations’) are accounted for using the acquisition method. The consideration for each business combination is measured as the aggregate of the fair values at acquisition date of the assets transferred by the acquirer, the liabilities incurred to former owners of the acquiree, and equity instruments issued by the acquirer in exchange for control.
Acquisition-related costs are recognised in profit or loss as incurred, except when they relate to the issue of debt or equity instruments. In this case, these costs are deducted from the debt instruments and from equity respectively.
If applicable, the consideration for the business combination includes any asset or liability resulting from a contingent consideration arrangement, measured at its fair value at the acquisition date. Subsequent changes in such fair values are adjusted retroactively within the measurement period against the cost of acquisition when they qualify as adjustments due to additional facts and circumstances existing at acquisition date. All other subsequent changes in the fair value of contingent consideration classified as an asset or liability are accounted for in accordance with relevant IFRS. If an obligation to pay contingent consideration meets the definition of a financial instrument classified as equity, it is not remeasured and its subsequent settlement is accounted for within equity.
Where a business combination is achieved in stages, Colruyt Group’s previously held interest in the acquired entity is remeasured to fair value at the acquisition date (i.e. the date
the group obtains control) and the resulting gain or loss, if any, is recognised directly in profit or loss. Amounts arising from interests in the acquiree prior to the acquisition date that have previously been recognised in other comprehensive income are recognised on the same basis as would be required if that interest were disposed of.
The identifiable assets, liabilities and contingent liabilities that meet the conditions for recognition under IFRS 3, Business Combinations’ are recognised at their fair value at the acquisition date, except that:
• deferred tax assets or liabilities and liabilities or assets related to employee benefit arrangements are recognised and measured in accordance with IAS 12, ‘Income Taxes and IAS 19, ‘Employee Benefits’ respectively;
• liabilities or equity instruments related to the replacement by Colruyt Group of an acquiree’s share-based payment awards are measured in accordance with IFRS 2, Share-based Payment’;
• assets (or disposal groups) that are classified as held for sale at acquisition date in accordance with IFRS 5, ‘Non-current Assets Held for Sale and Discontinued Operations’, are measured in accordance with that standard.
If the initial accounting for a business combination is incomplete by the end of the financial year in which the combination occurs, Colruyt Group reports provisional amounts for the items for which the accounting is incomplete. Those provisional amounts are adjusted during the measurement period (see paragraph below), and/or additional assets and/or liabilities are recognised to reflect new information obtained about facts and circumstances that existed as of the acquisition date that, if known, would have affected the amounts recognised as of that date.
The measurement period is the period from the acquisition date to the date Colruyt Group obtains complete information about facts and circumstances that existed as of the acquisition date. The measurement period shall not exceed one year from the acquisition date.
FINANCIAL REPORT | Consolidated statements • Statement • Independent auditor’s report • Notes • Definitions
226
F. Financial statements of foreign companies in foreign currencies
To consolidate Colruyt Group and each of its subsidiaries, the financial statements of the individual subsidiaries are translated into euro, the functional currency of the Company and the presentation currency of the group. The translation is performed as follows:
• assets and liabilities, including goodwill and fair value adjustments arising from acquisitions, at the closing exchange rate of the European Central Bank at the reporting date;
• income, expenses and cash flows at the average exchange rate for the financial year (which approximates the exchange rate at the date of the transaction);
• components of shareholders’ equity at the historical exchange rate.
Exchange rate differences arising from the translation of net investments in foreign subsidiaries, associates and joint ventures at the closing exchange rate at the reporting date are recorded as part of the consolidated other comprehensive income, under ‘Cumulative translation adjustments’ in ‘Other reserves’, except for the part attributed to non-controlling interests.
Upon the disposal of a foreign operation (i.e. a disposal of Colruyt Group’s entire interest in a foreign operation, or a disposal involving loss of control over a subsidiary that includes a foreign operation, loss of joint control over a joint venture that includes a foreign operation, or loss of significant influence over an associate that includes a foreign operation), all of the cumulative translation adjustments in equity in respect of that foreign operation attributable to Colruyt Group are reclassified to profit or loss as part of the consolidated financial results.
In the case of a partial disposal of a subsidiary (i.e. with no loss of control over the subsidiary by Colruyt Group), the proportionate share of cumulative translation adjustments is reattributed to non-controlling interests and is not recognised in profit or loss. For all other partial disposals (i.e. the partial disposal of associates or joint ventures not resulting in Colruyt Group losing significant influence or joint control), the proportionate share of the cumulative translation adjustments is reclassified to the consolidated financial results.
G. Foreign currency transactions
Transactions in foreign currencies are translated to the functional currency of the Company at the exchange rates prevailing at the date of the transaction.
All monetary assets and liabilities denominated in foreign currencies are translated at the closing rate at the reporting date.
Gains and losses resulting from transactions in foreign currency and from the translation of monetary assets and liabilities denominated in foreign currencies are recognised in profit or loss.
Non-monetary assets and liabilities denominated in foreign currencies and valued on a historical cost basis are translated at the exchange rate at the transaction date. Non-monetary assets and liabilities in foreign currencies at fair value are translated at the exchange rate applicable at the date on which the fair value was determined.
1.5. Other significant accounting policies
A. Goodwill
Goodwill resulting from business combinations is recognised as an asset as from the date control is obtained (the acquisition date). Colruyt Group measures goodwill as the difference between:
• the aggregate of the fair value of the consideration transferred, the amount of any non-controlling interest in the acquiree, and in a business combination achieved in stages, the fair value of the previously held equity interest in the acquiree; and
• the net amount of the identifiable assets acquired and the liabilities incurred at the acquisition date.
If, after consideration, this difference is negative, the resulting gain from a bargain purchase is recognised immediately in profit or loss.
Goodwill is recognised at cost less any accumulated impairment losses. Goodwill is not amortised but is reviewed for impairment. Impairment is tested annually or earlier if indications of impairment exist.
B. Intangible fixed assets
Research and development
Expenses from research activities are recognised in the consolidated income statement when incurred.
Expenditure related to development activities whereby the results are used for a plan or design intended for the production of new or substantially improved products or processes are capitalised if the following conditions are met:
• the technical and commercial feasibility of the product or process has been demonstrated and the product or process will be commercialised or will be used internally;
• the product or process will generate future economic benefits;
• Colruyt Group has the necessary technical, financial and other resources to complete and use or sell the development; and
• the product or process has been carefully described and the expenses can be separately identified and can be measured reliably.
The capitalised expenditure is valued at full cost and therefore includes the cost of materials, direct labour and an appropriate proportion of overheads.
Development costs that do not satisfy these conditions are recognised in the consolidated income statement when incurred.
Capitalised development expenditure is stated at cost less accumulated amortisation and impairment losses.
Other intangible assets
For investments in associates and joint ventures, the goodwill is included within the carrying amount of the investment.
Other intangible assets are recognised at cost less accumulated amortisation and impairment losses.
227 FINANCIAL REPORT | Consolidated statements • Statement • Independent auditor’s report • Notes • Definitions
Subsequent expenditure
Subsequent expenditure on intangible assets is capitalised only when it results in an increase of future economic benefits derived from the use of the specific asset to which the subsequent expenditure is related. All other expenditure is expensed as incurred.
Amortisation
Intangible assets with a finite useful life are subject to straightline amortisation over their estimated useful lives. Amortisation of intangible assets only begins when assets are available for intended use.
Intangible assets that are not yet ready for their intended use and intangible assets with an indefinite useful life are tested for impairment at least annually. For internally developed intangible assets, this evaluation is made at least twice a year.
For intangible assets, Colruyt Group makes a distinction between software, licences, permits, customer portfolios, internally developed intangible assets and other intangible assets.
This distinction is expressed in a different useful life per type of intangible asset:
• externally purchased software, licences and permits: contractually defined period;
• customer portfolios arising from the acquisition of points of sale: indefinite useful life;
• internally developed intangible assets: 3, 5, 7 or 10 years;
• other intangible assets: 3 to 5 years.
The amortisation method and useful life are reviewed annually and amended if necessary.
C. Property, plant and equipment
Property, plant and equipment are recorded at cost less accumulated depreciation and impairment losses. The cost of self-constructed assets includes direct labour costs in addition to
the direct cost of material and a reasonable proportion of indirect manufacturing costs which are necessary to bring the asset into its location and state that are required for the asset to function in the intended way. The depreciation method, the residual value and the useful life are reviewed annually and amended if necessary.
Colruyt Group has opted to recognise capital grants as a deduction to the cost of property, plant and equipment. Grants are recognised when there is reasonable assurance that the grants will be received and that the group will comply with the conditions attached to them. These grants are taken into profit or loss over the useful life of the asset by reducing the depreciation charge.
In certain circumstances obligations exist to dismantle and restore items of property, plant and equipment in their original state; these are therefore included in the cost or acquisition value of the item of property, plant and equipment. A provision is recognised in the statement of financial position.
Subsequent expenditure
Costs for the replacement of a component of property, plant and equipment are capitalised provided that the cost to be capitalised can be reliably determined and that the expenditure will result in a future economic benefit.
Costs which do not meet these conditions are immediately recognised in the consolidated income statement when incurred.
Depreciation
Property, plant and equipment are subject to straight-line depreciation in profit or loss based on the estimated useful life of each component.
Tangible assets with an indefinite useful life are not depreciated but tested for impairment annually.
The estimated useful lives are defined as follows:
• land: indefinite;
• buildings: 20 to 30 years;
• fixtures: 9 to 15 years;
• fittings, machinery, equipment, furnishings and vehicles: 3 to 20 years;
• IT equipment: 3 to 5 years;
• right-of-use assets: useful life of the asset or, if shorter, the lease term.
Retirements
An item of property, plant and equipment and any significant part initially recognised is derecognised on disposal (i.e. on the date when the recipient obtains control) or when no future economic benefits are expected from its use or disposal. Any gain or loss arising from the derecognition of the asset (calculated as the difference between the net disposal proceeds and the carrying amount of the asset) is included in profit or loss when the asset is derecognised.
D. Leases
For all leases with a lease term of more than 12 months, a right-of-use asset and a corresponding lease liability are recognised on the date on which the leased asset is made available for use. Right-of-use assets are recognised as part of property, plant and equipment and lease liabilities are reported as part of interest-bearing liabilities, recognised at cost less accumulated depreciation and impairment losses and adjusted for remeasurement of lease obligations.
The lease liability is measured at the present value of the remaining lease payments, discounted at a predetermined discount rate. Colruyt Group uses the interest rate implicit in the lease contract or, when the latter is not available, the ‘incremental borrowing rate’ which is revised annually for new contracts.
At initial recognition of the lease, the right of use of the assets is measured at an amount equal to the lease liability. Under certain conditions the initial direct costs for concluding the lease are included in the value of the right-of-use asset.
The lease term is determined as the non-cancellable period of the lease, taking into account the option to extend the lease if
FINANCIAL REPORT | Consolidated statements • Statement • Independent auditor’s report • Notes • Definitions
228
that option is reasonably certain to be exercised, or the option to terminate the lease early if that option is reasonably certain not to be exercised.
Lease payments are apportioned between reduction of the outstanding lease liability and finance expenses, whereby the finance expenses are recognised in profit or loss, so as to achieve a constant rate of interest on the remaining balance of the lease liability. The right-of-use asset is depreciated over the shorter of its useful life and the lease term.
Payments made for short-term leases or leases of low-value assets are recognised in profit or loss on a straight-line basis over the term of the lease.
A limited number of premises that Colruyt Group leases are subleased to third parties (the so-called ‘sublease agreements’). When the right of use of these assets is not fully transferred to the sublessee (which is the case, amongst others, when the rental period of the sublease is significantly shorter than the one of the head lease), these ‘sublease agreements’ are classified as operating sublease agreements and the rental income is recognised in profit or loss under ‘Other operating income’, on a straight-line basis over the lease term.
Rental income under a finance sublease is treated in accordance with IFRS 16, whereby a lease receivable is recognised in the consolidated statement of financial position. This lease receivable is equal to the discounted value of the future lease payments plus any residual value accruing to the lessor, at the interest rate implicit in the lease. Lease receivables are presented in the consolidated statement of financial position under ‘Other receivables’. Any differences between the right-of-use asset and the lease receivable are accounted for in profit or loss at initial recognition.
E. Financial assets Classification
Colruyt Group classifies its financial assets at initial recognition in different categories. The classification of financial assets depends on:
• The characteristics of the contractual cash flows of the financial assets (SPPI test). The SPPI test is designed to determine whether or not the contractual cash flows relate to payments of principal and interest on the principal amount outstanding.
• The business model used for managing the financial assets determines whether the cash flow results from:
• a contractual cash flow;
• a sale of financial assets; or
• a combination of both.
The classification of a financial asset determines the measurement of this financial asset and whether the income and expenses are recognised in profit or loss, or directly in equity. The financial assets are classified as follows:
• financial assets at amortised cost;
• financial assets at fair value through other comprehensive income (‘FVOCI’);
• financial assets at fair value through profit or loss (‘FVTPL’).
Financial assets at amortised cost
Financial assets are recognised at amortised cost when the business model’s objective is to hold financial assets in order to collect contractual cash flows and the contractual cash flows represent (re)payments of principal and interest on the principal amount outstanding and on specified dates.
These financial assets are initially recognised at fair value, including any transaction costs that are directly attributable to these financial assets. After initial recognition these assets are measured at amortised cost using the effective interest method, net of impairment. Each reporting period, the amount of the impairment is determined as the difference between the carrying amount of the financial asset and the present value of estimated future cash flows discounted at the financial asset’s original effective interest rate. Gains and losses are recognised in profit or loss when the asset is derecognised, modified or impaired.
Financial assets at fair value through other comprehensive income
Financial assets are recognised at fair value through other comprehensive income when the business model’s objective is to hold financial assets in order to collect contractual cash flows as well as to sell financial assets. The contractual cash flows represent (re)payments of principal and interest on the principal amount outstanding and on specified dates. In addition, Colruyt Group may irrevocably choose to recognise at fair value through other comprehensive income equity instruments that would otherwise be measured at fair value through profit or loss. This choice is irrevocable and can only apply if the equity instrument is not held for trading or if it is not recognised as contingent consideration by an acquirer in a business combination. Colruyt Group makes this choice for equity instruments which it has currently no intention to sell in the short term.
These financial assets are initially recognised at fair value, including any transaction costs that are directly attributable to these financial assets. After initial recognition these financial assets are measured at fair value through other comprehensive income. In the event of a disposal of these equity instruments within this category of financial assets, the cumulative revaluations recognised through other comprehensive income are reclassified from other comprehensive income to retained earnings.
Financial assets at fair value through profit or loss
Financial assets are recognised at fair value through profit or loss when the conditions of the above categories are not met or when Colruyt Group has made the irrevocable choice to recognise through profit or loss debt instruments measured at fair value through other comprehensive income. This choice is irrevocable and may only be used to eliminate or reduce inconsistencies in the measurement at initial recognition.
These financial assets are initially recognised at fair value. After initial recognition the assets are measured at fair value through profit or loss.
229 FINANCIAL REPORT | Consolidated statements • Statement • Independent auditor’s report • Notes • Definitions
Expected credit losses
Financial assets are recognised according to the above accounting principles. At the end of every reporting period Colruyt Group assesses whether a provision for expected credit losses needs to be recognised for financial assets at amortised cost and for financial assets at fair value through other comprehensive income.
Colruyt Group has identified two categories of financial assets to which the requirements of expected credit losses apply: trade receivables and other receivables. Expected credit losses are calculated using a model based on expected losses which represents the weighted average of credit losses with the respective default risks as weighting factors.
To determine the expected credit losses Colruyt Group applies the simplified approach based on a provision matrix, and the general approach, under which credit losses are determined at the level of the individual receivable. The choice depends on the type of asset and the associated risk characteristics.
The simplified approach always applies to trade receivables. These do not generally contain a significant financing component. Under the simplified approach, credit losses are estimated over the full lifetime of receivables. The calculation of percentages for historical credit losses is done by categories of debtors with similar risk characteristics. In addition to historical credit losses, the provision matrix used takes into account forward-looking and macroeconomic factors. See note 27.2. ‘Other risks’ for macroeconomic factors taken into account.
The general approach applies to other receivables, i.e. to a category of receivables of limited materiality, where credit losses are determined at the level of the individual receivable. See note 27.1.c. ‘Credit Risk’ for more information on how expected credit losses are calculated at the level of other receivables.
F. Assets held for sale and discontinued operations
An asset or a disposal group (groups of assets and related liabilities) that is being disposed of, is classified as held for sale if its carrying amount will be recovered principally through a sale transaction rather than through continuing use. This condition is regarded as met only when the sale is highly probable and the asset (or disposal group) is available for immediate sale in its present condition. For a sale to be highly probable, the Company should be committed to a plan to sell the asset (or disposal group), and an active programme to locate a buyer and to complete the sale should be initiated. The asset (or disposal group) should be actively marketed at a price which is reasonable in relation to its current fair value, and the sale should be expected to be completed within one year from the date of classification.
When classified as ‘held for sale’, assets or disposal groups are valued at the lower of their carrying amount and their fair value less costs to sell, including any impairment that might be required and which is recognised through profit or loss. Impairment on an asset or a disposal group is initially allocated to goodwill and then pro rata to the remaining assets and liabilities. Such an impairment loss is not allocated to inventories, financial assets or deferred tax assets which continue to be recognised in line with the other significant accounting policies of the group. As from the moment that property, plant and equipment and intangible assets are classified as held for sale, they are no longer depreciated or amortised. Comparative balance sheet information for prior periods is not restated to reflect the new classification in the consolidated statement of financial position.
A discontinued operation is a component of an entity that either has been disposed of or has been classified as held for sale, which represents a separate major line of business or geographical area of operations that can be distinguished operationally as well as for financial reporting purposes from the rest of the entity. The profit or loss after taxes which arises from discontinued operations is separately reported in the consolidated income statement. When operations are labelled as discontinued operations, the comparative figures in the consolidated income statement are restated to reflect a situation as if the operations had been discontinued as of the beginning of the comparative period, while no comparative figures are prepared for the balance sheet.
G. Impairment
The carrying amount of all assets, with the exception of inventories and deferred tax assets, is reviewed at least once a year and examined for any indications of impairment. If such indications exist, the related asset’s recoverable amount is estimated.
Goodwill, tangible and intangible assets with indefinite useful lives and tangible and intangible assets not available for use are tested for impairment at least annually (irrespective of whether indications of impairment exist or not). For internally developed intangible assets, this review is completed at least twice a year. The recoverable amount is the higher of the fair value less costs to sell (corresponds to the money that Colruyt Group would receive as a result of a sale) and the value in use (corresponds to the cash flows that Colruyt Group expects to receive through the continuing use of the assets). For an asset for which no independent cash flows are available, the recoverable amount is determined for the cash-generating unit to which the asset belongs. For impairment testing, goodwill is always allocated to (a group of) cash-generating units.
A cash-generating unit is the smallest identifiable group of assets that generates cash inflows that are largely independent of the cash inflows from other assets or groups of assets. Colruyt Group defines a ‘cash-generating unit’ as the operating unit to which the asset can unequivocally be allocated. An operating unit can include a branch of the business or a business entity.
If the recoverable amount of an asset or of the cash-generating unit to which it belongs is lower than the carrying amount, an impairment loss is recognised in profit or loss for the amount of the difference. Impairment losses relating to cash-generating units are first deducted from the carrying amount of any goodwill attributed to the cash-generating (or groups of) units and then deducted pro rata from the carrying amount of the other assets of the (groups of) cash-generating units.
A recognised impairment may be reversed if it ceases to exist. An impairment loss is reversed only to the extent that the asset’s carrying amount does not exceed the carrying amount that would have been determined, net of depreciation or amortisation, if no impairment loss had been recognised. Goodwill impairment is not reversed.
FINANCIAL REPORT | Consolidated statements • Statement • Independent auditor’s report • Notes • Definitions
230
H. Inventories
Inventories are measured at the lower of cost and net realisable value. The net realisable value is the estimated selling price in the normal course of business, less the estimated cost of completion and costs to sell.
The cost of inventories is based on the ‘first in, first out’ (FIFO) principle and includes all direct and indirect costs that are required to bring the goods to their state at the reporting date, less discounts and compensations received from suppliers. The indirect costs are made up of distribution costs, i.e. handling costs at the distribution centre and transport costs, and stowage costs, i.e. the costs for store employees to fill the shelves with the goods. These respective costs are updated on a periodic basis.
Rebates and incentives that Colruyt Group receives from its suppliers, mainly for promotions in stores, joint publicity, introductions of new products and volume incentives, are included in the inventory cost and are recognised in profit or loss as and when the product is sold, except when it relates to a repayment of specific, additional and identifiable costs which Colruyt Group incurred in order to sell the supplier’s product. In that case the rebates and incentives are immediately recognised as a decrease of the respective costs incurred. Estimating such supplier rebates is predominantly based on the actual revenue figures of the related period, but in certain cases requires the use of assumptions and estimations regarding specific purchasing or sales levels.
I. Contract assets
Contract assets relate to expenses made to satisfy performance obligations under a contract and are recognised at cost, less a provision for expected losses and less amounts of project progress billings.
The expenses are recognised when the following conditions are met:
• the expenses are directly or indirectly attributable to a specifically identifiable contract;
• resources are generated which Colruyt Group will use to satisfy a performance obligation; and
• the expenses can be earned back.
Expenses that can be attributed directly to a specifically identifiable project include direct labour costs and direct material costs. In addition, the cost includes an allocation of fixed and variable indirect expenses made and this based on a normal production capacity.
J. Equity
Capital and retained earnings
Dividends proposed by the Board of Directors are only recognised as liabilities after approval by the Annual General Meeting of Shareholders. Until such formal approval, the proposed dividends are included in Colruyt Group’s consolidated equity. Transaction costs of capital transactions, net of tax impact, are deducted from equity.
Treasury shares
Shares of Colruyt Group purchased by the Company or entities belonging to Colruyt Group, including directly attributable transaction costs, net of tax impact, are recognised as a deduction from equity. In case of a cancellation or sale of treasury shares, the result of the transaction is directly included in equity (retained earnings).
Revaluation reserves of liabilities related to longterm post-employment benefits
The revaluation reserves contain the cumulative actuarial profits and losses related to:
Belgian entities:
• unemployment regime with company supplement;
• long-service benefits;
• defined contribution plans with a legally guaranteed minimum return.
Other entities:
• legal compensations
The revaluation reserves comprise the experience adjustments and the effects of changes in actuarial assumptions.
Cumulative translation adjustments
The cumulative translation adjustments represent the cumulative currency translation differences that arise due to subsidiaries, associates and joint ventures that have a functional currency that is different from the euro.
Cash flow hedge reserves
This reserve contains the effective portion of the cumulative net change in the fair value of cash flow hedge instruments related to hedged transactions.
Reserves for financial assets at fair value through other comprehensive income
This reserve contains unrealised fair value changes of financial assets at fair value through other comprehensive income.
Non-controlling interests
Non-controlling interests in subsidiaries not fully owned by the group are presented separately from Colruyt Group’s equity. The interest of non-controlling shareholders can initially be measured at fair value or at the non-controlling interests’ proportionate share of the fair value of the acquiree’s identifiable net assets. The choice of measurement basis is made on a case-by-case basis. Subsequent to the acquisition, the carrying amount of non-controlling interests is the amount of those interests at initial recognition plus the non-controlling interests’ share of subsequent changes in equity. The total result is attributed to non-controlling interests even if this results in the noncontrolling interests having a deficit balance.
231 FINANCIAL REPORT | Consolidated statements • Statement • Independent auditor’s report • Notes • Definitions
K. Provisions
Provisions are only recognised in the consolidated statement of financial position when Colruyt Group has a present obligation (legal or constructive) as a result of a past event, when it is probable that a future outflow of resources will be required to settle the obligation, and when a reliable estimate can be made of the amount of the obligation. The amount recognised as a provision is the best estimate of the expenditure required to settle the present obligations at the reporting date.
If the effect of discounting the future cash outflows is material, the provisions are annually discounted using discount rates that reflect current market assessments of the time value of money at the reporting date.
Restructuring provisions are recognised when Colruyt Group approved a detailed, formalised restructuring plan and made a start on restructuring or made it publicly known before reporting date. These provisions only include direct expenditures that are necessarily entailed by the restructuring and that are not associated with the ongoing activities of the Company.
Environmental provisions are established in accordance with legal requirements on the one hand and the environmental policy established by Colruyt Group on the other.
For onerous contracts, a provision is recognised in the consolidated statement of financial position for the difference between the unavoidable cost of meeting the obligations under the contract and the expected benefits to be derived from the contract. Before a provision for an onerous contract is established, Colruyt Group recognises any impairment loss that has occurred on assets dedicated to that contract.
L. Employee benefits
Post-employment benefits
There are different types of post-employment benefits within Colruyt Group:
• Defined contribution plans with a legally guaranteed minimum return
In Belgium, the Law regarding supplementary pensions (‘WAP’) requires employers to guarantee a minimum return on defined contribution plans over the course of the career. For amounts until 31 December 2015, this minimum return was 3,25% on employer contributions and 3,75% on employee contributions. As a result of a law change in December 2015, the interest rate to be guaranteed is variable starting from 1 January 2016, based on a mechanism linked to the return of the Belgian OLO bond with a minimum of 1,75% and a maximum of 3,75%.
Owing to these legal changes, and also to the fact that a clear position was taken by the regulatory instances during 2016, and given that reliable estimates can be made for these retirement benefit plans, the Belgian defined contribution plans have been considered as defined benefit plans since financial year 2016/17. They are measured in accordance with IAS 19 based on the ‘projected unit credit’ method.
• Other
Other post-employment benefits include departure benefits as a result of retirement or as a result of the application of the ’Unemployment regime with company supplement’ (Belgian entities) and legal compensations (French and Indian entities). These benefits are also treated as defined benefit plans.
• Unemployment regime with company supplement
The possibility to retire early, as it exists within Colruyt Group for employees of its Belgian entities, is based on the ‘Unemployment regime with company supplement’ applicable in Belgium. The unemployment regime with company supplement and the conditions regarding the required age and performed service period are described in general terms in collective labour agreement No. 17 (Collectieve Arbeidsovereenkomst/Convention Collective de Travail or cao/CCT), as established by the National Labour Council (Nationale Arbeidsraad/Conseil National du Travail) and in the Royal Decree of 3 May 2007 which regulates the unemployment regime with company supplement (Belgian Official Gazette 8 June 2007). Other collective labour agreements negotiated by the National Labour Council or within Colruyt Group for specific entities or industries may be applicable, but have benefits similar to those of collective labour agreement No. 17.
These benefits must be paid if a company decides to terminate an employee’s employment before the normal retirement date. Given that a reasonable expectation is created towards the employees at the moment of their recruitment or during the period of service, that they are entitled to join the unemployment regime with company supplement before the legal retirement age, these benefits are treated as post-employment benefits (defined benefit plan).
The liabilities arising from these systems and the related costs are determined using the ‘projected unit credit’ method, based on actuarial calculations that are executed at the end of each financial year. A comprehensive actuarial measurement based on updated personnel information is performed at least every three years. In the years in which no comprehensive actuarial measurement is performed, actuaries use forecasts based on the previous year but including updated assumptions (discount rate, pay rise and inflation). These liabilities, recorded in the consolidated statement of financial position, are calculated as the present value of estimated future cash outflows, based on a discount rate at the reporting date which corresponds to the market yield of high quality corporate bonds with a remaining maturity that approaches the maturity of these liabilities, decreased with the fair value of the plan assets. The liabilities related to the unemployment regime with company supplement are recognised for the population of employees for which can be reliably assumed that it will join the unemployment regime with company supplement. The liabilities for the defined contribution plans with a legally guaranteed minimum return are recognised for all Colruyt Group employees entitled thereto.
The costs related to these systems consist of the following items:
• the current service cost, which is the increase in the present value of the obligation resulting from employee service in the current reporting period;
• the past service cost, which is the change in the present value of the benefit obligation for employee service in prior periods, resulting from an amendment or a curtailment of the existing benefit plan;
• gains or losses on settlement of the benefit obligation, if any;
• the net interest on the net liability arising from the passage of time;
FINANCIAL REPORT | Consolidated statements • Statement • Independent auditor’s report • Notes • Definitions
232
• the actuarial gains and losses, which comprise the effect of differences between the previous actuarial assumptions and what has actually occurred and the effect of changes in actuarial assumptions.
The first three items are recognised in profit or loss as ‘Employee benefit expenses’. The net interest on the net liability is included in profit or loss in the ‘Net financial result’. Actuarial gains and losses are recognised in other comprehensive income.
Profit participation
In accordance with the Law of 22 May 2001 concerning employee participation in the capital of entities and the establishment of a profit bonus for employees, Colruyt Group offers its personnel based in Belgium a share in the profits in the form of a profit participation, paid in cash. The profit participation is recognised in the financial year in which the profit is realised.
Discounts on share capital increases
In accordance with article 7:204 of the Code on Companies and Associations, Colruyt Group offers a discount on its yearly share capital increase which is reserved for its employees. This discount is recognised as an employee benefit expense in the period of the share capital increase.
M. Financial liabilities
Financial liabilities are subdivided as follows:
• financial liabilities at amortised cost; and
• financial liabilities at fair value through profit or loss.
Financial liabilities at amortised cost
Financial liabilities of Colruyt Group measured at amortised cost comprise interest-bearing loans, trade payables and other liabilities. Financial liabilities are initially measured at fair value, net of transaction costs. After initial recognition, these financial liabilities are subsequently measured at amortised cost using the effective interest method, with interest expense recognised on an effective interest rate basis.
The effective interest method is a method of calculating the amortised cost of a financial liability and of allocating interest expense over the relevant period. The effective interest rate is the rate that exactly discounts estimated future cash payments through the expected life of the financial liability, or, where appropriate, a shorter period, to the net carrying amount on initial recognition.
Financial liabilities at fair value through profit or loss
Financial liabilities of Colruyt Group measured at fair value through profit or loss comprise derivative financial instruments that are concluded by Colruyt Group in order to hedge its exposure to currency risks resulting from its operational activities. Colruyt Group does not conduct speculative transactions.
These financial liabilities are initially recognised at fair value including any transaction costs that are directly attributable to these financial liabilities. After initial recognition these financial liabilities are measured at fair value through profit or loss.
N. Derivative financial instruments
Derivative financial instruments are initially recognised at fair value. After initial recognition these derivative financial instruments are remeasured at fair value at the end of every reporting period. Derivative financial instruments can be subdivided into cash flow hedges, fair value hedges and hedges of net investments. Colruyt Group designates the derivative financial instruments as cash flow hedges.
At the inception of the transaction, Colruyt Group documents the relationship between the hedging instrument and the hedged instrument, as well as the risk management objectives and strategy for undertaking the hedge. Derivative financial instruments are presented according to their non-current or current nature.
The effective portion of the changes in fair value of derivative financial instruments designated as cash flow hedges is included as a separate component in equity, under ‘Cash flow hedge reserves’. The gain or loss in respect of the ineffective portion is immediately recognised in profit or loss under ‘Finance income’ or ‘Finance costs’.
The cumulative amounts included under ‘Cash flow hedge reserves’ are reclassified to profit or loss in the period during which the hedged instrument affects profit or loss. The cumulative amounts of the hedging instrument are included under the same line item as the hedged instrument.
A cash flow hedge accounting relationship is discontinued when:
• the hedge accounting relationship fails the effectiveness test;
• the hedging instrument is sold, terminated or exercised;
• management decides to revoke the hedge accounting designation of the instrument; or
• the forecast transaction is no longer highly probable.
When the forecast transaction is no longer highly probable but still expected to occur, the hedge gains and losses that were previously recognised in other comprehensive income remain in equity until the transaction affects profit or loss. As soon as the forecast transaction is no longer expected to occur, any gain or loss is immediately recognised in profit or loss as a reclassification adjustment.
Certain derivative financial instruments do not qualify for hedge accounting. Changes to the fair value of derivative financial instruments that do not qualify for hedge accounting are immediately recognised in profit or loss under ‘Finance income’ or ‘Finance costs’.
O. Revenue
Revenue is recognised based on a five-step model. Revenue from the supply of goods or services is recognised in an amount that reflects the consideration to which Colruyt Group expects to be entitled.
Colruyt Group supplies goods, either food or non-food, through different sales channels.
Revenue from the sale of goods – ‘Retail’
The sale of goods in the ‘Retail’ segment, at the cash desk or online, is limited to one single transaction, i.e. the sale of goods at
233 FINANCIAL REPORT | Consolidated statements • Statement • Independent auditor’s report • Notes • Definitions
the cash desk or online. There is only one performance obligation within this context and revenue is recognised when control over the goods is transferred to the customer.
For certain products or services, such as phone cards and tickets for amusement parks, Colruyt Group acts as an agent. Therefore, only the commission is included in the revenue.
Revenue from the sale of gift cards and gift certificates is recognised when the gift card or gift certificate is redeemed by the customer.
The transaction price is affected by a number of rebate mechanisms, which are recognised as variable considerations and are included in profit or loss at the time of the sale of the goods.
Revenue from the sale of goods – ‘Wholesale and Foodservice’
Revenue from the sale of goods in the ‘Wholesale and Foodservice’ segment is recognised upon delivery to, or pick-up by, the ‘Wholesale and Foodservice’ customer. To determine the transaction price Colruyt Group uses collaboration arrangements. Any rebates granted to the ‘Wholesale and Foodservice’ customer are deducted from the sales price.
Revenue from the sale of goods – ‘Other activities’
Revenue from the ‘Other activities’ segment mainly relates to revenue from the sale of fuel, the supply of printing and document management solutions and energy-related activities.
The sale of fuels is limited to one single transaction that is settled at the pump. Any rebates granted are immediately deducted from the transaction price.
Revenue from services rendered
Revenue from services rendered other than those included under ‘Revenue from the sale of goods – ‘Other activities’’, is assessed on a contractual basis to decide whether the performance obligations are performed over time or at a specific moment in time.
Rental income
Rental income generated by ordinary leases or by operating subleases are recognised in ‘Other operating income’ on a straight-line basis over the term of the lease.
Dividend income from financial assets and finance income
Dividends received from financial assets are recognised in the consolidated income statement at the time of allocation. Finance income is recognised using the effective interest method. Fair value adjustments of derivative financial instruments that do not qualify for hedge accounting are immediately recognised in the consolidated income statement.
Other operating income from remuneration received
Colruyt Group does not consider income from renewable energy, services rendered to third parties and revenue from waste recycling as part of its ordinary business activities. This item relates mainly to B2B revenues from the sale of energy, from the cleaning of transport containers and from sales of waste products (mainly plastic and cardboard).
Q. Expenses
Incentives from suppliers
Incentives from suppliers are recognised net of expenses.
If such incentives are specifically received for the reimbursement of specific publicity expenses incurred, the reimbursements are deducted from those specific expenses. In all other cases the reimbursements are recognised as a deduction from cost of goods sold.
Rental payments
Payments made for short-term leases or leases of low-value assets are recognised in profit or loss on a straight-line basis over the term of the lease.
Finance costs
Finance costs relate to interest on loans, interest on repayments of lease liabilities, fair value adjustments of financial assets at fair value through profit or loss and adjustments for the time value of liabilities. Interest expenses are recognised using the effective interest method.
Fair value adjustments of derivative financial instruments that do not qualify for hedge accounting are immediately recognised in the consolidated income statement.
All other finance costs are recognised when incurred.
FINANCIAL REPORT | Consolidated statements • Statement • Independent auditor’s report • Notes • Definitions
P. Other operating income
234
R. Income tax expense
Income tax for the financial year comprises current and deferred taxes and is presented in accordance with IAS 12, ‘Income Taxes’. Taxes are presented in profit or loss, except for taxes that relate to transactions not recognised in the consolidated income statement or that relate to a business combination.
Current tax is the expected tax payable on the taxable profit for the financial year, using tax rates and tax laws enacted or enacted substantively at the end of the reporting period, and any adjustment to tax payable (or receivable) in respect of previous years. These taxes are calculated in accordance with the respective tax laws applicable in all countries in which Colruyt Group operates.
Deferred taxes are calculated using ‘the balance sheet liability method’, providing for temporary differences between the tax base of the assets and liabilities and the carrying amount of assets and liabilities in the consolidated statement of financial position. The following differences are however not provided for: the initial recognition of goodwill, the initial recognition of differences on assets or liabilities that are not resulting from a business combination and that do not affect profit before tax or taxable profit and the differences relating to investments in subsidiaries, associates and joint ventures to the extent that the group is able to assess the timing of the expiration of the temporary differences and that it is probable that they will not be reversed in the near future.
Deferred taxes are calculated using tax rates and tax laws enacted or substantively enacted at the reporting date. A deferred tax asset is recognised in the consolidated statement of financial position only to the extent that it is probable that taxable profits will be available in the near future against which the deductible temporary differences, unused tax losses and credits can be utilised. Deferred tax assets are reduced to the extent that it is no longer probable that the related tax benefit will be realised.
Additional income taxes that arise from the distribution of dividends or gains on shares in subsidiaries are only recognised respectively at the moment of the decision to pay the related dividend and at the moment of the decision of the realisation of the gain.
S. Transfer pricing
The prices for transactions between subsidiaries, associates, joint ventures and therefore also between operating segments are conducted on an objective, at arm’s length basis.
T. Events after the reporting date
Events after the reporting date, which provide additional information concerning the situation of Colruyt Group at the reporting date (‘adjusting events’) are recognised in the consolidated financial statements. Other events after the reporting date (‘non-adjusting events’) are only mentioned in the notes to the consolidated financial statements if they are considered to be important.
235 FINANCIAL REPORT | Consolidated statements • Statement • Independent auditor’s report • Notes • Definitions
2. Segment information
Colruyt Group reports its operating segments based on the nature of its activities. In addition to the information on the operating segments, Colruyt Group also provides geographical information on the regions in which it operates.
2.1. Operating segments
Colruyt Group distinguishes three operating segments within its activities.
Since Colruyt Group refers to its CEO as the ‘chief operating decision maker’ (CODM), the operating segments, taking into account the operating characteristics of each activity, are based on the information provided to the CEO. Colruyt Group calculates its earnings from operating activities (EBIT) at segment level and recognises it in accordance with international financial reporting standards (IFRS). Assets and liabilities are not reported to the CODM by segment.
Two key business segments have been identified: ‘Retail’ and ‘Wholesale and Foodservice’. The difference between both operating segments can be found in differences in markets and business models. The other identifiable segments do not meet the quantitative thresholds determined by IFRS 8, ‘Operating segments’, and were therefore reported together under the operating segment Other activities’. The group support activities combine various departments and supply services to the different brands within Colruyt Group. These activities include marketing and communication, IT, human resources and recruitment, finance and other central services. The costs of group support activities and the result of their internal cross-charging are, to the extent possible, allocated to the reported segments.
Given that in 2022/23 the CODM monitored the performance for the full year and allocated resources including the discontinued operations as part of the ‘Other activities’, the discontinued operations are reported as part of the segment ‘Other activities’ in line with previous financial years.
Retail
Stores under Colruyt Group’s own management which directly sell to retail customers and bulk consumers. The filling stations in France are also included in this segment as they are inseparably connected to, and therefore an integral part of, the stores in France.
Wholesale and foodservice
Supply to wholesalers, commercial customers and affiliated independent merchants.
Other activities
Filling stations in Belgium, printing and document management and sustainable energy. The filling stations in Belgium are presented in a separate segment, as opposed to the filling stations in France, the reason being that the former, which have their own commercial objectives and energy strategy, can be identified separately from the stores in Belgium.
The results of an operating segment contain elements which are directly attributable or which are reasonably attributable to the operating segments.
The revenues of each operating segment include revenues from sales to external customers and revenues from transactions with other operating segments. More information can be found under note 3.1. Revenue by cash-generating unit
The results of the operating segments are evaluated based on operating profit (EBIT).
The financial result and income taxes are managed at Colruyt Group level and are not allocated to the operating segments. Non-cash items in the income statement consist mainly of depreciation and amortisation, impairment of non-current assets, provisions and impairment of current assets. The line items ‘Depreciation and amortisation’ and ‘Impairment of non-current assets are the most significant ones and are therefore included in the segment information.
The operating segment information and Colruyt Group’s consolidated figures can be reconciled by adding the information in the different operating segments with the non-allocated elements - including group support activities - eliminations within Colruyt Group and reclassification to discontinued operations.
Given the nature of its activities, Colruyt Group does not rely on a limited number of major customers.
FINANCIAL REPORT | Consolidated statements • Statement • Independent auditor’s report • Notes • Definitions
236
(1) Includes Roelandt Group since January 2022, Jims since May 2021 and Newpharma for the period from October to December 2022. Since October 2022, Newpharma has been fully consolidated and no longer accounted for as an associate using the equity method.
(2) Acquisition of property, plant and equipment and intangible assets does not include acquisitions through business combinations, right-of-use assets and changes in consolidation method.
(3) As adjusted due to discontinued operations. See note 16 for more information on the restatement of comparative information.
237 FINANCIAL REPORT | Consolidated statements • Statement • Independent auditor’s report • Notes • Definitions (in million EUR) Retail 2022/23(1) Wholesale and Foodservice 2022/23 Other activities 2022/23 Operating segments 2022/23 Revenue - external 8.749,9 1.161,3 908,4 10.819,6 Revenue – internal 72,3 21,6 20,5 114,4 Operating profit (EBIT) 242,7 37,9 26,9 307,5 Share in the result of investments accounted for using the equity method (4,9) - 3,7 (1,2) Acquisition of property, plant and equipment and intangible assets(2) 335,8 22,9 18,0 376,7 Depreciation and amortisation 293,3 23,1 11,6 328,0 Impairment of non-current assets 32,8 0,1 0,3 33,2 (in million EUR) Operating segments 2022/23 Unallocated 2022/23 Eliminations between operating segments & reclassification to discontinued operations(3) 2022/23 Consolidated 2022/23 Revenue - external 10.819,6 - (886,0) 9.933,6 Revenue – internal 114,4 - (114,4)Operating profit (EBIT) 307,5 (29,0) (27,6) 250,9 Share in the result of investments accounted for using the equity method (1,2) 2,9 - 1,7 Net financial result (10,8) Income tax expense (62,2) Profit for the financial year from continuing operations 179,6 Acquisition of property, plant and equipment and intangible assets(2) 376,7 86,3 - 463,0 Depreciation and amortisation 328,0 45,4 (7,5) 365,9 Impairment of non-current assets 33,2 0,2 - 33,4
Impairments amounting to EUR 27,9 million were realised on property, plant and equipment and intangible assets, mainly related to the loss-making activities of Dreamland and Dreambaby.
(1) Includes Roelandt Group as of January 2022 and Jims as of May 2021.
(2) Acquisition of property, plant and equipment and intangible assets does not include acquisitions through business combinations, right-of-use assets and changes in consolidation method.
(3) As adjusted due to discontinued operations. See note 16 for more information on the restatement of comparative information.
FINANCIAL REPORT | Consolidated statements • Statement • Independent auditor’s report • Notes • Definitions
(in million EUR) Retail 2021/22(1) Wholesale and Foodservice 2021/22 Other activities 2021/22 Operating segments 2021/22 Revenue - external 8.164,9 1.065,0 819,4 10.049,3 Revenue – internal 68,4 17,2 13,5 99,1 Operating profit (EBIT) 351,7 51,1 14,1 416,9 Share in the result of investments accounted for using the equity method (0,7) - 4,6 3,9 Acquisition of property, plant and equipment and intangible assets 2 369,1 25,5 20,8 415,4 Depreciation and amortisation 274,1 20,7 12,2 307,0 Impairment of non-current assets 6,1 - 0,1 6,2 (in million EUR) Operating segments 2021/22 Unallocated 2021/22 Eliminations between operating segments & reclassification to discontinued operations(3) 2021/22 Consolidated 2021/22 Revenue – external 10.049,3 - (798,2) 9.251,1 Revenue – internal 99,1 - (99,1)Operating profit (EBIT) 416,9 (41,7) (12,1) 363,1 Share in the result of investments accounted for using the equity method 3,9 2,1 - 6,0 Net financial result 1,5 Income tax expense (92,6) Profit for the financial year from continuing operations 278,0 Acquisition of property, plant and equipment and intangible assets 2 415,4 72,1 - 487,5 Depreciation and amortisation 307,0 51,8 (8,5) 350,3 Impairment of non-current assets 6,2 0,4 - 6,6
238
2.2. Geographical information
As customers are mostly serviced in their own geographical areas, the geographical information is based on the location of the Company and its subsidiaries. The geographical information represents the contribution in Colruyt Group of the countries in which the entities are domiciled and contains all of Colruyt Group’s entities which are active in the operating segments, as well as in the group support activities.
The main geographical locations are Belgium (location of the Company and many of its subsidiaries; these are active in all operating segments and in the group support activities), France (these entities are active in the operating segments 'Retail', 'Wholesale and Foodservice' and in the group support activities) and other countries. See note 34. List of consolidated entities for the location of entities.
Geographical information
(1) As adjusted due to discontinued operations. See note 16 for more information on the restatement of comparative information.
239 FINANCIAL REPORT | Consolidated statements • Statement • Independent auditor’s report • Notes • Definitions
(in million EUR) Belgium France Other Total 2022/23 2021/22(1) 2022/23 2021/22(1) 2022/23 2021/22(1) 2022/23 2021/22(1) Revenue 9.076,1 8.467,9 780,7 712,0 76,8 71,2 9.933,6 9.251,1 Acquisitions of property, plant and equipment and intangible assets 391,3 438,1 67,2 44,5 4,5 4,9 463,0 487,5
3. Revenue and gross profit
(1) As adjusted due to discontinued operations. See note 16 for more information on the restatement of comparative information.
3.1. Revenue by cash-generating unit
(1) As adjusted due to discontinued operations. See note 16 for more information on the restatement of comparative information.
(2) The revenue from the Dreamland and Dreambaby webshops realised by Colruyt, Okay and Bio-Planet stores is presented under Retail Non-food as of financial year 2022/23. The figures for financial year 2021/22 were also adjusted accordingly.
(3) The subtotals ‘Food’ and ‘Non-food’ within the operating segment ‘Retail’ are for information purposes only.
(4) Including the revenue from the Collect&Go and Bio-Planet webshops realised by Colruyt stores.
(5) Including the revenue from Roelandt Group (as of January 2022).
(6) Including the revenue from Dreamland and Dreambaby, Bike Republic, The Fashion Society, Jims (since May 2021) and Newpharma (period from October to December 2022).
FINANCIAL REPORT | Consolidated statements • Statement • Independent auditor’s report • Notes • Definitions
(in million EUR) 2022/23 2021/22(1) Revenue 9.933,6 9.251,1 Cost of goods sold (7.074,2) (6.546,4) Gross profit 2.859,4 2.704,7 As a % of revenue 28,8% 29,2%
(in million EUR) 2022/23 2021/22(1)(2) Retail Food(3) 8.145,5 7.642,3 Colruyt Belgium and Luxembourg(4)(5) 6.435,7 6.019,4 Okay, Bio-Planet and Cru 1.056,3 1.031,3 Colruyt France and DATS 24 France 653,5 591,6 Retail Non-food(3)(6) 604,4 522,6 Transactions with other operating segments 72,3 68,4 Retail 8.822,2 8.233,3 Wholesale 944,5 911,0 Foodservice 216,8 154,0 Transactions with other operating segments 21,6 17,2 Wholesale and Foodservice 1.182,9 1.082,2 DATS 24 Belgium 886,0 798,2 Printing and document management solutions 22,4 21,2 Transactions with other operating segments 20,5 13,5 Other activities 928,9 832,9 Total operating segments 10.934,0 10.148,4 Eliminations between operating segments (114,4) (99,1) Reclassification to discontinued operations(1) (886,0) (798,2) Consolidated 9.933,6 9.251,1
240
4. Other operating income and expenses
(1) As adjusted due to discontinued operations. See note 16 for more information on the restatement of comparative information.
Remuneration received includes, amongst others, income from services rendered to third parties and revenue from waste recycling.
(1) As adjusted due to discontinued operations. See note 16 for more information on the restatement of comparative information.
5. Services and miscellaneous goods
(1) As adjusted due to discontinued operations. See note 16 for more information on the restatement of comparative information.
High and volatile energy prices impact utilities and logistics expenses.
241 FINANCIAL REPORT | Consolidated statements • Statement • Independent auditor’s report • Notes • Definitions
(in million EUR) 2022/23 2021/22(1) Rental and rental-related income 14,3 13,2 Gains on disposal of non-current assets 10,0 6,9 Remuneration received 97,5 87,2 Other 26,7 28,2 Total other operating income 148,5 135,5
(in million EUR) 2022/23 2021/22(1) Operating taxes 10,2 13,1 Property withholding tax 15,6 15,0 Losses on disposal of non-current assets 0,7 2,4 Other 2,5 4,7 Total other operating expenses 29,0 35,2
(in million EUR) 2022/23 2021/22(1) Rental and rental-related charges 35,4 25,3 Maintenance and repairs 86,1 79,1 Utilities 102,5 73,3 Logistic expenses 177,6 138,6 Fees, IT and IT-related expenses 210,1 194,6 Administration, marketing and other expenses 104,8 101,3 Impairment of current assets 0,9 (0,3) Total services and miscellaneous goods 717,4 611,9
6. Employee benefit expenses
(1) As adjusted due to discontinued operations. See note 16 for more information on the restatement of comparative information.
(2) Of which the Belgian salary pool for the financial year 2022/23 amounts to EUR 1.185,2 million (EUR 1.082,0 million for the financial year 2021/22).
(3) This line item consists of the full cost of the profit-sharing schemes, including the employer social security contributions.
(4) At 31/03/2023, there are 31.535 employees in FTE, discountinued operations included.
Capital increase reserved for employees
Colruyt Group offers its employees the opportunity to subscribe to an annual capital increase of the parent company Etn. Fr. Colruyt NV. The discount granted on this capital increase complies with Article 7:204 of the Code on Companies and Associations. During the most recent capital increase 1.489 employees subscribed to 238.500 shares, corresponding to a capital contribution of EUR 5,4 million. The discount granted on this transaction was EUR 1,2 million and is accounted for as an employee benefit.
Compensatory amounts
Employee benefit expenses are presented free of compensatory amounts. Compensatory amounts relate mainly to employee costs capitalised in the context of non-current assets produced internally by Colruyt Group.
Number of employees
The number of employees in full-time equivalents (FTE) includes only employees on permanent employment contracts. As a result, the members of the Board of Directors, interim personnel, consultants and students working under specific student conditions are not included in these full-time equivalents.
FINANCIAL REPORT | Consolidated statements • Statement • Independent auditor’s report • Notes • Definitions
(in million EUR) 2022/23 2021/22(1) Wages and salaries(2) 1.277,7 1.163,9 Social security contributions 252,8 250,8 Consultants and interim personnel 120,7 105,5 Profit-sharing schemes for employees(3) 1,1 27,5 Contributions to defined contribution plans with a legally guaranteed minimum return 16,4 17,8 Other post-employment benefits 1,4 1,6 Discount on capital increase reserved for personnel 1,2 1,3 Other personnel costs 46,4 43,6 Compensatory amounts (106,4) (138,8) Total employee benefit expenses 1.611,3 1.473,2 Number of employees (FTEs) at reporting date(4) 31.461 31.134
2022/23 2021/22 Number of shares subscribed 238.500 184.228 Discount per share (in EUR) 5,2 6,8 Total discount granted (in million EUR) 1,2 1,3
242
7. Net financial result
(1) As adjusted due to discontinued operations. See note 16 for more information on the restatement of comparative information.
243 FINANCIAL REPORT | Consolidated statements • Statement • Independent auditor’s report • Notes • Definitions
(in million EUR) 2022/23 2021/22(1) Interest income on customer and other loans 1,9 1,7 Dividends received 4,1 4,7 Interest income on short-term bank deposits 1,1 0,2 Interest income on fixed-income securities and compound instruments at fair value through profit or loss 0,4 1,7 Fair value adjustments to financial assets and liabilities at fair value through profit or loss 1,7 1,6 Gains on disposal of financial assets 0,2 0,8 Adjustments for the time value of assets 0,3 0,2 Exchange gains 0,3 0,3 Other 0,7 0,1 Finance income 10,7 11,3 Interest expense on current and non-current loans 11,8 1,5 Fair value adjustments to financial assets and liabilities at fair value through profit or loss 1,9 2,4 Losses on disposal of financial assets 0,9 0,7 Adjustment for the time value of liabilities 5,4 4,7 Exchange losses 0,4 0,3 Other 1,1 0,2 Finance costs 21,5 9,8 Net financial result (10,8) 1,5
8. Income tax expense
8.1. Income taxes recognised in profit or loss
(in
A)
B)
C)
(1) As adjusted due to discontinued operations. See note 16 for more information on the restatement of comparative information.
(2) Includes the effects of, amongst others, the dividends-received deduction, the deduction for risk capital, the deduction for compensatory losses, the deduction for innovation and the increased deduction for investment.
(3) The applicable tax rate is the weighted average tax rate for the Company and all its consolidated subsidiaries in different jurisdictions.
8.2. Tax impacts recognised in other comprehensive income
Certain tax effects have not been recognised in the income statement, but are included in the statement of comprehensive income for the financial year.
FINANCIAL REPORT | Consolidated statements • Statement • Independent auditor’s report • Notes • Definitions
million EUR) 2022/23 2021/22(1)
Effective tax rate
before tax (excluding share in the result of investments accounted for using the equity method) 240,1 364,6 Income tax expense 62,2 92,6 Effective tax rate(2) 25,90% 25,40%
Profit
Reconciliation between the effective tax rate and the applicable tax rate(3) 24,35% 24,68% Profit before tax (excluding share in the result of investments accounted for using the equity method) 240,1 364,6 Income tax expense (based on applicable tax rate) 58,5 90,0 Non-taxable income/non tax-deductible expenses 5,7 6,2 Permanent differences 0,3 0,6 Impact of tax deductions (1,5) (3,1) Other (0,8) (1,1) Income tax expense 62,2 92,6 Effective tax rate 25,90% 25,40%
Income tax expense recognised in profit or loss Current year taxes 73,3 80,4 Deferred taxes (9,5) 12,5 Adjustments relating to prior years (1,6) (0,3) Total income tax expense 62,2 92,6
2022/23 2021/22 Tax impact on revaluation of liabilities
benefits (4,2) (6,0) Tax impact on cash flow hedge reserves 0,9 (2,3) Total tax impacts recognised in other comprehensive income (3,3) (8,3) 244
(in million EUR)
related to long-term post-employment
9. Goodwill
The recognised goodwill relates to goodwill arising from the acquisition of complete business entities. For more information regarding the definition, recognition and valuation of goodwill we refer to note 1. Significant accounting policies
As described in the policies, goodwill is not amortised but tested annually for impairment at the level of the cash-generating unit (CGU) in line with the provisions in IAS 36. Colruyt Group considers the business segments or business entities as CGUs. The impairment test of goodwill consists of comparing the recoverable amount of each CGU with its carrying amount, including goodwill, with an impairment recognised if the carrying amount is higher than the recoverable amount. Recoverable amounts are based on value in use. The latter is equal to the present value of the forecast cash flows of each CGU or group of CGUs and is determined using the following data:
• cash flows based on the latest forecasts, including detailed planning for revenue, EBITDA and investment planning through capital expenditure or leasing. When preparing cash flow forecasts, Colruyt Group uses estimated growth rates and expected future margins derived from the actual figures of the most recent financial year and from forecasts;
• a residual value determined from an extrapolation of the cash flow of the last year of the forecast, influenced by a long-term growth rate. To determine the residual value using the discounted cash flow method, the ‘Gordon growth model’ was used;
• discounting of expected cash flows at a rate determined using the weighted average cost of capital (WACC) formula. To determine the discount rate, Colruyt Group uses the ‘Capital Asset Pricing Model’. For its impairment testing, Colruyt Group uses a minimum WACC of 8,0% or, if higher, a WACC calculated on the basis of the 'Capital Asset Pricing Model’.
Given the importance of these assumptions for calculating value in use, a) they are monitored closely at a central level through alignment and validation processes, and b) external sources of information are used to determine them. The principal assumptions for calculating value in use for the CGUs with material goodwill are shown in the following table:
Given all CGUs are active in retail activities in Belgium, the same WACC was calculated for all CGUs based on the ‘Capital Asset Pricing Model’. The WACC has risen to a range of 6,3% to 6,7% (versus 5,0% to 6,3% last year) as a result of an increasing risk-free rate partially offset by a decreasing Equity to Capital ratio for Colruyt Group. We also see a limited WACC increase for the peer group as a result of the decline in the beta.
In determining the long-term growth rate, Colruyt Group takes into account internal sources of information, the evolution and expectations of the Belgian retail market and long-term inflation. In line with last year, the long-term growth rate for all CGUs was retained at 1%, with Colruyt Group expecting long-term growth to normalise.
The impairment tests were performed in February 2023. For Newpharma Group NV, the purchase price allocation of the business combination has not yet been finalised on the reporting date. We therefore only include the provisional goodwill. Newpharma Group NV is currently being integrated into Colruyt Group's operations. At the time of impairment testing, no forecasts existed for the integrated CGU. A value in use was calculated based on a WACC of 8,0% and a long-term growth rate of 2,0% (based on external information and internal expectations for e-commerce and the relevant sector). Based on these tests and the sensitivity analysis, no impairment risk was identified.
As a result of the impairment tests performed, no impairments were identified and there was sufficient headroom for all CGUs, with a minimum headroom in relation to the carrying amount of 32,1%. Colruyt Group is of the opinion that the above-described assumptions used for calculating the value in use provide the best estimation of future evolutions.
245 FINANCIAL REPORT | Consolidated statements • Statement • Independent auditor’s report • Notes • Definitions
Discount rate used in test long-term growth % Time horizon business plan Discount rate based on Capital Asset Pricing Model 31.03.23 31.03.22 31.03.23 31.03.22 31.03.23 31.03.23 31.03.22 Retail Food 8,0% 8,0% 1,0% 1,0% 5 years 6,3% - 6,7% 5,0% - 6,3% Retail Non-food 8,0% 8,0% 1,0% 1,0% 5 years 6,3% - 6,7% 5,0% - 6,3%
Colruyt Group's models also include sensitivity analyses for gross margins, sales growth, increased operating costs, long-term growth rate, WACC and a combination of various parameters. Based on these sensitivity analyses, no impairment risk was identified for the various CGUs and consequently these sensitivity analyses indicate that a reasonably possible change in these assumptions would not result in an impairment.
Goodwill by cash-generating unit can be presented as follows:
(1) Goodwill adjustment to reflect changes in estimates within the measurement period.
(2) For acquisitions, see note 15. Business combinations
The changes in ‘Goodwill’ can be explained as follows:
Goodwill adjustment to reflect changes in estimates within the measurement period.
FINANCIAL REPORT | Consolidated statements • Statement • Independent auditor’s report • Notes • Definitions
(in million EUR) 31.03.22 Acquisitions(2) Other(1) 31.03.23 Retail Food(2) 57,8 6,0 - 63,8 Retail Non-food (2) 77,4 209,6 1,3 288,3 Foodservice 13,6 - - 13,6 Printing and document management solutions 8,8 - - 8,8 Consolidated 157,6 215,6 1,3 374,5
(in million EUR) Gross carrying amount 2022/23 Impairments 2022/23 Net carrying amount 2022/23 Gross carrying amount 2021/22 Impairments 2021/22 Net carrying amount 2021/22 At 1 April 181,9 (24,3) 157,6 149,1 (24,2) 124,9 Acquisitions 215,6 - 215,6 24,6 - 24,6 Other(1) 1,3 - 1,3 8,2 (0,1) 8,1 At 31 March 398,8 (24,3) 374,5 181,9 (24,3) 157,6
246
(1)
10. Intangible assets
247 FINANCIAL REPORT | Consolidated statements • Statement • Independent auditor’s report • Notes • Definitions
Internally developed intangible assets Externally purchased software, licences and similar rights Acquired customer lists Other intangible assets Intangible assets under development Total Acquisition value At 1 April 2022 206,0 104,9 8,9 12,7 195,6 528,1 Acquisitions through business combinations - - - 0,7 - 0,7 Acquisitions 5,1 5,0 0,1 0,6 58,8 69,6 Sales and disposals (2,9) (11,0) (1,6) - - (15,5) Other reclassification/Other 55,7 0,1 - - (55,8)Reclassification to assets from discontinued operations(1) (1,3) (1,3) - - (0,7) (3,3) At 31 March 2023 262,6 97,7 7,4 14,0 197,9 579,6 Amortisation At 1 April 2022 (99,9) (79,9) - (0,1) - (179,9) Amortisation (24,5) (9,9) - (0,4) - (34,8) Sales and disposals 1,8 11,2 - - - 13,0 Reclassification to assets from discontinued operations(1) 0,9 1,0 - - - 1,9 At 31 March 2023 (121,7) (77,6) - (0,5) - (199,8) Impairment At 1 April 2022 (12,1) (0,1) (4,4) - (2,2) (18,8) Impairment (2,2) - - - (20,0) (22,2) Sales and disposals 1,1 - 0,1 - - 1,2 Other reclassification/Other (1,3) - - - 1,3At 31 March 2023 (14,5) (0,1) (4,3) - (20,9) (39,8) Net carrying amount at 31 March 2023 126,4 20,0 3,1 13,5 177,0 340,0 (1) As adjusted due to discontinued operations. See Note 16 for more information.
(in million EUR)
To clarify the breakdown between internally developed intangible assets and externally purchased intangible assets, the table in note 10. Intangible assets has been adjusted for both financial years. The categories ‘Intangible assets under development and other intangible assets’ and ‘Concessions, software, licences and similar rights’ in the 2021/22 annual report have been broken down into ‘Internally developed intangible assets’, ‘Externally purchased software, licences and similar rights’, ‘Other intangible assets’ and ‘Intangible assets under development’.
The externally purchased, software, licences and similar rights totalling EUR 20,0 million (previous reporting period EUR 24,9 million) consist mainly of purchased IT security software. The internally generated software still under development (mainly transformation programs) at the end of the current financial year totals EUR 177,0 million (compared to EUR 193,4 million for the previous financial year). During the current financial year the group acquired intangible assets for an amount of EUR 69,6 million (compared to EUR 88,2 million during the previous financial year), of which EUR 63,9 million were developed internally (compared to EUR 76,1 million during the previous financial year).
Impairments amounting to EUR 22,2 million were realised, mainly related to the loss-making operations of Dreamland and Dreambaby.
Non-capitalised costs related to research and development amount to EUR 55,9 million. These costs consist of externally purchased goods and services as well as internal transactions and cost allocations.
FINANCIAL REPORT | Consolidated statements • Statement • Independent auditor’s report • Notes • Definitions (in million EUR) Internally developed intangible assets Externally purchased software, licences and similar rights Acquired customer lists Other intangible assets Intangible assets under development Total Acquisition value At 1 April 2021 199,4 99,3 5,9 12,6 136,9 454,1 Acquisitions through business combinations - 0,6 - - - 0,6 Acquisitions 3,6 9,0 3,0 0,1 72,5 88,2 Sales and disposals (10,8) (4,0) - - - (14,8) Other reclassification/Other 13,8 - - - (13,8)At 31 March 2022 206,0 104,9 8,9 12,7 195,6 528,1 Amortisation At 1 April 2021 (86,6) (71,4) - (0,1) - (158,1) Amortisation (20,3) (12,5) - - - (32,8) Sales and disposals 7,0 4,0 - - - 11,0 At 31 March 2022 (99,9) (79,9) - (0,1) - (179,9) Impairment At 1 April 2021 (10,7) (0,2) (4,4) - (3,6) (18,9) Impairment (2,9) - - - - (2,9) Sales and disposals 2,9 0,1 - - - 3,0 Other reclassification/Other (1,4) - - - 1,4At 31 March 2022 (12,1) (0,1) (4,4) - (2,2) (18,8) Net carrying amount at 31 March 2022 94,0 24,9 4,5 12,6 193,4 329,4
248
11. Property, plant and equipment
(1) Includes the effect of the revaluation of right-of-use assets as a result of indexations (only for the acquisition values) on the one hand, and changes to the lease portfolio (extension/termination/new leases) on the other hand.
(2) As adjusted due to discontinued operations. See note 16 for more information.
249 FINANCIAL REPORT | Consolidated statements • Statement • Independent auditor’s report • Notes • Definitions
(in million EUR) Land and buildings Plant, machinery and equipment Furniture and vehicles Right-of-use assets Other property, plant and equipment Assets under construction Total Acquisition value At 1 April 2022 3.139,8 880,0 556,3 361,5 223,4 94,7 5.255,7 Revaluation(1) - - - 62,3 - - 62,3 Acquisitions through business combinations 6,0 1,8 0,1 1,9 4,7 2,1 16,6 Acquisitions 143,1 50,7 70,9 13,2 19,0 109,7 406,6 Sales and disposals (29,7) (22,8) (39,6) (1,8) (5,9) (0,1) (99,9) Other reclassification/Other 40,7 7,7 3,4 (0,6) 1,3 (53,0) (0,5) Reclassification to assets from discontinued operations(2) (1,4) (118,5) (0,7) (5,6) - (6,3) (132,5) Currency translation adjustments (0,3) 0,1 (0,3) - - - (0,5) At 31 March 2023 3.298,2 799,0 590,1 430,9 242,5 147,1 5.507,8 Depreciation At 1 April 2022 (1.369,1) (541,4) (395,9) (97,0) (99,5) - (2.502,9) Revaluation(1) - - - 17,4 - - 17,4 Depreciation (133,2) (65,0) (71,8) (51,7) (16,9) - (338,6) Sales and disposals 22,4 21,6 32,1 1,8 5,4 - 83,3 Other reclassification/Other (0,2) (0,4) - 0,3 0,3 -Reclassification to assets from discontinued operations(2) 0,2 66,2 0,4 2,1 - - 68,9 Currency translation adjustments 0,1 - 0,2 - - - 0,3 At 31 March 2023 (1.479,8) (519,0) (435,0) (127,1) (110,7) - (2.671,6) Impairment At 1 April 2022 (6,1) (1,4) - - (0,3) - (7,8) Impairment (7,8) (1,0) (0,3) - (2,9) - (12,0) Sales and disposals 2,2 0,5 0,1 - 0,1 - 2,9 Reversal of impairments 0,7 - - - - - 0,7 Reclassification to assets from discontinued operations(2) - 0,7 - - - - 0,7 At 31 March 2023 (11,0) (1,2) (0,2) - (3,1) - (15,5) Net carrying amount at 31 March 2023 1.807,4 278,8 154,9 303,8 128,7 147,1 2.820,7
(1) Includes the effect of the revaluation of right-of-use assets as a result of indexations (only for the acquisition values) on the one hand, and changes to the lease portfolio (extension/termination/new leases) on the other hand.
Collateral has been provided for contracted liabilities, mainly at The Fashion Society (note 25. Interest-bearing liabilities).
During financial year 2022/23, Colruyt Group acquired property, plant and equipment totalling EUR 406,6 million (EUR 399,4 million in financial year 2021/22). These acquisitions include the expansion and modernisation of the store network, investments in the logistical infrastructure and production departments, and in sustainable energy. The net carrying amount of the line item ‘Right-of-use assets’ for the current financial year amounts to EUR 303,8 million (compared to EUR 264,5 million for the previous reporting period) and consists of leases in respect of buildings (EUR 286,0 million), land (EUR 1,5 million), vehicles, machinery, ICT equipment and other tangible fixed assets (EUR 16,4 million).
On property, plant and equipment an impairment loss of EUR 12,0 million was recognised, mainly relating to the loss-making operations of Dreamland and Dreambaby, and the expansion, relocation and renovation of existing stores. The impairment loss is included in the income statement of the current reporting period under ‘Depreciation, amortisation and impairment of non-current assets’ within the operating segments ‘Retail’, ‘Wholesale and Foodservice’ and ‘Other activities’.
FINANCIAL REPORT | Consolidated statements • Statement • Independent auditor’s report • Notes • Definitions (in million EUR) Land and buildings Plant, machinery and equipment Furniture and vehicles Right-of-use assets Other property, plant and equipment Assets under construction Total Acquisition value At 1 April 2021 2.957,3 847,2 548,2 284,7 202,9 83,1 4.923,4 Revaluation(1) - - - 45,8 - - 45,8 Acquisitions through business combinations 17,3 4,3 1,1 27,8 6,6 0,2 57,3 Acquisitions 185,9 60,4 58,7 3,9 21,9 68,6 399,4 Sales and disposals (48,3) (52,8) (54,9) (0,2) (13,8) (0,5) (170,5) Other reclassification/Other 27,5 20,8 3,1 (0,5) 5,8 (56,7)Currency translation adjustments 0,1 0,1 0,1 - - - 0,3 At 31 March 2022 3.139,8 880,0 556,3 361,5 223,4 94,7 5.255,7 Depreciation At 1 April 2021 (1.279,0) (530,0) (377,4) (59,1) (94,3) - (2.339,8) Revaluation(1) - - - 7,0 - - 7,0 Depreciation (129,2) (63,1) (71,0) (45,5) (17,3) - (326,1) Sales and disposals 39,9 50,8 53,0 0,3 12,0 - 156,0 Other reclassification/Other (0,8) 0,9 (0,5) 0,3 0,1 -At 31 March 2022 (1.369,1) (541,4) (395,9) (97,0) (99,5) - (2.502,9) Impairment At 1 April 2021 (5,3) (1,4) - - (0,3) - (7,0) Impairment (2,0) (0,3) (0,3) - (0,9) - (3,5) Sales and disposals 1,3 0,3 0,3 - 0,9 (0,1) 2,7 Other reclassification/Other (0,1) - - - - 0,1At 31 March 2022 (6,1) (1,4) - - (0,3) - (7,8) Net carrying amount at 31 March 2022 1.764,6 337,2 160,4 264,5 123,6 94,7 2.745,0
250
The grants received are included in the net carrying amount of the property, plant and equipment item concerned. These grants amount (net) to:
The grants recognised in profit or loss amount to EUR 1,4 million (EUR 1,3 million in the previous financial reporting period). The grants consist mainly of the grant awarded for the construction of the logistics site in Ath/Lessines.
12. Investments in associates
The investments in associates for the financial year 2022/23 relate to the non-quoted entities AgeCore SA (25,00%), First Retail International 2 NV (4,73%), Vendis Capital NV (10,87%), Smartmat NV (41,36%), Scallog SAS (23,73%), The Seaweed Company BV (21,30%), and Virya Energy NV (59,94%). These investments are considered as associates and are accounted for using the equity method given that Colruyt Group has a significant influence based on indicators as defined under paragraph 6 of IAS 28, ‘Investments in Associates and Joint Ventures’. Acquisitions and transactions with non-controlling interests mainly concern Virya Energy NV. After conversion of the convertible loan between Colruyt Group and Virya Energy NV, Colruyt Group's stake in Virya Energy NV increased from 59,78% to 59,94%. Transactions with non-controlling interests include the initial recognition of put options on non-controlling interests agreed by Virya Energy NV with the respective shareholders. This liability will be revalued at each closing date, with subsequent changes recognised in equity.
The investment in Newpharma Group NV has been fully consolidated as a subsidiary since October 2022. This change in consolidation method is included in this note under the line item ‘Disposals’. Through the acquisition of the remaining 39% of the shares of Korys Investments NV on 14 October 2022, Colruyt Group's stake in Newpharma Group NV increased to 100%. The requisite measures were taken in the context of the conflict of interest rules.
251 FINANCIAL REPORT | Consolidated statements • Statement • Independent auditor’s report • Notes • Definitions
(in million EUR) Land and buildings Plant, machinery and equipment Furniture and vehicles Right-of-use assets Other property, plant and equipment Assets under construction Total At 31 March 2022 (6,0) (5,0) (0,2) - - (0,3) (11,4) At 31 March 2023 (5,3) (3,6) (0,1) - - - (9,1)
(in million EUR) 2022/23 2021/22 Carrying amount at 1 April 452,3 313,4 Acquisitions/capital increases 97,6 115,2 Transactions with non-controlling interests (20,6)Disposals/capital decreases (94,6) (0,7) Share in the result for the financial year 3,2 5,8 Share in other comprehensive income 88,2 16,4 Dividend (1,4) (0,2) Other 1,3 2,4 Carrying amount at 31 March 526,0 452,3
The share of other comprehensive income mainly relates to interest rate swap contracts within Virya Energy NV.
On 22 March 2023, Virya Energy NV announced that it had entered into an agreement with JERA Green Ltd., a subsidiary of JERA Co. Inc., to sell 100% of the Parkwind NV shares. The transaction is expected to be closed in the course of financial year 2023 and is subject to approval by the relevant competition and other regulatory authorities. This will lead to a very large one-off positive effect in Colruyt Group's consolidated net result in financial year 2023/24. That effect is estimated at EUR 600 million to EUR 700 million (based on Virya Energy NV's last closing date, i.e. 31 December 2022). The final price may still vary depending on the exact date the transaction is completed, and is expected to be at least EUR 1,55 billion (net of debt) at the level of Virya Energy NV.
For transactions decided by the Board of Directors after year-end with regard to Virya Energy NV, we refer to note 32. Events after the reporting date
The investments in Scallog SAS, Smartmat NV and The Seaweed Company BV are presented under the operating segment ‘Retail’, the investment in Virya Energy NV under the operating segment ‘Other activities’ and the investments in AgeCore SA, First Retail International 2 NV and Vendis Capital NV under the segment ‘Unallocated’.
The consolidated figures of the material associates are as follows:
(1) Virya Energy NV and Smartmat NV are in turn sub-consolidations. Late statutory adjustments not recognised by Colruyt Group are not material and will be accounted for in the next financial year.
(2) As a result of the announced transaction to sell 100% of the shares of Parkwind NV, the requirements for IFRS 5, Assets Held for Sale and discontinued Operations were met. Consequently, within the sub-consolidation of Virya Energy NV, the entire Parkwind Group is presented as such in the balance sheet and income statement per 31 December 2022. The assets of the discontinued operation amount to EUR 2.352,6 million, its liabilities to EUR 1.458,8 million.
(3) The adjustments for Colruyt Group at Virya Energy NV are explained mainly by the fact that Colruyt Group recognises the Parkwind and Eurowatt entities in Virya Energy NV at historical value. These adjustments to the net assets relate to energy contracts within the ‘Non-current assets’ category. In addition, effects in the consolidated figures of Virya Energy NV resulting from a change in the consolidation method of the underlying entities, are offset by Colruyt Group as these effects are not applicable to Colruyt Group. The adjustment for Colruyt Group at Smartmat NV relates to goodwill.
FINANCIAL REPORT | Consolidated statements • Statement • Independent auditor’s report • Notes • Definitions
2022 (in million EUR) Virya Energy NV(1)(2) Smartmat NV(1) Non-current assets 497,0 5,0 Current assets(2) 2.484,4 4,8 Non-current liabilities 240,8 1,7 Current liabilities(2) 1.558,2 5,0 Net assets 1.182,5 3,0 of which non-controlling interests 110,8of which equity attributable to owners of the parent company 1.071,7 3,0 Share of Colruyt Group in net assets 642,4 1,2 Adjustment for Colruyt Group(3) (176,1) 26,2 Revenue(3) 111,0 30,7 Profit from continuing operations 9,3 0,6 Loss from discontinued operations(2) (19,2)Other comprehensive income 192,6Total comprehensive income 182,7 0,6 of which non-controlling interests 47,3of which equity attributable to owners of the parent company 135,4 0,6 Share of Colruyt Group in total comprehensive income 81,2 0,3 Adjustment for Colruyt Group(3) 11,2 -
252
(1) The adjustments for Colruyt Group at Virya Energy NV are explained mainly by the fact that Colruyt Group recognises the Parkwind and Eurowatt entities in Virya Energy NV at historical value. These adjustments to the net assets relate to energy contracts within the ‘Non-current assets’ category. In addition, effects in the consolidated figures of Virya Energy NV resulting from a change in the consolidation method of the underlying entities, are offset by Colruyt Group as these effects are not applicable to Colruyt Group. The adjustment for Colruyt Group at Newpharma Group NV and at Smartmat NV relates to goodwill.
(2) Virya Energy NV, Newpharma Group NV and Smartmat NV are in turn sub-consolidations. Late statutory adjustments not recognised by Colruyt Group are not material and will be accounted for in the next financial year.
(3) The figures of Newpharma Group NV in the tables have been adjusted to IFRS.
(4) The result of Parkwind NV at 31 December 2021 included in the sub-consolidation of Virya Energy NV.
253 FINANCIAL REPORT | Consolidated statements • Statement • Independent auditor’s report • Notes • Definitions 2021 (in million EUR) Virya Energy NV(2)(4) Newpharma Group NV(2)(3) Smartmat NV(2) Non-current assets 2.102,4 89,1 3,0 Current assets 251,0 17,4 7,9 Non-current liabilities 1.068,9 17,0 2,3 Current liabilities 399,5 24,4 6,8 Net assets 885,0 65,1 1,8 of which non-controlling interests 72,7 -of which equity attributable to owners of the parent company 812,3 65,1 1,8 Share of Colruyt Group in net assets 485,6 39,7 0,7 Adjustment for Colruyt Group(1) (187,4) 57,9 26,5 Revenue 179,3 156,5Profit from continuing operations 18,9 (1,1)Loss from discontinued operations(4) (6,9) -Other comprehensive income 34,2 -Total comprehensive income 46,2 (1,1)of which non-controlling interests 8,1 -of which equity attributable to owners of the parent company 38,1 (1,1)Share of Colruyt Group in total comprehensive income 22,8 (0,4)Adjustment for Colruyt Group(1) (1,8) - -
13. Investments in joint ventures
The investments in joint ventures for the financial year 2022/23 consist of the non-quoted entities Achilles Design BV (24,70%), Kriket BV (43,82%), Daltix NV and Daltix Unipessoal LDA (78,76%), We Connect Data BV (16,03%), Ticom NV (90,00%), Digiteal NV (26,84%), Some BV (24,97%), De Leiding BV (51,99%) and Pluginvest BV (25,00%). As Colruyt Group shares the control over these entities with other parties, these joint ventures are included in the consolidated financial statements using the equity method.
An interest in the company Pluginvest BV was acquired during the financial year (May 2022).
Through the exercise of a put option by a minority shareholder, Colruyt Group's investment in Daltix NV and Daltix Unipessoal LDA was increased to 78,76% in the current financial year.
On 27 December 2022, Colruyt Group made an additional cash contribution to De Leiding BV, increasing the investment from 46,23% to 51,99%.
On 28 March 2023, Colruyt Group sold its stake in Hyve BV. Colruyt Group held 16,67% of the shares.
The investments in Kriket BV, Daltix NV and Daltix Unipessoal LDA, Ticom NV, Digiteal NV, and De Leiding BV are presented in the operating segment ‘Retail’, the investments in Some BV and Pluginvest BV in the operating segment ‘Other activities’ and the investments in Achilles Design BV and We Connect Data BV in the segment ‘Unallocated’. These companies have their main activities in Belgium.
In both the current financial year 2022/23 and the previous financial year 2021/22, there were no material joint ventures.
FINANCIAL REPORT | Consolidated statements • Statement • Independent auditor’s report • Notes • Definitions
(in million EUR) 2022/23 2021/22 Carrying amount at 1 April 12,0 6,9 Acquisitions/capital increases 6,1 5,0 Disposals (0,2)Change in ownership percentage 0,1Share in the result for the financial year (1,5) 0,1 Carrying amount at 31 March 16,5 12,0
254
14. Financial assets
14.1. Non-current assets
The non-current financial assets evolved as follows during the financial year:
The financial assets at fair value through other comprehensive income consist mainly of the investment in the holding company Sofindev IV NV (9,42%), the investment in North Sea Wind CV (7,19%) and the holdings in investment funds Good Harvest Belgium I SRL (4,61%) and Blue Horizon Ventures I SCSp RAIF (1,09%). The investments in the various companies are measured at fair value, calculated as the share of Colruyt Group in the equity of these companies, corrected, in the case of the investment funds, for the fair value of their own investment portfolios.
During the current reporting period, the non-current financial assets decreased by a net EUR 3,9 million. This is mainly explained by the fair value adjustments of Sofindev IV NV of EUR -3,5 million.
During the previous reporting period, non-current financial assets decreased by net EUR 96,9 million. This was mainly explained by the reclassification of the convertible bonds of Virya Energy NV (EUR 95,0 million) from non-current to current assets, the capital decreases for Sofindev IV NV (EUR -2,3 million) and the fair value adjustment for Sofindev IV NV (EUR -1,1 million).
255 FINANCIAL REPORT | Consolidated statements • Statement • Independent auditor’s report • Notes • Definitions
(in million EUR) 31.03.23 31.03.22 Financial assets at fair value through other comprehensive income 10,8 14,7 Total 10,8 14,7
(in million EUR) 2022/23 2021/22 At 1 April 14,7 111,6 Acquisitions - 0,9 Capital increases 0,2 0,9 Capital decreases - (2,3) Fair value adjustments through other comprehensive income (4,1) (1,1) Reclassification - (95,0) Other - (0,3) At 31 March 10,8 14,7
14.2. Current assets
The current financial assets evolved as follows during the financial year:
The equity instruments and fixed-income securities at fair value through profit or loss relate mainly to financial assets held by the Luxembourg reinsurance company Locré SA (EUR 26,5 million for the current period). The equity instruments and fixed-income securities are measured at their closing rates on 31 March 2023. Fair value adjustments are recognised through profit or loss. The fair value adjustment to the current assets at 31 March 2023 resulted in a net loss of EUR 0,4 million for the current financial year (compared to a net loss of EUR 0,9 million for the financial year 2021/22). The return on the fixed-income securities is 0,9% on average, with a maximum of 4,9%.
The compound instruments measured at fair value through profit and loss in the previous financial year relate to the convertible bonds (EUR 95,0 million) issued by the associate Virya Energy NV. At the beginning of June 2022, Colruyt Group converted these convertible bonds into shares.
The financial assets at amortised cost relate to a term deposit held by Colruyt IT Consultancy India Private Limited. The derivative financial instruments are related to the fair value of the outstanding currency hedges for cash flow hedging purposes.
The cash flow hedging instruments are measured at their fair value at 31 March 2023. Fair value adjustments are accounted for through other comprehensive income owing to the classification as hedge accounting.
More information on Colruyt Group’s risk management approach to investments can be found in note 27. Risk management
FINANCIAL REPORT | Consolidated statements • Statement • Independent auditor’s report • Notes • Definitions
(in million EUR) 31.03.23 31.03.22 Equity instruments at fair value through profit or loss 9,4 9,3 Fixed-income securities at fair value through profit or loss 17,4 15,9 Compound instruments at fair value through profit or loss - 95,0 Financial assets at amortised cost 4,5 7,8 Derivative financial instruments – cash flow hedging instruments - 0,3 Total 31,3 128,3
(in million EUR) 2022/23 2021/22 At 1 April 128,3 36,4 Acquisitions 6,5 6,4 Sales and disposals (7,5) (17,8) Fair value adjustments through profit or loss (0,4) (0,9) Fair value adjustments through other comprehensive income (0,3) 9,0 Currency translation adjustments (0,3) 0,2 Reclassification (95,0) 95,0 At 31 March 31,3 128,3
256
15. Business combinations
On 14 October 2022, Colruyt Group increased its stake in Newpharma Group NV from 61% to 100%. Newpharma Group NV is a leading Belgian online pharmacy based in Liege and active in six countries. Since 1 October 2022, the investment in Newpharma Group NV has been fully consolidated as a subsidiary, and no longer as an associate using the equity method.
The transaction resulted in goodwill of EUR 203,5 million. In determining this goodwill, an acquisition price of EUR 96,5 million was taken into account for the remaining 39% of the shares and equity of EUR -23,1 million. The fair value of the 61% held in the associate's capital was valued at EUR 85,7 million as at the acquisition date, which means that the resulting gain compared to the carrying amount of the associate can be considered negligible. Hence, the increased stake in Newpharma Group NV in financial year 2022/23 will have no effect on the result.
The allocation of the acquisition price to the underlying assets of Newpharma Group NV has not yet been finalised at the reporting date and will be finalised in the course of financial year 2023/24. Part of the goodwill (estimated impact EUR 25,1 million) currently recorded is still expected to be allocated to amortisable intangible assets, mainly including the brand name. The remaining goodwill is underpinned by future synergies that will be generated by the integration of Newpharma Group NV into Colruyt Group. These synergies are generated, among other things, by new business opportunities and cost efficiencies in administrative costs.
The requisite measures were taken in the context of the conflict of interest rules. We refer to the Corporate Governance section for more details.
The acquisition balance sheet can be summarised as follows:
There were no other material business combinations in financial year 2022/23.
257 FINANCIAL REPORT | Consolidated statements • Statement • Independent auditor’s report • Notes • Definitions
(in million EUR) 01.10.2022 Non-current assets 9,5 Current assets 20,0 Non-current liabilities 16,6 Current liabilities 36,0 Net assets (23,1)
16. Assets held for sale, disposal of subsidiaries and discontinued operations
16.1. Assets held for sale
In October 2022, Colruyt Group communicated its intention to transfer the activities of DATS 24 NV to the associate Virya Energy NV. In March 2023, the conditions for presenting the related assets and liabilities as ‘discontinued operations’ were met. Consequently, Colruyt Group made the necessary reclassifications for the balance sheet positions of DATS 24 NV at the end of the financial year 2022/23. The activities of DATS 24 NV are presented under the operating segment ‘Other activities’. The above amounts exclude receivables and liabilities of DATS 24 NV vis-à-vis fully consolidated companies within Colruyt Group. On 1 June 2023, Colruyt Group reached an agreement for the sale of DATS 24 NV. For more information on the transaction in financial year 2023/24, we refer to note 32. Events after the reporting date.
No assets were classified as ‘Assets held for sale’ in financial year 2021/22.
FINANCIAL REPORT | Consolidated statements • Statement • Independent auditor’s report • Notes • Definitions
(in million EUR) 31.03.23 Intangible assets 1,3 Property, plant and equipment 62,8 Other receivables 0,4 Total non-current assets from discontinued operations 64,5 Inventories 20,4 Trade receivables 40,5 Current tax assets 0,2 Other receivables 2,6 Cash and cash equivalents 2,6 Total current assets from discontinued operations 66,3 Total assets from discontinued operations 130,8 Liabilities related to employee benefits 0,1 Deferred tax liabilities 1,2 Interest-bearing and other liabilities 3,0 Total non-current liabilities from discontinued operations 4,3 Interest-bearing liabilities 0,6 Trade payables 79,6 Liabilities related to employee benefits and other liabilities 4,7 Total current liabilities from discontinued operations 84,9 Total liabilities from discontinued operations 89,2 Net carrying amount from discontinued operations 41,6
258
16.2. Disposal of subsidiaries
No material disposals of subsidiaries occurred in either financial year 2022/23 or financial year 2021/22.
16.3. Discontinued operations
Consolidated income statement from discontinued operations
The discontinued operations relate to DATS 24 NV. As the conditions for classification as ‘discontinued operations’ were met in financial year 2022/23, the figures for financial year 2021/22 were also restated.
The income statement related to the operations of DATS 24 NV was reclassified from continuing to discontinued operations for both the previous (DATS 24 NV and Eoly NV) and the current financial year (DATS 24 NV). As Colruyt Group intends to continue to purchase services and products from DATS 24 NV after the latter's contribution into Virya Energy NV, the intra-group transactions between continuing operations and discontinued operations were not eliminated.
No profit or loss was recognised related to fair value adjustments or to the disposal of assets from discontinued operations as this is not applicable.
Consolidated cash flows from discontinued operations
259 FINANCIAL REPORT | Consolidated statements • Statement • Independent auditor’s report • Notes • Definitions
(in million EUR) 2022/23 2021/22 Revenue 886,2 798,2 Costs (938,1) (846,7) Other operating income 79,4 60,6 Operating profit (EBIT) 27,5 12,1 Profit before tax 27,8 12,1 Income tax expense (6,9) (2,1) Profit for the financial year from discontinued operations 20,9 10,0 Attributable to: Owners of the parent company 20,9 10,0
(in million EUR) 2022/23 2021/22 Cash flow from operating activities 75,2 10,2 Cash flow from investing activities (14,9) 4,2 Cash flow from financing activities (30,4) (19,1) Net increase/(decrease) of cash and cash equivalents 29,9 (4,8)
17. Deferred tax assets and liabilities
Deferred tax assets and liabilities can be detailed as follows:
17.1. Net carrying amount
On 31 March 2023, Colruyt Group had unrecognised deferred tax assets and liabilities in an amount of EUR 61,2 million (EUR 62,6 million on 31 March 2022). This amount relates to temporary differences, as well as tax losses and unused tax assets carried forward totalling EUR 244,8 million (EUR 244,8 million for the 2021/22 financial year).
Colruyt Group only recognises deferred tax assets to the extent that it is probable that future taxable profit will be available against which the unused tax losses and unused tax credits can be utilised. Colruyt Group sets a time horizon of five years for these estimates.
The other liabilities on the asset side mainly relate to IFRS 16 lease liabilities and on the liability side to deferred tax liabilities that cannot be allocated to the other headings.
FINANCIAL REPORT | Consolidated statements • Statement • Independent auditor’s report • Notes • Definitions
(in million EUR) Assets Liabilities Balance 31.03.23 31.03.22 31.03.23 31.03.22 31.03.23 31.03.22 Intangible assets 9,6 7,5 (0,1) - 9,5 7,5 Property, plant and equipment 1,9 2,1 (140,7) (134,9) (138,8) (132,8) Inventories - 0,1 (0,5) (3,2) (0,5) (3,1) Receivables 3,3 1,9 (6,7) (6,6) (3,4) (4,7) Liabilities related to employee benefits 12,0 18,6 - - 12,0 18,6 Other provisions 1,1 1,4 (12,0) (11,6) (10,9) (10,2) Other liabilities 77,5 64,3 (25,3) (25,2) 52,2 39,1 Tax loss carry-forwards, deductible items and reclaimable tax paid 73,0 74,0 - - 73,0 74,0 Gross deferred tax assets/(liabilities) 178,4 169,9 (185,3) (181,5) (6,9) (11,6) Unrecognised tax assets/liabilities (87,6) (75,6) 26,4 13,0 (61,2) (62,6) Offsetting tax assets/liabilities (72,7) (76,9) 72,7 76,9 -Net deferred tax assets/(liabilities) 18,1 17,4 (86,2) (91,6) (68,1) (74,2)
260
17.2. Change in net carrying amount
(1) Includes both the changes in continuing operations and in discontinued operations.
(2) As adjusted due to discontinued operations. See note 16 for more information on liabilities from discontinued operations.
18. Inventories
The inventory valuation has been updated in 2021/22 and had a one-off effect of EUR 26,1 million. The accumulated impairment on inventories of trade goods amounted to EUR 49,7 million in the current financial year compared to EUR 47,4 million in the previous financial year.
The amount of inventories recognised as an expense in the 2022/23 income statement amounts to EUR 7.074,2 million and was reported under ‘Cost of goods sold’. Last year this expense was EUR 6.546,4 million.
In financial year 2022/23, EUR 20,4 million was transferred to assets from discontinued operations. See note 16.1 for more information on the assets from discontinued operations.
261 FINANCIAL REPORT | Consolidated statements • Statement • Independent auditor’s report • Notes • Definitions
(in million EUR) Assets Liabilities Balance 2022/23 2021/22 2022/23 2021/22 2022/23 2021/22 Net carrying amount at 1 April 17,4 12,3 (91,6) (66,0) (74,2) (53,7) Changes recognised in profit or loss(1) 0,7 5,1 7,8 (16,7) 8,5 (11,6) Changes recognised in other comprehensive income - - (3,3) (8,3) (3,3) (8,3) Acquisitions through business combinations - - - (0,5) - (0,5) Changes in the consolidation method - - (0,3) (0,1) (0,3) (0,1) Reclassification as liabilities from discontinued operations(2) - - 1,2 - 1,2Net carrying amount at 31 March 18,1 17,4 (86,2) (91,6) (68,1) (74,2)
(in million EUR) 2022/23 2021/22 Trade goods 707,4 695,2 Raw materials, packaging materials, finished goods and spare parts 119,1 120,4 Total inventories 826,5 815,6
19. Trade and other receivables
19.1. Other non-current receivables
(1) In financial year 2022/23, EUR 0,4 million was reclassified as assets from discontinued operations. See note 16 for more information on the assets from discontinued operations.
Loans granted to customers mainly comprise loans to independent storekeepers of Retail Partners Colruyt Group NV. The loans are usually granted for a maximum period of 15 years.
The ‘Guarantees granted’ have been provided in respect of purchase obligations.
The lease receivables (EUR 20,4 million) relate to finance subleases in respect of buildings.
Guarantees were received for the total outstanding lease receivables (current and non-current) for a total of EUR 16,0 million. The guarantees received exceed the expected credit losses.
Other non-current receivables are presented net of any impairments. Recognised impairments for expected credit losses on the total of other non-current receivables amount to EUR 1,0 million (comparative reporting period EUR 2,5 million). To calculate the impairments, the general approach under IFRS 9 was used, whereby assets are assessed on an individual basis, with any impairments recorded on the basis of expected credit losses. The credit risk assessment for loans to associates and joint ventures is linked to the analysis of impairment indicators. The result of this analysis is that there are no expected credit losses for loans to associates and joint ventures. See also note 1.5.E -
Financial
assets - Expected credit losses
FINANCIAL REPORT | Consolidated statements • Statement • Independent auditor’s report • Notes • Definitions
(in million EUR) 31.03.23(1) 31.03.22 Loans to customers 4,9 4,7 Loans to associates 1,0 12,7 Loans to joint ventures 2,9 1,9 Guarantees granted 7,6 7,4 Lease receivables 20,4 17,1 Other receivables 1,5 2,2 Total other non-current receivables 38,3 46,0
262
19.2. Current trade and other current receivables
within 1 year
(1) In financial year 2022/23, EUR 43,1 million was reclassified as assets from discontinued operations. See note 16 for more information on the assets from discontinued operations.
Trade receivables
Trade receivables are presented net of impairments. These impairments amount to EUR 11,7 million at 31 March 2023 (compared to EUR 15,6 million at 31 March 2022). Trade receivables also include accrued compensations from suppliers.
The simplified approach always applies to trade receivables, see also note 1.5.E
- Financial Assets - Expected Credit Losses
Colruyt Group classifies debtors and the related receivables in different categories based on common risk characteristics and the age of outstanding receivables. For all still due receivables, Colruyt Group applies a percentage between 0,0% and 0,5% (dependent on the category), while for receivables less than six months overdue, Colruyt Group applies percentages between 1% and 5%, dependent on the category. For receivables older than six months, Colruyt Group applies a percentage of 25% to 100%, again dependent on the category.
For the wholesale segment, bank guarantees were received for EUR 22,2 million as well as credit insurance. These credit insurance policies cover 4,8% of the gross value of outstanding trade receivables (as at 31 March 2022, it was 2,8%).
Other receivables
‘Other receivables’ consist mainly of claims for damages and miscellaneous advances. Other receivables are presented net of impairments. These impairments amount to EUR 0,5 million at 31 March 2023 (compared to EUR 0,8 million at 31 March 2022).
To calculate the impairments, the general approach under IFRS 9 was used, whereby assets are assessed on an individual basis, with any impairments recorded on the basis of expected credit losses. This methodology is in line with the provisions for other non-current receivables, as listed in Section 19.1 ‘Other non-current receivables’. Guarantees were received for the total outstanding lease receivables (current and non-current) for a total of EUR 16,0 million.
The guarantees received exceed the expected credit losses.
263 FINANCIAL REPORT | Consolidated statements • Statement • Independent auditor’s report • Notes • Definitions
(in million EUR) 31.03.23(1) 31.03.22 Retail 401,7 432,6 Wholesale and Foodservice 115,2 94,1 Other activities 17,8 75,8 Total trade receivables 534,7 602,5 VAT 16,2 12,7 Prepaid expenses 39,6 36,9 Loans granted to customers that expire
1,1 1,2 Interest 0,6 3,4 Lease receivables 5,0 4,3 Other receivables 35,3 22,9 Total other current receivables 97,8 81,4
The ageing of trade receivables is as follows:
The movement in impairments on trade and other receivables is as follows:
(1) See note 16 for more information on assets from discontinued operations.
More information on how trade and other receivables are monitored can be found under note 27.1.c. Credit risk
20. Cash and cash equivalents
(1) Cash at banks and cash equivalents also include term deposits of EUR 176,2 million (EUR 10,1 million in financial year 2021/22) and cash in transit of EUR 42,7 million (EUR 39,1 million in financial year 2021/22).
Term deposits are convertible into cash within a period of less than 3 months.
Cash intended for reinsurance activities amounts to EUR 6,3 million in financial year 2022/23 (EUR 11,9 million in financial year 2021/22).
FINANCIAL REPORT | Consolidated statements • Statement • Independent auditor’s report • Notes • Definitions
31.03.23 31.03.22 Gross Impairment Gross Impairment Not past due 490,1 (0,2) 566,7Past due between 1 and 6 months 41,2 (0,9) 30,7 (0,7) Past due for more than 6 months 15,1 (10,6) 20,7 (14,9) Total 546,4 (11,7) 618,1 (15,6)
(in million EUR)
(in million
Impairment trade receivables Impairment other receivables 2022/23 2021/22 2022/23 2021/22 At 1 April (15,6) (17,6) (0,8) (0,7) Addition (14,3) (18,3) (0,1) (0,1) Reversal 12,7 18,7 0,2Use 4,5 1,6 0,2Reclassification to assets from discontinued operations(1) 1,0 - -At 31 March (11,7) (15,6) (0,5) (0,8)
EUR)
million EUR) 31.03.23 31.03.22 Cash at banks and cash equivalents(1) 347,9 167,5 Cash on hand 10,7 8,7 Cash and cash equivalents 358,6 176,2 Bank overdrafts 8,4 0,2 Total liabilities 8,4 0,2 Net cash and cash equivalents 350,2 176,0
(in
264
21.1. Capital management
Colruyt Group’s aim in managing its equity is to maintain a healthy financial structure with a minimal dependency on external financing as well as to create shareholder’s value. The Board of Directors aims to allow the dividend per share to evolve in proportion to the group profit on an annual basis. The pay-out ratio for this financial year is 51,0%(1). According to the bylaws, at least 90% of the distributable profits are reserved for shareholders and a maximum of 10% can be reserved for the directors. Furthermore, Colruyt Group seeks to increase shareholders’ value by purchasing treasury shares. The Board of Directors was authorised by the Extraordinary General Meeting of 10 October 2019 to acquire up to 27.610.418 of the company’s treasury shares. This authorisation is valid for a period of five years. As employee commitment to the group’s growth is also one of Colruyt Group’s priorities, an annual capital increase reserved for employees has been organised since 1987.
(1) More details can be found under note 21.4 Dividends.
21.2. Share capital
As a result of the resolution of the Extraordinary General Meeting of 6 October 2022, the capital was increased by 238.500 shares on 19 December 2022; this corresponds to a capital contribution of EUR 5,4 million.
The Company’s share capital on 31 March 2023 amounted to EUR 370,2 million divided into 134.077.688 fully paid up ordinary shares without par value. All shares, except treasury shares, participate in the profits.
The Board of Directors is authorised to increase the share capital in one or more instalments by a total amount of EUR 357,0 million, within the limits of the authorised capital.
Capital increases undertaken under this authorisation may be by contribution in cash or kind, conversion of any reserves or issue of convertible bonds, and can be organised in any way compliant with legal prescriptions. The conditions of the capital increases undertaken under this authorisation, and the rights and obligations attached to the new shares, are determined by the Board of Directors, taking legal prescriptions into account.
This authorisation is valid for a period of three years starting from the day of the publication of the authorisation granted by the Extraordinary General Meeting of Shareholders in the Annexes to the Belgian Official Gazette. This authorisation can be extended once or multiple times, each time for a maximum period of five years, by means of a decision of the General Meeting of Shareholders, deliberating according to the guidelines that apply for changes in bylaws. The current authorisation will end in October 2024.
21.3. Treasury shares
Treasury shares are recognised at the cost of the treasury shares purchased. At 31 March 2023, Colruyt Group held 6.687.980 treasury shares; this represents 4,99% of the shares issued at the reporting date. During the financial year, 3.169.026 treasury shares were repurchased for an amount of EUR 94,8 million. We refer to the Corporate Governance section for more details on the purchase of treasury shares.
21.4. Dividends
On 9 June 2023, a gross dividend of EUR 101,6 million or EUR 0,80 per share was proposed by the Board of Directors. In the previous financial year the gross dividend amounted to EUR 139,9 million or EUR 1,10 per share. The gross dividend takes into account the number of treasury shares held on 9 June 2023. The dividend was not incorporated in the consolidated financial statements for the financial year 2022/23.
265 FINANCIAL REPORT | Consolidated statements • Statement • Independent auditor’s report • Notes • Definitions 21.
Equity
21.5. Shareholder structure
Based on the most recent transparency notification of 24 March 2023 and taking into account the companies’ treasury shares held by the company at 31 March 2023, the shareholder structure of Etn. Fr. Colruyt NV is as follows:
The remainder of the total shares issued (134.077.688 shares at 31 March 2023), i.e. 44.420.368 shares or 33,13%, are publicly held. We refer to the Corporate Governance section for more details.
22. Earnings per share
(1) As adjusted due to discontinued operations. See note 16 for more information on the restatement of comparative information.
FINANCIAL REPORT | Consolidated statements • Statement • Independent auditor’s report • Notes • Definitions
Shares Colruyt family and relatives 82.969.340 Etn. Fr. Colruyt NV (treasury shares)(1) 6.687.980 Total of parties acting in concert 89.657.320 (1) Situation at 31 March 2023.
2022/23 2021/22(1) Total operating activity Profit for the financial year (group share), including discontinued operations (EUR million) 200,6 287,3 Profit for the financial year (group share), excluding discontinued operations (EUR million) 179,7 277,3 Weighted average number of outstanding shares 127.967.641 132.677.085 Earnings per share – basic (in EUR) – including discontinued operations 1,57 2,16 Earnings per share – diluted (in EUR) – including discontinued operations 1,57 2,16 Earnings per share – basic (in EUR) – excluding discontinued operations 1,40 2,09 Earnings per share – diluted (in EUR) – excluding discontinued operations 1,40 2,09
Weighted average
of outstanding
2022/23 2021/22 Number of outstanding shares at 1 April 130.320.234 134.786.572 Effect of capital increase 66.913 53.733 Effect of shares purchased (2.419.506) (2.163.220) Weighted average number of outstanding shares at 31 March 127.967.641 132.677.085 266
number
shares
23. Provisions
To provide a better understanding of the provisions, the table in note 23 has been adjusted for both financial years. The ‘Other risks’ category in the annual report 2021/22 was split into ‘Ongoing disputes’ and ‘Other risks’.
The provision for environmental risks primarily relates to site remediation costs.
The other provisions consist mainly of provisions for vacant properties and reinsurance.
267 FINANCIAL REPORT | Consolidated statements • Statement • Independent auditor’s report • Notes • Definitions
(in million EUR) Environmental risks Ongoing disputes Other risks Total Non-current provisions 1,8 5,0 1,7 8,5 Current provisions - - 0,9 0,9 At 31 March 2023 1,8 5,0 2,6 9,4 At 1 April 2022 2,5 8,9 4,8 16,2 Addition 1,1 1,6 1,3 4,0 Use (1,8) (1,6) (2,9) (6,3) Reversal - (3,9) (0,6) (4,5) At 31 March 2023 1,8 5,0 2,6 9,4 Non-current provisions 2,5 8,9 4,0 15,4 Current provisions - - 0,8 0,8 At 31 March 2022 2,5 8,9 4,8 16,2 At 1 April 2021 3,1 12,7 11,2 27,0 Addition 1,1 3,0 1,4 5,5 Use (1,2) (3,1) (1,7) (6,0) Reversal (0,5) (3,7) (6,1) (10,3) At 31 March 2022 2,5 8,9 4,8 16,2
24. Non-current liabilities related to employee benefits
Colruyt Group offers various types of post-employment benefits. These include retirement benefit plans and other arrangements in respect of post-employment benefits. In accordance with IAS 19, ‘Employee Benefits’, the post-employment benefits are subdivided into either defined contribution plans or defined benefit plans.
24.1. Defined contribution plans with a legally guaranteed minimum return
In Belgium, the Law regarding supplementary pensions (‘WAP’) requires employers to guarantee a minimum return on defined contribution plans over the course of the career. For amounts until 31 December 2015, this minimum return was 3,25% on employer contributions and 3,75% on employee contributions. As a result of a law change in December 2015, the interest rate to be guaranteed is variable starting from 1 January 2016, based on a mechanism linked to the return of the Belgian OLO bond with a minimum of 1,75% and a maximum of 3,75%. Since 2016 the minimum return has been 1,75%. For more details on the actuarial assumption used, we refer to the summary of the main actuarial assumptions used in calculating the liabilities related to the defined contribution plans with a legally guaranteed minimum return.
Owing to these legal changes, and also to the fact that a clear position was taken by the regulatory instances during 2016, and given that reliable estimates can be made for these retirement benefit plans, the Belgian defined contribution plans have been considered as defined benefit plans since financial year 2016/17. They are measured in accordance with IAS 19 based on the ‘projected unit credit’ method.
The amount resulting from the group’s liabilities related to its defined contribution plans with a legally guaranteed minimum return, as recorded in the consolidated statement of financial position, is as follows:
FINANCIAL REPORT | Consolidated statements • Statement • Independent auditor’s report • Notes • Definitions
(in million EUR) 31.03.23 31.03.22 Defined contribution plans with a legally guaranteed minimum return 74,4 90,6 Benefits related to the ‘Unemployment regime with company supplement’ 6,4 8,8 Other post-employment benefits 7,1 7,8 Total 87,9 107,2
(in million EUR) 31.03.23 31.03.22 Present value of the gross obligation under the defined contribution plans with a legally guaranteed minimum return 278,8 283,2 Fair value of plan assets 204,4 192,6 Deficit/(surplus) of funded plans 74,4 90,6 Total liability for employee benefits, of which: Portion recognised as non-current liabilities 74,4 90,6 Portion recognised as non-current assets -268
The evolution in the present value of the gross obligation under the defined contribution plans with a legally guaranteed minimum return can be summarised as follows:
Experience adjustments also include the effects of wage index adjustments that occurred during the financial year. In financial year 2022/23, these were higher than expected.
Plan assets (EUR 204,4 million) are held with a third-party insurance company and consist of reserves accumulated by employer and employee contributions. They consist entirely of insured contracts with guaranteed returns.
The evolution of the fair value of the plan assets is as follows:
269 FINANCIAL REPORT | Consolidated statements • Statement • Independent auditor’s report • Notes • Definitions
(in million EUR) 2022/23 2021/22 At 1 April 283,2 294,4 Current service cost 16,4 17,9 Interest expense 5,2 2,8 Experience adjustments 17,5 2,5 Change of financial assumptions (35,5) (28,4) Benefit payments from plan assets (9,4) (7,2) Participant contributions 4,0 3,9 Expenses and taxes paid (2,6) (2,7) At 31 March 278,8 283,2
(in million EUR) 2022/23 2021/22 At 1 April 192,6 178,7 Employer contributions 19,5 19,6 Interest income 3,7 1,8 Return on plan assets (3,5) (1,6) Benefit payments from plan assets (9,4) (7,2) Participant contributions 4,1 3,9 Expenses and taxes paid (2,6) (2,6) At 31 March 204,4 192,6
In the next financial year, employer contributions of EUR 19,9 million are expected to be made to the defined contribution plans with a legally guaranteed minimum return.
The average term of the liabilities for defined contribution plans with a legally guaranteed minimum return is 16,03 years vs 16,82 years in the previous year.
The amounts relative to these defined contribution plans with a legally guaranteed minimum return that are recognised in the consolidated income statement and in the consolidated statement of comprehensive income can be summarised as follows:
The main actuarial assumptions that were used in the calculation of the liabilities related to the defined contribution plans with a legally guaranteed minimum return can be summarised as follows:
• discount rate: 3,75% vs 1,85% in previous financial year;
• price inflation: 2,20% vs 1,80% in previous financial year;
• salary inflation: 2,70% vs 2,30% in previous financial year.
• expected future minimum WAP return: 2,80% vs 1,75% in previous financial year.
Application of the formula for calculating the WAP return has consistently led to a rate below the minimum rate since 2016. Since January 2022, the 10-year OLO rate has increased from 0,29% to 3,00% at 31 March 2023. Based on OLO rates at longer maturities, the minimum legal yield is estimated at 2,80% at 31 March 2023.
Description of the main risks
Colruyt Group is exposed by its defined benefit plans to a number of risks, of which the most important ones are explained below:
Volatility of plan assets - investment risk
The retirement benefit liabilities are calculated using a discount rate determined by prime company returns. In the event the plan assets do not reach this level of return, the defined benefit liabilities on account of Colruyt Group may increase. Colruyt Group reduces the investment risk by investing in insurance contracts instead of equity instruments.
Interest risk
A decrease in returns will increase the retirement benefit liabilities; however this will be partly compensated by an increase in value of bonds held by the retirement benefit plans.
FINANCIAL REPORT | Consolidated statements • Statement • Independent auditor’s report • Notes • Definitions
(in million EUR) 31.03.23 31.03.22 Total service cost(1) 16,4 17,9 Net interest cost(2) 1,5 1,0 Components recorded in the income statement 17,9 18,9 Experience adjustments 17,5 2,5 Change of financial assumptions (35,5) (28,4) Return on plan assets 3,5 1,6 Components recorded in other comprehensive income (14,5) (24,3)
‘Employee benefit expenses’
income statement.
‘Net financial
income statement.
(1) Included under
in the consolidated
(2) Included under
result’ in the consolidated
270
Life expectancy
The retirement benefit liabilities mainly concern benefits that are provided to the participant during his or her lifetime. An increase in life expectancy will therefore lead to an increase in retirement benefit liabilities.
Salary expectancy
The fair value of retirement benefit liabilities is calculated based on the current and estimated future salary of the participants in the retirement benefit plans. As a result, an increase in salary of the participants in the retirement benefit plan will lead to an increase in the retirement benefit liabilities.
24.2. Benefits related to ‘Unemployment regime with company supplement’
(1) Included under ‘Employee benefit expenses’ in the consolidated income statement.
(2) Included under ‘Net financial result’ in the consolidated income statement.
(3) Included in the consolidated statement of comprehensive income.
The possibility to retire early, as it exists within Colruyt Group for employees of its Belgian entities, is based on the ‘Unemployment regime with company supplement’ applicable in Belgium. The accounting policies in respect of the liabilities and costs related to this system are included under note 1.5. Other significant accounting policies.
Colruyt Group regularly reviews the long-term assumptions in respect of these liabilities. For this financial year the following assumptions were used:
• discount rate: 3,75% vs 1,80% in previous financial year;
• salary inflation: 2,70% vs 2,30% in previous financial year.
The weighted average duration of the liability for benefits under the ‘Unemployment regime with company supplement’ is 13,86 years, as compared to 15,39 years in the previous year.
271 FINANCIAL REPORT | Consolidated statements • Statement • Independent auditor’s report • Notes • Definitions
2022/23 2021/22 At 1 April 8,8 9,2 Addition(1) 0,5 0,5 Use (0,5) (0,8) Net interest expense(2) 0,1 0,1 Experience adjustments(3) 0,1 0,7 Change of financial assumptions(3) (2,6) (0,9) At 31 March 6,4 8,8
(in million EUR)
24.3. Other post-employment benefits
(in million EUR)
Other post-employment benefits payable at retirement consist of long-service benefits (Belgian entities) and legal compensations (French and Indian entities).
For the long-service benefits (Belgian entities), Colruyt Group uses the following parameters:
• discount rate: 3,75% vs 1,80% in previous financial year;
• salary inflation: 2,70% vs 2,30% in previous financial year.
For the legally established benefits, the following parameters are used:
French entities:
• discount rate: 3,75% vs 1,90% in previous financial year;
• salary inflation: 2,00% (same as previous financial year).
Indian entities:
• discount rate: 7,40% vs 6,90% in previous financial year;
• salary inflation: 10,00% (same as previous financial year).
FINANCIAL REPORT | Consolidated statements • Statement • Independent auditor’s report • Notes • Definitions
2022/23 2021/22 At 1 April 7,8 9,5 Addition(1) 0,8 1,0 Use (0,6) (0,6) Net interest expense(2) 0,1 0,2 Experience adjustments(3) 0,3 (0,3) Change of financial assumptions(3) (1,3) (0,6) Change of demographic assumptions(3) - (1,4) At 31 March 7,1 7,8
(1) Included under ‘Employee benefit expenses’ in the consolidated income statement.
(2) Included under ‘Net financial result’ in the consolidated income statement.
(3) Included in the consolidated statement of comprehensive income.
272
Changes to the main assumptions impact the group’s main employee benefits-related liabilities as follows:
The above are purely hypothetical changes in individual assumptions, keeping all other assumptions unchanged: economic factors and their changes will often impact more than one assumption at a time and the impact of changes in assumptions is not linear. As a result, the information above does not necessarily provide a reasonable reflection of future results.
25. Interest-bearing liabilities
25.1. Terms and repayment schedule
(1) As adjusted due to discontinued operations. See note 16 for more information on liabilities from discontinued operations.
Interest-bearing liabilities consist mainly of lease liabilities, bank borrowings and the fixed-rate green retail bond. The increase compared to the previous reporting period is due to withdrawals under short- and long-term financing arrangements as well as the issuance of a green retail bond that was successfully completed in February 2023, raising the maximum amount of EUR 250 million. Repayment of the green retail bond is scheduled for February 2028. Interest coupons worth EUR 10,6 million are due annually.
273 FINANCIAL REPORT | Consolidated statements • Statement • Independent auditor’s report • Notes • Definitions
(in million EUR) Defined contribution plans with a legally guaranteed minimum return Benefits related to the ‘Unemployment regime with company supplement’ Long-service benefits (Belgian entities) Legally established benefits (French and Indian entities) 31.03.23 31.03.22 31.03.23 31.03.22 31.03.23 31.03.22 31.03.23 31.03.22 Base scenario 74,4 90,6 6,4 8,8 3,2 3,9 3,9 3,9 Discount rate + 0,5% 65,4 72,3 6,0 8,2 3,0 3,7 3,8 3,5 Discount rate - 0,5% 89,2 111,3 6,8 9,5 3,4 4,2 4,0 4,1 Salary inflation + 0,5% 82,3 98,9 7,2 9,6 3,4 4,2 4,2 4,1 Salary inflation - 0,5% 66,6 83,0 5,9 7,9 3,0 3,7 3,6 3,5
(in million EUR) < 1 year 1-5 years > 5 years Total Lease and similar liabilities 60,5 180,2 87,7 328,4 Bank borrowings 410,5 295,0 55,8 761,3 Fixed-rate green retail bond - 251,1 - 251,1 Other 0,1 5,8 - 5,9 Total at 31 March 2023(1) 471,1 732,1 143,5 1.346,7 Lease and similar liabilities 50,9 151,1 82,0 284,0 Bank borrowings 298,3 378,8 1,0 678,1 Other 0,6 6,0 - 6,6 Total at 31 March 2022 349,8 535,9 83,0 968,7
25.2. Repayment schedule lease liabilities
(1) As adjusted due to discontinued operations. See note 16 for more information on liabilities from discontinued operations.
25.3. Repayment schedule bank borrowings and others
(1) As adjusted due to discontinued operations. See note 16 for more information on liabilities from discontinued operations.
Part of the outstanding balance of non-current and current interest-bearing liabilities is covered by collateral provided, mainly at The Fashion Society.
FINANCIAL REPORT | Consolidated statements • Statement • Independent auditor’s report • Notes • Definitions
(in million EUR) 31.03.23(1) 31.03.22 < 1 year 63,8 53,4 1-5 years 188,5 158,0 > 5 years 91,8 85,8 Total non-discounted lease payments 344,1 297,2
(in million EUR) Total Interest Principal Total Interest Principal 31.03.23(1) 31.03.23 31.03.23 31.03.22 31.03.22 31.03.22 < 1 year 416,7 6,1 410,6 301,1 2,2 298,9 1-5 years 314,8 14,0 300,8 389,0 4,2 384,8 > 5 years 59,6 3,8 55,8 1,0 - 1,0 Total 791,1 23,9 767,2 691,1 6,4 684,7
274
25.4. Changes in liabilities arising from financing activities
(1) Changes in lease portfolio include both new leases and terminations.
(2) For lease liabilities and similar liabilities, this includes the effect of renewing existing leases and revaluing leases due to indexations, as well as reclassifications to liabilities from discontinued operations.
(1) Changes in lease portfolio include both new leases and terminations.
(2) For lease liabilities and similar liabilities, this includes the effect of renewing existing leases and revaluing leases due to indexations.
275 FINANCIAL REPORT | Consolidated statements • Statement • Independent auditor’s report • Notes • Definitions
(in million EUR) 31.03.22 Cash flow Changes in lease portfolio(1) Business combinations Reclassification Other(2) 31.03.23 Lease liabilities and similar liabilities 284,0 (58,8) 55,0 2,0 - 46,2 328,4 Current 50,9 (58,8) 3,4 0,5 55,4 9,1 60,5 Non-current 233,1 - 51,6 1,5 (55,4) 37,1 267,9 Bank borrowings 678,1 70,8 - 12,4 - - 761,3 Current 298,3 (1,9) - 1,9 112,2 - 410,5 Non-current 379,8 72,7 - 10,5 (112,2) - 350,8 Fixed-rate green retail bond - 250,0 - - - 1,1 251,1 Non-current - 250,0 - - - 1,1 251,1 Other 6,6 (9,6) - 8,3 - 0,6 5,9 Total 968,7 252,4 55,0 22,7 - 47,9 1.346,7
(in million EUR) 31.03.21 Cash flow Changes in lease portfolio(1) Business combinations Reclassification Other(2) 31.03.22 Lease liabilities and similar liabilities 242,8 (51,2) 43,7 29,6 - 19,1 284,0 Current 41,2 (51,2) 3,7 5,7 46,1 5,4 50,9 Non-current 201,6 - 40,0 23,9 (46,1) 13,7 233,1 Bank borrowings 221,1 441,0 - 22,0 (6,0) - 678,1 Current 189,3 (7,4) - 18,7 97,7 - 298,3 Non-current 31,8 448,4 - 3,3 (103,7) - 379,8 Other - (1,0) - 1,6 6,0 - 6,6 Total 463,9 388,8 43,7 53,2 - 19,1 968,7
26. Trade payables, liabilities related to employee benefits and other liabilities
(1) As adjusted due to discontinued operations. See note 16 for more information on liabilities from discontinued operations.
FINANCIAL REPORT | Consolidated statements • Statement • Independent auditor’s report • Notes • Definitions
(in million EUR) 31.03.23(1) 31.03.22 Trade payables (non-current) 1,7 1,7 Total trade payables (non-current) 1,7 1,7 Other liabilities (non-current) 3,7 30,0 Total other liabilities (non-current) 3,7 30,0 Trade payables 1.267,4 1.252,7 Guarantees received and advances on work in progress 28,4 30,8 Total trade payables (current) 1.295,8 1.283,5 Current liabilities related to employee benefits 568,3 547,8 VAT, excise duties and other operating taxes 59,1 51,5 Dividends 0,6 0,5 Deferred income and accrued costs 19,0 11,1 Derivative financial instruments – cash flow hedging instruments 0,2 0,2 Other 40,6 16,3 Total liabilities related to employee benefits and other liabilities (current) 687,8 627,4
Terms and repayment schedule (in million EUR) < 1 year 1-5 years > 5 years Total Trade payables (non-current) - 1,7 - 1,7 Other liabilities (non-current) - 3,7 - 3,7 Trade payables (current) 1.295,8 - - 1.295,8 Liabilities related to employee benefits and other liabilities (current) 687,8 - - 687,8 Total at 31 March 2023 1.983,6 5,4 - 1.989,0 Trade payables (non-current) - 0,6 1,1 1,7 Other liabilities (non-current) - 30,0 - 30,0 Trade payables (current) 1.283,5 - - 1.283,5 Liabilities related to employee benefits and other liabilities (current) 627,4 - - 627,4 Total at 31 March 2022 1.910,9 30,6 1,1 1.942,6 276
27. Risk management
27.1. Risks related to financial instruments
A. Currency risk
Colruyt Group’s operational entities are mainly located in the euro zone, except for its activities in India, Hong Kong and Africa.
The exchange rate risk incurred when consolidating revenues and costs of subsidiaries not reporting in euro is not hedged.
In addition, Colruyt Group incurs a transactional currency risk on purchases in foreign currency. Colruyt Group uses derivative financial instruments to hedge its exposure to this type of currency risk, with no speculative purposes.
Colruyt Group’s exposure to exchange rate fluctuations is based on the following positions in foreign currencies:
The net positions per currency are presented before intra-group eliminations. A positive amount implies that entities of Colruyt Group have a net receivable in the first currency. The second currency of the pair is the functional currency of the Colruyt Group entity concerned.
The impact of exchange rate changes compared to the euro is relatively limited.
B. Interest rate risk
Loans with maturities exceeding one year were always concluded with a fixed interest rate in order to limit interest rate risk.
At 31 March 2023 the total amount of bank and other borrowings as well as the fixed-rate green retail bond was EUR 1.018,3 million (long-term and short-term together) (EUR 684,7 million at 31 March 2022) or 16,6% of the balance sheet total and 291% of the net cash and cash equivalents. New long- and sort- term loans were taken out in 2022/23. Given that EUR 410,6 million of the bank and other loans matures within the year, a possible refinancing of these loans will incur higher interest rates, given the sharp rise in interest rates in recent months.
Colruyt Group’s lease liabilities total EUR 328,4 million in the current financial year, as against EUR 284,0 million in the previous
financial year. The lease liabilities are concluded under IFRS 16 with a fixed interest rate so that a change in the market interest rate cannot impact the future cash flows of Colruyt Group's current lease liabilities, nor the results to be realised.
A change in interest rates may have an effect on the consolidated income statement or on future cash flows of Colruyt Group.
C. Credit risk
Colruyt Group is subject to credit risk in its operating activities, its liquidity management and, to a limited extent, in other and other financial activities.
To limit the credit risk for its liquidity management (term deposits, cash and cash equivalents, and bank guarantees), Colruyt Group
ensures that its liquidities and transactions are spread over several financial institutions with good credit ratings. Colruyt Group proactively monitors the stability and associated credit rating of these financial institutions, adjusting its liquidity management strategy where necessary.
The credit risk in relation to trade receivables from its operational activities is limited since most of Colruyt Group’s customers pay cash. The main part of Colruyt Group’s receivables is linked with the retail and wholesale activity for which Colruyt Group uses the payment terms customary in the industry. The risks minimised by regularly monitoring the creditworthiness of debtors and limiting outstanding receivables through credit limits. Where necessary, Colruyt Group requests bank guarantees or covers credit risk through credit insurance. The credit risk is spread over a large number of debtors.
277 FINANCIAL REPORT | Consolidated statements • Statement • Independent auditor’s report • Notes • Definitions
(in million EUR) Net position 31.03.23 31.03.22 EUR/INR 4,4 0,9 USD/EUR 3,6 2,7 NZD/EUR 0,1 0,1 Total 8,1 3,7
The credit risk for other current and non-current receivables from its other and other financial activities is low for Colruyt Group due to the limited amount of outstanding amounts. These receivables consist mainly of loans to customers, associates and joint ventures or receivables arising from sublease agreements. The credit risk of the sublease receivables is further reduced by the bank guarantees received and the collateral on the leased building. The credit risk for loans to customers and associates is controlled through regular monitoring of the credit risk on an individual basis. To monitor the credit risk of loans to associates, Colruyt Group can rely on the additional information obtained as a related party.
Colruyt Group’s maximum credit risk is represented by defaulting counterparties, with a maximum exposure equal to the net carrying amount of these assets. For the net carrying amount of the various assets with credit risk, see 27.1.F – Financial assets and liabilities per category and per class. From certain customers, bank guarantees are received or credit insurance policies taken out with a view to securing the collectability of receivables and limiting the real credit risk at the level of trade receivables. However, these bank guarantees or credit insurance policies are not taken into account when assessing the creditworthiness of the parties involved, in line with the provisions under IFRS 9, ‘Financial Instruments’.
Colruyt Group considers a financial asset in default when internal or external information indicates that it is unlikely that the outstanding contractual amounts will be received in full, prior to observance of any credit protection.
Credit losses are recognised using a model based on ‘expected credit losses’ in line with IFRS 9, Financial Instruments’, taking into account the impact of changes in economic factors on expected losses. To calculate expected credit losses, Colruyt Group makes use of the simplified approach based on a provision matrix for trade receivables and of the general approach under which credit losses are determined at the level of the individual receivable. For receivables from associates or joint ventures, an assessment is made as to whether an expected credit loss should be recorded as part of an indication of impairment on the carrying amount of an equity pick-up. See also note 1.5.E – ‘Financial Assets: Expected credit losses’.
D. Liquidity risk
Finco NV and Finco France SARL, Colruyt Group’s financial coordinators, ensure that all entities of Colruyt Group have access to the financial resources they need and apply a cash pooling system, i.e. any excess in cash and cash equivalents within entities of the group is used for shortages in other entities of the group. Finco NV and Finco France SARL are also responsible for the investment of Colruyt Group’s cash and cash equivalents. Finco NV and Finco France SARL use cash projections to follow up on Colruyt Group’s liquidity.
In addition, Colruyt Group always strives to have sufficient credit lines and capital market instruments (including commercial paper) available as back-up to further minimise the Group's liquidity risk. As part of this, a committed revolving credit facility for EUR 530 million was concluded with a banking syndicate in September 2022. At 31 March 2023, EUR 150 million had been drawn on this credit facility. Colruyt Group also makes use of several other bilateral lines of credit. In addition, a green retail bond issue was successfully completed in February 2023, with the full maximum amount of EUR 250 million raised. The 4,25% green retail bond, ISIN BE0002920016, is listed on the regulated Euronext Brussels market.
E. Other market risks
Colruyt Group's current financial assets total EUR 31,3 million at 31 March 2023 (EUR 128,3 million at 31 March 2022). This decrease is mainly due to the convertible loan to Virya Energy NV (EUR 95,0 million) that was converted into shares in the course of the current financial year. Until the conversion date, this compound instrument was measured at fair value and included in the category ‘Financial assets at fair value through profit or loss’. Colruyt Group’s reinsurance company, Locré SA, manages a portfolio of securities (fixed-income securities and shares). This is held to cover the reinsurance risk and includes EUR 26.5 million financial current assets (EUR 25.2 million at 31 March 2022).
Fluctuations in market values and other market parameters of these instruments can therefore have an impact on Colruyt Group’s financial result. A total net write-down of EUR -0,7 million (previous reporting period a net upward revaluation of EUR 8,1 million) was recorded for the current financial year, of which a net write-down was realised through the profit or loss of EUR -0,4 million and an unrealised result of EUR -0,3 million.
The ratio of the current investment portfolio to net cash and cash equivalents of Colruyt Group amounts to 8,7% (72,9% for the previous reporting period).
F. Financial assets and liabilities per category and per class
In accordance with IFRS 7, ‘Financial Instruments: Disclosures’ and IFRS 13, ‘Fair Value Measurement’, financial instruments measured at fair value are classified using a fair value hierarchy.
FINANCIAL REPORT | Consolidated statements • Statement • Independent auditor’s report • Notes • Definitions
278
(in million EUR)
Financial assets at fair value through other comprehensive income
Measurement at fair value
Financial liabilities at fair value through other comprehensive
Financial liabilities (excluding lease liabilities) at amortised cost
(1) The carrying amounts of non-current bank borrowings and other, and other non-current receivables are not materially different from their fair values.
(2) The carrying amounts of current financial assets and liabilities measured at amortised cost is estimated to reasonably approximate their fair value due to their short maturity.
(3) Fair value disclosures are not required in respect of lease liabilities at amortised cost.
279 FINANCIAL REPORT | Consolidated statements • Statement • Independent auditor’s report • Notes • Definitions
Quoted prices Level 1 Observable market prices Level 2 Non-observable market prices Level 3 Carrying amount
Equity investments - - 10,8 10,8 Cash flow hedging instruments - 0,1 - 0,1 Financial assets at fair value through profit or loss Equity investments 9,1 - 0,3 9,4 Fixed-income securities 17,3 - - 17,3 Financial assets at amortised cost Non-current assets Other non-current receivables(1) - 38,3 - 38,3 Current assets(2) Term deposits - - - 4,5 Trade and other receivables - - - 632,5 Cash and cash equivalents - - - 358,6 Total financial assets as of 31 March 2023 26,4 38,3 11,1 1.071,5
income Cash flow hedging instruments - 0,2 - 0,2
Non-current liabilities Fixed-rate green retail bond 252,7 - - 251,1 Bank borrowings and other(1) - 361,9 - 361,9 Current liabilities(2) Bank borrowings, bank overdrafts and other - - - 447,0 Trade payables - - - 1.295,8 Lease liabilities at amortised cost(3) - - - 328,4 Total financial liabilities at 31 March 2023 252,7 362,1 - 2.684,4
(in million EUR)
Financial assets at fair value through other comprehensive income
assets at fair value through profit or loss
Measurement at fair value
at fair value through other comprehensive
Financial liabilities (excluding lease liabilities) at amortised cost
(1) The carrying amounts of current financial assets and liabilities measured at amortised cost are estimated to reasonably approximate their fair value due to their short maturity.
(2) The carrying amounts of non-current bank borrowings and other, and other non-current receivables are not materially different from their fair values.
(3) Fair value disclosures are not required in respect of lease liabilities at amortised cost.
FINANCIAL REPORT | Consolidated statements • Statement • Independent auditor’s report • Notes • Definitions
Quoted prices Level 1 Observable market prices Level 2 Non-observable market prices Level 3 Carrying amount
Equity investments - - 14,7 14,7 Cash flow hedging instruments - 0,3 - 0,3 Financial
Equity investments 9,3 - - 9,3 Fixed-income securities 15,9 - - 15,9 Compound instruments - - 95,0 95,0 Financial assets at amortised cost Non-current assets Other non-current receivables - 46,0 - 46,0 Current assets(1) Term deposits - - - 7,8 Trade and other receivables - - - 683,9 Cash and cash equivalents - - - 176,2 Total financial assets at 31 March 2022 25,2 46,3 109,7 1.049,1 Financial liabilities
income Cash flow hedging instruments - 0,2 - 0,2
Non-current liabilities Bank loans and other(2) - 417,6 - 417,6 Current liabilities(1) Bank borrowings, bank overdrafts and other - - - 309,1 Trade payables - - - 1.283,4 Lease liabilities at amortised cost(3) - - - 284,0 Total financial liabilities at 31 March 2022 - 417,8 - 2.294,4
280
The fair value hierarchy is based on the inputs used to measure financial assets and liabilities at measurement date. The following three levels are distinguished:
• Level 1: inputs used for measurement of fair value are officially quoted (unadjusted) prices for identical assets or liabilities in an active market.
• Level 2: the fair value of financial instruments not traded on an active market is determined using valuation techniques. These techniques use inputs of observable market prices, if available, as much as possible and avoid reliance on entity-specific estimations.
• Level 3: financial instruments for which the fair value is determined with valuation techniques using certain parameters not based on observable market data.
For the amounts recognised at ‘Amortised cost’ we can conclude that the carrying amount equals the fair value in most cases due to the nature of the instrument or due to the shortterm character. Those cases whereby the amortised cost deviates from the fair value are not material. For the amounts measured at fair value we refer to note 14. Financial assets, which describes how the fair value is measured.
On 12 June 2020, Colruyt Group subscribed to a first tranche of convertible bonds with a 24-month maturity, issued by the associate Virya Energy NV in an amount of EUR 63,9 million. On 15 January 2021, this amount was increased to EUR 97,4 million with the subscription of a second tranche of convertible bonds with the same maturity date as the first tranche (12 June 2022). In early June 2022, all convertible bonds were converted by Colruyt Group into shares of Virya Energy NV, increasing the stake in Virya Energy NV from 59,78% to 59,94%. Consequently, the carrying amount of the associate Virya Energy NV on Colruyt Group's balance sheet increased by EUR 95,0 million. Until the conversion date, this compound instrument was measured at fair value and included in the category Financial assets at fair value through profit or loss’.
The financial assets classified under level 3 include, amongst others, the investments in the holding company Sofindev IV NV, in the investment funds Good Harvest Belgium I SRL and Blue Horizon Ventures I SCSp RAIF and in North Sea Wind CV, a cooperative in which Colruyt Group has no significant influence. The opening and closing balance of the investments classified under level 3 can be reconciled as follows:
281 FINANCIAL REPORT | Consolidated statements • Statement • Independent auditor’s report • Notes • Definitions
(in million EUR) 2022/23 2021/22 At 1 April 109,7 111,6 Acquisitions 0,3 0,9 Capital increases 0,2 0,9 Capital decreases - (2,3) Fair value adjustments through other comprehensive income (4,1) (1,1) Other (95,0) (0,3) At 31 March 11,1 109,7
27.2. Other risks
A. Financial consequences of the macroeconomic environment
Colruyt Group is affected by the macroeconomic consequences of the war in Ukraine and the disrupted supply chain, with (in)direct consequences for the financial statements:
• High and volatile energy costs impacting normal operating activities and logistics costs, but also increasing revenues from the supply of energy through DATS 24 NV (accounted for using the equity method as of June 2023);
• Higher revenue and increased labour costs, operating costs and cost of goods sold due to rising inflation;
• Rising interest rates affecting the discount rates for the impairment test and the non-current liabilities related to employee benefit expenses. In view of the current interest rate environment, there is a risk that short-term loans are refinanced at higher interest rates.
Colruyt Group continues to closely monitor and assess the macroeconomic consequences and the operational and supply chain aspects and, where possible, taken appropriate measures to limit the impact of these events and the (in)direct consequences. Colruyt Group examines on a case-by-case basis whether it is appropriate to hedge its exposure to the interest rate risk on existing (or future) loans. This can be done either by taking out longer-term loans with a fixed interest rate or by entering into a financial derivative instrument.
B. Financial impact of the Ukraine war
Colruyt Group has no direct operations in Russia or Ukraine. Apart from the financial consequences mentioned above, the conflict has no impact on Colruyt Group's financial statements.
C. Climate
When identifying and monitoring the risks impacting on the financial statements, Colruyt Group also takes into account the impact of potential operational risks arising from climaterelated events. In the medium term, we assume that there will be no material financial impact on Colruyt Group's activities. There is a reasonable chance of an impact from flooding and heavy rainfall on some of our individual assets. These buildings have been identified and appropriate measures are being taken to minimise the likelihood and impact. For other climate-related events, a recent study involving scenarios until 2050 confirms that the impact would not be material. For those buildings that would have a critical impact on the process across all business operations, the necessary business continuity plans have been developed; these are also tested on a regular basis, thus also limiting the impact on Colruyt Group’s overall business process.
D. Other
Colruyt Group is further exposed to various other risks that are not necessarily financial in nature, but nevertheless have the potential to impact Colruyt Group’s financial position. For a description of risks other than the ones mentioned above and of how Colruyt Group manages its exposure to these risks, we refer to the Corporate Governance section. In this respect, we also refer to the Audit Committee, which regularly discusses the risk reports of the Risk Management department (internal audit).
FINANCIAL REPORT | Consolidated statements • Statement • Independent auditor’s report • Notes • Definitions
282
28. Off-balance sheet rights and commitments
Colruyt Group has a number of commitments which are not recognised in the statement of financial position. These are mainly contractual obligations related to future acquisitions of property, plant and equipment and future purchases of goods and services.
The amounts due in respect of these commitments are as follows:
The off-balance sheet commitments for lease arrangements in a lessee capacity amount to EUR 3,5 million (EUR 3,4 million at 31 March 2022) and relate to short-term leases or leases of low-value assets. In addition, these off-balance sheet commitments also contain arrangements that do not meet the definition of a lease.
The income statement includes rental and rental-related charges in respect of movables totalling EUR 24,6 million (EUR 18,5 million for the previous reporting period). These rental charges mainly result from cancellable lease arrangements that do not meet the definition of a lease.
The commitments relating to the acquisition of property, plant and equipment totalling EUR 115,7 million (EUR 108,0 million in the previous reporting period) consist mainly of contractual commitments for the acquisition of land and buildings.
The commitments relating to purchases of goods for an amount of EUR 253,6 million (EUR 171,7 million in the previous reporting period) are the result of forward contracts concluded with suppliers in order for Colruyt Group to ensure the sufficient supply of certain trade goods, clothing collections and raw materials for production. This includes purchase commitments related to electricity from discontinued operations (EUR 56,6 million).
The line ‘Other commitments’ mainly relates to commitments arising from various non-cancellable forward contracts regarding ICT services (mainly for software maintenance and development) for an amount of EUR 36,6 million (EUR 33,7 million in the previous reporting period).
In addition to these commitments Colruyt Group also has certain rights which are not recognised in the statement of financial position. Occasionally Colruyt Group leases out certain immovable assets under lease arrangements.
283 FINANCIAL REPORT | Consolidated statements • Statement • Independent auditor’s report • Notes • Definitions
(in million EUR) 31.03.23 < 1 year 1-5 years > 5 years Lease arrangements as lessee(1) 3,5 1,4 2,1Commitments relating to the acquisition of property, plant and equipment 115,7 103,0 12,7Commitments relating to purchases of goods 253,6 234,1 19,5Other commitments 39,5 24,7 14,8(in million EUR) 31.03.22 < 1 year 1-5 years > 5 years Lease arrangements as lessee(1) 3,4 1,5 1,9Commitments relating to the acquisition of property, plant and equipment 108,0 101,6 6,4Commitments relating to purchases of goods 171,7 161,2 10,5Other commitments 36,7 18,0 18,7 -
(1) Leases outside the scope of IFRS 16.
The amounts to be received in relation to these rights are to be classified as follows:
The off-balance sheet commitments for lease arrangements amount to EUR 16,0 million (EUR 14,7 million as per 31 March 2022) and mainly relate to operating lease arrangements as lessor in respect of subleased assets.
The rights resulting from non-cancellable agreements in respect of movables are not material.
29. Contingent liabilities and contingent assets
Contingent liabilities and contingent assets are all those items in relation to third parties which are not recognised in the statement of financial position, in accordance with IAS 37, ‘Provisions, Contingent Liabilities and Contingent Assets’.
The table below gives an overview of all contingent liabilities of Colruyt Group.
At the reporting date there were a limited number of legal actions outstanding against Colruyt Group which, although disputed, constitute a contingent liability of EUR 3,8 million (compared to EUR 7,1 million in the previous reporting period). The pending cases primarily concern commercial law claims. As was the case last year, there are no contingent liabilities for pending cases in respect of taxation law, common law or social law.
‘Other’ contingent liabilities represent guarantees provided by Colruyt Group towards financial institutions. These guarantees consist of buyback commitments supplied as an additional guarantee for the financing of affiliated independent storekeepers for an amount of EUR 0,1 million (compared to EUR 0,6 million in the previous reporting period).
When acquiring interests and determining goodwill, a conditional variable compensation is applied, with the most accurate estimate possible of the amount to be finally calculated at the end of the valuation period.
Colruyt Group expects no significant financial disadvantages to be derived from these liabilities. There are no material contingent assets to be reported.
FINANCIAL REPORT | Consolidated statements • Statement • Independent auditor’s report • Notes • Definitions
(in million EUR) 31.03.23 < 1 year 1-5 years > 5 years Lease arrangements as lessor 16,0 9,3 6,7(in million EUR) 31.03.22 < 1 year 1-5 years > 5 years Lease arrangements as lessor 14,7 8,1 6,6 -
(in million EUR) 31.03.23 31.03.22 Disputes 3,8 7,1 Other 0,1 0,6
284
30. Dividends paid and proposed
On 4 October 2022 a gross dividend of EUR 1,10 per share was paid to the shareholders.
For the financial year 2022/23, the Board of Directors has proposed a gross dividend of EUR 0,80 per share, which will be declared payable from 3 October 2023. As the decision to distribute a dividend is to be considered an event after reporting date which is not to be included in the statement of financial position, this dividend, which is still to be approved at the Annual General Meeting of Shareholders of 27 September 2023, is therefore not recorded as a liability in the statement of financial position.
Taking into account that the distribution proposed by the Board of Directors relates to 126.991.787 shares (after deduction of treasury shares), as determined on 9 June 2023, the total amount of proposed dividends is EUR 101,6 million.
31. Related parties
An overview of related party transactions is given below. In this note, only the transactions which were not eliminated in the consolidated financial statements are presented. Colruyt Group identifies, in accordance with IAS 24, Related Party Disclosures’, different categories of related parties:
a) key managers of Colruyt Group and relatives. Key management is formed by the members of the Board of Directors and the Management Committee (see Corporate Governance section);
b) entities that control Colruyt Group: Korys NV controlled by Stichting Administratiekantoor Cozin (see Corporate Governance section);
c) associates (see note 12. Investments in associates);
d) joint ventures (see note 13. Investments in joint ventures); and
e) entities controlled by persons belonging to the key management of Colruyt Group. Last year, Colruyt Group had no material transactions with these entities. There were however transactions with Smartmat NV, now an associate.
285 FINANCIAL REPORT | Consolidated statements • Statement • Independent auditor’s report • Notes • Definitions
31.1. Related party transactions excluding key management personnel compensation
The amounts disclosed above result from transactions made on terms equivalent to those that prevail in arm’s length transactions between independent parties.
Transactions with various related parties generated revenue for an amount of EUR 4,0 million (EUR 9,2 million in the previous reporting period).
Colruyt Group and Korys took the requisite measures in the context of the conflict of interest rules. We refer to the Corporate Governance section for more details.
The costs arising from transactions with various related parties amount to EUR 21,8 million and mainly relate to the purchase of energy-related products (EUR 14,3 million).
Outstanding receivables from related parties decreased from EUR 115,1 million to EUR 8,9 million due to the termination of compound instruments with an associate.
FINANCIAL REPORT | Consolidated statements • Statement • Independent auditor’s report • Notes • Definitions
(in million EUR) 2022/23 2021/22 Revenue 4,0 9,2 Associates 3,4 9,1 Joint ventures 0,6 0,1 Costs 21,8 18,1 Key managers of Colruyt Group and relatives 0,2 0,3 Associates 17,1 12,0 Joint ventures 4,5 3,6 Entities controlled by persons belonging to the key management of Colruyt Group - 2,2 Receivables 8,9 115,1 Entities that control Colruyt Group 0,1Associates 5,1 113,2 Joint ventures 3,7 1,9 Liabilities 4,9 0,9 Key managers of Colruyt Group and relatives 0,1 0,1 Entities that control Colruyt Group 0,1 0,1 Associates 3,9 0,4 Joint ventures 0,8 0,2 Entities controlled by persons belonging
- 0,1 Dividends paid 89,7 116,1 Key managers of Colruyt Group and relatives 9,4 12,5 Entities that control Colruyt Group 80,3 103,6
to the key management of Colruyt Group
286
31.2. Key management personnel compensation
The compensation awarded to key management personnel is summarised below. All amounts are gross amounts before taxes. Social security contributions were paid on these amounts.
More information regarding the different components of compensation for key management personnel can be found in the remuneration report (see section Corporate Governance) as prepared by the Remuneration Committee.
32. Events after the reporting date
During an extraordinary works council held on 19 April 2023, Dreamland and Dreambaby announced their intention to restructure, to which the Procedure Renault applies. Dreamland and Dreambaby together employ about 1.100 employees. The intention to restructure affected 192 employees and also implied the closure of a limited number of stores (1 Dreamland store and 5 Dreambaby stores). The first stage (information and consultation stage) of the Procedure Renault was completed at the end of May. Subsequently, on 26 May 2023, the Board of Directors of Dreamland and Dreambaby decided to proceed with the collective dismissal of 151 employees in total. As a people-oriented employer, Colruyt Group will make maximum efforts to provide professional reorientation within the group to reduce the number of redundancies. In addition, on 19 April 2023, Colruyt Group reached a principle agreement with ToyChamp whereby ToyChamp would obtain 75% of the shares of Dreamland and thus gain control over Dreamland. Dreamland will continue to exist; as a brand, as a legal entity and as an employer. The current management of Dreamland remains on board. The principle agreement was recently developed further and converted into a final agreement. Completion of the transaction is expected in the third quarter of the financial year 2023/24 and will have a limited one-off effect on the net result of the financial year 2023/24 (still highly subject to further developments between the closing of the financial year, i.e. 31 March 2023, and the completion of the transaction).
In the current annual report relating to the financial year 2022/23, Dreamland is not presented as a discontinued operation with assets and related liabilities reclassified as held for sale as required by IFRS 5, Assets Held for Sale and Discontinued Operations’. As per 31 March 2023 important conditions have not been met, management states that the assets and liabilities to be held for sale are not yet available for immediate sale in their present condition. At closing of the transaction, Dreamland will no longer be fully consolidated in the consolidated figures of Colruyt Group. The group will in that case act in accordance with the applicable regulations and communicate on further developments.
287 FINANCIAL REPORT | Consolidated statements • Statement • Independent auditor’s report • Notes • Definitions
(in million EUR) Remuneration 2022/23 Number of persons/shares 2022/23 Remuneration 2021/22 Number of persons/shares 2021/22 Board of Directors 10 9 Fixed remuneration (directors’ fees) 1,0 0,9 Senior management 12 13 Fixed remuneration 4,5 4,1 Variable remuneration 1,9 2,8 Payments into defined contribution plans and other components 0,7 0,8
On 1 June 2023, Colruyt Group and Virya Energy NV reached an agreement to fully integrate DATS 24 NV into Virya Energy NV. The transaction is based on an enterprise value of EUR 56 million, plus a potential earn-out consideration of up to EUR 11 million. Following this transaction, Colruyt Group’s cash flow statement is expected to include a cash inflow of approximately the same order of magnitude (inter alia after settlement of intragroup positions and net of cash and cash equivalents disposed of, which in total are estimated at approximately EUR 25 million – based on preliminary figures per 31 March 2023). Furthermore, this transaction is expected to result in a limited one-off impact on the net result of the financial year 2023/24. Both are subject to the customary post-closing purchase price adjustments. Additionally, certain assets have been transferred from Colruyt Group for a total of EUR 6 million. Arm’s length principles were applied for the valuation.
As of June 2023, DATS 24 will no longer be fully consolidated by Colruyt Group, but by Virya Energy NV. This means that as of June 2023, the results of DATS 24 will be accounted for in Colruyt Group’s consolidated figures via Virya Energy NV using the equity method. The fuel distribution activities in France are inseparably connected to, and therefore an integral part of, the stores in France and are not included in this transaction. The necessary measures have been taken in view of the conflict of interest rules.
On 2 February 2023, Colruyt Group reached agreement to acquire 100% of the shares of Degrenne Distribution, owned by the Degrenne family. The acquisition is subject to the suspensive condition of approval by the French Competition Authority as well as by the French Ministry of Economy and Finance under the international investment law. The necessary approvals have been obtained and the transaction has been finalised at the beginning of July 2023. Degrenne Distribution will be fully consolidated in the course of financial year 2023/24. Both parties have agreed not to disclose any details regarding the price or any other terms of the transaction. Arm’s length principles were applied for the valuation. At the date of approval of the annual report, Colruyt Group did not yet have all the information to determine goodwill.
After period-end, 397.921 treasury shares were purchased for an amount of EUR 12,2 million. On 9 June 2023, Colruyt Group held 7.085.901 treasury shares, which represented 5,28% of the total number of shares issued.
There were no further significant events after the balance sheet date.
33. Independent auditor’s remuneration
The table below provides an overview of remuneration paid to the independent auditor and its associated parties for services rendered to Colruyt Group.
The consideration paid for audit services was EUR 1,2 million, of which EUR 0,3 million was recognised at the level of the Company and EUR 0,9 million was recognised at the level of its subsidiaries.
For non-audit services, such as other audit assignments, tax advice and other assignments, the costs are negligible.
FINANCIAL REPORT | Consolidated statements • Statement • Independent auditor’s report • Notes • Definitions
(in million EUR) 2022/23 2021/22 Audit assignments 1,2 1,0 Total 1,2 1,0
288
34. List of consolidated entities
34.1. Company
34.2. Subsidiaries
289 FINANCIAL REPORT | Consolidated statements • Statement • Independent auditor’s report • Notes • Definitions
Etn. Fr. Colruyt NV Edingensesteenweg 196 1500 Halle, Belgium 0400 378 485 -
AB Restauration BV Avenue du Levant 13 5030 Gembloux, Belgium 0475 405 017 100% Agripartners NV Edingensesteenweg 196 1500 Halle, Belgium 0716 663 417 100% Banden Deproost BV Zinkstraat 6 1500 Halle, Belgium 0424 880 586 100% Banketbakkerij Mariman NV Warandestraat 5 9240 Zele, Belgium 0874 422 336 100% Bavingsveld NV Edingensesteenweg 196 1500 Halle, Belgium 0441 486 194 100% Bio-Planet Luxembourg SA Rue F.W. Raiffeisen 5 2411 Luxembourg, Grand Duchy of Luxembourg B262737 100% Bio-Planet NV Victor Demesmaekerstraat 167 1500 Halle, Belgium 0472 405 143 100% Buurtwinkels OKay NV Victor Demesmaekerstraat 167 1500 Halle, Belgium 0464 994 145 100% Codevco II RDC SASU Av. Pierre Mulele 17, office 203, Infinity Center, Commune de Gombe Kinshasa, Democratic Republic of the Congo CD/KNG/ RCCM/21-B-01809 100% Codevco IV NV Edingensesteenweg 196 1500 Halle, Belgium 0716 663 615 100% Codevco IX BV Edingensesteenweg 196 1500 Halle, Belgium 0779 301 067 100% Codevco VII BV Edingensesteenweg 196 1500 Halle, Belgium 0760 300 252 100% Codevco VIII NV Edingensesteenweg 196 1500 Halle, Belgium 0760 300 846 100% Codevco X NV Edingensesteenweg 196 1500 Halle, Belgium 0779 300 572 100% Codevco XIII NV Edingensesteenweg 196 1500 Halle, Belgium 0779 443 696 100% Codevco XIV NV Edingensesteenweg 196 1500 Halle, Belgium 0795 538 570 100% Codevco XV NV Edingensesteenweg 196 1500 Halle, Belgium 0795 538 669 100% Codevco XVI NV Edingensesteenweg 196 1500 Halle, Belgium 0795 538 768 100% Codex BV Edingensesteenweg 196 1500 Halle, Belgium 0453 365 924 100% Codifrance SAS Zone Industrielle, Rue de Saint Barthélémy 66 45110 Châteauneuf-sur-Loire, France 824 116 099 100% Colim NV Edingensesteenweg 196 1500 Halle, Belgium 0400 374 725 100% Colimpo NV Edingensesteenweg 196 1500 Halle, Belgium 0685 762 581 100% Colimpo Private Limited Unit 08-09, 13th floor, New Mandarin Plaza, Tower A 14, Science Museum Road, Tsimshatsui East Kowloon, Hong Kong 59139630 000 11 18 0 100%
FINANCIAL REPORT | Consolidated statements • Statement • Independent auditor’s report • Notes • Definitions Colruyt Afrique SAS Sacre Coeur III VDN, Villa numéro 10684, Boîte Postal 4579 Dakar, Senegal SN DKR 2020 B 13136 100% Colruyt Cash and Carry NV Edingensesteenweg 196 1500 Halle, Belgium 0716 663 318 100% Colruyt Gestion SA Rue F.W. Raiffeisen 5 2411 Luxembourg, Grand Duchy of Luxembourg B137485 100% Colruyt Group Services NV Edingensesteenweg 196 1500 Halle, Belgium 0880 364 278 100% Colruyt IT Consultancy India Private LTD Building N°21, Mindspace, Raheja IT Park, Survey nr 64 (Part) HITEC City Madhapur, Hyderabad, Telangana State, India - 500081 U72300TG2007 PTC053130 100% Colruyt Luxembourg SA Z.I. Um Woeller 6 4410 Sanem, Grand Duchy of Luxembourg B124296 100% Colruyt Retail France SAS Zone Industrielle, Rue des Entrepôts 4 39700 Rochefort-sur-Nenon, France 789 139 789 100% Comans NV Edingensesteenweg 196 1500 Halle, Belgium 0462 732 956 100% Comant NV Edingensesteenweg 196 1500 Halle, Belgium 0604 984 743 100% Combru NV Edingensesteenweg 196 1500 Halle, Belgium 0442 944 956 100% Comgen NV Edingensesteenweg 196 1500 Halle, Belgium 0404 020 638 100% Comgil NV Edingensesteenweg 196 1500 Halle, Belgium 0739 995 974 100% Comjan NV Edingensesteenweg 196 1500 Halle, Belgium 0783 195 915 100% Comkro NV Edingensesteenweg 196 1500 Halle, Belgium 0693 920 677 100% Comlie NV Edingensesteenweg 196 1500 Halle, Belgium 0560 926 056 100% Commol NV Edingensesteenweg 196 1500 Halle, Belgium 0684 490 495 100% Comnie NV Edingensesteenweg 196 1500 Halle, Belgium 0715 711 530 100% Comnik NV Edingensesteenweg 196 1500 Halle, Belgium 0741 814 626 100% Cycles IMP SRL Tramstraat 63 9052 Zwijnaarde, Belgium 0444.947.017 100% Darzana NV Edingensesteenweg 196 1500 Halle, Belgium 0779 443 795 100% DATS 24 NV Edingensesteenweg 196 1500 Halle, Belgium 0893 096 618 100% Davytrans NV Edingensesteenweg 196 1500 Halle, Belgium 0413 920 972 100% Do Invest Lux SA Rue de Beggen 233-241 1121 Luxembourg, Grand Duchy of Luxembourg B181441 100% Do Invest NV Edingensesteenweg 196 1500 Halle, Belgium 0817 092 663 100% Dreambaby NV Edingensesteenweg 196 1500 Halle, Belgium 0472 630 817 100% Dreamland NV Edingensesteenweg 196 1500 Halle, Belgium 0448 746 645 100% E-Logistics NV Edingensesteenweg 196 1500 Halle, Belgium 0830 292 878 100% Enco Retail NV Edingensesteenweg 196 1500 Halle, Belgium 0434 584 942 100% EW 738/740 BV Kerkstraat 13 2840 Rumst, Belgium 0505 738 994 100% FD Company 2 BV Edingensesteenweg 196 1500 Halle, Belgium 0770 767 542 100% Finco France SARL Zone Industrielle, Rue des Entrepôts 4 39700 Rochefort-sur-Nenon, France 848 012 209 100% Finco NV Edingensesteenweg 196 1500 Halle, Belgium 0429 127 109 100% Fleetco NV Edingensesteenweg 196 1500 Halle, Belgium 0423 051 939 100% Het Taartenhuis NV Warandestraat 5 9240 Zele, Belgium 0889 841 277 100% Het Zilverleen BV Izenbergestraat 175 8690 Alveringem, Belgium 0715 775 767 100% Heylen-Engels BV Morkhovenseweg 92 2200 Noorderwijk, Belgium 0428 695 359 100% Immo Colruyt France SAS Zone Industrielle, Rue des Entrepôts 4 39700 Rochefort-sur-Nenon, France 319 642 252 100% 290
291 FINANCIAL REPORT | Consolidated statements • Statement • Independent auditor’s report • Notes • Definitions Immo Colruyt Luxembourg SA Rue F.W. Raiffeisen 5 2411 Luxembourg, Grand Duchy of Luxembourg B195799 100% Immo De CE Floor BV Edingensesteenweg 196 1500 Halle, Belgium 0446 434 580 100% Immoco SARL Zone Industrielle, Rue des Entrepôts 4 39700 Rochefort-sur-Nenon, France 527 664 965 100% Izock BV Kerkstraat 132-134 1851 Humbeek, Belgium 0426 190 284 100% Jims NV Edingensesteenweg 196 1500 Halle, Belgium 0423 644 035 100% Jims Oost BV(1) Edingensesteenweg 196 1500 Halle, Belgium 0863 735 312 100% Joma Sport BV Tramstraat 63 9052 Zwijnaarde, Belgium 0823 778 933 100% Juliette BV Edingensesteenweg 196 1500 Halle, Belgium 0753 439 679 100% Locré SA Rue de Neudorf 534 2220 Luxembourg, Grand Duchy of Luxembourg B59147 100% Myreas BV Tramstraat 63 9052 Zwijnaarde, Belgium 0733 909 522 85% Newpharma Group NV(1)(2) Rue du Charbonnage 10, bus 2 4020 Liège, Belgium 0684 465 652 100% Northlandt NV Moortelstraat 9 9160 Lokeren, Belgium 0459 739 517 100% N'Situ Pelende SASU Av. Pierre Mulele 17, office 203, Infinity Center, Commune de Gombe Kinshasa, Democratic Republic of the Congo CD/KNG/ RCCM/21-B-01787 100% Okay Compact NV Edingensesteenweg 196 1500 Halle, Belgium 0820 198 247 100% Puur NV Edingensesteenweg 196 1500 Halle, Belgium 0544 328 861 100% Retail Partners Colruyt Group NV Edingensesteenweg 196 1500 Halle, Belgium 0413 970 957 100% Roecol NV Spieveldstraat 4 9160 Lokeren, Belgium 0849 963 488 100% Roelandt NV Warandestraat 5 9240 Zele, Belgium 0412 127 858 100% Saro BV Edingensesteenweg 196 1500 Halle, Belgium 0451 082 662 100% Smart Technics NV Edingensesteenweg 196 1500 Halle, Belgium 0716 663 516 100% SmartRetail BV Edingensesteenweg 196 1500 Halle, Belgium 0640 760 224 100% SmartWithFood BV Edingensesteenweg 196 1500 Halle, Belgium 0739 913 228 100% Société Agricole de Meester BV Albertlaan 210 1190 Vorst, Belgium 0429 662 290 100% Solucious NV Edingensesteenweg 196 1500 Halle, Belgium 0448 692 207 100% Sukhino NV Edingensesteenweg 196 1500 Halle, Belgium 0779 443 302 100% Supermarkt De Belie BV Edingensesteenweg 196 1500 Halle, Belgium 0433 756 581 100% Supermarkt Magda NV Edingensesteenweg 196 1500 Halle, Belgium 0422 180 523 100% Symeta Hybrid NV Interleuvenlaan 50 3001 Heverlee, Belgium 0867 583 935 100% The Fashion Society NV(2) Brusselsesteenweg 185 1785 Merchtem, Belgium 0553 548 910 100% Van der Veken BV Tramstraat 63 9052 Zwijnaarde, Belgium 0465 176 069 100% VDV-Lease BV Tramstraat 63 9052 Zwijnaarde, Belgium 0698 812 150 100% Vlevico NV Edingensesteenweg 196 1500 Halle, Belgium 0422 846 259 100% Walcodis SA Rue Du Parc Industriel 34 7822 Ath, Belgium 0829 176 784 100% Witeb 1 BV Edingensesteenweg 196 1500 Halle, Belgium 0697 694 571 100% Witeb 2 BV Edingensesteenweg 196 1500 Halle, Belgium 0699 852 426 100% Witeb 3 BV Edingensesteenweg 196 1500 Halle, Belgium 0726 754 187 100% Witeb 4 BV Edingensesteenweg 196 1500 Halle, Belgium 0747 601 566 100% Witeb 5 BV Edingensesteenweg 196 1500 Halle, Belgium 0761 776 335 100%
(1) These companies close their financial year on 31 December and are included in the consolidated financial statements as of that date
(2) These companies are in a sub-consolidation.
34.3. Joint ventures
(1) These companies close their financial year on 31 December and are included in the consolidated financial statements as of that date
34.4. Associates
(1) These companies close their financial year on 31 December and are included in the consolidated financial statements as of that date
(2) This company closes its financial year on 30 June and is included in the consolidated financial statements based on intermediate financial statements as of 31 March.
(3) This companies is in a sub-consolidation.
FINANCIAL REPORT | Consolidated statements • Statement • Independent auditor’s report • Notes • Definitions WV1 BV Guldensporenpark 100, blok K 9820 Merelbeke, Belgium 0627 969 585 100% WV2 BV Tramstraat 63 9052 Zwijnaarde, Belgium 0627 973 149 100% WV3 BV Tramstraat 63 9052 Zwijnaarde, Belgium 0477 728 760 100% Yaleli BV Tramstraat 63 9052 Zwijnaarde, Belgium 0672 981 941 100% Zeeboerderij Westdiep BV Edingensesteenweg 196 1500 Halle, Belgium 0739 918 869 80%
Achilles Design BV(1) Borchtstraat 30 2800 Mechelen, Belgium 0691 752 926 24,70% Daltix NV(1) Ottergemsesteenweg-Zuid 808, bus 160 9000 Ghent, Belgium 0661 713 511 78,76% Daltix Unipessoal LDA(1) Avenida Antonio Augusto De Aguiar 130 Piso 1 1050-020 Lisbon, Portugal 0514 607 769 78,76% De Leiding BV(1) Kerkstraat 108 9050 Gentbrugge, Belgium 0694 734 685 51,99% Digiteal NV(1) Rue Emile Francqui 6 1435 Mont-Saint-Guibert, Belgium 0630 675 588 26,84% Kriket BV(1) Brogniezstraat 172 BIO7 1070 Anderlecht, Belgium 0692 761 033 43,82% Pluginvest BV Plantin and Moretuslei 289 2140 Borgerhout, Belgium 0665 554 711 25,00% Some BV(1) Hooilaar 40 2230 Herselt, Belgium 0829 249 337 24,97% Ticom NV Bilkensveld 1, bus A 1500 Halle, Belgium 0820 813 505 90,00% We Connect Data BV(1) Wiedauwkaai 23, bus S 9000 Ghent, Belgium 0650 599 388 16,03%
AgeCore SA(1) Rue de la Synagogue 33 1204 Genève, Switzerland CHE-222 427 477 25,00% First Retail International 2 NV(1) Pontbeekstraat 2 1702 Dilbeek, Belgium 0644 497 494 4,73% Scallog SAS(2) Rue Raymond Barbet 105 92000 Nanterre, France 791 336 076 23,73% Smartmat NV(1) Dock-North 4, bus E 9000 Ghent, Belgium 0841 142 626 41,36% The Seaweed Company BV(1) Lange Haven 132 3111 CK Schiedam, Netherlands 72339225 21,30% Vendis Capital NV(1) Jan Emiel Mommaertslaan 22 1831 Machelen, Belgium 0819 787 778 10,87% Virya Energy NV(1)(3) Villalaan 96 1500 Halle, Belgium 0739 804 548 59,94%
292
34.5. Changes in consolidation scope
a. New investments
On 30 June 2022, Colruyt Group acquired 100% of the shares of Cycles IMP BV. The acquisition of Cycles IMP BV is part of Bike Republic's expansion within Brussels.
In July 2022, Colruyt Group fully acquired FD Company 2 BV. FD Company 2 BV in turn holds 100% of the shares of Heylen-Engels BV. Both companies have, since the acquisition date, been accounted for as subsidiaries and are fully consolidated.
On 31 August 2022, Colruyt Group acquired 100% of the shares of Yaleli BV. Yaleli BV operates 2 bicycle stores, one in Aalst and one in Ninove.
On 30 November 2022, Colruyt Group acquired 100% of the shares of Oyxgen Clubs BV. Oxygen Clubs BV operates 6 fitness clubs in East Flanders, in locations complementary to the existing Jims network in Flanders. In January 2023, the company's corporate name was changed to Jims Oost BV.
On 29 December 2022, Colruyt Group acquired 100% of the shares of Société Agricole de Meester BV (SAM for short). The company owns approximately 373 hectares of agricultural land. This acquisition fits with Colruyt Group's agricultural activities (Agripartners NV).
During the financial year, a 25% stake was acquired in the company Pluginvest BV (May 2022). Pluginvest BV offers various charging solutions for businesses and private individuals through an offering of charging stations and associated services with a view to building a long-term relationship in which Pluginvest BV aims to unburden its customers as an integrator. This company is accounted for as a joint venture using the equity method.
On 16 March 2023, Colruyt Group acquired 100% of the shares of EW 738/740 BV. The acquisition is part of a redevelopment project in which an Okay Compact and several residential units will be developed.
b. Mergers
The companies Eoly NV and DATS 24 NV merged with effect from 1 April 2022.
Furthermore, a silent merger took place between the companies Smartmat NV and 15gram BV, with retrospective effect from 2 June 2022.
There also was a silent merger between Colim NV and the companies Gecaro NV, Onroerende Beleggingsmaatschappij Van Brabant NV and Grimbergen Retail Property BV. These mergers occurred with retroactive effect from 1 April 2022.
c. Newly established companies
In Belgium, the companies Codevco XIV NV, Codevco XV NV, Codevco XVI NV were established (December 2022).
d. Other changes
On 13 September 2022, Colruyt Group increased its stake in Daltix NV from 77,55% to 78,76%. This company is accounted for as a joint venture using the equity method.
On 14 October 2022, Colruyt Group increased its stake in Newpharma Group NV from 61% to 100%. Since then, Newpharma Group NV has been an integral part of Colruyt Group, as a result of which the investment in Newpharma Group NV is fully accounted for as a subsidiary, and no longer as an associate company using the equity method. The requisite measures were taken in the context of the conflict of interest rules. At acquisition date, the fair value of the 61% stake in the associate's capital already held was set at EUR 85,7 million, whereby the resulting gain can be considered negligible in relation to the carrying amount of the associate. Consequently, the gain of control over Newpharma Group NV has no impact on the result of the financial year 2022/23.
On 27 December 2022, Colruyt Group increased its stake in De Leiding BV from 46,23% to 51,99%. This company is accounted for as a joint venture using the equity method.
293 FINANCIAL REPORT | Consolidated statements • Statement • Independent auditor’s report • Notes • Definitions
The corporate name of Codevco XI NV was changed to Darzana NV in April 2022. On 30 August 2022, Codevco I RDC SASU changed its name to N'Situ Pelende SASU. At the end of March 2023, the names of Codevco VI BV, Codevco XII NV, Comels NV and Wieleke BV were changed to SmartWithFood BV, Sukhino NV, Okay Compact NV and WV3 BV, respectively.
At the beginning of June 2022, Colruyt Group and its family majority shareholder Korys converted their convertible bonds issued by Virya Energy NV into shares. The conversion increased Colruyt Group's stake from 59,78% to 59,94%.
On 30 June 2022, the companies Puurgen NV and Puurwijn NV were dissolved and liquidated.
By deed of 6 September 2022, it was decided to change the legal form of Finco France from SAS to SARL.
On 15 February 2023, it was decided to proceed with the dissolution of the French company R.H.C. SAS. From an accounting viewpoint, the dissolution without liquidation has a tax effect at 1 April 2022.
On 29 March 2023, the agreement was signed for the sale of the shares in Hyve BV to Hyve BV itself.
For transactions decided by the Board of Directors after year-end with regard to Virya Energy NV, we refer to note 32. Events after the reporting date.
35. Condensed (non-consolidated) financial statements of Etn. Fr. Colruyt NV, in accordance with Belgian accounting standards
The financial statements of Etn. Fr. Colruyt NV are presented below in condensed form.
For the individual financial statements of Etn. Fr. Colruyt NV an unqualified audit opinion was delivered by the auditor. The statutory report of the auditor confirms that the individual financial statements of Etn. Fr. Colruyt NV for the financial year ending 31 March 2023, prepared according to Belgian accounting standards, give a true and fair view of the financial position of Etn. Fr. Colruyt NV in accordance with all legal and regulatory dispositions. In the report no attention was drawn to any matter in particular.
The annual report, the annual financial statements of Etn. Fr. Colruyt NV and the independent auditor’s report are filed with the National Bank of Belgium, in accordance with art. 3:10 and art. 3:12 of the Code on Companies and Associations. A copy of these documents can be obtained there on request.
These documents can also be obtained on request at the Company’s registered office:
Etn. Fr. Colruyt NV – Edingensesteenweg 196, 1500 Halle
Tel. +32 (2) 363 55 45
Internet: www.colruytgroup.com
Email: contact@colruytgroup.com
FINANCIAL REPORT | Consolidated statements • Statement • Independent auditor’s report • Notes • Definitions
294
Condensed statement of financial position of Etn. Fr. Colruyt NV
295 FINANCIAL REPORT | Consolidated statements • Statement • Independent auditor’s report • Notes • Definitions
(in million EUR) 31.03.23 31.03.22 Non-current assets 8.459,1 6.262,9 I. Formation expenses 0,4II. Intangible assets 209,6 188,1 III. Property, plant and equipment 384,6 285,5 IV. Financial non-current assets 7.864,5 5.789,3 Current assets 1.339,1 1.266,4 V. Receivables exceeding one year 2,7 8,0 VI. Inventories and work in progress 434,2 434,0 VII. Receivables for less than one year 605,8 659,3 VIII. Cash investments 249,0 132,0 IX. Cash and cash equivalents 36,7 29,0 X. Prepayments and accrued income 10,7 4,1 Total assets 9.798,2 7.529,3 Equity 3.473,5 1.757,0 I. Share capital 370,2 364,8 IV. Reserves 220,7 172,2 V. Profit carried forward 2.882,3 1.219,7 VI. Capital grants 0,3 0,3 Provisions and deferred taxes 1,5 2,8 Liabilities 6.323,2 5.769,5 VIII. Liabilities exceeding one year 4.298,6 4.089,8 IX. Liabilities for less than one year 1.999,4 1.657,3 X. Accruals and deferred income 25,2 22,4 Total liabilities 9.798,2 7.529,3
Condensed income statement of Etn. Fr. Colruyt NV
Profit appropriation of Etn. Fr. Colruyt NV
For the 2022/23 financial year, the Board of Directors will propose the following profit distribution to the General Meeting of Shareholders on 27 September 2023:
FINANCIAL REPORT | Consolidated statements • Statement • Independent auditor’s report • Notes • Definitions
(in million EUR) 2022/23 2021/22 I. Operating income 7.805,1 7.351,6 II. Operating expenses (7.643,6) (7.177,4) III. Operating profit 161,5 174,2 IV. Finance income 1.927,9 209,0 V. Financial costs (273,9) (149,8) VI. Profit for the financial year before tax 1.815,5 233,4 VIII. Income tax (4,9) (6,8) IX. Profit for the financial year 1.810,6 226,6 X.A. Transfer from the tax exempt reserves 0,2 0,9 X.B. Transfer to the tax exempt reserves - (0,3) XI. Profit for the financial year available for appropriation 1.810,8 227,2
(in million EUR) 2022/23 2021/22 Profit for the financial year available for appropriation 1.810,8 227,2 Profit carried forward from previous financial year 1.219,7 1.320,6 Profit available for appropriation 3.030,5 1.547,8 Transfer to the legal reserve 0,5 0,7 Addition to/(transfer from) other reserves 48,1 186,3 Result to be carried forward 2.882,3 1.219,7 Dividend to owners(1) 99,6 139,8 Other debts - 1,3 (1) This item was calculated on the basis of the treasury share repurchase situation at 9 June 2023. 296
Definitions
Acquisitions of property, plant and equipment and intangible assets
Acquisitions of property, plant and equipment and intangible assets are exclusive of acquisitions through business combinations, contributions by third parties and rights of use under IFRS 16.
Capital employed
The value of the assets and liabilities that contribute to generating income.
Dividend yield
Gross dividend per share divided by the share price at the reporting date.
Dividend pay-out ratio
Gross dividend per share divided by the profit for the financial year (group share) per share.
EBIT margin
EBIT divided by revenue.
EBITDA
Earnings before interest, taxes, depreciation and amortisation, or operating profit (EBIT) plus depreciation, amortisation and impairments.
EBITDA margin
EBITDA divided by revenue.
Free cash flow
Free cash flow is defined as the sum of the cash flow from operating activities and the cash flow from investing activities.
FTE
Full-time equivalent; unit of account with which the number of personnel is expressed by dividing the contractual working time by full-time working time.
Gross added value
The realisable value of the manufactured goods less the value of the raw materials and the auxiliary materials used in the production process and the procured services.
Gross profit
Revenue minus cost of goods sold.
Gross profit margin
Gross profit divided by revenue.
Market capitalisation
Closing price multiplied by the number of issued shares at the reporting date.
Net added value
Consists of the gross added value less depreciation, amortisation, impairments on fixed assets, provisions and write-offs of current assets.
Net profit
Profit for the financial year (after tax).
Net profit margin
Net profit divided by revenue.
Operating profit (EBIT or earnings before interest and taxes)
The operating income less all operating costs (cost of goods sold, services and miscellaneous goods, employee benefit expenses, depreciation, amortisation, impairments and other operating expenses).
Revenue
Revenue comprises the sale of goods and services provided to our own customers, affiliated customers and wholesale customers, after the deduction of discounts and commissions allocated to these customers.
ROIC
Return on invested capital, or operating profit (EBIT) after tax in relation to invested capital.
Share of the group
Interest that can be attributed to the owners of the parent company.
SPPI (‘Solely Payments of Principal and Interests’)
The SPPI test requires that the contractual terms of the financial asset give rise to cash flows that only include principal and interest payments on the principal amount outstanding.
Weighted average number of outstanding shares
The number of outstanding shares at the beginning of the period, adjusted for the number of shares cancelled, treasury shares purchased or shares issued during the period multiplied by a time-correcting factor.
297 FINANCIAL REPORT | Consolidated statements • Statement • Independent auditor’s report • Notes • Definitions
Notes 298
Contact
Limited liability company Etn. Fr. Colruyt Headquarters: Wilgenveld Edingensesteenweg 196 B-1500 HALLE
RPR Brussels
VAT: BE 0400.378.485
Enterprise number: 0400.378.485
+32 (0)2 363 55 45 colruytgroup.com contact@colruytgroup.com
Investor relations (for questions about shares, financial issues, annual rapport) +32 (0)2 363 55 45 investor@colruytgroup.com
Press and media enquiries
+32 (0)473 92 45 10 press@colruytgroup.com
Risks relating to forecasts
Statements by Colruyt Group included in this publication, along with references to this publication in other written or verbal statements of the group which refer to future expectations with regard to activities, events and strategic developments of Colruyt Group, are predictions and as such contain risks and uncertainties. The information communicated relates to information available at the present time, which can differ from the final results. Factors that can generate a variation between expectation and reality are: changes in the micro- or macroeconomic context, changing market situations, changing competitive climate, unfavourable decisions with regard to the building and/or extension of new or existing stores, procurement problems with suppliers, as well as all other factors that can impact the group’s result. Colruyt Group does not make any commitments with respect to future reporting that might have an influence on the group’s result or which could bring about a deviation from the forecasts included in this publication or in other group communication, whether written or oral.
299
www.colruytgroup.com
Publisher: Etn. Fr. Colruyt NV
Edingensesteenweg 196, B-1500 Halle • +32 (0)2 363 55 45
Design: Colruyt Goup Marketing Communication Services • Edingensesteenweg 249, B-1500 Halle
Only the Dutch version of the annual report is the official version. The French and English versions are translations of the original Dutch version.
300
