

2024 MARKET UPDATE
SAN FRANCISCO Q1

Dear Clients, Colleagues, and Friends,
As we delve into the first quarter of 2024, it’s evident that San Francisco’s real estate landscape is characterized by a notable uptrend. Over the past three months, both single-family homes and condominiums have displayed robust yearly growth across key metrics, including median sales price, median price per square foot, and the volume of properties entering escrow and completing sales transactions.
Concurrently, the days on market have witnessed a decline, indicative of heightened demand and efficient sales processes.
The onset of the spring selling season has brought a surge in buyer activity, with agents reporting significant turnout at open houses and a proliferation of multiple offers on numerous properties. Buyer competition has intensified, particularly in desirable neighborhoods and properties boasting sought-after amenities and attractive features. This heightened competition has led to instances where properties are selling well
NOTE FROM COLLEEN & ZOE
A
above asking price, with offer dates and bidding wars becoming increasingly common occurrences again.
However, it’s essential to underscore that these dynamics vary significantly depending on the property type and neighborhood. While some areas experience fervent buyer interest, others may exhibit more subdued activity, highlighting the importance of nuanced market analysis and tailored marketing strategies.
Mortgage rates have increased as inflation continues to be a challenge. While incoming economic signals indicate lower rates of inflation, we do not expect rates will decrease meaningfully in the near-term. On the plus side, inventory is improving somewhat, which should help temper home price growth.


SINGLE FAMILY MARKET SAN FRANCISCO CITY WIDE
Q1
YEAR-OVER-YEAR COMPARISON
Q1 2024 Q1 2023 % CHANGE
DAYS ON MARKET $ PER SQUARE FOOT END OF MONTH INVENTORY WENT INTO CONTRACT PROPERTIES SOLD $1,650,000 14 $989 240 413 397
2024 MEDIAN SALES PRICE
WENT INTO CONTRACT PROPERTIES SOLD END OF MONTH INVENTORY # OF PROPERTIES SOLD OVER LIST AVERAGE % OF LIST PRICE RECEIVED 413 397 240 62.5% 108.0% 334 349 259 54.2% 105.4% +23.7% +13.8% -7.3% +15.3% +2.5% Sources: SFAR MLS & BrokerMetrics; Property types covered: Single-family. Only property data posted on the MLS is covered. All information is deemed reliable, but not guaranteed for accuracy. All data is subject to errors, omissions, revisions, and is not warranted. ©2024 Vanguard Properties. All rights reserved. Equal Housing Opportunity. DRE No. 01486075
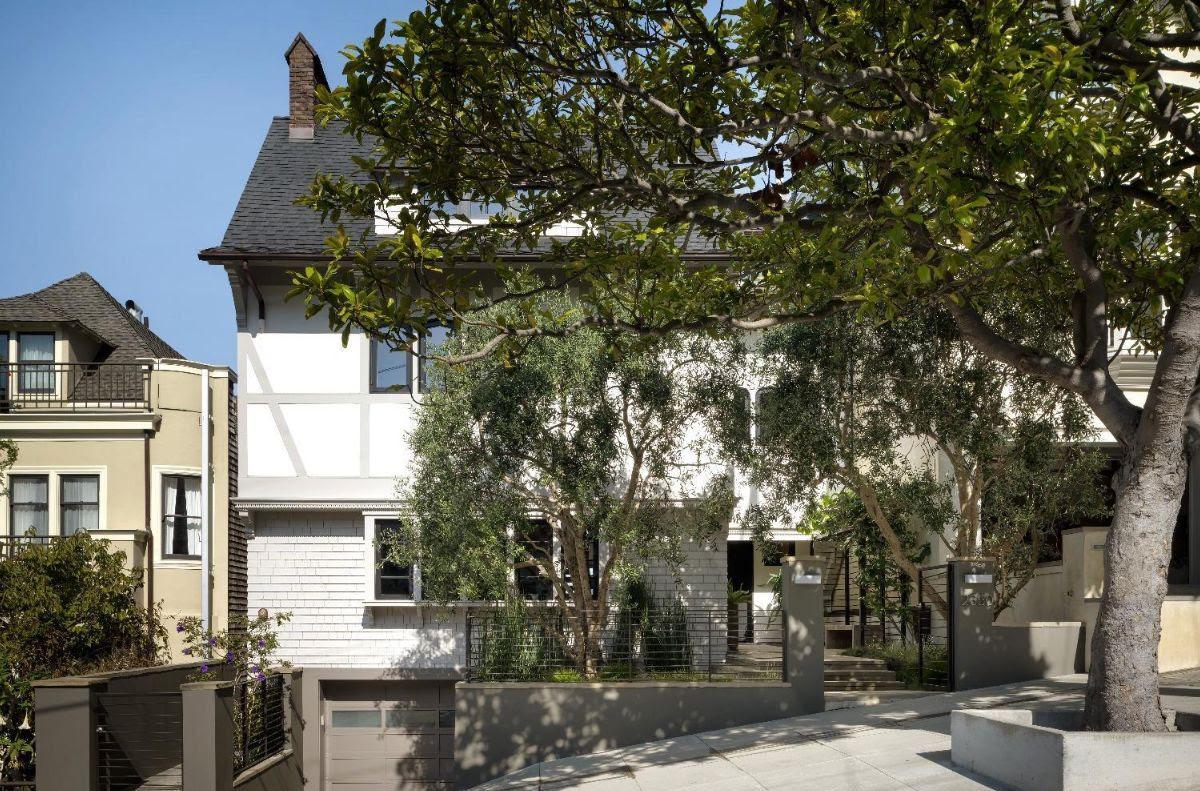
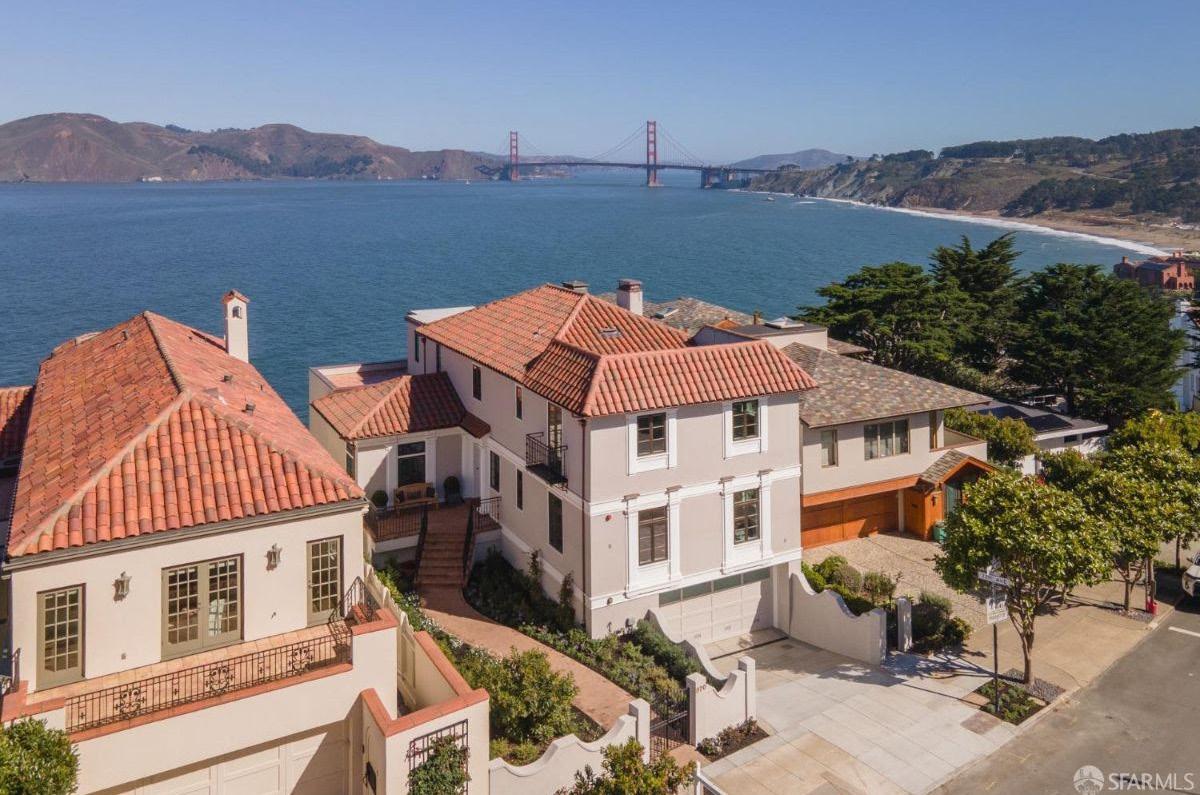
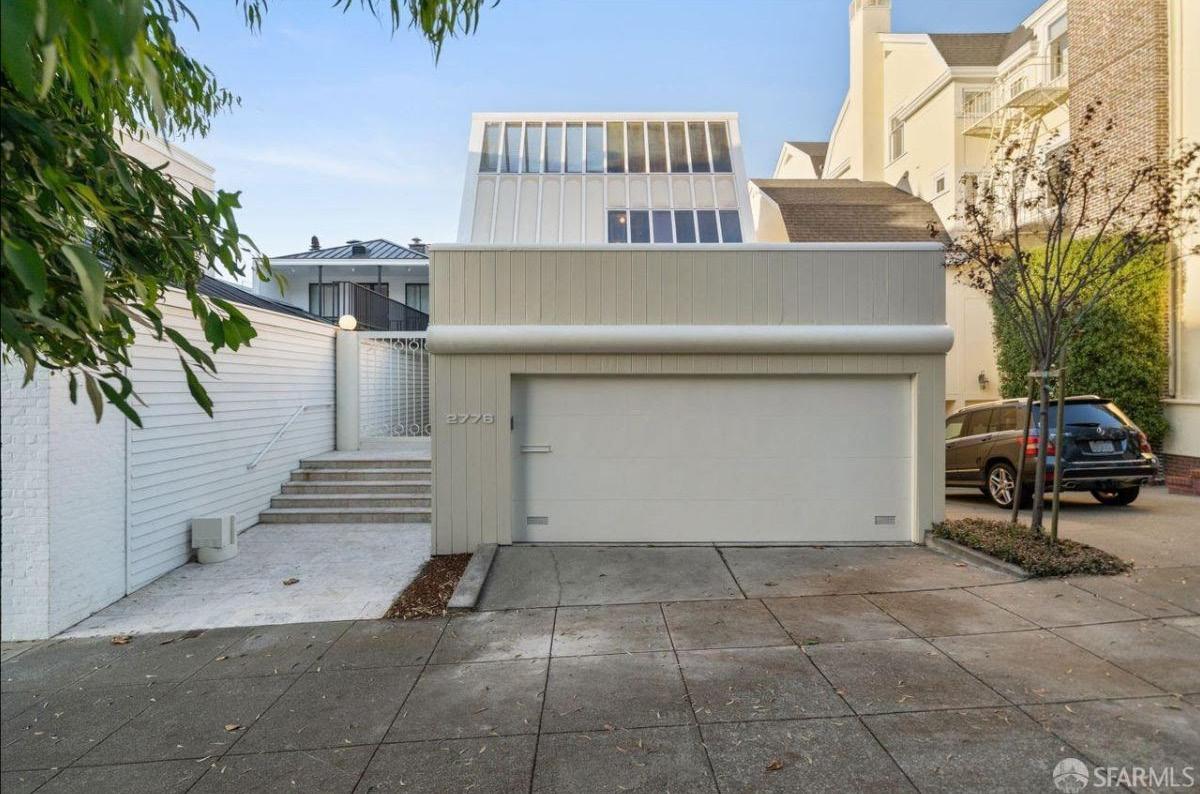
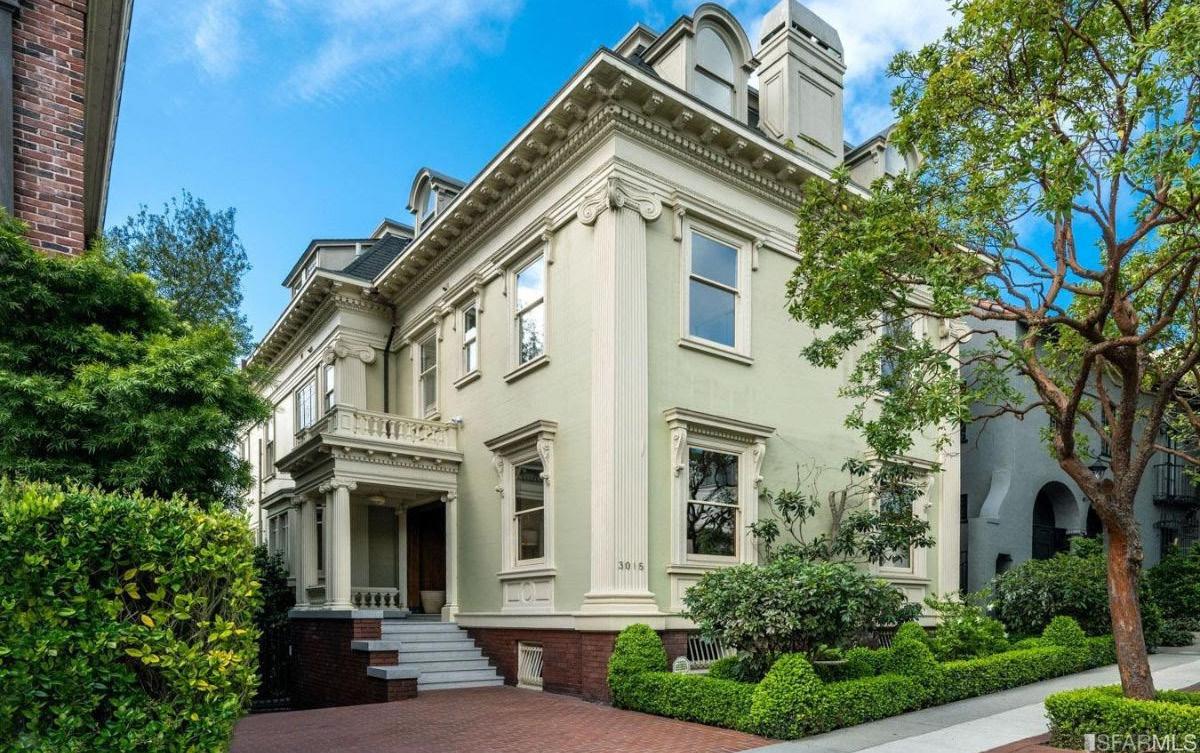
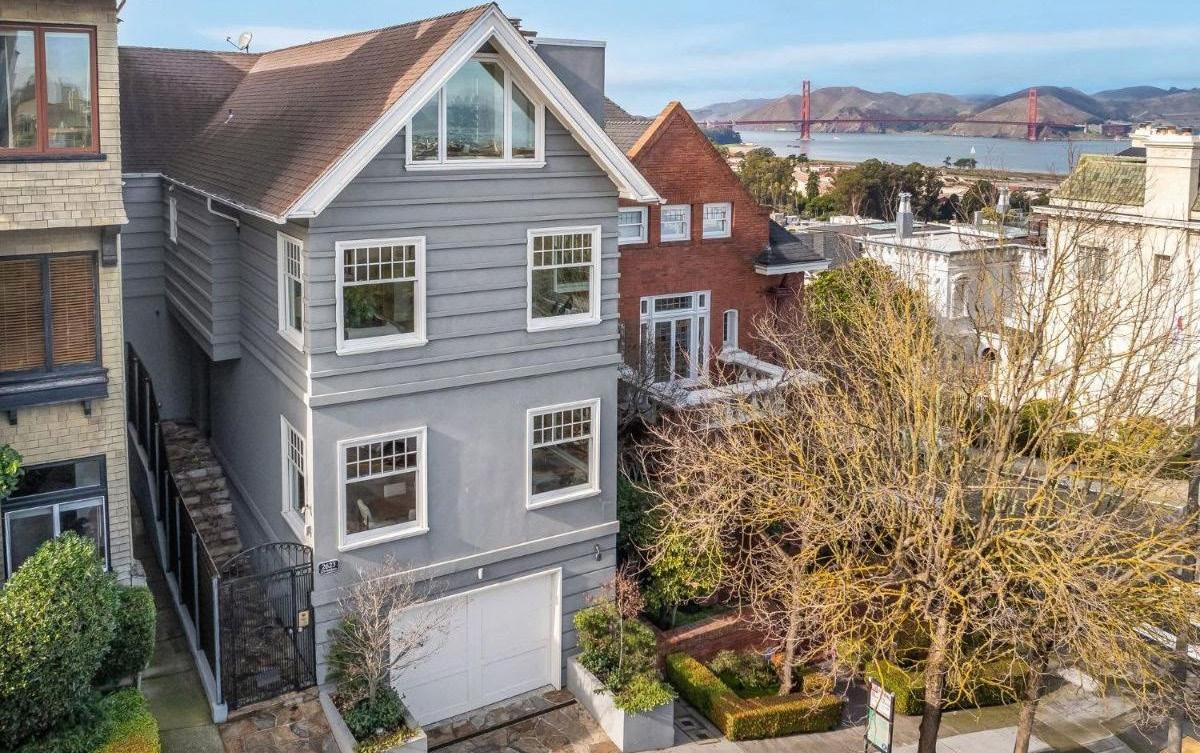
Sources: SFAR MLS & BrokerMetrics; Property types covered: Single-family. Only property data posted on the MLS is covered. All information is deemed reliable, but not guaranteed for accuracy. All data is subject to errors, omissions, revisions, and is not warranted. ©2024 Vanguard Properties. All rights reserved. Equal Housing Opportunity. DRE No. 01486075 TOP 5 SINGLE FAMILY HOME SALES Q1 2024 / SAN FRANCISCO CITY WIDE 2350 BROADWAY STREET PACIFIC HEIGHTS / $23,800,000 870 EL CAMINO DEL MAR SEA CLIFF / $14,500,000 2776 BROADWAY STREET PACIFIC HEIGHTS / $9,300,000 2623 DIVISADERO STREET PACIFIC HEIGHTS / $7,235,000 3015 PACIFIC AVENUE PACIFIC HEIGHTS / $9,000,000 #1 #2 #3 #4 #5
MEDIAN SINGLE FAMILY VALUES
Q1 2024 / SAN FRANCISCO CITY WIDE
NEIGHBORHOOD
*Denotes small sample size - use caution when interpreting statistics. Sources: SFAR MLS & BrokerMetrics; Property types covered: Single-family. Only property data posted on the MLS is covered. All information is deemed reliable, but not guaranteed for accuracy. All data is subject to errors, omissions, revisions, and is not warranted. ©2023 Vanguard Properties. All rights reserved. Equal Housing
Opportunity. DRE No. 01486075
Pacific/Presidio Heights Hayes Valley Marina/Cow Hollow Lower Pacific/Laurel Heights Castro/Duboce Triangle Russian Hill Buena Vista/Corona Heights Noe Valley Cole Valley/Haight Ingleside Terrace/Lakeside Potrero HIll Mission Alamo Square/NOPA Westwood Park/Sunnyside Richmond/Lake Street Diamond Heights Bernal Heights/Glen Park Sunset Excelsior/Portola Bayview/Hunters Point AVG SOLD PRICE $4,995,000 $4,305,000 $4,100,000 $3,950,000 $2,950,000 $2,875,000 $2,697,500 $2,473,000 $2,450,000 $2,150,000 $1,967,250 $1,920,000 $1,900,000 $1,880,000 $1,8500,00 $1,6901,00 $1,6100,00 $1,5250,00 $1,0780,00 $892,500 $ / SQ. FT. $1,444 $1,354 $1,448 $886 $1,103 $1,158 $1,270 $1,252 $1,292 $932 $926 $1,103 $1,389 $926 $890 $815 $1,143 $1,007 $794 $580 AVG % OF LIST PRICE RECV’D 100.8% 110.0% 98.9% 106.4% 106.6% 98.6% 103.6% 108.4% 100.3% 120.9% 104.0% 106.7% 102.7% 109.5% 108.4% 103.3% 107.3% 116.8% 107.1% 103.7% HOMES SOLD 21* 2* 8* 5* 15* 6* 6* 20* 2* 7* 8* 1* 1* 11* 35* 4* 39* 35* 23* 10*

CONDOMINIUM MARKET SAN FRANCISCO CITY WIDE
Q1 2024 Q1 2023 % CHANGE
PER
PROPERTIES
PROPERTIES
END OF MONTH INVENTORY # OF PROPERTIES SOLD OVER LIST AVERAGE % OF LIST PRICE RECEIVED 575 486 649 31.7% 99.9% 544 469 624 31.6% 99.5% +5.7% +3.6% +4.0% +0.3% +0.4% Sources: SFAR MLS & BrokerMetrics; Property types covered: Condos/TIC/Co-Ops. Only property data posted on the MLS is covered. All information is deemed reliable, but not guaranteed for accuracy. All data is subject to errors, omissions, revisions, and is not warranted. ©2024 Vanguard Properties. All rights reserved. Equal Housing Opportunity. DRE No. 01486075
YEAR-OVER-YEAR COMPARISON $1,127,500 26 $1,006 649 575 486
MEDIAN SALES PRICE DAYS ON MARKET $
SQUARE FOOT END OF MONTH INVENTORY WENT INTO CONTRACT
SOLD WENT INTO CONTRACT
SOLD
Q1 2024
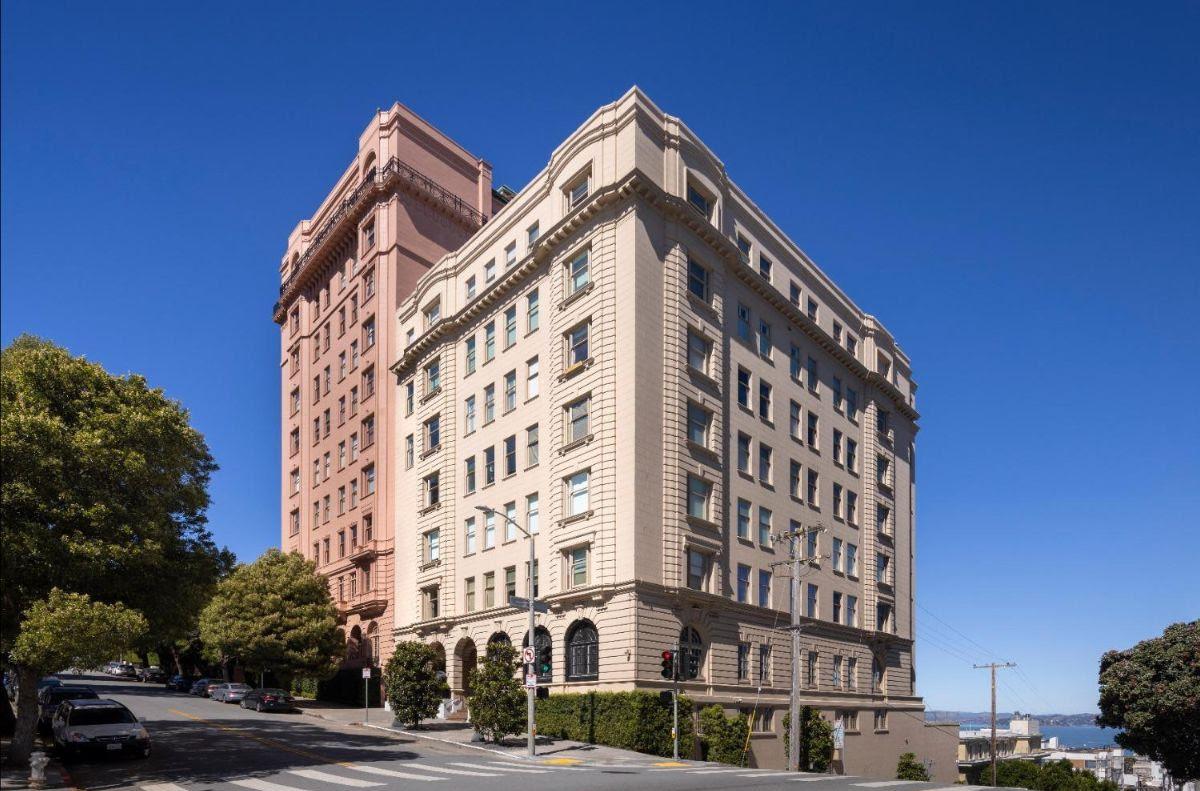
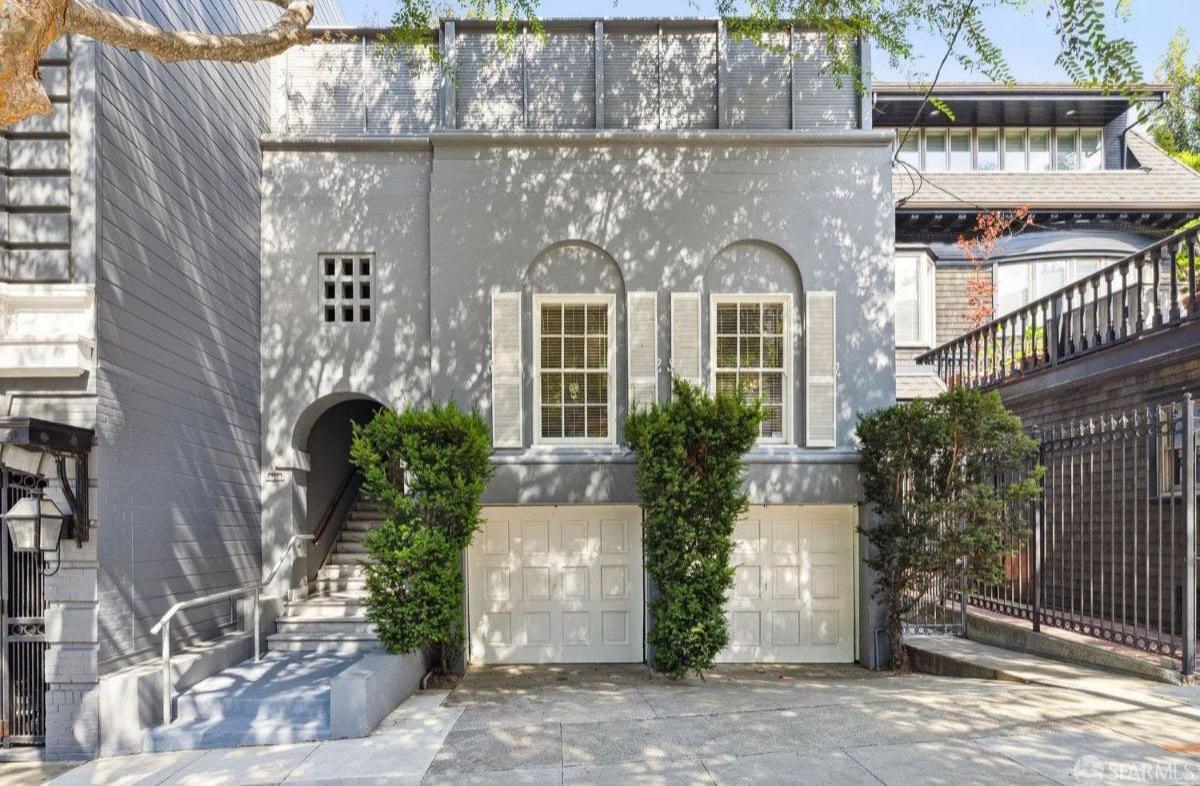
2000 WASHINGTON ST #PH PACIFIC HEIGHTS / $16,000,000 2226 GREEN STREET PACIFIC HEIGHTS / $7,600,000 1 STEUART LANE #1006 SOUTH BEACH / $7,445,000 2121 WEBSTER STREET #TH8 PACIFIC HEIGHTS / $4,900,000 1 STEUART LANE #806 SOUTH BEACH / $6,995,000 #1 #2 #3 #4 #5 Sources: SFAR MLS & BrokerMetrics; Property types covered: Condos/TIC/Co-Ops. Only property data posted on the MLS is covered. All information is deemed reliable, but not guaranteed for accuracy. All data is subject to errors, omissions, revisions, and is not warranted. ©2024 Vanguard Properties. All rights reserved. Equal Housing Opportunity. DRE No. 01486075 TOP 5 CONDOMINIUM HOME SALES Q1 2024 / SAN FRANCISCO CITY WIDE
MEDIAN CONDOMINIUM VALUES
Q1 2024 / SAN FRANCISCO CITY WIDE
NEIGHBORHOOD
Buena Castro/Duboce Triangle
SFAR MLS & BrokerMetrics; Property types covered: Condos/TIC/Co-Ops. Only property data posted on the MLS is covered. All information is deemed reliable, but not guaranteed for accuracy. All data is subject to errors, omissions, revisions, and is not warranted. ©2024 Vanguard Properties. All rights reserved. Equal Housing Opportunity. DRE No. 01486075
Sources:
Square/NOPA
Beach/Yerba
Pacific/Presidio Heights Alamo
Marina/Cow Hollow Buena Vista/Corona Heights South
Hill
Potrero Hill
Street
Dolores Mission Mission Bay Bernal Heights/Glen Park Dogpatch Hayes Valley Diamond Heights SOMA North Beach/Fishermans Wharf Bayview/Hunters Point AVG SOLD PRICE $2,040,000 $1,550,000 $1,522,000 $1,494,000 $1,372,500 $1,352,000 $1,330,000 $1,300,000 $1,295,000 $1,272,500 $1,270,000 $1,260,000 $1,245,000 $1,225,000 $1,180,000 $1,120,000 $1,059,500 $1,035,000 $995,000 $930,000 $827,000 $823,500 $771,000 $680,000 $624,000 $ / SQ. FT. $1,144 $1,047 $972 $1,148 $1,081 $1,138 $1,037 $977 $1,091 $1,004 $952 $1,097 $843 $949 $861 $1,061 $978 $950 $879 $1,152 $942 $816 $764 $933 $413 AVG % OF LIST PRICE RECV’D 98.6% 103.1% 100.6% 108.8% 96.4% 105.3% 97.8% 100.0% 104.4% 107.1% 95.7% 103.4% 102.1% 102.5% 101.0% 102.0% 102.6% 100.9% 98.7% 103.9% 96.5% 100.9% 99.2% 97.2% 98.7% HOMES SOLD 36* 7* 22* 13* 54 23* 27* 12* 21* 8* 27* 7* 8* 24* 7* 14* 46* 17* 11* 7* 11* 5* 32* 8* 4*
Russian Hill Lower Pacific/Laurel Heights Noe Valley Cole Valley/Haight Nob Hill* Telegraph
Sunset
Richmond/Lake
Mission


COLLEEN COTTER 415.706.1781 colleen@colleencottersf.com BRE Lic. #01703078 ZOE FRANKEL 415.235.9422 zoefrankel@vanguardsf.com DRE Lic. #02134477 Contact colleencottersf.com 1801 Filmore Street | San Francisco, CA 94115
