

SAN
FRANCISCO MARCH 2024 MARKET UPDATE

Dear Clients, Colleagues, and Friends,
The prevailing industry sentiment suggests that the San Francisco real estate market experienced its low in 2023 and is presently in the midst of a significant recovery.
Demonstrating this positive trend, the median sales price for single-family homes experienced a substantial 10 percent increase compared to the previous year. Additionally, core downtown markets are witnessing increased sales, coupled with a resurgence of confidence in the city’s future.
The city is reclaiming its position as a notable financial and cultural center, gaining momentum in the anticipated technology boom, particularly in AI. This renewed sense of optimism is not only enhancing the city’s appeal to residents but is also attracting investors, thereby solidifying its reputation as a global powerhouse.
A NOTE FROM COLLEEN & ZOE
This real estate resurgence is part of a broader positive economic landscape. Despite a slight rise in interest rates in February, they are still considerably lower than they were several months ago. Financial markets are hitting record highs, and consumer confidence is increasing. These broader economic factors are key drivers in revitalizing the housing market, creating a favorable backdrop for a robust spring selling season.




SINGLE FAMILY MARKET
SAN FRANCISCO CITY WIDE
FEB 2024 FEB 2023 % CHANGE
MEDIAN SALES PRICE DAYS ON MARKET $ PER SQUARE FOOT END OF MONTH INVENTORY WENT INTO CONTRACT PROPERTIES SOLD $1,590,000 13 $1,033 195 157 136 YEAR-OVER-YEAR COMPARISON WENT INTO CONTRACT PROPERTIES SOLD END OF MONTH INVENTORY # OF PROPERTIES SOLD OVER LIST AVERAGE % OF LIST PRICE RECEIVED 157 136 195 64.0% 108.0% 130 101 410 51.5% 103.7% +20.8% +34.7% -52.4% +24.3% +4.1% Sources: SFAR MLS & BrokerMetrics; Property types covered: Single-family. Only property data posted on the MLS is covered. All information is deemed reliable, but not guaranteed for accuracy. All data is subject to errors, omissions, revisions, and is not warranted. ©2024 Vanguard Properties. All rights reserved. Equal Housing Opportunity. DRE No. 01486075
FEBRUARY 2024
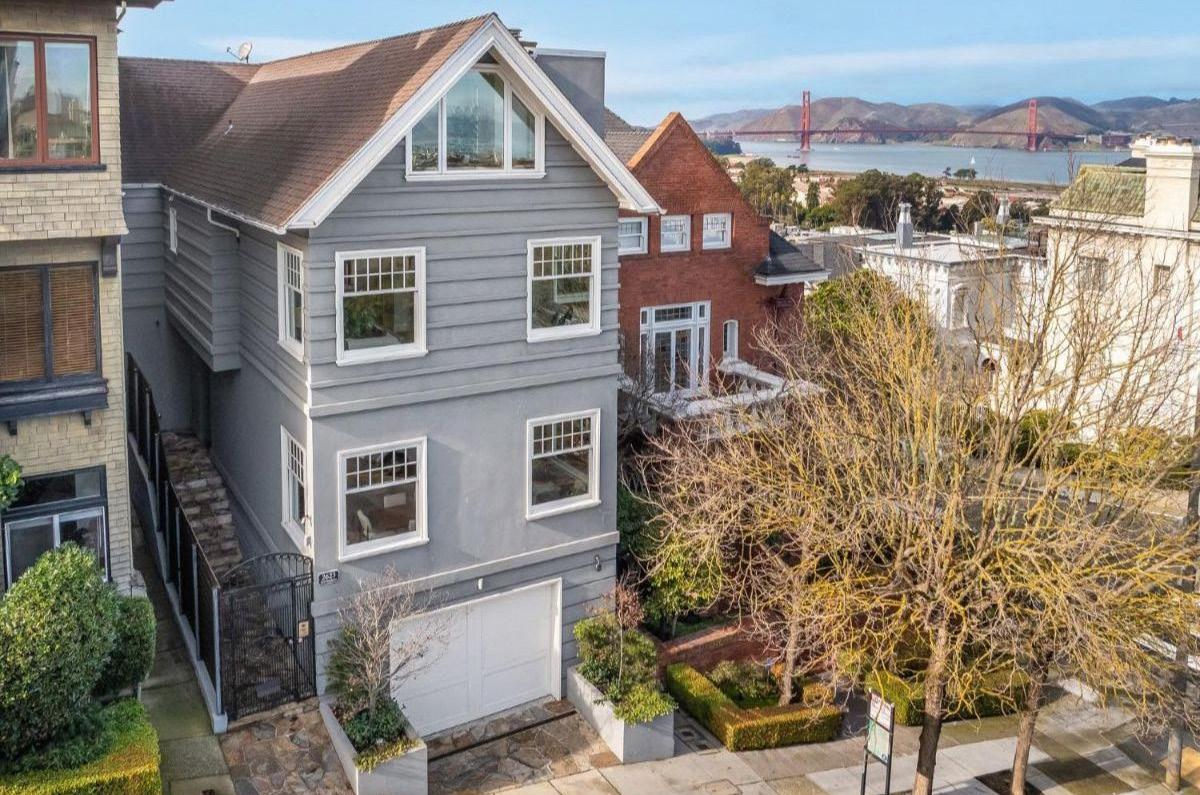

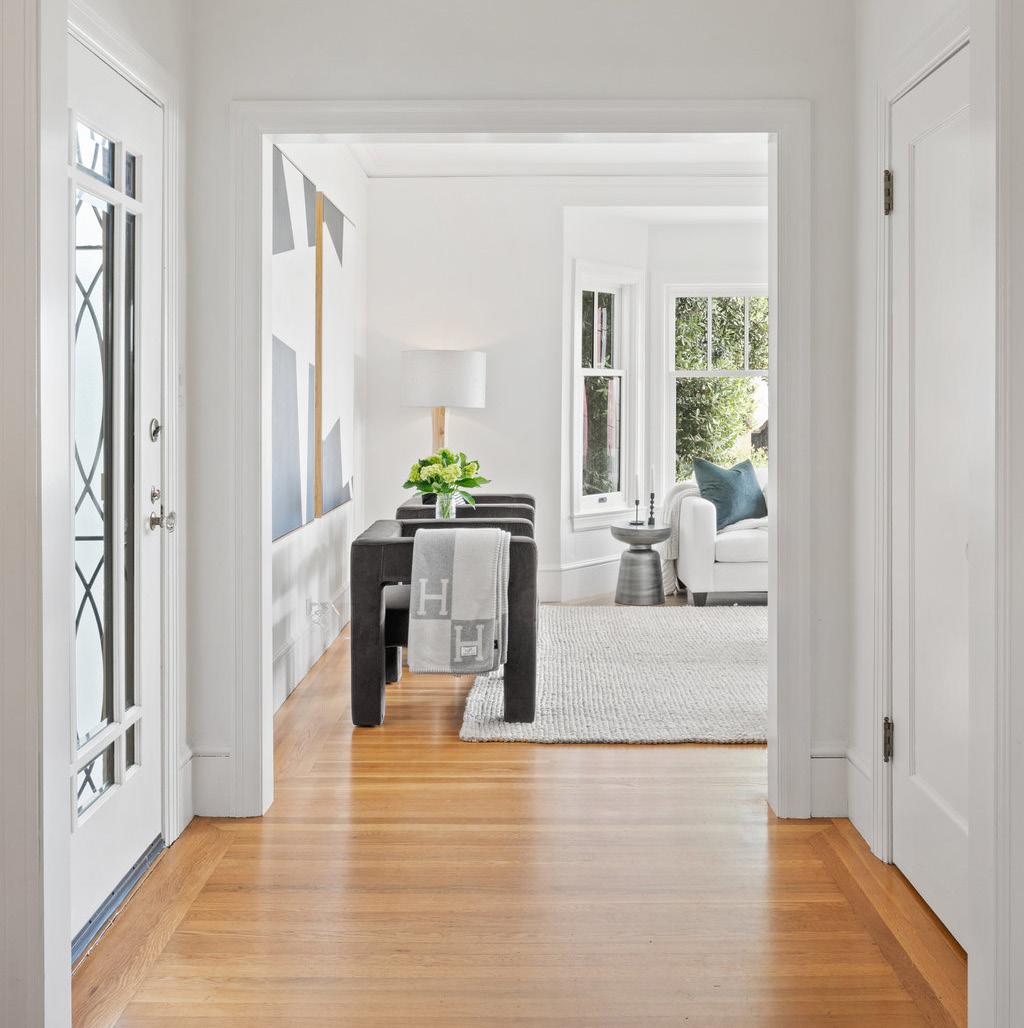
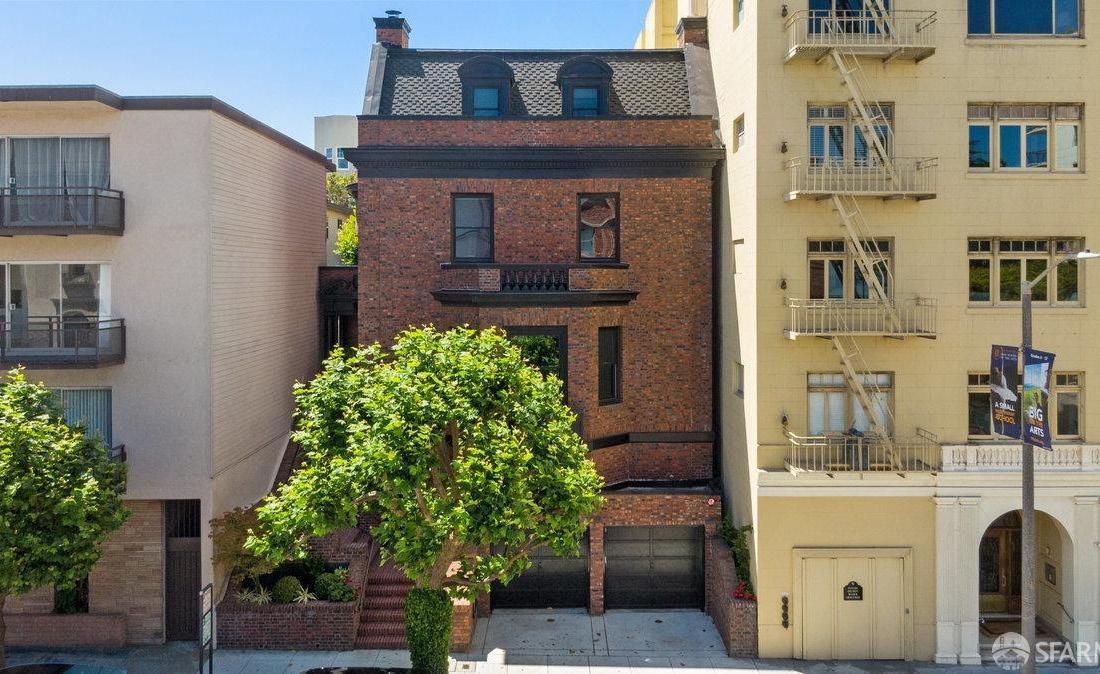 2623 DIVISADERO STREET PACIFIC HEIGHTS / $7,235,000
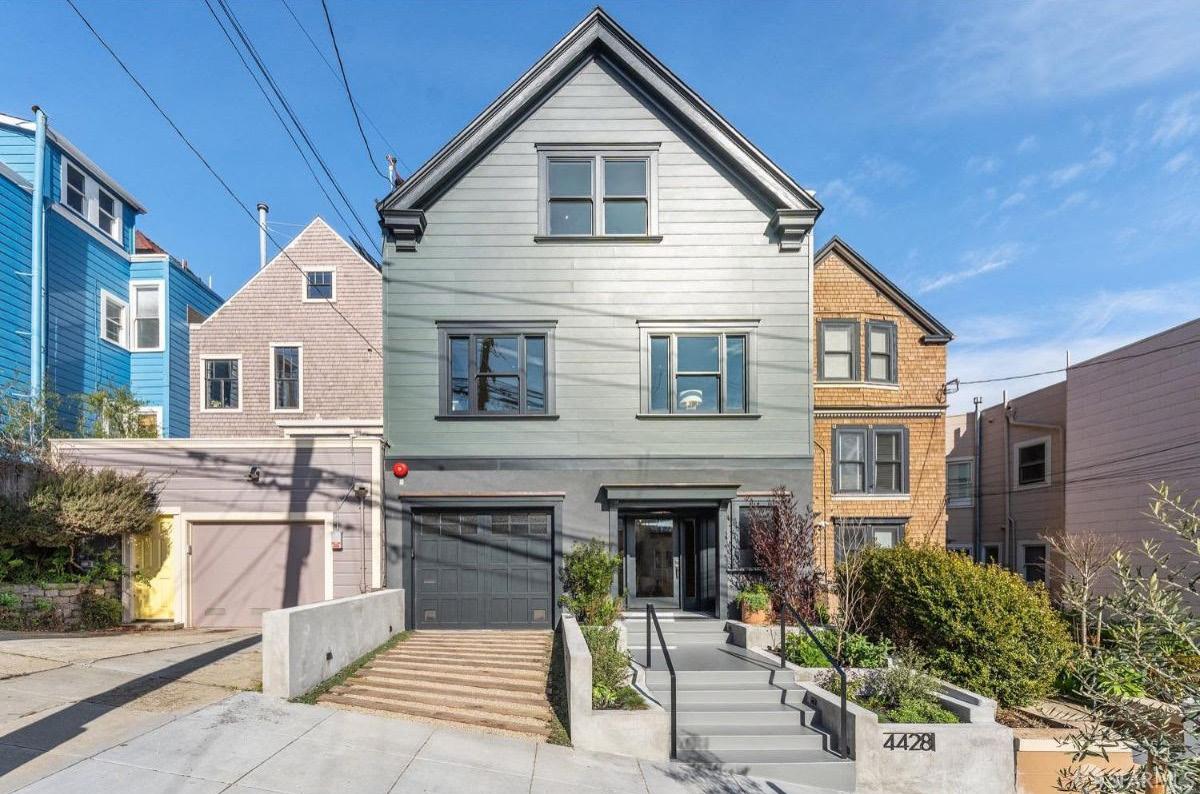
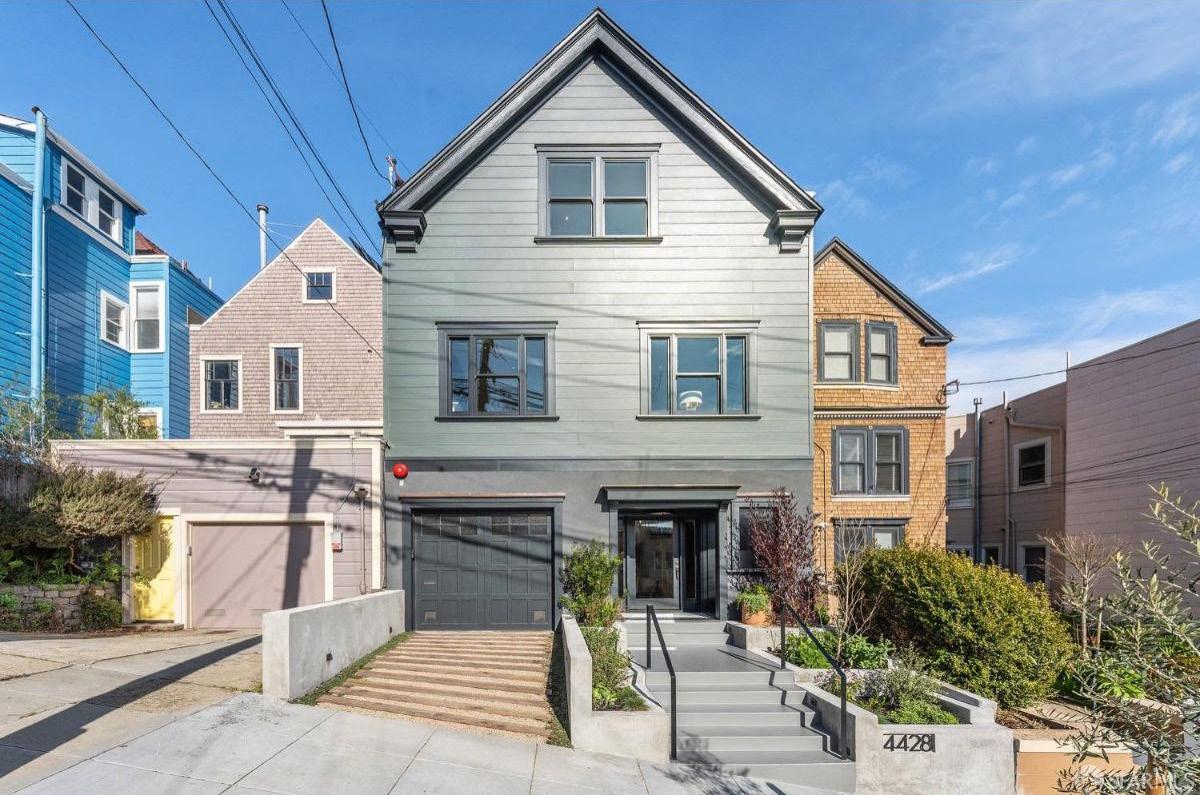
$7,200,000
4428 23RD STREET
NOE VALLEY /
2773 CLAY STREET
PACIFIC HEIGHTS / $6,950.000
224 SEA CLIFF AVENUE SEA
CLIFF / $6,500,000
2249-2251 BROADWAY STREET PACIFIC
HEIGHTS / $6,649,000
Sources: SFAR MLS & BrokerMetrics; Property types covered: Single-family. Only property data posted on the MLS is covered. All information is deemed reliable, but not guaranteed for accuracy. All data is subject to errors, omissions, revisions, and is not warranted. ©2024 Vanguard Properties. All rights reserved. Equal Housing Opportunity. DRE No. 01486075
5 SINGLE FAMILY HOME SALES FEBRUARY 2024 / SAN FRANCISCO CITY WIDE
#1 #2 #3 #4 #5
TOP
MEDIAN SINGLE FAMILY VALUES
FEBRUARY 2024 / SAN FRANCISCO CITY WIDE
Pacific/Presidio Heights
Russian Hill
Marina/Cow Hollow
Cole Valley/Haight
Lower Pacific/Laurel Heights
Alamo Square/NoPa
Castro/Duboce Triangle
Hayes Valley
Noe Valley
Ingleside Terrace/Lakeside
Potrero Hill
Diamond Heights
Buena Vista/Corona Heights
Richmond/Lake Street
Mission
Bernal Heights/Glen Park
Sunset
Westwood Park/Sunnyside
Excelsior/Portola
Bayview/Hunters Point
*Denotes small sample size - use caution when interpreting statistics. Sources: SFAR MLS & BrokerMetrics; Property types covered: Single-family. Only property data posted on the MLS is covered. All information is deemed reliable, but not guaranteed for accuracy. All data is subject to errors, omissions, revisions, and is not warranted. ©2023 Vanguard Properties. All rights reserved. Equal Housing Opportunity. DRE No. 01486075 NEIGHBORHOOD
AVG SOLD PRICE $5,825,000 $4,525,000 $4,086,500 $3,900,000 $3,325,000 $2,900,000 $2,575,000 $2,450,000 $2,400,000 $2,237,500 $1,955,000 $1,913,000 $1,800,000 $1,750,000 $1,667,500 $1,640,000 $1,550,000 $1,350,000 $1,150,000 $937,750 $ / SQ. FT. $1,414 $1,280 $1,339 $1,442 $1,152 $801 $1,274 $1,131 $1,278 $834 $967 $909 $1,099 $1,020 $964 $1,069 $969 $929 $821 $627 AVG % OF LIST PRICE RECV’D 97.3% 102.2% 97.3% 103.0% 99.9% 112.0% 104.7% 115.2% 105.8% 117.2% 104.7% 104.2% 104.5% 105.9% 102.9% 106.9% 113.4% 105.9% 108.0% 106.6% HOMES SOLD 48* 12* 44* 15* 24* 9* 40* 8* 83 20* 29* 11* 31* 303 28* 191 162 63 140 48*

CONDOMINIUM MARKET
SAN FRANCISCO CITY WIDE
FEB 2024 FEB 2023 % CHANGE MEDIAN SALES PRICE DAYS ON MARKET $ PER SQUARE FOOT END OF MONTH INVENTORY WENT INTO CONTRACT PROPERTIES SOLD WENT INTO CONTRACT PROPERTIES SOLD END OF MONTH INVENTORY # OF PROPERTIES SOLD OVER LIST AVERAGE % OF LIST PRICE RECEIVED 199 176 595 35.8% 100.6% 180 142 824 28.2% 99.0% +10.6% +23.9% -27.8% +27.0% +1.6% Sources: SFAR MLS & BrokerMetrics; Property types covered: Condos/TIC/Co-Ops. Only property data posted on the MLS is covered. All information is deemed reliable, but not guaranteed for accuracy. All data is subject to errors, omissions, revisions, and is not warranted. ©2024 Vanguard Properties. All rights reserved. Equal Housing Opportunity. DRE No. 01486075 FEBRUARY 2024 YEAR-OVER-YEAR COMPARISON $1,115,000 17 $1,016 595 199 176
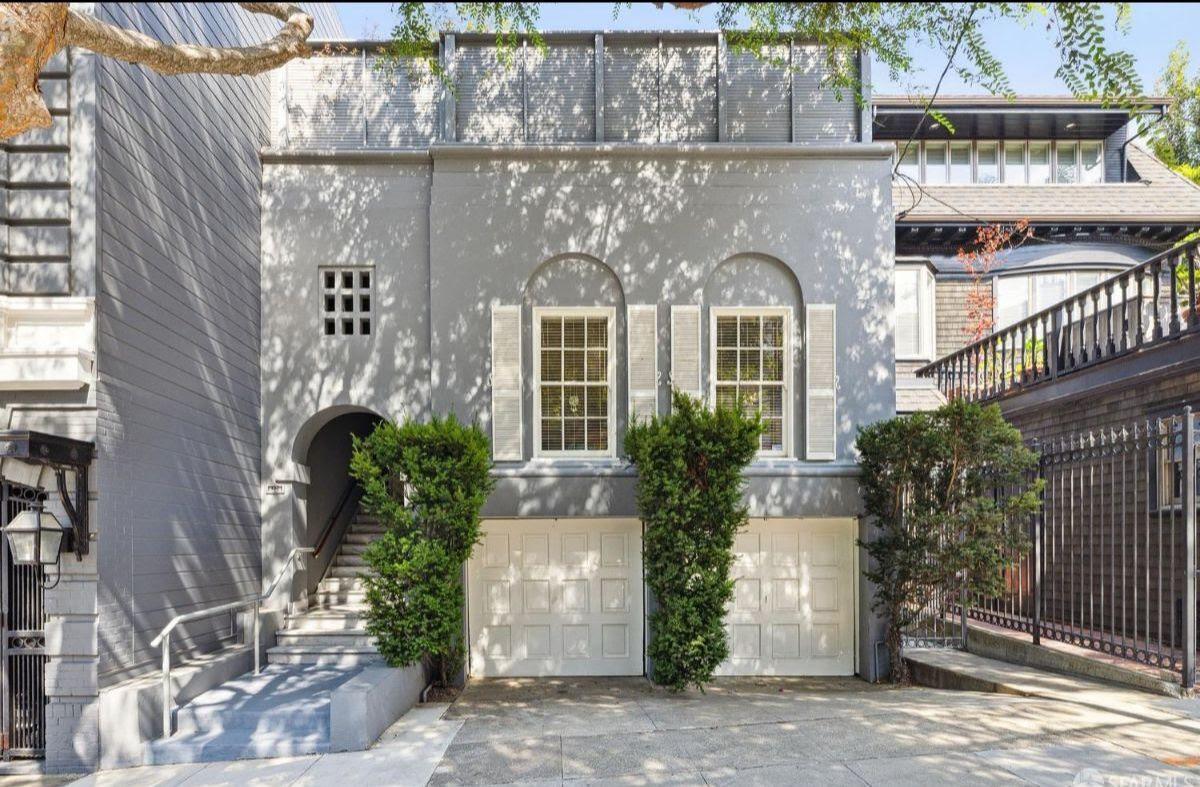


 2226 GREEN STREET
PACIFIC HEIGHTS / $7,600,000
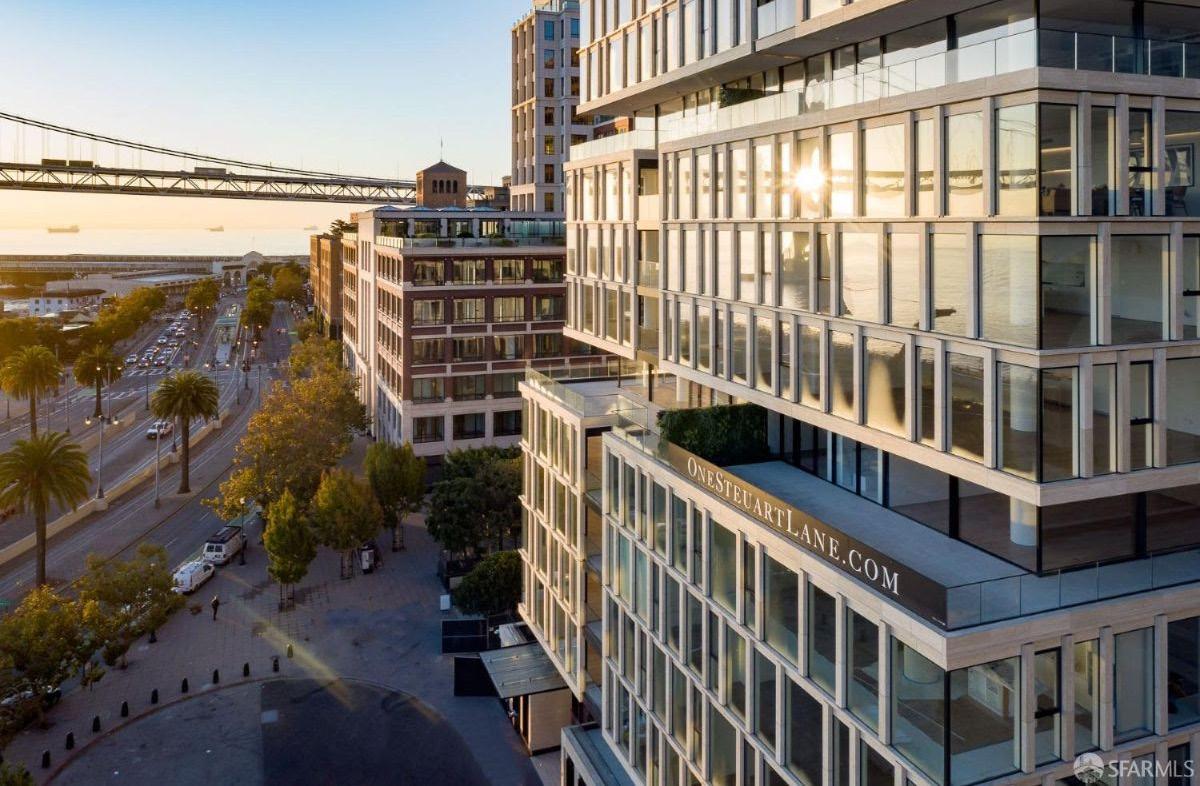
1 STEUART LANE #1006
SOUTH BEACH / $7,445,000
1 STEUART LANE #806
SOUTH BEACH / $6,995,000
280
SPEAR STREET SOUTH BEACH / $3,695,000
2074 JACKSON STREET
PACIFIC HEIGHTS / $3,795,000
#1
#2
#3
#4
Sources: SFAR MLS & BrokerMetrics; Property types covered: Condos/TIC/Co-Ops. Only property data posted on the MLS is covered. All information is deemed reliable, but not guaranteed for accuracy. All data is subject to errors, omissions, revisions, and is not warranted. ©2024 Vanguard Properties. All rights reserved. Equal Housing Opportunity. DRE No. 01486075
CONDOMINIUM HOME SALES FEBRUARY 2024 / SAN FRANCISCO CITY WIDE
#5
TOP 5
MEDIAN CONDOMINIUM VALUES
FEBRUARY 2024 / SAN FRANCISCO CITY WIDE
Pacific/Presidio Heights
Marina/Cow Hollow
Russian Hill
Buena Vista/Corona Heights
Alamo Square/NOPA
Cole Valley/Haight
Noe Valley
Castro/Duboce Triangle
Lower Pacific/Laurel Heights
Richmond/Lake St
Mission Dolores
Hayes Valley
South Beach/Yerba Buena
North Beath/Fishermans Wharf
Dogpatch
Telegraph Hill
Nob Hill*
Bernal Heights/Glen Park
Mission
Mission Bay
Potrero Hill
Sunset
Bayview/Hunters Point
Diamond Heights
Sources: SFAR MLS & BrokerMetrics; Property types covered: Condos/TIC/Co-Ops. Only property data posted on the MLS is covered. All information is deemed reliable, but not guaranteed for accuracy. All data is subject to errors, omissions, revisions, and is not warranted. ©2024 Vanguard Properties. All rights reserved. Equal Housing Opportunity. DRE No. 01486075 NEIGHBORHOOD
SOMA
AVG SOLD PRICE $1,600,000 $1,500,000 $1,462,000 $1,450,000 $1,404,500 $1,400,000 $1,350,000 $1,295,000 $1,250,000 $1,217,500 $1,217,000 $1,210,000 $1,175,000 $1,070,000 $1,055,000 $1,050,000 $1,049,000 $1,025,000 $980,000 $975,000 $975,000 $950,000 $752,500 $729,000 $644,000 $ / SQ. FT. $1,093 $1,141 $1,092 $985 $966 $1,034 $1,051 $1,085 $1,015 $925 $1,026 $1,015 $1,053 $978 $1,039 $997 $950 $866 $859 $1,004 $1,056 $926 $772 $666 $824 AVG % OF LIST PRICE RECV’D 99.6% 100.4% 98.7% 100.8% 102.5% 103.8% 102.3% 101.2% 101.9% 101.7% 99.2% 100.4% 96.0% 98.9% 98.7% 99.4% 97.6% 100.2% 100.4% 98.8% 101.1% 101.5% 98.4% 100.1% 98.5% HOMES SOLD 141 81 76 47* 78 62 90 93 50 100 47* 63 236 34* 39* 34* 91 39* 104 63 50 29* 110 27* 28*



COLLEEN COTTER 415.706.1781 colleen@colleencottersf.com BRE Lic. #01703078 ZOE FRANKEL 415.235.9422 zoefrankel@vanguardsf.com DRE Lic. #02134477 Contact colleencottersf.com 1801 Filmore Street | San Francisco, CA 94115


 2623 DIVISADERO STREET PACIFIC HEIGHTS / $7,235,000


 2226 GREEN STREET


