

JHC Performance Report 2
The NOAA-UNH Joint Hydrographic Center (JHC/CCOM) was founded twenty-four years ago with the objective of developing tools and offering training that would help NOAA and others meet the challenges posed by the rapid transition from from the sparse measurements of depth offered by traditional sounding techniques (lead lines and single-beam echo sounders) to the massive amounts of data collected by the new generation of multibeam echo sounders. Over the years, the focus of research at the Center has expanded and now encompasses a broad range of ocean mapping technologies and applications, but at its roots, the Center continues to serve NOAA and the nation through the development of tools and approaches that support safe navigation, increase the efficiency and effectiveness of coastal and ocean mapping and surveying, offer a range of value-added ocean mapping products, and ensure that new generations of hydrographers and ocean mappers receive state-of-the-art training.
An initial goal of the Center was to find ways to process the massive amounts of data generated by multibeam and sidescan sonar systems at rates commensurate with data collection; that is, to make the data ready for chart production as rapidly as the data were collected. We have made great progress over the years in attaining, and now far surpassing this goal, and while we continue our efforts on data processing in support of safe navigation, our attention has also turned to the opportunities provided by this huge flow of information to create a wide range of information and products that meet needs beyond safe navigation as well as meet the goals of the National Ocean Mapping Exploration and Characterization Strategy (e.g., marine habitat assessments, gas seep detection, fisheries management, disaster mitigation, and national security). Our approach to extracting “value added” from data collected in support of safe navigation was formalized with the enactment on the 30th of March 2009 of the Ocean and Coastal Mapping Integration Act. In 2010 the concept of IOCM was clearly demonstrated when we were able to quickly and successfully apply tools and techniques developed for hydrographic and fisheries applications to the Deepwater Horizon oil spill crisis.
In the time since our establishment, we have built a vibrant Center with an international reputation as the place, “where the cutting edge of hydrography is now located,” (Adam Kerr, Past Director of the International Hydrographic Organization in Hydro International). In the words of Pat Sanders, then President of HYPACK Inc., a leading provider of hydrographic software to governments and the private sector,
JHC/CCOM has been THE WORLD LEADER in developing new processing techniques for hydrographic data. JHC/CCOM has also shown that they can quickly push new developments out into the marketplace, making both government and private survey projects more efficient and cost effective.
Since our inception, we have worked on the development of automated and statistically robust approaches to multibeam sonar data processing. These efforts came to fruition when our automated processing algorithm (CUBE) and our new database approach (The Navigation Surface, the theoretical basis of the National Bathymetry Source project at NOAA), were, after careful verification and evaluation, accepted by NOAA, the Naval Oceanographic Office, and many other hydrographic agencies, as part of their standard processing protocols. Today, almost every hydrographic software manufacturer has incorporated these approaches into their products. It is not an overstatement to say that these techniques have revolutionized the way NOAA and others in the ocean mapping community do hydrography. These new techniques can reduce data processing time by a factor of 30 to 70 and provide a quantification of uncertainty that had never previously been achievable in hydrographic data. The result has been: “gained efficiency, reduced costs, improved data quality and consistency, and the ability to put products in the hands of our customers faster.” (Capt. Roger Parsons, former NOAA IOCM Coordinator and Director of NOAA’s Office of Coast Survey).
The acceptance of CUBE and the Navigation Surface represented a paradigm shift for the hydrographic community—from dealing with individual soundings (reasonable in a world of lead line and single-beam sonar measurements) to the acceptance of gridded depth estimates (with associated uncertainty values) as a starting point for hydrographic products. The use of gridded bathymetry is fundamental to the National Bathymetric Source, the BAG file format (also supported since inception from the Center), S-102 (based on the BAG file format), NOAA’s Precision Navigation project, and the next generation of S-100 products now being generated by NOAA Marine Chart Division for IMO carriage requirements starting (optionally) in 2026. The research needed to support this paradigm shift has been a focus of the Center since its inception and to now see it accepted is truly rewarding.
31 January 2024 3
Executive Summary
Executive Summary
It is also indicative of the role that the Center has played and will continue to play, in establishing new directions in hydrography and ocean mapping. The second generation of CUBE, CHRT (CUBE with Hierarchical Resolution Techniques) which supports variable resolution grids, has been introduced to the hydrographic community and the innovative approach that CUBE and CHRT offer are now being applied to high-density topobathy lidar data, incorporating new concepts of machine learning/artificial intelligence, and preparing for cloud-based deployment.
Another long-term theme of our research efforts has been our desire to extract information beyond depth (bathymetry) from the mapping systems used by NOAA and others. We developed a simple-to-use tool (GeoCoder) that generates a sidescan-sonar or backscatter “mosaic,” a critical first step in the analysis of seafloor character. NOAA and many of our industrial partners have now incorporated GeoCoder into their software products. Like CUBE’s role in bathymetric processing, GeoCoder has become the standard approach to backscatter processing. An email from a member of the Biogeography Branch of NOAA’s Center for Coastal Monitoring and Assessment said,
We are so pleased with GeoCoder! We jumped in with both feet and made some impressive mosaics. Thanks so much for all the support.
While GeoCoder is focused on creating backscatter mosaics, BRESS (Bathymetry- and Reflectivity-based Estimator of Seafloor Segments) provides tools for the segmentation and analysis of co-located bathymetry and backscatter, dividing the seafloor into a limited number of contiguous areas of similar morphology (land- or geoforms) and backscatter. This tool has found broad application in NOAA and others interested in defining seafloor habitat. BRESS is one of many tools developed at the Center that now form part of HydrOffice—an open-source collaborative effort led by the Center, in collaboration with NOAA, to develop a research software environment with applications to facilitate all phases of the ping-to-chart process. The environment facilitates the creation of new tools for researchers, students, and for those in the field; and can speed up both algorithm testing and the transfer from Research-to-Operation (R2O). Many of these tools are in daily use by NOAA field units, as well as scientists and researchers world-wide.
Beyond GeoCoder, BRESS and the other HydrOffice tools, our efforts to support the IOCM concept of "map once, use many times" are also coming to fruition. Software developed by Center researchers has been installed on several NOAA fisheries vessels equipped with Simrad ME70 fisheries multibeam echo sounders. These sonars were originally designed for mapping pelagic fish schools but, using our software, the sonars are now being used for multiple seabed mapping purposes. For example, data collected on the NOAA Ship Oscar Dyson during an acoustic-trawl survey for walleye pollock was opportunistically processed for seabed characterization in support of essential fish habitat (EFH) and also in support of safety of navigation, including submission for charts and identification of a Danger to Navigation. Seafloor mapping data from the ME70 was used by fisheries scientists to identify optimal sites for fish-traps during a red snapper survey. Scientists on board the ship said that the seafloor data provided by Center software were "invaluable in helping accomplish our trapping objectives on this trip." These tools are now being transitioned to our industrial partners so that fully supported commercial-grade versions of the software are available to NOAA. All of these examples (CUBE, GeoCoder, HydrOffice, and our fisheries sonar tools) are tangible examples of our (and NOAA’s) goal of bringing our research efforts to operational practice (Research to Operations—R2O).
Ed Saade, while President of Fugro (USA) Inc., said in a statement for the record to the House Transportation and Infrastructure Subcommittee on Coast Guard and Maritime Transportation and Water Resources and Environment1,
…R&D/Innovation initiatives at UNH CCOM JHC, have combined to be the leading technologies creators, developing Multibeam Echo Sounder (MBES) and related applications and improvements that have ultimately been adopted and applied, and which have extensively benefitted industry applications. Since the early 2000s, a small sampling list of such applications includes
1 Hearing on Federal Maritime Navigation Programs: Interagency Cooperation and Technological Change 19 September 2016. Fugro is the world’s largest survey company with more than 11,000 employees worldwide.
JHC Performance Report 4
TrueHeave™, MBES Snippets, and Geocoder. This small sampling of applications integrated, into various seabed mapping industries in the United States alone, directly benefits more than $200 million of mapping services annually.
The tools and products of the Center were also called upon to help with an international disaster—the mysterious loss of Air Malaysia Flight MH370. As part of our Nippon Foundation/GEBCO Bathymetric Training Program researchers and students in the Center had compiled all available bathymetric data from the Indian Ocean. When MH370 was lost, the Government of Australia and several major media outlets came to the Center for the best available representations of the seafloor in the vicinity of the crash. The data we provided were used during the search and were displayed both on TV and in print media.
In the last decade, a new generation of multibeam sonars has been developed (in part, an outgrowth of research done at the Center) with the capability of mapping targets in the water-column as well as the seafloor. We have been developing visualization tools that allow this water-column data to be viewed in 3D in real-time. Although the ability to map 3D targets in a wide swath around a survey vessel has obvious applications in terms of fisheries targets (and we are working with fisheries scientists to exploit these capabilities), it also allows careful identification of shallow hazards in the water column and may obviate the need for wire sweeps or diver examinations to verify least depths in hydrographic surveys. These water-column mapping tools were a key component to our efforts to map submerged oil and gas seeps and monitor the integrity of the Macondo 252 wellhead as part of the national response to the Deepwater Horizon oil spill. The Center’s seep-mapping efforts continue to be of national and international interest as we begin to use them to help quantify the flux of methane into the ocean and atmosphere. The initial water-column studies funded by this grant have led to many new opportunities including follow-up work funded by the National Science Foundation, the Office of Naval Research, the Department of Energy, and the Sloan Foundation.
The tools and techniques that we had to quickly develop to find oil and gas in the water column during the Deepwater Horizon disaster have led to important spinoffs in the industrial sector. Again, citing Ed Saade’s statement for the record to the House Transportation and Infrastructure Subcommittees,
More recently, the most significant ground-breaking technology discovery is based on the combination of MBES bathymetry, backscatter, and water column collection/detection applications. Initial applications were for a variety of reasons and disciplines, mostly scientific in nature as led by UNH CCOM JHC. These capabilities were quickly recognized by industry experts as new technologies with a variety of applications in the ocean mapping industry, including fisheries, aggregate materials surveys, various engineering design studies, and oil and gas exploration applications.
An initial cost-benefit analysis of the impact in just the oil and gas exploration industry yields the following findings:
• Detection of Seabed Seeps of Hydrocarbons: During the past decade, the utilization of MBES for bathymetry, backscatter, and water column mapping has been directly applied to the detection, precise location, and analysis of seabed gas and oil seeps, mostly in deep water hydrocarbon basins and frontier areas. This scientific application of the methods discovered and perfected under the leadership of NOAA NOS OCS and the CCOM/JHC has been embraced and applied by companies and projects in the United States specifically to aid in the successful exploration and development of oil and gas reserves in water depths exceeding 10,000 feet. These studies provide a service to find seeps, evaluate the seeps chemistry, and determine if the seeps are associated with significant reservoir potential in the area of interest. This information is especially useful as a means to “de-risk” the wildcat well approach and ensure a greater possibility of success. It should be noted that many of the early terrestrial fields used oil seeps and geochemistry to help find the commercial payoffs. This was the original method of finding oil globally in the first half of the 20th century onshore and along the coastline. Estimates run into the millions of barrels (billions of dollars) of oil directly related to, and confirmed by, the modern MBES based seep hunting methodology.
31 January 2024 5 Executive Summary
Executive Summary
• It is estimated that the current USA-based annual revenue directly related to operating this mapping technology is $70 million per year. Note that this high level of activity continues today, despite the current extreme downturn in the offshore oil and gas industry. The seepsrelated industry is expected to grow at an annualized rate of 25% per year. Globally, this value projects to be nearly double, or approximately $130 million per year.
Our ability to image targets in the water column has now gone beyond mapping fish and gas seeps. Over the past few years, we have demonstrated the ability of both multibeam and broadband single beam echo-sounders to image fine-scale oceanographic structure including thermohaline steps (an indicator of the process of mixing between two water masses with different properties and an important mechanism of heat transfer in the ocean), internal waves, turbulence, and the depth of the mixed layer (the thermocline). Recently, our water column imaging tools have been able to map the depth of the oxygen minimum in the Baltic Sea. This opening of a new world of “acoustic oceanography” with its ability to map ocean structure over long-distance from a vessel while underway, has important ramifications for our ability to understand and model processes of heat transfer in the ocean as well as our understanding of the impact of the water column structure on seafloor mapping.
As the capabilities of our sonars and processing tools evolve, we are also looking at approaches to collecting data that will decrease costs, increase efficiency, increase offshore safety and lower carbon footprints. Foremost among these is the use of “autonomous” or “uncrewed” surface vehicles (ASVs or USVs) as platforms for collecting mapping and other data. The Center has become a global leader in the evaluation of innovative uses of USVs in support of seafloor and water column mapping data as well as in a broad range of ocean exploration operations. We currently own and operate several USVs and work closely with our industrial partners to develop new USV-related approaches, tools, and applications and with NOAA as they expand their own USV capabilities. The Center’s success in this area has recently been recognized with the establishment by Exail Technologies, a major international manufacturer of USVs, of the Exail-UNH Maritime Autonomy Innovation Hub in Durham, NH. (Figure ES-1).
We are looking closely at the capabilities and limitations of other sensors that might provide efficient means of collecting bathymetric data like airborne laser bathymetry (lidar), satellite-derived bathymetry (SDB) and the

JHC Performance Report 6
Figure ES-1. Larry Mayer, Director of the UNH Center For Coastal and Ocean Mapping; Maggie Hassan, U.S. Senator; Marine Slingue, Exail President for North America Civil and Space; Nicole Leboeuf, NOAA Assistant Administrator for the National Ocean Service; James Dean, UNH President; Sebastien Grall, Exail Director of Maritime Autonomy, stand in front of the DriX USV at the UNH Judd Gregg Marine Research Complex in New Castle, NH during the announcement of the opening of the Exail Maritime Autonomy Innovation Hub. Photo by Robert Zielinski.
new ICESat-2 satellite. The Center is also bringing together many of the tools and visualization techniques we have developed to explore what the chart of the future may look like and provide research in support of NOAA’s Precision Navigation efforts including the potential role of virtual and augmented reality for data processing and more directly in the future of navigation.
The value of our visualization, water-column mapping, and digital cartography capabilities have also been demonstrated by our work with Stellwagen Bank National Marine Sanctuary aimed at facilitating an adaptive approach to reducing the risk of collisions between ships and endangered North Atlantic right whales in the sanctuary. We have developed 4D (space and time) visualization tools to monitor the underwater behavior of whales and notify vessels of whales in the shipping lanes and to monitor and analyze vessel traffic patterns. Describing our interaction with this project, the director of the Office of National Marine Sanctuaries said
…I am taking this opportunity to thank you for the unsurpassed support and technical expertise that the University of New Hampshire’s Center for Coastal and Ocean Mapping/NOAA-UNH Joint Hydrographic Center provides NOAA’s Office of National Marine Sanctuaries. Our most recent collaboration to produce the innovative marine conservation tool WhaleAlert is a prime example of the important on-going relationship between our organizations. WhaleAlert is a software program that displays all mariner-relevant right whale conservation measures on NOAA nautical charts via iPad and iPhone devices. The North American right whale is one of the world’s most endangered large animals, and its protection is a major NOAA and ONMS responsibility. The creation of WhaleAlert is a major accomplishment as NOAA works to reduce the risk of collision between commercial ships and whales, a major cause of whale mortality.
…WhaleAlert brings ONMS and NOAA into the 21st century of marine conservation. Its development has only been possible because of the vision, technical expertise, and cooperative spirit that exists at CCOM/JHC and the synergies that such an atmosphere creates. CCOM/ JHC represents the best of science and engineering, and I look forward to continuing our highly productive relationship.
Understanding the concerns about the potential impact of anthropogenic sound on the marine environment, we have undertaken a series of studies aimed at quantifying the radiation patterns of our mapping systems. These experiments, carried out at U.S. Navy acoustic ranges, have allowed us to determine the ensonification patterns of our sonars, and—using the hydrophone arrays at the ranges—to quantitatively track the feeding behavior of sensitive marine mammals (Cuvier’s beaked whales) during the mapping operations. The results of these studies, now published in peer-reviewed journals, have offered direct evidence that the mapping sonars we used do not change the feeding behavior of these marine mammals nor displace them from the local area. Hopefully, these studies will provide important science-based empirical information for guiding future regulatory regimes.
Statements from senior NOAA managers and the actions of other hydrographic agencies and the industrial sector provide clear evidence that we are making a real contribution to NOAA, the nation, and the international community. We will certainly not stop there. CUBE, the Navigation Surface, GeoCoder, water column mapping, support of precision marine navigation, our ASV efforts, and HydrOffice offer frameworks upon which innovations are being built, and new efficiencies gained. Additionally, these achievements provide a starting point for the delivery of a range of hydrographic and non-hydrographic mapping products that set the scene for many future research efforts.
Since 2005, the Center has been funded through a series of competitively awarded Cooperative Agreements with NOAA. The most recent of these, which was the result of a national competition, funded the Center for the period of January 2021 through December 2025. This document summarizes the highlights of this NOAAfunded effort during calendar year 2023, the third year of the current grant. Throughout this executive summary, links will be provided to more detailed descriptions of the projects briefly mentioned here. These more detailed reports as well as executive summaries and full reports on our previous years’ efforts can be found at our website, ccom.unh.edu/reports
31 January 2024 7 Executive Summary
Highlights from Our 2023 Program
This report represents the progress during the second year of effort on NOAA GRANT NA20NOS4000196. The overall objectives were specified in The Notice of Funding Opportunity (NOFO) under which the new grant was funded and are outlined in three programmatic priorities:
Advance Technology to Map U.S. Waters
Advance Technology for Digital Navigation Services
Develop and Advance Marine Geospatial and Soundscape Expertise
Under these, three sub-themes and 20 specific research requirements were defined:
Advance Technology to Map U.S. Waters
A. DATA ACQUISITION
1. Improvement in the effectiveness, efficiency, and data quality of acoustic and lidar bathymetry systems, their included backscatter and reflectance capabilities, their associated vertical and horizontal positioning and orientation systems, and other sensor technologies for hydrographic surveying and ocean, coastal, and Great Lakes mapping.
2. Improvement in the understanding and integration of other sensor technologies and parameters that expand the efficiency and effectiveness of mapping operations, such as water column and sub-bottom profiling.
3. Improvement in the operation and deployment of unmanned systems for hydrographic and other ocean mapping and similar marine domain awareness missions. Enhancements in the efficiency and hydrographic and related data acquisition capability of unmanned systems in multiple scenarios including shore-based and ship-based deployments and in line-of-sight and over-the-horizon operation and long duration autonomous ocean and coastal mapping data acquisition operations.
4. Improvement of autonomous data acquisition systems and technologies for unmanned vehicles, vessels of opportunity, and trusted partner organizations.
B. DATA VALUE
5. Improvement in technology and methods for more efficient data processing, quality control, and quality assurance, including the determination and application of measurement uncertainty, of hydrographic and ocean and coastal mapping sensor and ancillary sensor data including data supporting the identification and mapping of fixed and transient features on the seafloor and in the water column and the resolution of unverified charted features.
6. Development of improved tools and processes for assessment, processing, and efficient application of ocean mapping data from emerging sources such as drones, cameras and optical sensors, satellites, and volunteer/crowd-sourced observing systems to nautical charts and other ocean and coastal mapping and coastal hazard products.
7. Application of artificial intelligence, cloud services, and machine learning to the processing and analysis of hydrographic and coastal and ocean mapping data from both established and emerging sources, as well as to data from associated systems such as water level and current sensors, and from regional and global precise positioning networks.
C. RESOURCES OF THE CONTINENTAL SHELF
8. Advancements in planning, acquisition, and interpretation of continental shelf, slope, and rise seafloor mapping data, particularly for the purpose of delimiting the U.S. Extended Continental Shelf and mapping the resources of the seabed.
JHC Performance Report 8 Executive Summary
9. Adoption and improvement of hydrographic survey and ocean mapping technologies, including the development of potential new approaches and technologies, in support of mapping the Exclusive Economic Zone and of “Blue Economy” activities in U.S. waters such as offshore mineral and resource exploration, renewable energy development, coastal hazard planning, and the responsible management of U.S. living marine resources.
10. New approaches to the delivery of bathymetric services, including, among others, elevation models, depth comparisons and synoptic changes, model boundary conditions, and representative depths from enterprise databases such as the National Bathymetric Source and national geophysical archives.
Advance Technology for Digital Navigation Services
11. Development of innovative approaches and concepts for electronic navigation charts and for other tools and techniques supporting precision navigation such as chart display systems, portable pilot units and prototypes that are real-time and predictive, are comprehensive of all navigation information water levels, charts, bathymetry, models, currents, wind, vessel traffic, etc.), and support the decision process (e.g., efficient voyage management and under keel, overhead, and lateral clearance management) in navigation scenarios.
12. Development of improved methods for managing hydrographic data and transforming hydrographic data and data in enterprise databases to electronic navigational charts and other operational navigation products, particularly in the context of the new S-100 framework and family of associated data standards.
13. Development of new approaches for the application of spatial data technology and cartographic science to hydrographic, ocean and coastal mapping, precision navigation, and nautical charting processes and products.
14. Application of hydrodynamic model output to the improvement and development of data products and services for safe and efficient marine navigation.
15. Improvement in the visualization, presentation, and display of hydrographic and ocean and coastal mapping data, vessel data, and other navigational support information such as water levels, currents, wind, and data model outputs for marine navigation. This would include real-time display of mapping data and 4-dimensional high-resolution visualization of hydrodynamic model output (water level, currents, temperature, and salinity) with associated model uncertainty and incorporate intelligent machine analysis and filtering of data and information to support precision marine navigation.
16. Development of approaches for the autonomous interpretation and use of hydrographic and navigational information, including oceanographic and hydrodynamic models in advanced systems such as minimally staffed and unmanned vessels.
Develop and Advance Marine Geospatial and Soundscape Expertise
17. Development, evaluation, and dissemination of improved models and visualizations for describing and delineating the propagation and levels of sound in the water from acoustic devices including echosounders, and for modeling the exposure of marine animals to propagated echosounder energy. Improvements in the understanding of the contribution and interaction of echo sounders and other ocean mapping-related acoustic devices to/with the overall ocean and aquatic soundscape.
18. Development, maintenance, and delivery of advanced curricula and short courses in hydrographic and ocean mapping science and engineering at the graduate education level, leveraging to the maximum extent the proposed research program and interacting with national and international professional bodies to bring the latest innovations and standards into the graduate educational experience for both full-time education and continuing professional development.
31 January 2024 9 Executive Summary
Executive Summary
19. Effective delivery of research and development results through scientific and technical journals and forums and transition of research and development results to an operational status through direct and indirect mechanisms including partnerships with public and private entities.
20. Public education, visualization tools, and outreach to convey the aims and enhance the application of hydrography, nautical charting ocean coastal and Great Lakes mapping and related hydrodynamic models to safe and efficient marine navigation and coastal resilience.
Many of these programmatic priorities and research requirements are consistent with those prescribed under earlier grants while several new directions are prescribed. Thus, the research being conducted under the current (2021-2025) grant represents a combination of the continuation of on-going research with the initiation of several new research efforts.
To address the three programmatic priorities and 20 research requirements, the Center divided the research requirements into components, themes, and sub-themes, and responded to the NOFO with 46 individual research tasks—each with an identified investigator or group of investigators as the lead (Figure ES-2). These research tasks are constantly being reviewed by Center management and the Program Manager, and are adjusted as tasks are completed, merged as we learn more about the problem, or modified due to changes in personnel. This year, as we approached the half-way mark of the grant period, the research team and Program Manager agreed to a series of mid-course adjustments to the tasks (Figure ES-3). Major adjustments include:
• The combination of Task 4 (Environmental Monitoring) and Task 7 (Water Column Mapping) into a single Task 4 (Environmental Monitoring and Water Column) under the leadership of PI John Hughes Clarke.
• The replacement of PI Tom Weber (who moved on to a position at the Office of Naval Research) on Task 5 (New Sensors) with new faculty member Tom Blanford.
• The removal of Task 6 (Lidar Systems—Brian Calder and Chris Parrish as PIs) which had been subcontracted to Chris Parrish as OSU. This work will be directly funded by NOAA at OSU.
• The removal of Task 7 (as explained above—combined with Task 4).
• The combination of the many ASV-related tasks (9 through 14, plus 21 and 42) into a single ASV Task 9 to reduce the complexity of reporting.
• The combination of Tasks 26 (Ocean Mapping Data Analytics) and Task 38 (Artificial Intelligence and Machine Learning for Analysis and Filtering) into a single Task 26 under the leadership of PI Kim Lowell.
• The removal of Task 35 (Application of Hydrodynamic Models to Navigation Products) as its efforts are being covered under Task 4 (Environmental Monitoring), Task 32 (Innovative Approaches to Support Precision Navigation), and Task 36 (Tools for Visualizing Complex Ocean Data Sets) under the leadership of John Hughes Clarke (Task 4) and Tom Butkiewicz (Tasks 32 and 36).
• Finally, a small reduction in the budget for FY2024 will require a small reduction in effort which has led to the following actions:
• Removal of a Post-Doc under the Water Column task (orginally Task 7, now Task 4).
• OSU component of the Florida field work program of Task 29 (Management of Living Marine Resources from ECS including ICESat-2) has been removed.
• Reduction in ASV activities by dropping the Autonomous Sonar task (originally Task 14—now part of Task 9), the microUAS Mapping for Safety of Navigation task (originally Task 21—now part of Task 9) and the Semantic Understanding of Nautical Charts for Autonomous Navigation task (orginally Task 42). While these efforts have been removed as explicit tasks, should funding levels be increased, discussions will be held with the Program Manager to see if these areas should be re-instated.
JHC Performance Report 10

Figure ES-2. Original breakdown of Programmatic Priorities and Research Requirements of NOFO into individual projects or tasks with short-description name and PIs’ initials. Task numbers are shown on far right.
31 January 2024 11 Executive Summary


In this report, we attempt to summarize the status of the major task efforts of 2023 within the context of the programmatic priorities; more detailed discussions of these activities (as well as descriptions of the Center’s facilities and other informative appendices) can be found through the links provided on the Center’s webpage at ccom.unh.edu/reports
JHC Performance Report 12 Executive Summary
Figure ES-3. Adjusted task list: Tasks combined; Tasks removed; Effort reduced
Programmatic Priority 1
ADVANCE TECHNOLOGY TO MAP U.S. WATERS
The first and by far the largest programmatic priority defined by the Notice of Funding Opportunity (NOFO) that was the basis for the Center’s grant, focuses on the broad category of advancement of technology for mapping U.S. waters. Under this programmatic priority are three components (Data Acquisition, Data Value and Resources of the Continental Shelf) and within each of these components there are numerous research requirements reflecting the range of technologies and approaches used for ocean mapping. Below are brief summaries of some of the research tasks being undertaken to address these requirements; more detail is provided in the full progress report.
DATA ACQUISITION
Task 1: System Performance Assessment
Multibeam Assessment Tools
The “total cost of ownership” (TCO) for hydrographic data—which includes not only the physical cost of collecting the data, but also the processing costs subsequent to initial collection—increases significantly as problems are detected further from the point of collection. Thus, we have long focused on the development of tools to monitor data in real-time, or to provide better support for data collection and quality monitoring which have the potential

31 January 2024 13 Executive Summary
Figure ES-4 Example of web-based resources -- the MAC SAT/QAT checklist provides mapping system operators with a standardized performance assessment workflow that can be adapted to the vessel’s testing goals and operational constraints.
Executive Summary
to significantly reduce the TCO, or at least provide better assurance that no potentially problematic issues exist in the data before the survey vessel leaves the vicinity. These developments have been leveraged by our work with the Multibeam Advisory Committee (MAC), an NSF-sponsored project aimed at providing fleet-wide expertise in systems acceptance, calibration, and performance monitoring of the UNOLS fleet’s multibeam mapping systems.

Figure ES-5. Swath Accuracy Plotter, one of many of data assessment tools, displays the distribution of soundings (gray points) relative to a reference surface (right image) when results are complicated by severe refraction (e.g., downward curves with increasing beam angle, as shown in the top left image). In the bottom left image, the mean bias trend (red line) is "flattened’ to better portray the standard deviations of soundings (blue line) across the swath while preserving a mean bias value calculated from a region near nadir (-0.04% of water depth in this case).
Since 2011, the MAC has performed systems acceptance and routine quality assurance tests, configuration checks, software maintenance, and self-noise testing for the U.S. academic research fleet. They have also developed a series of assessment tools and bestpractices guidelines available to the broad community via web-based resources (e.g., Figure ES-4). These processes, software tools, and procedures are also applicable to many of the mapping systems in the NOAA fleet, as well as the systems installed aboard commercial and non-profit survey and exploration vessels. This year, efforts included the continued development of an Ocean Mapping Community Wiki to publicly share best practices, highlight technical resources, and address common challenges; open-source multibeam echo sounder assessment tools to provide specific metrics of performance (Figure ES-5); a new multibeam test site database to help mappers find proven assessment sites that are suitable for their systems and schedules; and new enhancements to the increasing popular and the widely-used Sound Speed Manager (Figure ES-6). Center personnel presented these topics to a variety of technical audiences in 2023, including U.S. and international conferences of marine technicians, managers, and field experts.

A more detailed report on these efforts can be found at pressbooks.usnh.edu/2023-jhctask-narratives/chapter/task-1

Figure ES-6. Sound Speed Manager now has the capability to group per-day the sound speed profiles stored in the internal database and visualize them to ease assessment of the temporal variability along the water column.
JHC Performance Report 14
State of the Art Sonar Calibration Facility
We continue to work closely with NOAA and the manufacturers of sonar and lidar systems to better understand and calibrate the behavior of the sensors used to make the hydrographic and other measurements used for ocean mapping. Many of these take advantage of our unique acoustic test tank facility—the largest of its kind in New England, and now equipped with state-of-the-art test and calibration facilities. Upgrades to the calibration facility made by the Center include continuous monitoring of water temperature and sound speed; a computer-controlled standard target positioning system (z-direction); a custom-built vertical position-


ing system for the standard reference hydrophone (Reson TC4034); and the capability for performing automated 2D beam-pattern measurements (coupled and decoupled transmit and receive). This facility is routinely used by Center researchers for now-routine measurements of beam pattern, driving point impedance, transmitting voltage response (TVR), and receive sensitivity (RS). Figure ES-7 shows systems calibrated at the facility in 2023.


Further details of the facility and the systems tested can be found at pressbooks.usnh.edu/2023-jhc-tasknarratives/chapter/task-1


31 January 2024 15 Executive Summary
Figure ES-7. Tests in the acoustic tank in 2023. Top left: MITRE hydrophone array; Top center: Kongsberg EM 2040 sonar; Top right: Kongsberg Dual M3 sonar; Middle Left: Reson T51-R sonar; Middle center: Edgetech 216 transducer; Middle right: BlueRobotics Ping2 transducer; Bottom left: MITRE multi-channel array; Bottom center: MIT/LL hydrophone array; Bottom right: MIT/LL laser source acoustic evaluation.
Executive Summary
Task 2: Underway Sensor Integration
While the tools described above are focused on assessing the overall performance of multibeam sonar systems, we are also pursuing research aimed at understanding the causes of degradation of data quality that are the result of imperfect integration of the observed position and orientation of the sonar and the vessel. Among these is the development of the Rigorous Inter-Sensor Calibrator (RISC), the Ph.D. work of graduate student Brandon Maingot. RISC works by doing non-linear least-squares estimation of six (at present) potential integration errors using a finite window of data that extends for a few ocean-wave periods. Within that window, the “true” seafloor is assumed to be a smooth surface and any beam’s depth departure from that surface is used as a measure of the mismatch due to the six unknowns. Following field testing of the RISC algorithm in 2022 (see last year’s report at ccom.unh.edu/reports), Maingot has been optimizing the RISC tool (Figure
ES-8). In September 2023, he defended his Ph.D. proposal and is currently working on papers to incorporate in his thesis with a defense planned for spring 2024. Notably, the one integration issue that has been the most elusive for the RISC algorithm is the improper application of surface sound speed and the associated beam steering errors. This is because—unlike the other six integration errors modelled—the sound speed error is not a constant, but rather changes with the oceanography. The impact of sound speed variations is being further explored in the river plume modelling by Ph.D. student Indra Prasetyawan, and the algorithmic developments utilizing continuous surface sound speed mapping by M.S. student Daniel Leite (see Task 4).

Further information about this work can be found at pressbooks.usnh. edu/2023-jhc-task-narratives/ chapter/task-2

JHC Performance Report 16
Figure ES-8. Improvements being implemented by Brandon Maingot in the RISC algorithm.
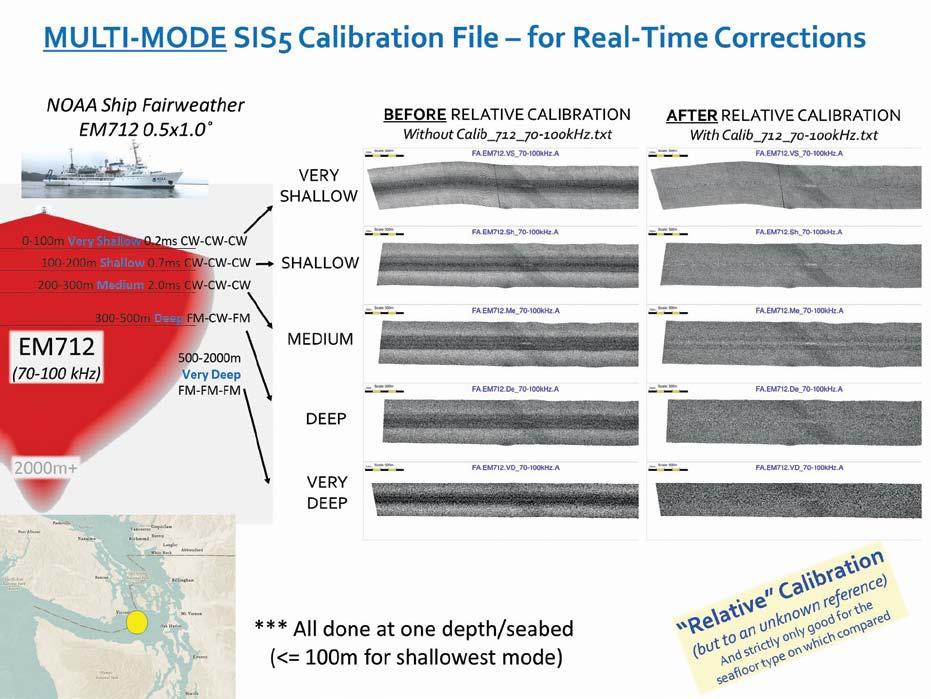
Figure ES-9. Original data collected (center) for each of the five modes of the 70-100 kHz frequency range. After intersector and inter-mode balancing to an arbitrary reference, the resulting data (right column) is illustrated. This was done by creating a Calib_712_70-100kHz.txt file for entry into the transceiver.
Task 3: Backscatter Calibration
The collection of acoustic backscatter data continues to be an area of active interest across the research, industrial, and national security communities for its ability to infer characteristics of the seafloor. The large swaths and wide bandwidths of modern multibeam echo sounders (MBES) permit the user to efficiently collect co-registered bathymetry and seafloor backscatter at many angles and frequencies. However, the backscatter data collected by multibeam echo sounders is typically uncalibrated, limiting its useability to qualitative data products and comparison of one data set to another. The operational problem is that no two (nominally identical) multibeam systems provide the same estimate of the bottom backscatter strength. Even for a single instance of a multibeam system, as it changes mode (pulse length and sector-frequency combination), the estimate changes. Multibeam echo sounder calibration is not
a trivial task and continues to be a difficult hurdle in obtaining accurate and repeatable backscatter measurements. Towards this end, the Center continues to leverage its state-of-the art facilities to develop and test new backscatter calibration methodologies as well as develop new approaches to calibrating backscatter in the field.
Inter-Platform Cross Calibration
In the 2023 reporting period, we extended the calibration methodology previously applied to EM2040s (see last year’s report) to the EM710/712 systems operated by NOAA and others (CHS, UNB, UNOLS). Because of the lower frequency of the EM710/712, we needed to extend our test areas and associated reference data to deeper waters. A 100 m site was established along the border between the U.S. and Canada to minimize administrative issues and, in 2022, CSL Heron collected
31 January 2024 17 Executive Summary
Executive Summary
EM712 data using multiple modes. In April 2023, the NOAA Ship Fairweather used her EM712 to collect the equivalent set of mode data (Figure ES-9). For each of those modes, the mean backscatter variation by sonar or vertically referenced angle was collected for each sector (six in total, three per swath and dual swath).
While this achieves a relative inter-sector and inter-mode calibration specifically for the Fairweather’s system, there is no guarantee that equivalent data would be collected by another installation of the same model. To test this, the Heron EM712 data, as well as EM710-Mk2 data collected by the CCGS Vector in July 2023 were compared. While each system can achieve an internally consistent relative calibration, the inter-platform variations were significant. Notably, the EM710, running the old SIS-4 software and utilizing the .all format (as opposed to the newer .kmall) differed by about ~ 6 dB. The causes of these deviations are now under investigation.

that the vessel motion was degrading the quality of the reference data. This was a result of the rotation of the receiver relative to the orientation of the transmitter at time of transmission (Figure ES-10).
Toward Absolute Calibration
To address the need to have an absolute reference for each sonar installation, the method of building both angular and frequency dependance curves over reference areas with calibrated EK sonars, previously described in 2019 and 2020 reports, was extended to lower frequencies. In the deeper water made necessary by the use of lower frequencies, the anchoring and manual sonar rotation used in shallow water was no longer practical and so a method, previously developed by IFREMER, was adopted using underway collection and a pole-mounted mechanically rotating plate. For the deeper water data, however, it became apparent
In shallower water (< 30 m), the two-way travel time to the outermost bottom detections is very short (typically < 0.2 seconds) so for typical roll rates, these rotations are unimportant. However, at greater depths—such as the 100-400 m attempted here—and at lower grazing angles (<40 degrees), the latency between transmit and receive can be more than a second and, especially for rapidly rotating small vessels, the net result is that the Tx and Rx beam patterns can be offset by more than half of the nominal beam width (five degrees). Figure ES-10 illustrates this problem. With the problem identified, we can now work on finding an appropriate correction process.

Further details of the backscatter calibration work can be found at pressbooks.usnh.edu/2023-jhc-tasknarratives/chapter/task-3
JHC Performance Report 18
Figure ES-10. The mismatch between the phase zero-crossing (P: indicative of the orientation of the Rx) and the amplitude peak of the echo envelope (A: indicating the location of the mis-aligned product of the Tx and Rx beam patterns).
Fine-Grained and Suspended Sediments
Depending on the location and composition of the sediment, fine-grained sediments can contain a fluffy or fluid surficial gradient from millimeters to meters thick, which can significantly alter the backscatter signal in the tens to hundreds of kilohertz frequency range. In addition, the presence of this fluid layer complicates the navigation of surface and underwater vehicles, as well as the monitoring of coastal dredging operations. Therefore, a more fundamental understanding of surficial fine-grained geoacoustics is warranted. To address these issues, Gabe Venegas—with funding from the Office of Naval Research—has been the using microscopy, laboratory measurements, physics-based geoacoustic and scattering models, and publicly accessible databases to gain a fundamental understanding of the acoustic response of fine-grained sediments.
Task 4: Environmental Impacts on Hydrographic Data Quality
As the instruments we use to measure seafloor bathymetry and backscatter improve, we find that data quality is often degraded by local spatial or temporal changes in the oceanographic environment, including variations in the daily or seasonal thermocline, internal waves, turbulence, and the presence of bubbles under the hull. We have been developing techniques to image and model, in real-time, these phenomena so we can better understand their spatial and temporal variability, and those who collect hydrographic data can adapt their surveys or sampling programs to minimize the impact of these phenomena.
In 2023, the main accomplishments of this task were:
Understanding the Impact of Tidal Fronts on Bathymetric Data Quality
As part of a field program that addresses the goals of Tasks 2, 3, 8 and 30, repetitive surveys are being conducted of a smooth, mobile sand sheet off Portsmouth, NH. During these surveys, it has become apparent that the sound speed environment is the major limiting factor in achievable bathymetric accuracy. Originally, it was hoped that a rapidly dipping moving vessel profiler (MVP) would be the solution, but after twice losing the fish due to fishing gear hang-up, that approach was abandoned. Instead, manual CTD profiles were conducted at the end of every 3rd line (~ 30-minute intervals). Even that sampling, however, has been shown to be inadequate in capturing the temporal and spatial sound speed variability. In an attempt to better capture the variability, the continuously logged surface sound speed at the sonar was investigated and mapped. These data showed that over the duration of the survey (eight hours), there is often a distinct boundary in surface sound speed, whose position migrates across the area as the tide changes. Given that, it is not operationally possible to obtain sufficiently dense sound speed profiles, M.S. student Daniel Leite is developing a method to try and better control the interpolation between sparse sound speed profiles, based on the spatial gradient in the
surface sound speed. If this works, it may provide a relatively simple means of predicting its position and/or managing the rapid gradients that can be applied more broadly.
Predicting the Position of Tidal Fronts
To better understand the dynamics of the front impacting our data, Ph.D. student Indra Prasetyawan has developed a nested 3D baroclinic model extending from the Great Bay to about 5 km offshore. Because the freshwater discharge into the Piscataqua/Great Bay watershed is very low, this model recognizes that the plume is really just a slightly saltier, but often strongly thermally-distinct water mass that is derived from tidal mixing upstream in the estuary. Even though the plume is not well defined by salinity, the offshore boundary is distinct with very sharp fronts, as observed from vesselderived surface sound speed measurements and water column imaging. The model (Figure ES-11) is able to reproduce and explain the front dependence on both tidal magnitude (neap v. spring) as well as offshore winds.

Further details about Task 4 can be found at pressbooks.usnh. edu/2023-jhc-task-narratives/ chapter/task-4
31 January 2024 19 Executive Summary

ES-11. A single frame from the model that reproduces the circulation on August 4, 2022 during the eight-hour period when the RVGS was undertaking a multibeam survey. The actual surface sound speed measurements in half-hour windows are plotted in the lower right. The model’s prediction of the spatial structure of the plume from that same half hour epoch is shown in the center map.
Task 5: New Sensors
Potential enhancements to the ocean mapping community, such as higher quality data and new data products, can be generated by the development of new sensors. Developing new sensors can take many forms—from hardware architectures that enable high resolution echo sounding from new platforms to novel array geometries and sensing paradigms. In the current period, under the leadership of new research faculty member Tom Blanford, studies of two new sensors for bathymetric mapping have been initiated. The first study explores alternative hardware architectures for low-power, high resolution echo-sounders. The second study explores array designs for spatial coherence-based sensing of seafloor properties.
Low Cost – Low Power Echo Sounder Architectures
High resolution bathymetric mapping systems, such as multibeam echo sounders (MBES), typically have an array of hydrophones which receive echoes from the seafloor. These phased array sonar systems have banks of electronics which are both expensive and
power hungry. This is often a limiting factor to integrating high resolution acoustic sensors onto small autonomous platforms and vessels of opportunity. The Center is investigating low-power, low-cost, alterative hardware architectures, based on sigma-delta modulation, that could be used to digitize signals on arrays and process high quality bathymetric data. Currently this research is focused on studying how the properties of acoustic backscatter and piezoelectric hydrophones relate to sensitivities in the design of a sigma-delta conversion scheme.
Using Spatial Coherence for Seafloor Characterization
Spatial coherence describes the similarity of a field when it is sensed at different points in space. For acoustic echoes scattered by the seafloor, the spatial coherence contains information about the geoacoustic properties of the bottom. This information, however, has generally not been exploited for bathymetric processing. The Center is investigating the use of new active “constant beamwidth” acoustic sensors that could use the spatial coherence of seafloor
JHC Performance Report 20 Executive Summary
Figure
scattering to estimate properties describing the seafloor composition. A major advantage of this approach is that it could be conducted with uncalibrated, sparse arrays. The resulting sensor would be slightly more complex than a split-aperture echo sounder, but far simpler (and cheaper) than a multibeam echo sounder. Even if this pursuit of a novel sensor is ultimately unsuccessful, incorporating the understanding of spatial coherence into a MBES signal flow is likely to improve processing and geoacoustic parameter estimation capabilities.

Further details on these efforts can be found at pressbooks.usnh.edu/2023jhc-task-narratives/chapter/task-5
Task 6: Lidar Systems - Providing Both Bathymetry and Reflectance
While the lidar-based efforts covered under Task 6 will be transferred completely to Oregon State University in coming years, the effort was still covered under the JHC grant for 2023. In shallow water, lidar systems can be very effective in retrieving bathymetric information, particularly with the use of modern topobathymetric lidars, which have smaller beam footprints and higher repetition rates than the first generation bathymetric lidars. These systems have different properties than to
other lidars, and to acoustic mapping systems. Therefore, we are conducting research into how to estimate their uncertainty, and into early-stage processing methodologies to improve downstream processing performance. In the current reporting period, the Center worked with Christopher Parrish and collaborators at Oregon State University to focus primarily on the development of the Comprehensive Bathymetric Lidar Uncertainty Estimator tool (cBLUE), which computes an estimate of the horizontal and vertical uncertainty associated with topobathymetric lidar systems. This tool (Figure ES-12), which has been in development for the last six years, has been extended to incorporate a model for the Areté/Fugro PILLS/RAMMS system, has had a new command-line interface added so that it can be called as a component from other software systems (e.g., as part of a processing workflow), and is being updated to include newer lidar sensors in use by NOAA and the USACE. In addition, infrastructure changes within the code have improved handling of deeper water measurements, aided time synchronization, and positioned the system for easier maintenance by abstracting out the definition of the sensor to a user-editable file.

More information about this work can be found at pressbooks.usnh. edu/2023-jhc-task-narratives/chapter/ task-6.

31 January 2024 21 Executive Summary
Figure ES-12. (a) cBLUE graphical user interface (GUI); (b) cBLUE command line interface (CLI), which allows cBLUE to be called from other software, assisting with automatic lidar processing workflows.


Task 8: Subbottom Mapping
Subbottom profilers (SBP) traditionally have not been a survey instrument utilized by hydrographic agencies. However, given the objectives of the National Strategy for Ocean Mapping, Exploration, and Characterization (NOMEC), the ability to characterize the shallow subsurface will become increasingly important for a variety of applications such as wind farm siting, aggregate volume estimation, and delineation of ferro-manganese crusts.
Before the NOAA fleet can consider including SBP as part of their standard data collection procedures, there are technical challenges that need to be addressed to ensure that the collection of subbottom seismic reflection data does not compromise primary mission requirements. These include installation, interference, synchronization, crew disturbance, and required data management (including quality control and archiving). If these aspects can be overcome, SBP would add data value in support of a national seabed characterization program.
The goal of Task 8 is to assess and better understand new developments in SBP systems including chirp and parametric technologies in differing seafloor geologic settings. Of interest are variables such as beam width and stabilization, seismic reflector resolution, seabed penetration, heave compensation, impact (interference) on other survey equipment (e.g., multibeam echo sounders), and synchronization strategies.
JHC Performance Report 22
Executive Summary
Figure ES-13. Location map of the four reference sites identified for subbottom seismic profile systems sea trials. The reference sites are in the western Gulf of Maine off New Hampshire and northern Massachusetts. Each reference site represents different surficial geology and all have strong subsurface reflectors including a high-energy channel deposit (PHE), a large sand shoal (NSB), a paleodelta (MPD), and a muddy basin (SB).
Figure ES-14. Survey lines run during sea trials with the Knudsen 3260 chirp SBP (dashed white), Kongsberg Topas PS120 parametric SBP (blue lines), and Innomar Medium parametric SBP (orange lines). Note that all three SBP systems have multiple common lines in each reference site.
To accomplish this goal, four reference sites were identified in the western Gulf of Maine (WGOM) based on archived databases—including highresolution bathymetry, subbottom seismic reflection profiles, and sediment data. The four reference sites include a high-energy channel deposit (Portsmouth Harbor Entrance: PHE), a large sand shoal (Northern Sand Body: NSB), a paleodelta (Merrimack Paleodelta: MPD), and a muddy basin (Scantum Basin: SB) (Figure ES13). Use of the reference sites facilitates qualitative, but geologically informed, evaluations to be made for SBP systems, as well as other acoustic instruments.

Major activities during 2023 were the solicitation of partnerships with leading manufacturers and vendors of subbottom seismic systems, and the conducting joint field trials. Successful agreements were reached with Knudsen Engineering Limited (3260 Chirp SBP), Kongsberg Discovery (Topas PS120), and ECHO81 (Innomar Medium SBP). The Center provided ship time on the R/V Gulf Surveyor (RVGS), a Kongsberg EM2040P multibeam echo sounder (MBES), and standard high-resolution surveying support. The partners supplied SBP systems and technical expertise for the joint sea trials. Each SBP system was run along all or a subset of the target lines (Figure ES-14). Different settings were used to maximize the performance and integration of each system and to assess sources of interference. During the next reporting period, sea trials will continue with additional SBP systems. It is anticipated that an EdgeTech 3400 (chirp) and Kongsberg Topas PS40 will be added. Subsequently, each SBP system will be evaluated individually for factors such as interference, synchronization, sources of noise on the RVGS, and maximizing performance of the SBP systems.

A more detailed report on our subbottom trials can be found at pressbooks.usnh.edu/2023-jhc-tasknarratives/chapter/task-8
Tasks 9-14: Operation and Deployment of Uncrewed Surface Vessels
Even a casual perusal of trade magazines, conferences, and the engineering/scientific literature in the offshore survey sector makes it very clear that the use of autonomous or uncrewed surface vessels (USVs) is getting a lot of attention. In an effort to fully evaluate the promise of USVs for ocean and hydrographic surveying and to add relevant capabilities and practical functionalities to these vehicles with respect to survey applications, the Center has acquired—through purchase, donation, or loan—several USVs. The Bathymetric Explorer and Navigator (BEN), a C-Worker 4 vehicle, was the result of collaborative design efforts between the Center and ASV Global, LLC beginning in 2015 with delivery in 2016. Teledyne Oceanscience donated a Z-Boat USV in 2016, and Seafloor Systems donated an Echoboat in early 2018. A Hydronalix EMILY boat, donated by NOAA, is in the process of being refit. Finally, through other NOAA funding (OER-OECI), we purchased a DriX USV from iXblue (now Exail), Inc. in 2021.
31 January 2024 23 Executive Summary
Figure ES-15. The Center’s ASV, BEN, with new Starlink dish installed in the underside of the vessel’s open hatch.

The fleet of vehicles owned by the Center provides platforms for in- and off-shore seafloor survey work, test and evaluation for industrial partners and NOAA, and platforms for new algorithm and sensor development at the Center. BEN, a fourmeter long off-shore vessel is powered by a 30 HP diesel jet drive. It has endurance for 20 hours at 5.5 knots, and a 1 kW electrical payload capacity. The Z-Boat, Echoboat, and EMILY vehicles are coastal or in-shore, two-person portable, battery-powered systems with endurances of 3-6 hours at a nominal 3 knots (sensor electrical payload dependent). The DriX is a 7.7 m long ocean-going vessel, with a unique, purpose-built composite hull, giving it a maximum speed exceeding 13 knots and endurance exceeding four to five days at 7 knots.
This year, BEN was deployed from university facilities in New Castle, NH in January to support testing of newly installed Starlink and 4G networking systems (Figure ES-15), new chart-based path planning algorithms, and lidar-based obstacle avoidance. BEN was deployed from New Castle again in June to support the Center’s summer hydrographic field course. Students occupied the roles of “ASV Pilot” under instruction and “ASV Surveyor” during survey operations conducted off the New Hampshire coast.
Although primarily funded under a separate NOAA grant through OER’s Ocean Exploration Cooperative Institute, DriX operations are reported here for
information purposes because much of that separately funded work complements and indirectly supports objectives of the JHC grant. The Center’s DriX-8—currently based in Honolulu—underwent several major system upgrades in spring of 2023. These upgrades include installation of a repackaged Kongsberg EM712 MBES, suitable for deployment in a subsea housing within a newly designed DriX gondola (Figure ES-16).
The EM712 provides swath mapping capability to more than 2500 m of water depth (Figure ES-17), greatly increasing the utility of DriX-8 in the Pacific, but lowers the DriX endurance by ~40%. DriX-8 was also the first DriX vehicle to integrate a Starlink satellite networking system. The Starlink system is still being evaluated but promises to completely change the nature of uncrewed system operations, providing sufficient bandwidth for safe operation from operator stations that can be established anywhere on the globe.
DriX-8 was deployed aboard the E/V Nautilus in May 2023 for the season shakedown cruise, focusing on operator training, deck deployment and recovery training, and emergency procedure walkthroughs. Other notable events included field trials for towing DriX from a large ship, and an evaluation of the radar-based object detection and obstacle avoidance system of the DriX.
JHC Performance Report 24 Executive Summary
Figure ES-16. DriX-8 with new EM712 gondola and Starlink antenna during EM712 sea acceptance testing in March 2023.
DriX-8 was deployed again from the E/V Nautilus in October of 2023 for the “OECI Multi-Vehicle Technology Challenge” cruise, NA155. Also deployed were the Woods Hole Oceanographic Institute’s Mesobot, and the University of Rhode Island’s Deep Autonomous Profiler (DAP) vehicles. Objectives of the cruise included improving the capability of collaborative operations between these vehicles to achieve a greater collective capability than their individual parts. DriX and Mesobot operations refined the ability to conduct “verified directed sampling” in which DriX's sonar systems and telemetry relay systems (both acoustic and RF), provide context and verification to the eDNA sampling conducted by Mesobot. A biologist in the control van (or at WHOI) was able to simultaneously view acoustic scattering layers in the water column and Mesobot’s position while designing and directing sampling strategies on the fly. Some of these operations occurred while the ship was nearly 40 km away, engaged in independent science operations. Other efforts during and in the leadup to this cruise included the installation of a new fuel flow sensor, the development of a scattering layer tracking algorithm, the testing of new network algorithms to enhance telemetry throughput, and a power system redesign to reduce EK80 noise floor levels.
The Center’s experience deploying ASVs from ship and shore over the past year has been called upon by NOAA as Center reseacher Val Schmidt traveled to Seattle in January to work with NOAA on the integra-
tion of NOAA’s DriX-12 aboard the NOAA Ship Oscar Dyson. DriX-12 was utilized in a proof-of-concept operation to aid in NOAA Fisheries stock surveys in the Pacific Northwest. Technical guidance was provided along with assistance in building standard operating procedures for the ship. The Dyson deployed with DriX-12 in July out of Kodiak, Alaska.
In December 2023, graduate student Airlie Pickett conducted a desktop study for transiting DriX-12 from New Hampshire to Norfolk. VA by sea. This desktop study afforded the opportunity to consider practical aspects of these operations. [Pickett’s thesis work is focused on taking real, completed surveys conducted via NOAA’s traditional methods, and modeling how they could have been conducted with a DriX USV in various ship/DriX/Survey Launch configurations, identifying the potential efficiency gains, losses, and feasibility of such an operation.] While not expected to be undertaken this year, the exercise helped demonstrate that the ability to remotely operate DriX from most anywhere affords considerable flexibility, and transits such as this may be less expensive and time-consuming alternatives to road transport.

Details of our 2023 USV field operations can be found at pressbooks. usnh.edu/2023-jhc-task-narratives/ chapter/tasks-9-14


31 January 2024 25 Executive Summary
Figure ES-17. McCall Seamount, southwest of the big island of Hawai’i, mapped with the DriX-8 EM712 during NA155.
Executive Summary
Tasks 9-14: Related Uncrewed Vessel Research
In addition to our field operations of uncrewed vessels, we have been pursuing research in many areas to support these operations. This includes the on-going development of our marine robotics software framework (“Project 11”) and our ROSbased backseat driver for uncrewed vehicles—the CCOM Autonomous Mission Planner (CAMP). It was the flexibility of CAMP that contributed to our ability to manage the deployment and operation of multiple AUVs along with DriX this past summer on Nautilus. In 2023, many incremental improvements were made to CAMP, including the ability to directly display NOAA’s ENC tile service or OpenSeaMap rendering of nautical charts along with optionally transparent layers of mapping and other background data (Figure ES-18). These features help to provide navigation and mission context during operations.
To better support COLREGS with our USV systems, the Center has been investigating field-deployable multi-camera designs that provide situational awareness for USV operators through limited bandwidth telemetry links. In spring of 2023, a spare system was built—this time with an experimental 3D printed housing which greatly decreased the weight and cost of manufacture. Further extending the concept of safe navigation on autonomous vehicles, we are exploring the use of Machine Learning/ Artificial Intelligence to provide a semantic understanding of nearby objects that might be viewed by an onboard camera or other sensors, but not by an operator. While there are increasingly
large databases of terrestrial images for the training of machine learning algorithms for detection and classification of this type, there is much less data available specifically annotated for marine environments and marine navigation. This research effort aims to collect, annotate, and serve an archive of images for this express purpose.
Graduate student Jenna Ehnot has continued her efforts to build an image-based dataset to detect various classes of floating buoys and navigation aids, and to train the YOLOv5 object detection and classification algorithm with that dataset for USV operation. More than 600 images have been collected and annotated (Figure ES-19).
In fall of 2023, a preliminary version of the model was deployed in collaboration with industrial partner, David Evans and Associates, as a warning system for crewed survey operations. Video from a single, forward-looking camera was analyzed in real time and visual and auditory warnings were issued to the coxswain when a buoy was detected in the vessel’s path.

Figure ES-18. New functionality in the Center’s “CCOM Autonomous Mission Planner”, ,” in which multiple layers of background information can be viewed with transparency simultaneously. Here previous survey data is displayed atop an OpenSeaMap rendering of the ENC, along with planned survey and transit lines.
JHC Performance Report 26

Furthering our goal to ensure safe navigation for uncrewed vessels (and to strive to someday be truly “autonomous”), we have been exploring several approaches to automatically determining safe navigation routes. The “Chart-Based Path Planning for Marine Robotics” project focused on generating safe vehicle trajectories for uncrewed surface vehicles from charts or other mapping data. In 2023, Center researcher Roland Arsenault developed a prototype ENC-based, Dubins-Curve path planner for USVs. The “Behavior Based Path Planning” project focuses on providing the software infrastructure which allows an on-board agent to determine the best course of action at any instant based on real-time sensed conditions and to produce a navigation task for execution. The “Multi-agent Traveling Salesman Problem for Ocean Mapping” project seeks to generate continuously adaptable, optimal mapping strategies for a team of survey vessels with a long list of mapping tasks. Collaborators in the UNH Computer Science Department, Andrew Weeks and
Wheeler Ruml, worked with Val Schmidt to develop a candidate algorithm based on mixed integer programming to determine the optimal cooperative mapping strategy for a collection of crewed and uncrewed systems given many survey tasks.
Finally, in support of upcoming activities where we will seek to gain efficiency by operating more than one USV at a time, with just a few operators, we have been exploring the development of new software frameworks aimed at better accommodating multiple vehicle operation. In the spring of 2023, the Center tested new network configurations to better support multiple radio connections to a USV for increased reliability, and to provide telemetry interfaces to multiple vehicles simultaneously.

More detail about the Center’s USV activities can be found at pressbooks.usnh.edu/2023-jhctask-narratives/chapter/tasks9-14-other-usv-activities.
31 January 2024 27 Executive Summary
Figure ES-19. The above image from BEN’s panoramic camera array was evaluated by the retrained YOLO5 algorithm, illustrating the ability to detect mooring balls and other buoys varying in range from approximately ten meters to several hundred meters in range. Notably, the image also shows a lobster pot detected as both a mooring ball and a fishing buoy. These inaccuracies can be reduced with the inclusion of more diverse images in the training data.
Task 15: Data Acquisition for Volunteer/Trusted Partner Systems
Although most high-resolution mapping will likely always be conducted with multibeam echo sounders, it has become evident that there is a place in the hydrographic (and bathymetric) production pipeline for data from third-party volunteer, or trusted partner, systems. A key component of this idea, however, is that there must be a readily available, low-cost, easily scaled acquisition system to support volunteer communities. As reported in previous years, the Center has addressed this problem through the development of the Wireless Inexpensive Bathymetry Logger (WIBL), which has hardware capable of being manufactured for ~$10-20 per unit, but also contains a fully open-source cloud-based processing system that delivers data directly to the International Hydrographic Organization’s Data Center for Digital Bathymetry. This system was enhanced this year through the development of 3D-printable boxes for deployment (Figure ES-20) and multiple software improvements, including a self-hosted webserver that provides configuration and operation support (Figure ES-21). There are now approximately 30 loggers operating in the field with organizations that include the Canadian Hydrographic Service, the University of Southern Florida, Orange Force Marine, CIDCO (Canada), and others. Feedback from these events has significantly improved the robustness and efficiency of the userlevel interfaces to the logger and processing scheme,

including such things as a "last known good" data indicator to confirm data is being received, MD5 checksums for data transfer integrity, and the outline for an auto-upload scheme for Internet-connected loggers.

More detail on this subject can be found at pressbooks.usnh.edu/2023jhc-task-narratives/chapter/task-15

ES-21. Example of the logger web interface being used by Firefox (laptop) and Safari (iPad/iOS). All of the software required to configure and operate the logger is stored internally on the logger (in JavaScript) and is served to the browser for execution, making the logger stand-alone for any system with a modern web browser. WIBL logger management and interaction (right).
JHC Performance Report 28
Executive Summary
Figure ES-20. A set of 10 WIBL v2.4.1 loggers in 3D-printed boxes, along with wiring harnesses for NMEA-0183 input.
Figure
Programmatic Priority 1
ADVANCE TECHNOLOGY TO MAP U.S. WATERS
DATA VALUE
The second component of Programmatic Priority 1 is Data Value representing the processing, analysis and quality assurance steps taken after the collection of the data. Within this component we have developed processing, analysis, and QC approaches for a range of relevant data sets including bathymetry, backscatter, lidar, video, and satellite-derived bathymetry.
Processing of Traditional Data
Task 16: Bathymetry Data Processing
Despite advances in processing techniques and technology in the last decade, processing large-scale, highdensity, shallow-water hydrographic datasets is still a challenging task. Over the years, the Center has pioneered techniques to improve processing times achievable, and new technologies that conceptually redefine what we consider the output of a hydrographic survey. There is, however, still some way to go—particularly in the context of cloud-based, distributed, and real-time systems for automated survey. We are addressing these issues through several projects.
Cloud-based Bathymetric Processing (CloudMap)
The use of cloud technologies has been revolutionary for computing environments over the last ten years, and there is great potential for significant advantage in the bathymetric processing field. An essential issue, however, is how to manage these resources and take advantage of the freedoms of the cloud environment while still maintaining guarantees about product correctness and keeping costs within bounds. Having previously demonstrated that moving desktop-based processing tools into the cloud was not a viable solution (either for response times or costs), in the current reporting period, Brian Calder has led a team in developing the CloudMap system (with additional funding from OECI), a cloud-native, fully-scalable bathymetric processing system (Figure ES-22) with an always up-to-date "best estimate of depth" being developed in the cloud for each survey, and a virtual reality visualization and interaction system on a local computer. This hybrid system takes advantage of the scalable computation in the cloud to provide near real-time (target 0.1-0.5s after last data change)

Figure ES-22. High-level structure diagram for the CloudMap system, organized as a Kubernetes-mediated micro-service architecture. Note that standard technologies are used where possible to take advantage of high-performance, high-reliability, scalable, technologies.
31 January 2024 29 Executive Summary
Executive Summary
updates to the depth estimates while still providing a cost-efficient interaction model. A current effort has implemented the overall structure of the system and developed all of the core custom modules to store source and processed data, schedule and implement the computations, and stream data to the visualizer. A preliminary demonstration of a full system is expected early in the next reporting period.
Machine Learning for Lidar Data Processing (CHRT-ML)
Our data processing efforts extend to all sources of bathymetric data, including those derived from non-acoustic sources, such as airborne lidar. While first-generation bathymetric lidar generated relatively sparse data, modern topobathymetric lidar can generate data densities on a par with acoustic systems, and maintain this into shallow water, and therefore have potential benefit, but also pose a significant processing challenge, particularly with respect to burst noise in the vicinity of the water surface. The Center has been investigating augmenting transitional processing approaches, such as CHRT, with modern machine learning (ML) techniques to address this need. In the current reporting period, the resulting CHRT-ML algorithm has been extended significant in automating the identification of soundings that
resemble bathymetry (rather than ocean surface, water column, etc.), to better predict where the algorithm output may need further investigation (e.g., as a guide to focus operator effort), and to provide tools to aid in visualization of the results of the analysis (Figure ES-23). Significant software engineering effort has also been expended to speed up processing and package the results for better support; a beta-test version of the algorithm was released to NOAA Remote Sensing Division for testing in November 2023.

Much more detail on the bathymetric processing tasks can be found at pressbooks.usnh.edu/2023jhc-task-narratives/chapter/task-16
Graph Neural Networks for Bathymetric Pre-processing (DGRABNN)

Machine learning techniques using convolutional neural networks (CNNs) have been revolutionary for many fields in the last decade, making practical image analysis, speech recognition, and many other tasks previously considered "hard." CNNs have also been applied to bathymetric data but have typically been applied by forcing the data into a structure that it does not naturally have. This induced structure causes computational artifacts and limits applicability of the techniques in the bathymetric field. The Center has therefore begun investigating advanced network topologies that utilize graphs to represent the data (avoiding induced structure) but still allow use of the efficient computational structures developed for CNNs. These graph neural networks (GNNs) form the basis of the Graph Bathymetric Network (GraBN) currently in development at the Center. Initial training results demonstrate that the network can successfully distinguish data that resemble "good" bathymetry from outliers and score each observation as to its "goodness,” allowing this metric to be used for subsequent processing.
JHC Performance Report 30
Figure ES-23. Example of graphical output for visual comparison of depths maps produced by NOAA and CHRT-ML extraction of bathymetry from lidar point clouds. A. (upper left), Statistical relationship. B. (upper right), Depth difference between NOAA and CHRT-ML maps. C. (lower left), NOAA map. D. (lower right), CHRT-ML map.
Tasks 17 & 18: Backscatter and SAS Data Processing
Seafloor acoustic backscatter collected by multibeam echo sounders (MBES) has been shown as a useful input for seafloor characterization through the production of backscatter products such as mosaic, angular, and frequency response curves (see Task 2). Efforts under Task 2 of the grant have made great strides towards calibration of the MBESs and improving our ability to collect quantified backscatter data. With the 2019 announcement of the Presidential Memorandum on Ocean Mapping, the call to characterize the U.S. EEZ has raised the importance of collecting and processing backscatter. Despite the efforts under Task 2 to improve the quality of the collected backscatter, there are still issues with respect to processing the data. The Backscatter Intercomparison Project (BSIP) (DOI 10.13140/RG.2.2.13881.21606) found that, given the same dataset, backscatter results varied widely across the different processing stages—including the first step of decoding the raw data. The lack of clearly identifiable reasons for the variability and closed processing chains of commercial processing software erodes confidence in both the processed data and the derived products. Under Task 17, the Center has been working with the Backscatter Working Group (geohab. org/backscatter-working-group) to help resolve these issues, although efforts are currently stalled while the BSG reorganizes.
SAS Processing for Object Detection
Multilook Coherence for Automated Target Detection and Classification

Figure ES-24. Example high-frequency SAS image (top left) and mid-frequency SAS image (top right) for a seafloor with small strong scatterers causing clutter in the coherence map (top). Receiver operator characteristic (ROC) curves of detection performance on mid-frequency images from this seafloor using the multilook coherence technique with a simple threshold of the average coherence from all looks as the detection metric (bottom left) and with the entropy of the distribution of coherence estimates from all looks as the detection metric (bottom right).
specular, diffuse, point-like, resonance-related, etc.). Information pertaining to scattering type would improve the separability of man-made targets from the interfering background return and clutter. For multilook coherence-based detection or classification, the key parameter is the magnitude of the complex correlation coefficient. For multiple complex images, (i.e., "looks"), this parameter is an estimate of the coherence between the sub-looks. In this year’s effort, mid-frequency SAS datasets were used to explore the performance of the multi-look technique for detection using metrics based on the distribution of coherence estimates resulting from multiple looks (e.g., entropy, sum, standard deviation, minimum).
Leveraging work supported by the Office of Naval Research, Anthony Lyons has been exploring multilook SAS techniques for target detection and classification. Multi-look coherence techniques focus on the information content of images by splitting the total angle and frequency spectral bandwidth of a complex synthetic aperture sonar image into sub-bands. The complex coherence of each pixel as a function of frequency and angle can then be exploited, yielding information on the type of scattering observed (e.g.,
Comparing detection results based on using a simple threshold of the coherence average for each pixel in the coherence map with a list of target locations yielded receiver operator characteristic (ROC) curves such as the one shown in bottom left plot in Figure ES-24 for a site with multiple strong compact scatterers in the seafloor (example high and midfrequency images from this site are also shown in Figure ES-25).
31 January 2024 31 Executive Summary

Figure ES-25. Complex coherence of seafloor scatter between pings as a function of separation in time between pings (i.e., temporal coherence of the acoustic field scattered from the seafloor) for the Star Island site for two frequencies in two different seasons. Correlation curves are seen to be to be dramatically different in the two seasons, with summer decorrelating faster over short time scales than winter, likely due to biological activity.
The various curves for multi-look coherence detection performance seen in the figure are for a variety of strategies that were used to try to reduce false detections. The bottom right plot in Figure ES-24 shows an example of performance results made using a metric based on the entropy of the distribution of coherence estimates. Initial results show that for this site the entropy-based metric yielded similar performance to using a simple threshold of the average coherence of all looks.
Ping-to-Ping Coherence for Coherent and Incoherent Change Target Detection Applications
Lyons has also been supported by the Office of Naval Research to explore long-term temporal variability in seafloor scatter for target detection and classification. Seafloor properties controlling acoustic scattered levels, such as seafloor roughness are variable as they are heavily influenced by biology and near-bottom hydrodynamics. Variability in seafloor scatter can significantly increase uncertainty in predictions of the performance of object-detection and classification sonar systems as well as seabed-classification systems. Additionally, one of the dominant and unknown effects on the performance of synthetic aperture sonar change detection techniques will be the temporal variability of the seafloor. Complex coherence and magnitude correlation measurements of the scattered acoustic field are important for understanding environmental bounds on coherent and incoherent change detection for sensing man-made changes in the seafloor. Figure ES-25 highlights measurements
that can be obtained from the long-term scattering data collected at one of our study sites (Star Island, Isles of Shoals), the temporal coherence of the complex scattered acoustic field of seafloor scattering. As an example, Figure ES-25 displays the complex coherence of seafloor scatter between pings as a function of separation in time between pings, (i.e., temporal coherence of the acoustic field scattered from the seafloor), for the Star Island site for two frequencies in two different seasons. Correlation curves are seen to be to be dramatically different in the two seasons, with summer decorrelating faster over short time scales than winter, likely due to biological activity.
While the bulk of the efforts focused on target detection and the environmental effects on target detection are funded through the Office of Naval Research, the applications of these novel techniques for automated target detection classification and performance estimation are evident and Lyons will be identifying opportunities to apply these methods to locating and identifying objects on the seafloor which may pose hazards to navigation (e.g., wrecks or rocks), understanding change detection concepts as applied to mapping systems, and working with colleagues at the Center to incorporate these approaches into mapping workflows. Further information about these tasks can be found at pressbooks.usnh. edu/2023-jhc-task-narratives/chapter/ tasks-17-18.

JHC Performance Report 32
Executive Summary

Figure ES-26. Among other changes, a new user interface has been developed for QC Tools 4 to allow users to set the new OCS Quality Metrics: Exceptional, Critical, and General 1-5.

Figure ES-27. The Uncertainty Calculator is a standalone tool to help calculate and visualize the total vertical uncertainty and total horizontal uncertainty of hydrographic data. Optionally, the user can select a second quality metric for performing a direct comparison.
Task 20: Advanced Quality Assurance/Control Tools
Quality assurance and control of ocean mapping data continues long after the data is collected, and the Center has been instrumental in building tools to support this process at the interface between field and office processing, and the transition of these tools to operations through both the HydrOffice and Pydro toolsets. These QA/QC tools provide application-specific support of Hydrographic Office workflows (specifically, OCS workflows), and have been influential in systematizing and automating procedures for data quality control. Although a certain level of maturity has been achieved with these tools, new ideas and algorithms continue to develop from field requirements, data inconsistencies, and survey specification requirements.
In the current reporting period, Guiseppe Masetti, Tyanne Faulkes (OCS PHB), and Matthew Wilson (OCS AHB) have continued, in collaboration with OCS HSTB personnel, to develop the toolset. The application, which aggregates a number of tools within a single GUI, is available through NOAA Pydro (which delivers software to the NOAA hydrographic units) and through the HydrOffice website for non-NOAA users. Several mapping agencies, NOAA contractors, and other professionals have adopted some of these tools as part of their processing workflow. QC Tools is in active use with the NOAA field units, which are a valuable source of feedback and suggestions. QC Tools was updated to align with the 2023 HSSD and the ability to select among recent HSSD editions was added. The changes applied to the algorithms in QC Tools ensure that all NOAA field units and offices can QC data to the latest requirements.
With major changes coming to the HSSD (to be published in 2024), work on QC Tools to support these new changes has already started (see Fig. ES-26) and includes a number of modifications to algorithms to reflect the new OCS Quality Metrics in the updated HSSD. A new Uncertainty Calculator has been developed in QC Tools 4 for allowing users to compare the new OCS Quality Metrics with IHO Orders and CATZOC (Figure ES-27). The tool is also valuable for education and training because it interactively visualizes equations, depths, uncertainty values, and plots. QC Tools is viewed as a critical component for rapid, automated application of the newly developed specifications. Beta versions of QC Tools 4 have been provided to NOAA Ship Thomas Jefferson and NRT Seattle for early testing of the new HSSD.

Further details on this year’s efforts related to QC Tools can be found at pressbooks.usnh.edu/2023-jhc-task-narratives/ chapter/task-20
31 January 2024 33 Executive Summary
Executive Summary
Processing of Non-Traditional Data Sources
Our data processing approaches have also focused on “non-traditional” data sources that can enhance our understanding of the seafloor and may have important implications for seafloor characterization, hazard identification, or other applications. In all cases, these data cannot be processed using our standard hydrographic pipeline and thus new approaches must be explored.
Task 22: Millimeter Resolution
Mapping with Frame Sensors
The ability to create 3D images of the seafloor at mm-scale resolution can be of tremendous help in establishing “ground-truth” for seafloor habitat mapping and provide detailed roughness measurements required to better understand our seafloor backscatter measurements. In an effort to find an inexpensive means of making these high-resolution measurements, the Center has been exploring the use of Time-of-Flight (ToF) cameras for direct frame (simultaneous 2D array) measurement of range. ToF cameras are common tools for various tasks in air. However, the use of conventional systems underwater is impossible due to high absorption in water of the infrared illumination source used in ToF cameras. The use of green or blue laser diodes instead of IR LEDs would allow for reliable underwater sensing with ranges up to 5 m and sub-centimeter resolution. The main advantage of ToF sensors is that they simultaneously acquire a two-dimensional array of measurements— frame pseudo-imagery, unlike a conventional lidar. Redundancy in measurements due to frames’ overlap eliminates inaccuracies in platform positioning and allows the application of Simultaneous Localization and Mapping (SLAM) techniques to improve digital elevation model creation and detection, and recognition of objects.
In this reporting period efforts were concentrated on creating a homogeneous and sufficiently bright illumination of a large volume in front of both a ToF and conventional camera using several powerful green (520 nm) laser diodes. This has been accomplished with the use of ground glass optical diffusers. Software for controlling both cameras and acquiring synchronized images has been developed and verified. Both cameras have been calibrated for lens distortion. Currently the work has two main directions. The first, optical, direction consists of assembling the cameras and the green laser diodes in heat sink enclosures with diffusers attached. The second, mechanical, direction consists of finalizing the underwater housing, affixing electronic components, mini-PC, and battery to the main aluminum shelf, and watertight switches and connectors to the aluminum end cap.

More information about this task is available at pressbooks.usnh. edu/2023-jhc-task-narratives/chapter/ task-22
Task 23: Enhanced Data Underwater 3D Construction
Further supporting our efforts to build accurate 3D reconstructions of the seafloor has been our work using seafloor imagery to generate high-resolution 3D constructs of the seafloor. Photogrammetry and Structure-from-Motion (SfM) is fast becoming a common method for monitoring seafloor change, particularly in coral reefscapes. The 3D models generated by the SfM process can be used for measuring the size of organisms and the rugosity of habitats, as input for ecological mapping studies, artificial intelligence analysis, and for viewing in virtual reality. Values of rugosity are often singularly calculated at the model scale, yet many of the changes that occur in coral reefs, or other habitats dominated

JHC Performance Report 34
Figure ES-28. A heatmap of rugosity values on a complex 3D model of a coral reef.
by habitat-forming species of interest, occur at smaller scales. In the previous reporting period, the project team (Kindrat Beregovyi, Tom Butkiewicz, and Jenn Dijkstra) developed new spatial analysis algorithms that fully capture rugosity within complex 3D scenes, using SfM models of coral reefs and intertidal landscapes as input. In this reporting period, those algorithms were further refined and expanded to support extending additional complexity metrics of fractal dimension and vector dispersion to complex 3D models. Development was completed on a standalone rugosity calculator application that makes it easy for researchers to use these algorithms on their own models and visualize the results as heatmaps applied to the models (Figure ES-28). The Center provides an easyto-use application that implements these techniques—the Rugosity Calculator (ccom.unh.edu/ vislab/tools/rugosity). Within the application, there are useful tools for visual analysis of rugosity and other spatial complexity calculations, and results can be exported for further analysis.


Figure ES-29. Structure and sequence diagram for the WIBL cloud-segment, with data flowing from left to right through data submission, processing, metadata validation, and upload to the DCDB archive. The management server (top) monitors metadata on the state of the system and provides visibility to Trusted Node operators.
More information on this task can be found at pressbooks.usnh.edu/2023-jhc-task-narratives/ chapter/task-23.
Task 24: Processing of Volunteered Bathymetric Observations
Our efforts to develop processing techniques for non-traditional data sources extend to the crowd-sourced or volunteered data collected by the WIBL loggers created at the Center (see Task 15). As with conventional survey data, volunteered bathymetric information (VBI) is only useful when processed appropriately, augmented with metadata, and stored in a Findable, Accessible, Interoperable, and Reusable (FAIR, www.go-fair.org/fair-principles) archive. The Center has therefore continued to develop cloud-based, open-source software for the WIBL project (Figure ES-29) but extended it into a more loosely-coupled structure which allows for more flexible deployment and configuration, and a monitoring service which collects metadata on the processing environment and makes it available to Trusted Node operators through a web interface. We have also supported a number of other implementations of the WIBL processing scheme, including with the International Sea Keepers Society (Figure ES-30), Seabed 2030, and Orange Force Marine, and have used this experience to significantly augment the installation and operation of the system.

Figure ES-30. Example of GeoJSON VBI data (courtesy of International Sea Keepers Society) rendered in a Leaflet (JavaScript) application on a client browser. Feedback of data collected is a powerful way to keep volunteer data collectors involved in the process.
31 January 2024 35 Executive Summary
Executive Summary
We have also assisted the IHO Crowdsourced Bathymetry Working Group in developing a schema for the B.12 guidance document's recommended metadata, and published an open-source implementation of the schema to provide this resource generally. This schema acts as a de facto product standard for B.12-compatible GeoJSON files, in close cooperation with IHO’s Crowd Sourced Bathymetry Working Group and the IHO's Data Center for Digital Bathymetry, hosted by NOAA NCEI in Boulder, CO. We have also begun to develop a community-led, best practice project for VBI data processing with the goal of establishing expected processing steps and outcomes for given data, avoiding variations between different vendor implementations.

More information on this task can be found at pressbooks.usnh.edu/2023jhc-task-narratives/chapter/task-24
Task 25: Alternate Uses for ICESat-2 and Other Laser Altimeter Data
The final non-traditional data source that we have been looking at is the new ICESat-2 laser altimeter. While airborne lidar systems have been used to collect bathymetry for many years, the use of satelliteborne laser systems for bathymetry is quite recent. Satellite laser altimeter systems, such as the ICESat-2 ATLAS system, are typically used for measuring surface phenomena—such as ice freeboard, but prior research has demonstrated that they can successfully be used to determine water depth in some areas, at
least in shallow, clear water. While the data density and accuracy are not necessarily what might be expected from airborne lidar systems, the ubiquity of the data and ongoing collection campaign make for an interesting dataset that may provide insight into other hydrographically significant features. The long-term goals that have emerged for this task are enabling benthic habitat monitoring and mapping shallow water bathymetry in remote areas. Activity during this reporting period focused on using ICESat-2 data to identify and locate coral reefs, and to estimate post-hurricane depth change. (Activity in this task is also linked to Task 26: Ocean Mapping Data Analytics, and eventually will be more closely linked to Task 29: Management of Living Marine Resources from ECS and ICESat-2.)
Research on coral reef detection and location has employed Heron Reef in Australia as a testbed. This is because of its well-defined boundaries and the availability of ground-“truth” information in the form of the Allen Coral Atlas (Figure ES-31A (left)) and georeferenced photo-quadrats. All data tracks collected by ICESat-2 since its launch in October 2018 that cross Heron Reef have been obtained. The feasibility of identifying coral reef locations using changes in rugosity variability continues to be explored. A moving-window-based algorithm calculates a “pseudo-rugosity” value across an ICESat-2 track. The variance of these values along segments of the track are analyzed using machine learning approaches to determine the correspondence of pseudo-rugosity values with reef presence and the identification of reef edges. Results (Figure ES-31B) suggest this approach may be useful, although

JHC Performance Report 36
Figure ES-31. A. (Left) ICESat-2 tracks/coverage for Heron Reef from 2018 (ICESat-2 inception) to present showing points identified as reef by Allen Coral Atlas. B. (right) Pseudo-rugosity values and the likelihood that they identify coral reef locations.

Figure ES-32. Differences between lidar and SDB depth change estimated directly using a machine learning model. A. (left panel) Statistical relationship. B. (2nd from left panel) Geographic distribution of depth change differences. C. (3rd from left panel) Lidar depth change (ground-“truth”). D. (right panel) SDB directly estimated depth change.
more research is necessary to explore alternative reef types, additional reef descriptors that can be extracted from ICESat-2, and the utility of merging ICESat-2 data with other remote imagery and ground-based data.
In an additional effort we have been looking at the ability of Satellite Derived Bathymetry (SDB) to capture seafloor change. Our efforts have focused on gaining foundational knowledge about SDB for depth change from lidar data (because of the availability of co-located datasets in regions of known change) but with the long-term goal of adapting knowledge gained to ICESat-2. Pre- and post-Category 5 Hurricane Irma Landsat imagery (30 m pixels) and airborne lidar were obtained. The usual approach to estimating SDB depth change is to independently fit two SDB models—one using the time t1 imagery and lidar, and a second one using the time t2 imagery and lidar. The resulting SDB surfaces are then differenced and the depth change accuracy evaluated using the root-mean-square error (RMSE).
An alternative approach was explored during this reporting period. It was reasoned that difference in spectral bands from t1 to t2 may be more useful for estimating depth change directly rather than fitting two independent models for individual times. Hence the two eight-band images from t1 and t2 were “stacked” to produce a single 16-band image. Differences in the t1 to t2 lidar were used to train a machine learning model and the accuracy of the model was evaluated statistically and spatially
(Figure ES-32). This area is relatively small—500 m x 1500 m—and gradually deepens from one meter in the north to extinction in the south at a uniform rate. The lack of geomorphic complexity made it a useful area for SDB depth change evaluation.
In Figure ES-32, panel A (left) indicates that the “true” depth change as determined by airborne lidar and the SDB depth change are not correlated. The reason for this is apparent in Figure ES-32, panel C (second panel from right)—little or no pre- and post-hurricane depth change occurred in this area according to the lidar data. Further exploration of results suggest that episodic change may be confined to areas that are too small and isolated to be detected by the 30 m pixels of Landsat (an important caveat in itself on the limits of SDB imagery). An alternative research approach that employs Sentinel-2 data (10 m pixels), focuses on areas that have been algorithmically identified as likely to have experienced episodic change, and non-episodic “natural/ ongoing” change has been formulated. Despite the poor results, this example demonstrates the need for this type of robust visual statistical and geographical evaluation of SDB depth change accuracy rather than the use of a single metric such as RMSE (which at 0.57 m was relatively small in this example).

More details of this effort can be found in pressbooks.usnh.edu/2023jhc-task-narratives/chapter/task-25; further discussion of SDB-related activities can be found under Task 26.
31 January 2024 37 Executive Summary
Executive Summary
Task 26: Ocean Mapping Data Analytics
The final task of our Data Value theme is the broad topic of Ocean Mapping Data Analytics (OMDA). This task was designed to provide analytics resources (including Machine Learning and Artificial Intelligence approaches, where appropriate) to many of our other tasks. This effort has made significant contributions to Tasks 16, 25, 29, and 31; here we present those activities whose primary focus is considered to be mainly foundational data analysis. For the current reporting period, all are focused on the use of satellite-derived bathymetry (SDB) data to improve the shallow-water accuracy of nautical charts.
SDB relies on satellite imagery to estimate depth. Given that image quality and characteristics vary (Figure ES-33), the choice of image will have an impact on SDB accuracy. Because no widely accepted method for image selection exists, a somewhat common approach is to develop a composite image that most often uses a “maximum blue band” reflectance to represent pixels on the composite.
Similarly, different modeling approaches are employed to fit SDB models. Common methods are linear regression to fit a quasi-empirical model that
most often employs a blue/green band ratio and/or machine learning methods based on visible bands. Furthermore, it is most common to fit a single SDB model over a relatively large geographic area. Such an approach ignores local and regional variation in image quality and water characteristics such as turbidity, waves, and others.
During this reporting period, we developed a geographically adaptive SDB machine learning models using Categorical Boosting (CatBoost) applied to visible and non-visible bands and UTM eastings and northings. This approach was explored and compared to the commonly used quasi-empirical band ratio model (Figure ES-34). The conclusions from this work are the following:
• The image composite (which is commonly used) did not produce the best SDB models and, in fact, produced the least accurate models for half of the models explored.
• CatBoost modeling that uses visible and nonvisible spectra outperforms the band ratio method that employs the blue and green bands only and is fitted using least squares linear regression.

JHC Performance Report 38
Figure ES-33. Four images and a composite of the four used for assessing image selection and modelling methodology for SDB. These are displayed as near real-color images using an image-specific percent clip stretch. The four-color map in the lower right shows the contribution of each image to the composite.
• Geographic adaptability provides a large accuracy improvement for the band ratio SDB model, but not for CatBoost— presumably because CatBoost has the flexibility to discern local trends when provided with visible and non-visible spectral bands.
• For the 11 km x 10 km study area in the Florida Keys, the root mean square error depth error is 20 cm for the geographically adaptive CatBoost model.

Clustering was also explored as a way of improving the accuracy of SDB models. K-means clustering was applied to the image data to identify spectrally similar classes; clustering to produce 2, 4, 6, and 8 clusters were explored (Figure ES-35 (left)). Data for the study area were sampled in several ways, e.g., strips that emulate ICESat-2 tracks. For each sampling method and number of clusters, separate SDB models were fitted for each cluster using LightGBM (“Light Gradient Boosting Machine”) and applied across the entire area. RMSE values for an exemplar sampling scheme (Figure ES-35 (right)) indicated the following.
• Using clustering to identify areas for which individual multi-band LightGBM models should be fitted improves models considerably.
• Depending on the nature of the training data, as few as two clusters can be employed; note results for the sampling scheme labelled [C].
• Even for other sampling schemes, no more than six clusters may be required; note the results for the sampling scheme labelled [R].
Finally, during this reporting period, an activity was initiated to assess the impact on the final SDB bathymetric chart of various ways of extracting bathymetry from ICESat-2 tracks. Whether identified manually or algorithmically, ICESat-2 soundings representing bathymetry are biased towards the relatively plentiful and easy-to-identify shallow-depth soundings. This likely has the unintended consequence of producing SDB models with high accuracy in the shallowest areas, and low accuracy in the potentially more navigable deeper areas. Moreover, if one wishes to improve the accuracy of an SDB map using a strategy of obtaining more sounding data, acquiring data in already oversampled depths is unlikely to be useful. It is anticipated that optimal strategies and efficient methods for ICESat-2 bathymetric sounding extraction for SDB mapping will be identified.

More details about this task can be found at pressbooks.usnh. edu/2023-jhc-tasknarratives/chapter/ task-26

31 January 2024 39 Executive Summary
Figure ES-34. A. (left) R-squared and B. (right) RMSE (root-mean-square-error) by model type and geographical adaptability.
Figure ES-35. Left: Example of clusters produced using k-means clustering on visible and non-visible spectral bands. Right: Root mean square error for cluster-based geographically adaptive LightGBM SDB models produced by two different sampling schemes.
Programmatic Priority 1
ADVANCE TECHNOLOGY TO MAP U.S. WATERS
RESOURCES OF THE CONTINENTAL SHELF
The third component of Programmatic Priority 1 specified by the Notice of Funding Opportunity is titled “Resources of the Continental Shelf,” representing the activities of the Center in support of the U.S. Extended Continental Shelf Project as well as several activities that are focused on supporting offshore mineral and resource exploration, renewable energy development, and the responsible management of U.S. living marine resources.
Task 27: Support of U.S. Extended Continental Shelf Efforts
Recognizing that the United Nations Convention on the Law of the Sea (UNCLOS), Article 76 could confer sovereign rights to resources of the seafloor and subsurface over large areas beyond the U.S. 200 nautical mile (nmi) Exclusive Economic Zone (EEZ), Congress (through NOAA) funded the Center to evaluate the nation’s existing bathymetric and geophysical data holdings in areas surrounding the nation’s EEZ in order to determine their usefulness for establishing
an “Extended” Continental Shelf (ECS) as defined in Article 76 of UNCLOS. This report was submitted to Congress on 31 May 2002.
Following up on the recommendations made in the study, the Center was funded (through NOAA) to collect new multibeam sonar (MBES) data in support of a potential ECS claim under UNCLOS Article 76. Mapping efforts began in 2003. Since then, the

JHC Performance Report 40 Executive Summary
Figure ES-36. Summary of Law of the Sea multibeam sonar surveys mapped by the Center. Total area mapped represents more than 3.1 million square kilometers since 2003.
Center has collected more than 3.1 million square kilometers (about twice the area of Alaska) of new highresolution multibeam sonar data on 32 cruises—including nine in the Arctic, five in the Atlantic, one in the Gulf of Mexico, one in the Bering Sea, three in the Gulf of Alaska, three in the Necker Ridge area off Hawaii, three off Kingman Reef and Palmyra Atoll in the central Pacific, five in the Marianas region of the western Pacific, and two on Mendocino Fracture Zone in the eastern Pacific (Figure ES36). Summaries of each of these cruises can be found in previous annual reports and detailed descriptions and access to the data and derivative products can be found at www.ccom.unh. edu/law_of_the_sea.html
The raw data and derived grids were also provided to the National Centers for Environmental Information (NCEI) in Boulder, CO and other public repositories within months of data collection and will provide a wealth of information for scientific studies for years to come.

On 14 December 2023, the U.S. officially announced the limits of its Extended Continental Shelf and made public an Executive Summary describing the rationale and criteria for the determinations (Figure ES-37). This was a momentous occasion as it represented the culmination of more than twenty years of effort on behalf of the Center and many others. However, with the publication of these limits the work of the ECS Task Force and Center contributors has not finished. We continue to update of the Center’s ECS website https://maps. ccom.unh.edu/portal/home and work closely with
the Project Office and NCEI to ensure that all data collected by the Center over the past twenty years are fully available and appropriately attributed in the Project Office and NCEI databases. We continue to investigate other areas where there may be potential U.S. extended continental shelf, and we are working closely with the State Department and the U.S. ECS Program Office to ensure that information disseminated about the U.S. ECS is updated and correct.
31 January 2024 41 Executive Summary
Figure ES-37. The published areas of the extended continental shelf established by the U.S. in December 2023.
Executive Summary
Task 28: Offshore Mineral/Marine Resources
Locating and exploiting marine minerals in complex shelf environments that are characterized by a wide range of sediment types and numerous physiographic features (geoforms)—such as outcropping bedrock, reef structures, or eroding glacial deposits—is often difficult. For example, continental shelves in paraglacial environments (previously glaciated) are common in the U.S., dominating much of New England, the Pacific Northwest, and Alaska. Glaciated environments on land typically have abundant sand and gravel resources and historically have been a major source of aggregates. Unfortunately, the land resources are becoming depleted, creating the need to find and utilize new sources. Continental shelves found in paraglacial environments likely have abundant sand and gravel resources that are associated with marine-modified glacial deposits. However, paraglacial continental shelves are extremely complex with respect to seafloor morphology and sediment distribution, making identification of mineral resources far more difficult than in tectonically stable, unglaciated areas with wide shelves composed of homogeneous sediment deposits (e.g., southeastern U.S. Atlantic or Gulf of Mexico). Therefore, it is important to continue to advance our understanding of the relationships between aggregate deposits and seafloor physiographic features in or near previously glaciated systems.
Over the past decade, marine mineral resource studies carried out by the Center verified that many sand and gravel deposits located on the western Gulf of Maine (WGOM) continental shelf originated as glacial features. On the adjacent upland, glacial deposits such as deltas or braided outwash are well mapped and are primary sources of aggregates that are extensively mined and utilized. However, unlike
glacial deposits on land, the offshore sites are poorly mapped and have been exposed to the harsh marine environment—including multiple sea-level transgressions and regressions (rise and fall), wave and tidal


JHC Performance Report 42
Figure ES-38. Surficial geology map of the WGOM showing the 2023 CMECS sediment classification at the subclass level.
Figure ES-39. Surficial geology map of the WGOM showing the 2023 CMECS sediment classification at the group level. Note the substrate group classification is more detailed than the substrate subclass shown in Figure ES-MM. Also note: this map is at smaller scale and is focused on the complexity of the nearshore shelf.
currents, and biologic modification (e.g., vegetation or bioturbation). Therefore, glacial deposits, which may contain sand and gravel resources, have been extensively eroded and the sediment redistributed which makes identification and evaluation more difficult. This task seeks to advance the understanding of the relationships between aggregate deposits and seafloor physiographic features in complex shelf environments, and understand the most appropriate approaches for their mapping. The work is focused on the WGOM which provides a variety of physio-graphic features or geoforms common to para-glacial environments around the world.
Previously, the Center developed high-resolution surficial geology maps of the WGOM depicting the bathymetry, major geoforms (physiographic features), and sediment distribution for the continental shelf off northern Massachusetts and New Hampshire extending seaward to Jeffreys Ledge, covering an area of ~3,250 km2. These maps utilized the NOAA Office of Coast Survey (OCS) Coastal and Marine Ecological Classification Standard (CMECS). Additionally, changes in sea level over the last 13,000 years were mapped and the resultant transgressions (landward movement) and regressions (seaward movement) of the ocean that impacted the study area revealed. In 2022, a major field campaign was conducted to provide ground truth to support enhancement and expansion of the WGOM high-resolution surficial geology maps. However, extensive use of CMECS for surficial geology mapping in the WGOM showed the need for refinement and modification of the substrate and geoform classifications before expansion of the surficial geology maps could be done. An expanded and refined CMECS substrate classification was completed in 2023 by OCS, with significant Center involvement.
During the current reporting period, enhancement of the high-resolution surficial geology maps of the WGOM was initiated. The surficial geology maps were updated with the 2023 CMECS substrate classification and are shown in Figures ES-38 and ES-39. During the next reporting period, the geoform classification will be refined to better describe complex continental shelves. In addition, the surficial geology maps will be expanded to include adjacent unmapped areas that are relevant to the study of marine mineral resources (e.g., Merrimack Embayment) or are important to the region (e.g., Jeffreys Ledge and Scantum Basin).
Although a better understanding of the surficial geology of a complex seafloor has been developed from this work, very little is known about the subsurface sediment composition and three-dimensional geometry of the deposits. Fortunately, the Center received environmental compliance during the present reporting period for use of subbottom seismic systems (see Task 8). Therefore, addressing this gap is a goal of Task 28 that will be initiated in the next reporting period.

Further information on this effort can be found at pressbooks.usnh. edu/2023-jhc-task-narratives/ chapter/task-28
Task 29: Management of Living Marine Resources from the ECS
Coastal regions are the powerful engines of the U.S. economy, providing billions of dollars in goods and services. Hydrographic survey data and other marine mapping and charting data have tremendous potential to benefit NOAA marine resource management initiatives, in keeping with Integrated Ocean and Coastal Mapping (IOCM) best practices. Seafloor characterization and multi-temporal data of marine living resources observed are particularly valuable for assessing the efficacy of various restoration practices, identifying spatial locations of marine resources, and monitoring change at spatial extents and timescales that are relevant to management. To address these issues, the Center has embarked on several projects aimed at increasing our understanding of the role of bathymetry and geomorphology for commercial fish and shellfish, the influence of spatial resolution on the portrayal of geomorphology, and changes in the seafloor—at various scales—over time.
Mapping for Change Analysis on Coral Reefs
Obtaining accurate bathymetric data on the repeat cycles necessary for coral reef restoration site monitoring is nearly impossible using only singlesource data. Hence, we have examined methods of combining data from a wide range of platforms ranging from uncrewed aerial systems (UAS), autonomous surface vehicles (ASVs), vessel mounted MBES, and diver-collected underwater imagery. Data collection began in 2021 and is collected annually to examine the effectiveness and accuracy
31 January 2024 43 Executive Summary
Executive Summary
of each platform to detect changes in seafloor and reef properties. The bathymetric data and UAS imagery were used to optimize co-registration of photomosaics so that changes in corals can be mapped over time (Figure ES-40). This effort has been expanded and Selina Lambert (OSU graduate student) is in the process of developing and testing new methods of accurate georeferencing of 3D point clouds of underwater photogrammetric products. Change analysis was performed on Structure-from-Motion (SfM) constructed digital elevation models generated from diver collected imagery to determine the applicability and accuracy of SfM DEMs for seafloor change detection. Former master’s student, Glenna Dyson (now a Project Research Specialist 1 at CCOM/JHC) used fine-scale terrain variables derived from SfM photogrammetry to develop Habitat Suitability Models for predicting suitable coral restoration sites at scales relevant to program managers. With the resolution of these methodological issues, detailed change analysis can now begin.

densities. This fine-scale study is ongoing and we are in the process of expanding the spatial scale of the study by leveraging NH Sea Grant-sponsored fisheries internships and high-resolution bathymetric datasets collected over a decade by previous JHC-sponsored projects—along with other seafloor characteristics—to identify how each variable contributes to the occurrence of nearshore fishes and benthic invertebrates of commercial importance.
The Role of Scale, Bathymetry, and Geo-morphology in Commercial Fish and Invertebrate Species Distribution
Bathymetry and topographic complexity have been shown to influence the distribution of fish and invertebrates. However, recent studies suggest this relationship is more nuanced than previously thought and may be mitigated by the overlying composition of species. Therefore, since 2018, studies relating the distribution and abundance of fish and invertebrates to characteristics of the seafloor have been conducted at several sites around the Isles of Shoals—a cluster of islands approximately six miles off the coast of New Hampshire. Preliminary findings suggest rugosity is similar among the habitats of distinct species composition and that rugosity and height will influence fish
Predicting Seaweed Habitat Types Using Supervised Machine Learning Classification
Identifying seafloor characteristics that can be used to detect areas of persistence of coastal globally declining marine living resources is critical for their management. In temperate zones, kelp forests are actively being cultivated as they are of ecological significance and they support a wide variety of commercially important species. Due to anthropogenic activities, kelp forests are declining, yet there is evidence that pockets of healthy kelp forests exist. Considering the directives from the Presidential Memorandum on Ocean Mapping, this research employs various remote sensing platforms to pinpoint prospective locations where kelp forests are present, making them suitable for restoration
JHC Performance Report 44
Figure ES-40. NOAA Sanctuary Site Sand Key. Diver-collected imagery georeferenced to bathymetry and UAS imagery.
initiatives. Specifically, this project leverages groundtruth data and high-resolution bathymetric datasets collected over a decade by previous Center-sponsored projects in combination with satellite imagery. In previous reports, Ph.D. student Matt Tyler—under the supervision of Jenn Dijkstra—used Random Forest classification from bathymetry, geomorphons, ground truth data, and sea surface temperature to predict macroalgae habitat types in the vicinity of the Isles of Shoals. In this reporting period, Tyler collected additional ground truth data and experimented with the hyperparameters to improve the classification accuracy of the model.
Mapping of Physical and Biological Features on Discharge Outcrops in Ridge Flank Hydrothermal Systems
The Center and NOAA have led in the acquisition of more than 3.1 million square kilometers of highresolution multibeam bathymetry and backscatter data in areas of potential U.S. Extended Continental Shelf (ECS) and in the Exclusive Economic Zone (EEZ). There is strong interest in extracting further information from these data that is useful to managers implementing ocean Ecosystem-Based Management (EBM). In previous reports, extracting geomorphology segments of similar shape and reflectivity automatically from multibeam bathymetry and backscatter data was demonstrated by members of the Center and the NOAA OE program to be a useful tool for habitat mapping on the continental shelf
of the western North Atlantic. Yet, the usefulness of using geomorphologies for fine-scale habitat mapping or the influence of resolution on geomorphon characterization using terrain variables is not clear.
In this reporting period, Anne Hartwell—under the supervision of Jenn Dijkstra—analyzed, prepared, and submitted results characterizing, for the first time, the biology and substrate of vent and non-vent zones on two Ridge Flank Hydrothermal Systems (Dorado Outcrop and the NOAA sanctuary Davidson Seamount Management Zone (DSMZ). Results revealed overall differences and a correlation between temperature and species richness. Hartwell also explored the influence of resolution on the portrayal of landforms through terrain variables. Preliminary results showed notable distinctions in how changes in resolution impact the characterization of landforms by terrain variables (see Figure ES41). Community composition was also found to vary by geomorphic features, such as slopes and ridges, aligning with broader distribution patterns observed in the deep ocean. Additionally, it was observed that resolution influences the terrain variable that most effectively elucidates differences in community composition on the landform.

Further details on these and other living marine resource projects can be found at pressbooks.usnh. edu/2023-jhc-task-narratives/ chapter/task-29

31 January 2024 45 Executive Summary
Figure ES-41. Map of Dorado Outcrop. Colors represent classified Northerness terrain textures when extracted at 1m and 10m resolution. Classification was draped on DTM at 1x exaggeration.
Executive Summary
Task 30: Improvements in Change Detection
As we strive to accurately measure and characterize the seafloor, we also must be cognizant that the seafloor can change—particularly in areas of strong currents and unconsolidated sediment. As part of NOAA’s mandate to both maintain chart veracity and to monitor dynamic seabed environments, change monitoring is therefore a fundamental requirement. Separating real change from residual biases or intermittent bottom tracking errors in the survey data, however, is a major limiting factor in confidently identifying such change and thus we also have undertaken effort to better understand the limits of our ability to measure change in both bathymetry and backscatter. In this reporting period much of our focus has been on using backscatter to measure changes in the substrate, as the same natural and anthropogenic processes that impact the bathymetry have the potential to also alter the substrate. Such studies are also critical to our efforts to better understand and calibrate the backscatter data we collect (see Task 3).
Substrate Change
In this third reporting year of the grant, an experimental field program is entering its second year to address seabed backscatter variability. It builds strongly on experience derived through parallel work off Star Island, NH, in 2020-2021, funded through a U.S. Office of Naval Research project (PI Tony Lyons, grant no. N000141912732), which revealed that the major shifts in the backscatter strength occur in the wake of major storm windows. Building on this study, a second tripod was fabricated and installed to cover the 2022-2023 winter period, which is currently being studied by Kaan Cav as part of his master's thesis. His preliminary results (Figure ES-42) reveal significant changes associated with storm events.

JHC Performance Report 46
Figure ES-42. Five months of 70 kHz scattering strength data from the ~ 10m transect in front of the tripod. The mean scattering strength is plotted alongside the significant wave height (indicating storm events). The vertical calendar to the right indicates the last and current tripod acquisition windows along with the timing of the surface mounted EK-80 surveys.
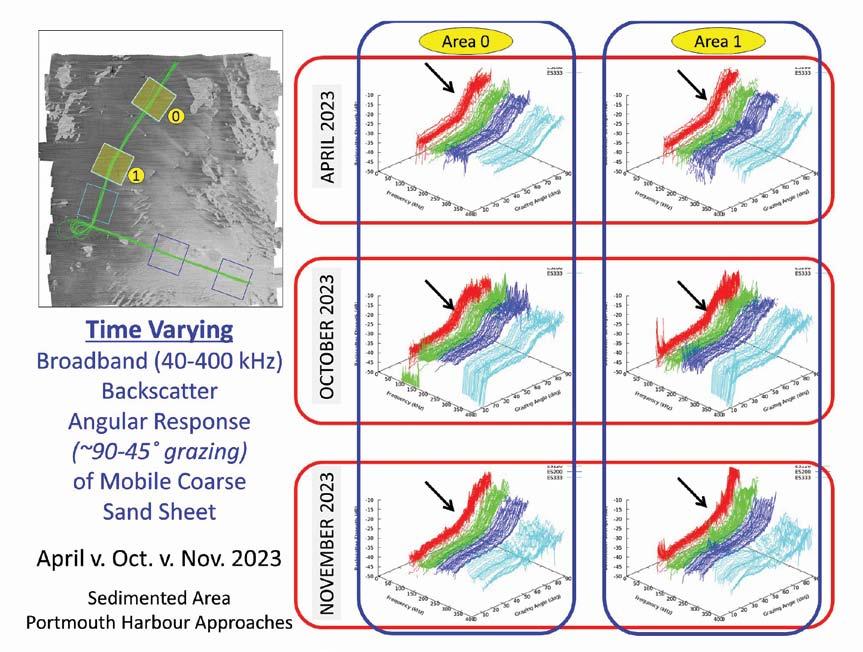
Figure ES-43. Broadband backscatter angular response for areas 0 and 1 as it changes from April to October to November. Black arrows indicate the angular region that appears to change the most.
To address the larger scale spatial variability, the same test area was surveyed nine times between November 2021 and July 2023 at approximately two-month intervals using a 300 kHz multibeam (EM2040P). As reported in 2022, the lower backscatter sand sheets were seen to vary in scattering strength by more than 5 dB from winter to summer. In contrast, the higher backscatter gravel and boulder fields appear to have little variability seasonally. To better understand these spatial changes and to better cover the broader frequency range on the tripod, an additional experiment was designed and is currently being implemented. It involves utilizing the four-EK80 transducer configuration previously used for Task 3, mounted on the strut of the R/V Gulf Surveyor
As we have nine surveys so far, we can start to investigate temporal variability in these broad band angular response curves. Figure ES-43 shows the same two areas (0 and 1) as viewed in April, October, and November 2023. As can be seen, while the areas all have similar angular response
curves (ARCs) with a strong angular dependence, the shape of the ARCs from 90 degrees to about 45 degrees shows significant changes from month to month. The changing level of specular peak and roll-off correlates well with the EM2040P backscatter data (when the ARC is not suppressed). It is suspected that this change (grazing angle > 45 degrees) is the reason for the shift in normalized multibeam backscatter strength from winter to summer.
These preliminary results will require significantly more work (filtering out noise sources—bubble clouds, bottom tracking errors, near-nadir grazing angle errors). Nevertheless, they appear to indicate real temporal changes. Relating these results to the tripod data may be difficult, however, as these data stop at 20 degrees grazing just as the tripod data start.

More details on this effort can be found at pressbooks.usnh.edu/2023jhc-task-narratives/chapter/task-30
31 January 2024 47 Executive Summary
Programmatic Priority 2
ADVANCE TECHNOLOGY FOR DIGITAL NAVIGATION
The second programmatic priority specified by the NOFO focuses on research to advance technology for digital navigation. Here the Center has undertaken a number of tasks that fall under the categories of delivery of bathymetric services from enterprise databases and innovative approaches to supporting precision navigation that include a range of new visualization techniques.
Task 31: Delivery of Bathymetric Services from Enterprise Databases
As part of our efforts to Advance Technology to Map U.S. Waters, we have been asked to explore new approaches to the delivery of bathymetric services from enterprise databases such as the National Bathymetric Source (NBS)—under development at NOAA's Office of Coast Survey—to provide a continuously updated, resolved estimate of bathymetry for all national hydrographic holdings.
The Center has always been a strong proponent of the idea that bathymetric data is incomplete without a statement of the uncertainty of the product. For modern high-resolution surveys this is now routine, but any compilation—such as the NBS—will likely have to construct its output from many (typically older) sources for many years to come. This makes it essential to understand the uncertainty associated with interpolated and sparse data. In the current reporting period, we have therefore been investigating the effects of interpolation on uncertainty, and how the uncertainty of a given product might be predicted in the absence of a high-resolution reference dataset. Using test cases from U.S. hydrographic holdings, Elias Adediran, Kim Lowell, and Christos Kastrisios have trained ML models to predict uncertainty from interpolated data and demonstrated the effect by sub-sampling dense data at different densities (with random sampling) and line-spacing (simulating a set-line spacing survey), with encouraging results. We have also worked closely with the NBS team to build and test prototype web services for the NBS (See Task 34).
The Center has also been active in developing and supporting the Bathymetric Attributed Grid (BAG) file format—a core data type for the NBS and a requirement for data submission in the new HSSD for the 2024 field season—particularly through our role in the Open Navigation Surface Working Group. This year, these efforts have significantly improved the documentation of the format and usability of the BAG reference library, including better testing, fuller documentation, and standard ways to install the software which are significantly simpler than the previous methods. Brian Calder, Brian Miles, and Glen Rice have also worked to prepare a proposal to the Open Geospatial Consortium for the BAG format to be recognized as a Community Standard, giving the project formal recognition in the community.

Further details of each of these projects can be found at pressbooks.usnh.edu/2023-jhc-tasknarratives/chapter/task-31
Task 32: Innovative Approaches to Support Precision Navigation
The Center has long pressed for innovative ways to bring high-resolution bathymetric and other datasets to the navigator in real-time, as well as to enhance the information that they are viewing. This has come to fruition in NOAA’s new efforts to support Precision Marine Navigation. Several of our efforts to support Precision Navigation include:
Interactive Air Gap Visualizations
To aid precision navigation and safe passage of larger vessels, NOAA has been installing air gap sensors on bridges that cross important, high traffic waterways, such as the Mississippi River. These sensors report the distance to the water below, and this value is adjusted by a known offset to reflect the air gap at a specific reference point on the bridge. Currently, only a single air gap value at the reference point is provided to pilots via the NOAA PORTS website, but Tom Butkiewicz and Ilya Atkin of the Center’s Visualization Lab have developed interactive web-based interfaces that can replace these static air gap diagrams with dynamic visualizations that provide air gap values anywhere under a bridge (Figure ES-44).
JHC Performance Report 48 Executive
Summary

Figure ES-44. Example of the new dynamic air gap visualization, which can show air gap values anywhere under any span of the bridge.

Entering a vessel’s required vertical clearance generates real-time, color-coded go/no-go indicators under every span of a bridge (Figure ES-45).
During this reporting period, feedback from Mississippi River pilots and stakeholders was gathered and used to improve the visualizations (e.g., adding to-scale bathymetry profiles). The JavaScript code, completed visualizations for all six bridges on the Lower Mississippi, and an open-source QGIS plugin for updating and generating new visualizations were delivered to NOAA PORTS for review.
Visualization and Integration of Bathymetric Data Quality on ENCs
It is essential that mariners understand the uncertainty associated with the information displayed on a chart or ECDIS, but the legibility and utility of current methods are limited. Thus, we have focused on developing new methods to visualize and integrate bathymetric data quality in ECDIS.
The Center continued efforts toward developing new symbology that will support Quality of Bathymetric Data in S-100. To facilitate this and other symbology efforts, an online Maritime service was set up for testing and sharing new symbology with the hydrographic community (Figure ES-46).

Following deliberations of the IHO S-101 Project Team in June 2022, we developed S-100 compliant Scalar Vector Graphics (SVGs) of the two countable textures of Lines and Dot Clusters to became part of the new draft IHO Portrayal Catalogue (Figure ES-47).
31 January 2024 49 Executive Summary
Figure ES-45. Color coded go/no-go indicators show where there is, and is not, sufficient vertical clearance to permit safe passage, based on user-provided vessel height.
Figure ES-46. An example of the lines scheme using the CCOM online Maritime Chart web service.
Executive Summary
The symbology will be tested by the new IHOSingapore symbology testing lab with S-100 ECDIS in simulators and at sea.
To reduce the cognitive burden on the navigator when reasoning about bathymetric uncertainty, and to reduce both errors and time required to plan a transit, we have also investigated two visualization methods for portraying uncertainty on charts. One draws a buffer zone around planned ship tracks, with width equal to the horizontal uncertainty of the underlying CATZOC (Figure ES-48, left), and the other draws buffers around selected chart features (Figure ES-48, right).

Further details of each of these projects can be found at pressbooks.usnh.edu/2023-jhc-tasknarratives/chapter/task-32

Task 33: Managing and Transforming Data to Navigation Products - Computer Cartography
Area Generalization & Side-Selective Line Simplification
In the current reporting period, we continued our efforts to facilitate chart compilation in collaboration with OCS and the international community. This includes the efforts focused on Cartographic Sounding Selection for a chart-ready sounding selection, Sounding Selection Verification for highlighting areas where sounding selection violates safety, Data Quality Polygon Simplification for the generation of data quality polygons from high-resolution bathymetric surfaces, Change Detection for facilitating depth compilation with illustrating areas of bathymetric change, Survey-to-CATZOC and cross check of Data Quality Chapters of S-1xx Product Specifications which aim to support harmonization of data quality metrics, assessment of their self-consistency, and explanation of differences of datasets produced by one or more adjacent Hydrographic Offices, and Automated Compilation of ENCs for producing lower-level-of-detail datasets while maintaining their topological integrity (Figure ES-49).


for visualizing bathymetric uncertainty while passage planning: (left)
JHC Performance Report 50
Figure ES-48. Synthetic charts illustrating two methods
Track Method, (right) Hazard Method.
Figure ES-47. An example of S-100 compliant dot-clusters using the IHO S-100 Viewer.

Figure ES-49. The constellation of research projects for chart compilation.
The benefits of the above and other relevant projects (Tasks 32, 34, and 37) were demonstrated at the international competition Speed Mapping Challenge, for prototyping a cartographic production chain using open data and free software, where the CCOM-led team won the first prize.


Figure ES-50. (a) Input data with influence domain buffers (b) Influence domain results (c) Input data with proposed method Voronoi diagrams and scale buffers (d) proposed method results.
31 January 2024 51 Executive Summary
Executive Summary
In this reporting period, we focused on the tasks of land area and depth contour generalization. For Land Area Generalization, the developed methodology utilizes recognition of an island’s shape, the concept of areas of influence through buffers, and the identification of isolated or near larger landmasses islands through a Voronoi diagram. Adhering to cartographic principles for nautical charting, minimum dimension tolerances are incorporated for deciding on collapsing and exaggerating islands. Furthermore, it incorporates other relevant chart feature classes (e.g., Navigation Lines and Aids-toNavigation) to maintain topology relations among different feature classes and to categorize islands based on their importance. Figure ES-50 shows the comparison of the method to that of influence domains (weighted buffers). For the depth contour generalization, we have been working on a parametric side-selective line generalization algorithm that utilizes line deviation angles to force the generalized line to move on the seaward side. Generalization is achieved through the elimination of vertices as well as their displacement, where necessary, to ensure that the length of segments exceeds the minimum allowable (0.33@scale) in ENCs. Displacement of a line is restricted by a user defined tolerance. Bends with small openings are maintained as isolated deeps if a circle of minimum size can be inscribed in them. Figure ES-51 illustrates an example of the side-selective line simplification algorithm though scales.

Many more details of the range of computer-aided cartography project can be found at pressbooks.usnh. edu/2023-jhc-task-narratives/chapter/ task-33
Task 34: Spatial Data Technology in the Context of Charting and Ocean Mapping
For over a decade, the Center has been operating, maintaining, and evaluating a variety of different geospatial platforms to host, visualize, and share data. More recently, the Center has utilized ESRI’s ArcGIS enterprise platform to meet these needs. This solution, which consists of a GIS data server, database, and interface portal (https://gis.ccom.unh.edu) has been used over the last year to provide a means of serving a wide range of different datasets. A highpoint for use of this geospatial solution was the Center working with NOAA OCS personnel through the winter and spring of 2023 to develop a prototype visualization and data assessment tool for the BlueTopo national bathymetric data source (Figure ES-53, left). This project involved assessing the Python scripts necessary for transferring and updating a local cache of the BlueTopo tiles, building a simple tool for ingesting those tiles, and implementing a web application to work with those tiles. The new web application allowed users to: visualize the bathymetry with a dynamically adjusted color pallet which adjusts the colors to match the range of depths in the area being viewed (Figure ES-52, second from left); query the contributing source for each depth point in the grid (Figure ES-52, third from left); and examine the Uncertainty associated with each depth point (Figure ES-52, right). These map services and the web application for BlueTopo were stood down in the late spring of 2023 after the release of NOAA’s nowCOAST BlueTopo map service.

Throughout the summer and fall of 2023, the Center also brought online many new map services and web applications which are all currently available through the Center’s GIS portal. These include: updated Extended Continental Shelf map services; a new interface to the New Hampshire Surficial Geology maps; updated maps and web applications for the Western Gulf of Maine, Long Island, and Southern New England bathymetry and backscatter compilation; and, finally, multiple new map services and applications for the GEBCO 2023 data—an ideal dataset to test the Portal’s ability to work with very large datasets.
The GEBCO services include a variety of different visualizations including
JHC Performance Report 52
Figure ES-51. A 1:40,000 contour generalized through scales using the developed algorithm.


ES-52. From left: BlueTopo bathymetry dataset including coverage for the Northeast U.S., Southeast U.S., Gulf of Mexico, and Puerto Rico. Second: High resolution bathymetry with a dynamically adjusted color palette. Third: Contributor layer indicating source of data.
changes in survey coverage over time, testing of different map projections, and creating an easy-to-use animated global visualization (Figure ES-53) or https://tinyurl.com/4n4cmv9v which allows the user to interact with the different GEBCO layers, including two different rendered bathymetric layers, a topography layer, Type Identification layer, and an indirect masking layer. Each of these map layers is overlaid on a 5x vertically exaggerated elevation layer in the web application, which allows the user to rotate and zoom in on the data from any viewing angle they wish to see.

Further details for each of these projects can be found at pressbooks.usnh.edu/2023-jhc-tasknarratives/chapter/task-34
Task 36: Tools for Visualizing Complex Ocean Data Sets
Advanced Multibeam Sounding Rendering
Despite advances in automated bathymetry data processing, human inspection and intervention is still necessary. Previous Center research has shown that a virtual reality interface can be advantageous for working with 3D data. Point clouds can be particularly challenging for desktop interfaces. However, VR interfaces require rendering two separate views (one for each eye) at extremely high frame rates to maintain a smooth experience.

(https://tinyurl.com/4n4cmv9v).
To create a new VR client for the CloudMap cloud-based bathymetry processing project (Task 16), Kindrat Beregovyi wrote a new computeshader based rendering pipeline that uses cutting-edge computer graphics techniques to render hundreds of millions of multibeam soundings at high frame rates (Figure ES-54).
31 January 2024 53 Executive Summary
Figure
Fourth: Uncertainty layer for the bathymetry.
Figure ES-53. The GEBCO 2023 globe web application
This application allows users to visualize the depth, elevation, and type identification overlaid on a 5x vertically exaggerated elevation.

3D Shorelines for Visual Reference Through Gaussian Splatting
While electric charts mostly focus on waterways, portraying features on shorelines can provide helpful visual reference for mariners. The Visualization Lab has previously incorporated panoramic photos into charting software, but photos are difficult to visually integrate with shorelines on a chart.


Point clouds, e.g., from lidar surveys, are easy to integrate on shorelines, but difficult to portray realistically. The lab has been experimenting with applying a new technique, known as 3D Gaussian Splatting, to combine the visual detail of photographs with the geolocation of point clouds, and populate the shorelines of 3D visualizations in Portable Pilot Units (PPUs) with more-realistic, solid-appearing 3D content (Figure ES-55).
Mobile VR Lab for Immersive Outreach
The Visualization Lab is leading a team of UNH computer science undergraduates working on a capstone project to create a Mobile VR Lab for outreach to schools. Virtual reality engages students and provides experiences they may never have an opportunity to encounter in real life, such as diving on a coral reef in a protected marine sanctuary. The system consists of relatively inexpensive self-contained Meta Quest 3 headsets, coordinated by a mini-PC and wireless router. A tablet provides instructors with a script to read, and the ability to control the headsets: moving students from one scene to the next and highlighting objects in the scenes as they are discussed. Students can freely explore the scenes to indulge their natural curiosity. While being developed with oceanographic data to communicate the Center’s research, the system is designed to be content-agnostic and easy to adapt for use in other domains.

Further details of each of these projects can be found at pressbooks.usnh.edu/2023-jhc-tasknarratives/chapter/task-36
JHC Performance Report 54 Executive Summary
Figure ES-54. Rendering ~400 million points from a San Francisco Bay multibeam survey on a 50 megapixel display at 60 frames per second.
Figure ES-55. Three views of the same dock facility: (top) colorized lidar points, (middle) 3D Gaussian Splats, (bottom) one of the original 360° camera photos used in the training process.

Figure ES-56. Preliminary symbols for the new feature types in S-126, S-127, and S-131, built for 3D interactive web- based applications.
Task 37: General Semiotics (Symbolic Communication)
Cartosemiotics
The new S-1xx product specifications being developed by IHO Working Groups enrich the navigation related information on Electronic Chart Display and Information System. However, many of them do not yet have defined symbology, e.g., the S-122 Marine Protected Areas, S-126 Marine Physical Environment (under development), S-127 Marine Traffic Management, and S-131 Marine Harbour Infrastructure (under development). Symbology is an essential part of mapping products as it helps humans to decode the mapped real-world features. Therefore, the Center has been working on developing symbology for the above four product specifications following a user-centered design (Figure ES-56). The main scope is their use with ECDIS, but they may also serve other uses, including 3D web-based applications. Sample symbols were evaluated using a user-survey and results will be used to improve the initial designs.
Other projects under the General Semiotics task include the development of a software toolkit to support the automatic translation of small Scaled Vector Graphic files (used to create symbols) into an IHO accepted format that can be brought directly into ENCs, and a careful re-evaluation of the appropriateness of the commonly used rainbow color map to convey bathymetric or other information.

Further details about this project can be found at pressbooks.usnh.edu/2023-jhc-task-narratives/ chapter/task-37.
Task 39: Hydrographic Data Manipulation Tools
VR Point Cloud Editor
Despite advances in automated data processing, there remains a necessity for humans to manually review or edit certain data. 3D point clouds can be particularly challenging to work with on desktop interfaces. The Visualization Lab has therefore completed development of an immersive virtual reality-based point cloud editor that
31 January 2024 55 Executive Summary
leverages VR’s stereoscopic head-tracked display and bimanual handheld controllers to increase the efficiency of inspecting and editing lidar and sonar datasets. The application, available via the Center’s website, works with almost any PC-connected VR system. A new plugin was developed to integrate the editor with QGIS and support existing NOAA NBS workflows. A new web-based interface assists editing configuration files containing feature classes, styles, colors, etc., that can be shared between the editor and QGIS. Voice commands allow users to quickly annotate and classify points without clunky menus.

Further details of this project can be found at pressbooks.usnh.edu/2023-jhc-task-narratives/ chapter/task-39.

Task 41: BathyGlobe/GapFiller
There have been new releases both of BathyGlobe, a software package designed to visualize seafloor mapping on a global scale, and GapFiller, designed to assist in planning mapping of both transits and area surveys as well as to optimize the filling of gaps in prior mapping coverage. It allows the easy laying down of lines, and automatically calculates the amount of coverage based on the best estimate of depth and knowledge of the sonar system being used. Both the transit mapping and area survey planning tools incorporate the automatic overlap adjustment method, and the production of detailed statistics representing survey coverage, overlap, and time to complete the survey.

A new web-based version of GapFiller is under development (Figure ES-57). It will use a new custom data grid, scraped and compiled from a number of sources such as NCEI, GMRT, and GEBCO. It will be easier to maintain and update, and it will support higher resolution data.
More details about BathyGlobe/GapFiller can be found at pressbooks.usnh.edu/2023-jhc-tasknarratives/chapter/task-41
JHC Performance Report 56
Summary
Executive
Figure ES-57. A screen-shot from the web based version of GapFiller.
Programmatic Priority 3
DEVELOP AND ADVANCE MARINE GEOSPATIAL AND SOUNDSCAPE EXPERTISE
The final prescribed programmatic priority calls for the development and advancement of marine geospatial and soundscape expertise. Our efforts to support this programmatic priority focus on our research into the contribution of echo sounders to the ocean soundscape (and in particular the impact of multibeam sonars on marine mammals) as well as our educational and outreach programs.
Task 43: Contribution of Echo Sounders to Ocean Soundscape
NOAA’s effort to map and characterize the seafloor relies on a wide variety of active acoustic systems such as multibeam echo sounders, wide-bandwidth single and split beam echo sounders, and sub-bottom profilers, among others. With expected increases in the use of active acoustic sources in support of NOMEC activities, comes the responsibility to ensure that these systems are used in a manner that protects marine life while preserving commerce, research, and exploration. Maintaining this balance requires knowledge of both the anthropogenic sound generated by commonly used scientific echo sounders, and knowledge of the impact of these systems on the local soundscape. The Center currently conducts research into the modelling and measurement of scientific echo sounder transmit radiation patterns, and practical analysis of their potential impact in soundscape studies.
MBES Propagation Modeling
The Center continues to research different approaches to modeling both the MBES and the propagation environment. This work was initiated during the Joint Industry Program Acoustic Modeling workshop (JAM2022), and the Center is in the process of publishing the work in the new year (February 2024) as part of a special issue on the topic of model verification. The work considers a fully defined deep water MBES similar with modern technologies such as multisector/multiswath capability. The impact of the high directionality of the MBES with a refractive acoustic environment is explored.
In addition, it was found that common propagation models overestimate levels in the nearfield, which has an impact on the resultant determination of marine mammal take and safety operation radius estimates. As seen in Figure ES-58, modeling MBES that uses standard propagation model BELLHOP has a threshold shift (TTS) radius out to 105 m and a permanent

31 January 2024 57 Executive Summary
Figure ES-58. Comparison of high frequency cetacean threshold ranges for SEL derived from BELLHOP modeling. Top: Threshold ranges for impulsive and nonimpulsive sources for the direct SEL outputs. Bottom: Threshold ranges for impulsive and non-impulsive sources for SEL after correcting for overestimated levels in the nearfield.

Figure ES-59. Example of material provided to DOSITS. Top: Timeseries of a ping from an EM122 in dual swath/ multisector mode with frequency modulated pulses used in the outer sectors. Each pulse is identified by its swath and sector respectively, Bottom: Spectrogram of the top figure showing the frequency content of the ping.
threshold shift (PTS) radius within 15 m for a nonimpulsive source classification. Correcting for BELLHOP’s overestimation of the nearfield results in a TTS radius of 55 m with no PTS levels.
Discovery of Sound in Sea Collaboration
The Discovery of Sound in the Sea (DOSITS) webpage is a compendium of knowledge relating to acoustics in the ocean and other aquatic environments. The pages on the site introduce readers of all levels to topics that range from anthropogenic sources of sound in the sea, the bioacoustics mechanisms behind the reception of sound in marine life, the importance of sound as a sensing modality, to the physics of sound generation. The site has become one of the primary sources of knowledge on acoustics in the sea for regulators. Researchers Michael Smith, Xavier Lurton, and Larry Mayer leveraged their knowledge of MBES to contribute material which
improves the websites pages on these systems. Apart from scientifically rigorous descriptions of MBES sound generation and operation, the researchers have provided sound recordings and imagery to improve the materials the public may access (ES-60). This contribution is likely to greatly improve regulatory and public understanding of MBES, both in how they operate and how they may impact marine life.
Soundscapes Expertise
Reilly Lessard, a new computer science master's student, has begun experimenting with applying machine learning approaches to soundscapes and marine mammal detections as part of a wider effort to evaluate if there are any effects of sonar use on animal behavior. A training dataset was extracted from the multi-year ADEON project passive acoustic recordings, which were previously processed by a Center Industrial Partner, JASCO Applied Sciences, using autodetectors and frequency-based audio filters to detect marine mammal events. Using a neural network to classify sounds can be faster and more accurate than serial autodetectors, so this approach could potentially enable real-time use during surveys. Results are promising so far, with occasional overfitting that will require further refinement. After training, the neural network will be tested using different recordings from the ADEON dataset and the results will be compared to existing soundscapes and event detections. Lessard, working in conjunction with Ph.D. candidate Grant Milne, also experimented with applying various established information visualization techniques, such as parallel coordinates, to visualize the relationships between soundscape variables for collections of underwater recordings at different sites. A notable outcome of this approach is how the habitat variables relate to the other variables. For example, the micro algae habitat recordings, on average, have a higher value for impulsivity, dissimilarity, periodicity, sound pressure level peak, and sound pressure level root mean square than those shown in sand habitat recordings.

More details on this task can be found at pressbooks.usnh.edu/2023-jhc-tasknarratives/chapter/task-43
JHC Performance Report 58
Executive Summary
EDUCATION AND OUTREACH
Task 44: Curriculum Development
Students and Curriculum
In addition to our research efforts, education and outreach are also fundamental components of our program. Our educational objectives are to produce a highly trained cadre of students who are critical thinkers able to fill positions in government, industry, and academia and become leaders in the development of new approaches to ocean mapping. Thirtythree graduate students were enrolled in the Ocean Mapping program in 2023—15 master’s students, seven doctoral students, seven GEBCO students, one Certificate student, two NOAA Corps officers, and one NOAA physical scientist technician. This past year, we graduated four M.S. and two Ph.D. students, while six GEBCO students received Certificates in Ocean Mapping.
We have continued our evolution to Python as the preferred programing language for ocean mapping courses and continue to develop a Python E-Learning course and Python-based lab modules that are better aligned and sequenced with material taught in class. Our newly developed “Introduction to Ocean Mapping” course is explicitly for undergraduates and continues to be successful. This year, one student who took the course as an undergraduate joined our graduate program.
Once again, our Summer Hydrographic Field Course was wellsubscribed and produced important hydrographic results in an area around Portsmouth Harbor, NH where previous data from the NOAA Ship Rude existed. Each student was involved in the planning and execution of the survey, processing of the collected data, and report writing (Figure ES-60).
This year we have developed a new remote Natural Resources and Earth Systems Science (NRESS) Ph.D. Option for Cartographers and Ocean Mappers. Senior professionals often have strict obligations—such as family and jobs— that prevent them from pursuing advanced degrees and conduct-
ing research on a cartography/ocean mapping-related topic in an academic setting. This, combined with the limited availability of online programs and the residency requirement for graduate students set forth by academic institutions, including UNH, creates great constraints over who can enter Ph.D. programs. In collaboration with UNH Natural Resources and the Environment, we proposed a Ph.D. option in NRESS with a selection of online courses that was approved by UNH leadership, thus waiving the residency requirement and allowing candidates to complete the program remotely, without the need for relocation.
We are also in the process of restructuring the master's degree in Ocean Mapping Option program. The existing Geodesy and Positioning for Ocean Mapping course is proposed to be extended into two courses: "Geodesy for Ocean Mapping," and "Positioning for Ocean Mapping." The decision to develop these courses is a result of student feedback about the disconnect between the Mathematics for Geodesy course offered by the UNH Mathematics Department and the curriculum offered through the Center. Students expressed a preference for developing the topics in the geodesy course along with the required math to have a more consistent delivery of the material by the same instructor.

More details about our curriculum can be found at pressbooks.usnh. edu/2023-jhc-task-narratives/chapter/ task-44

31 January 2024 59 Executive Summary
Figure ES-60. Poster representing the priority survey off Portsmouth, NH.
Executive Summary
Nippon Foundation/GEBCO Training Program
The Center was selected to host the Nippon Foundation/GEBCO Bathymetric Training Program in 2004 through an international competition that included leading hydrographic education centers worldwide. UNH was awarded a grant from the General Bathymetric Chart of the Oceans (GEBCO) to create and host a one-year, graduate level training program that has been renewed now for 20 years. To date, 120 students from 50 coastal states have participated (Figure ES-61). This year’s students are from Oman, Greece, Tunisia, Algeria, Panama, Jamaica and Colombia—significantly building capacity in coastal states around the Mediterranean and Caribbean seas.
Task 45: Delivery of Results: Publications and Presentations
The Center actively publishes results of its research and makes numerous presentations at national and international meetings. Full lists of the Center’s 2023 publications and presentations can be found online:

Publications at can be found at www.ccom.unh.edu/publications
Task 46: Outreach

Presentations and Invited Seminars can be found at pressbooks.usnh.edu/2023-jhc-tasknarratives/back-matter/technical-presentations
We recognize the interest that the public takes in our work and our responsibility to explain the importance of what we do to those who ultimately bear the cost. One of the primary methods of this communication is our website, ccom.unh.edu. In 2023, the website had 117,673 views from 43,215 unique visitors from 193 countries.
We also recognize the importance of engaging young people in our activities to ensure that we will have a steady stream of highly skilled workers in the field. To this end, we have upgraded other aspects of our web presence including a Vimeo site, a Facebook presence, and a LinkedIn page. Our Vimeo site now has 233 videos that were viewed 2,300 times in 2023. Our Ocean Seminar series featured 34 seminars in 2023 (Figure ES-62). The seminars are widely advertised and webcast, giving NOAA employees, our industrial partners, and alumni around the world the opportunity to listen and participate. The seminars are also recorded and uploaded to Vimeo for later viewing.

Along with our digital and social media presence, we maintain an active “hands-on” outreach program of tours and activities for school children and the general public (Figure ES-63). In 2023, under the supervision of Tara Hicks Johnson, the Center provided individual outreach opportunities for almost 900 students (often paired with testing SeaPerch ROVs in the University pools). In addition, we visited schools for STEM days, helped facilitate ship to shore broadcasts with E/V Nautilus for an entire elementary school and, in our largest event, Ocean Discovery Days, hosted over 1500 students for our student day and then another 1000 people at our Public Day, where we filled the halls and tents outdoors with interactive activities to learn all about the ocean-related research and technologies being developed at UNH.
JHC Performance Report 60
Figure ES-61. Distribution of Nippon Foundation GEBCO Training Program students.


We continue work with the Portsmouth Naval Shipyard to host school teams building SeaPerch ROVs as well as host the Seacoast SeaPerch Regional Competition where 50 teams from New Hampshire, Maine, and Massachusetts competed for the chance to compete at the International SeaPerch Competition. In addition to working with schools, we also offer an educator training workshop for those interested in bringing the SeaPerch program to their schools or out of school groups. In addition to these major outreach events that we manage each year, we also participate in smaller events and conferences. For example, the Center exhibited at the U.S. Hydrographic Conference in Mobile, Alabama, and participated in the UNH booth


at both the SACNAS Diversity in STEM Conference in Portland, Oregon and the Fall American Geophysical Union Meeting in San Francisco, CA. Participating in these booths allows us to showcase videos and materials related to our research and academic programs, and to have staff, faculty, and students available to chat with any interested researcher or prospective students.

More details about our Outreach Program can be found at pressbooks.usnh. edu/2023-jhc-task-narratives/chapter/ task-46


31 January 2024 61 Executive Summary
Figure ES-62. A few of the 34 flyers produced for the 2023 Ocean Seminar Series.
Figure ES-64. A sampling of the Center's outreach activities.
Executive Summary
The highlights presented here represent only a fraction of the activities of the Joint Hydrographic Center in 2023; more detailed discussions of these and other activities, as well as a complete list of the Centers' publications and presentations can found through the links provided throughout this text. Other pertinent information capturing the activities of the Center in 2023 is available on the website at the following links:


Faculty and Staff
ccom.unh.edu/people
Facilities, IT, and Equipment
pressbooks.usnh.edu/2023-jhc-task-narratives/back-matter/facilities-it-equipment
Research Vessels and Platforms Report
pressbooks.usnh.edu/2023-jhc-task-narratives/back-matter/research-vessels-and-platforms
Graduate Degrees in Ocean Mapping
pressbooks.usnh.edu/2023-jhc-task-narratives/back-matter/graduate-degrees
Current Graduate Students
pressbooks.usnh.edu/2023-jhc-task-narratives/back-matter/current-graduate-students
2023 Field Programs
pressbooks.usnh.edu/2023-jhc-task-narratives/back-matter/field-programs
Other Sources of Support
pressbooks.usnh.edu/2023-jhc-task-narratives/back-matter/other-sources-of-support
JHC Performance Report 62

31 January 2024 63 Executive Summary

