housing starting to flex


AFTER AN EXTREMELY SLOW END TO 2022, BUYERS ARE RETURNING TO THE HOUSING ARENA, DEMAND IS ALREADY UP SHARPLY, AND MARKET TIMES ARE PLUNGING FAST.


Getting to a movie theater early, sitting in the pews of an empty church with plenty of time until the service begins, and being seated immediately at a popular restaurant before the dinner rush are all examples of moments in time where it seems as if very few are going to show up. Yet, in the blink of an eye, the theater is packed, the church pews have been filled, and there is an hour-long waitlist at that favorite restaurant. That is precisely what is occurring right now in housing A month ago, open houses were empty, showings were light, and there was little real estate activity as everyone’s collective brains were still in a holiday fog Seemingly overnight, buyers have returned, demand has surged higher, and market times have plunged.
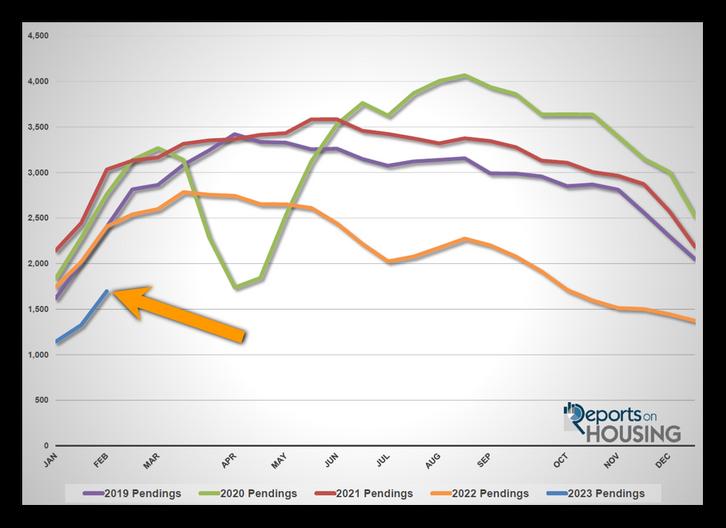
Demand, a snapshot of the last 30 days of pending sales activity, jumped 28% in just the past couple of weeks, adding 371 pending sales as it climbed to 1,698. It was the largest two-week rise since February last year and the strongest demand reading since midOctober The current level is similar to the low readings during the initial lockdowns of COVID in April 2020 Demand levels have been lower than the lockdowns since October of last year.
It is crucial to keep in mind that demand is still at shallow levels for this time of year. It is 29% below last year at the start of February and 37% below the 3-year average before the pandemic (2017 to 2019) Due to affordability constraints, the high mortgage rate environment still precludes many would-be purchasers from isolating a home Demand would be much stronger if rates dropped to the mid-5s.
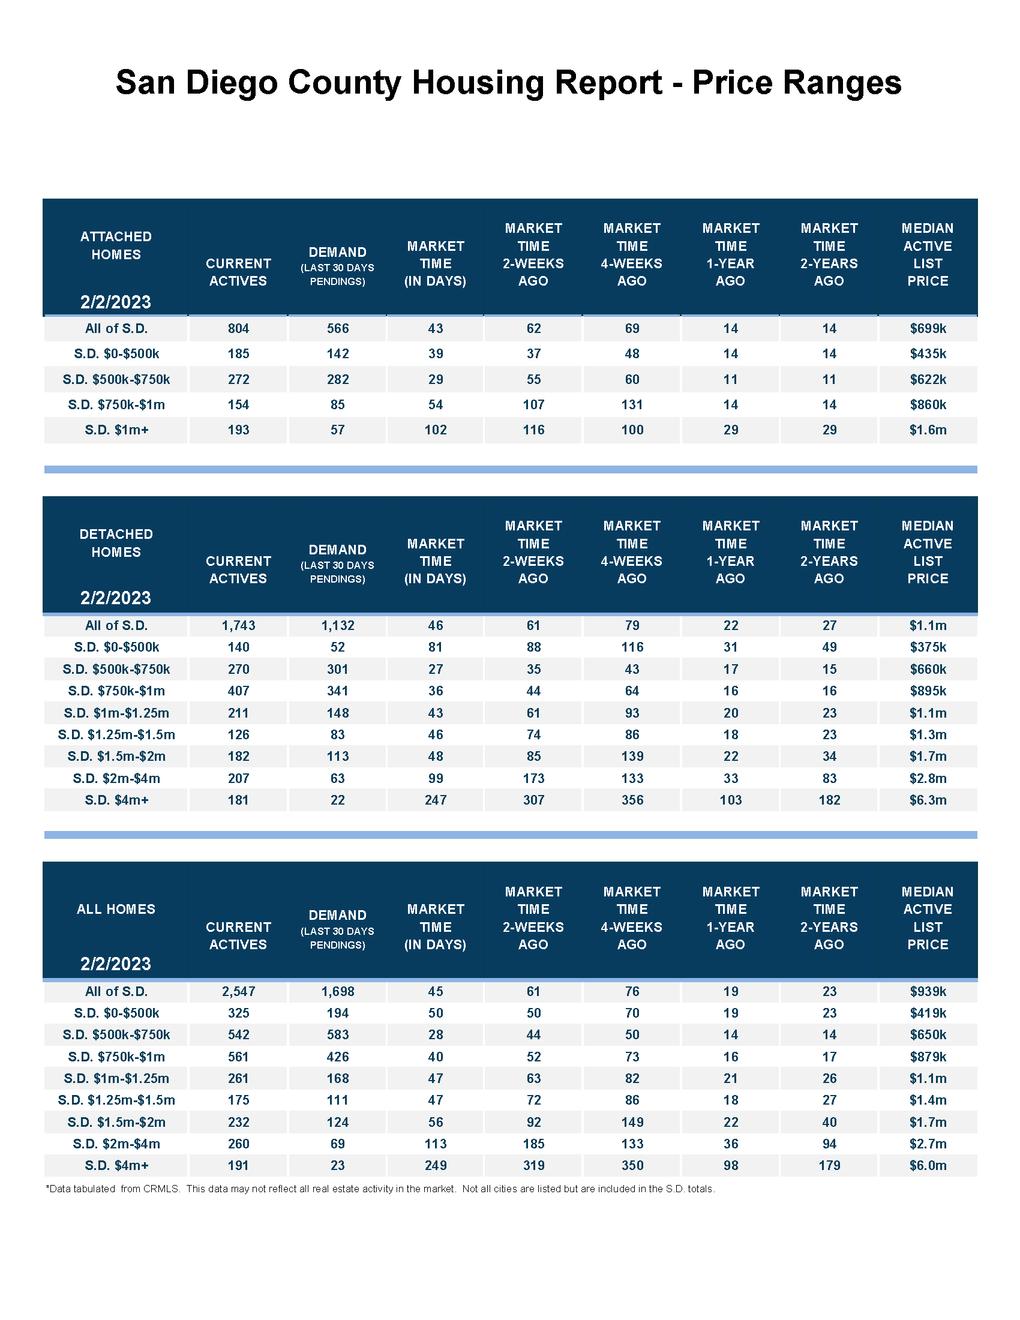
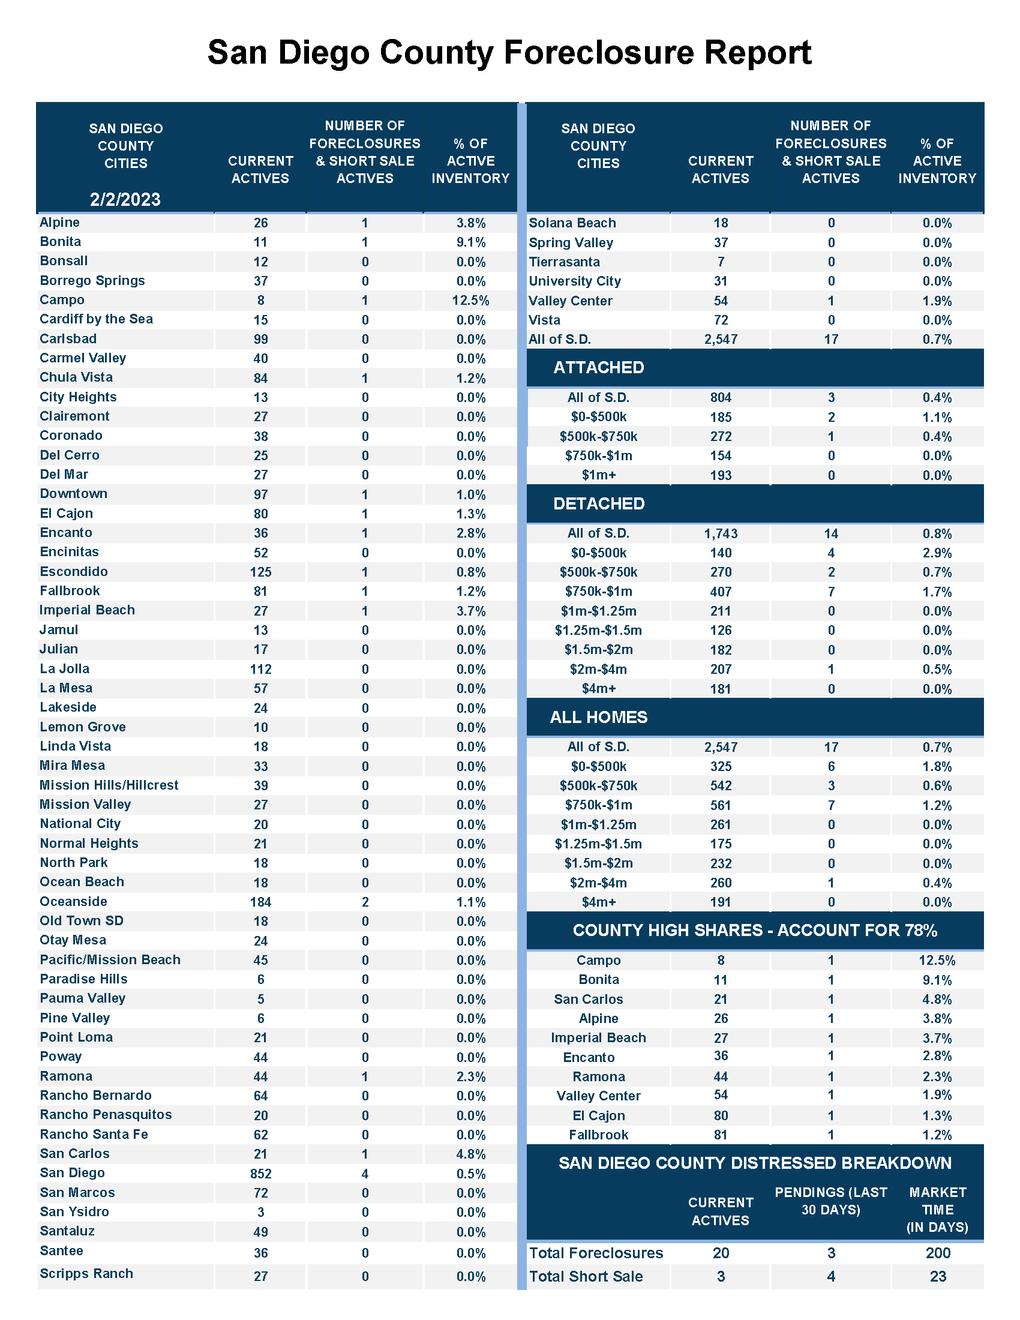
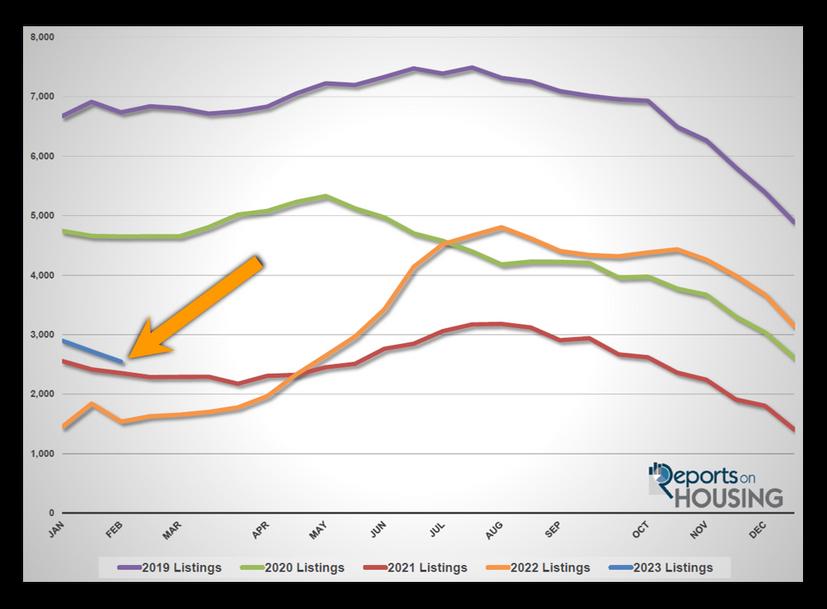
Demand is also muted due to the lack of available homes to purchase. From the first week of January to today, the inventory dropped by 12% and now sits at 2,547 homes It usually rises by 15% The 3-year pre-COVID average was 5,380, 111% higher than today, more than double Feeding into this inventory crisis is that fewer homeowners are listing their homes In January alone, there were 49% fewer sellers than the 3-year average, with 2,134 missing FOR-SALE signs. Fewer sellers mean there are fewer pending sales and less demand.
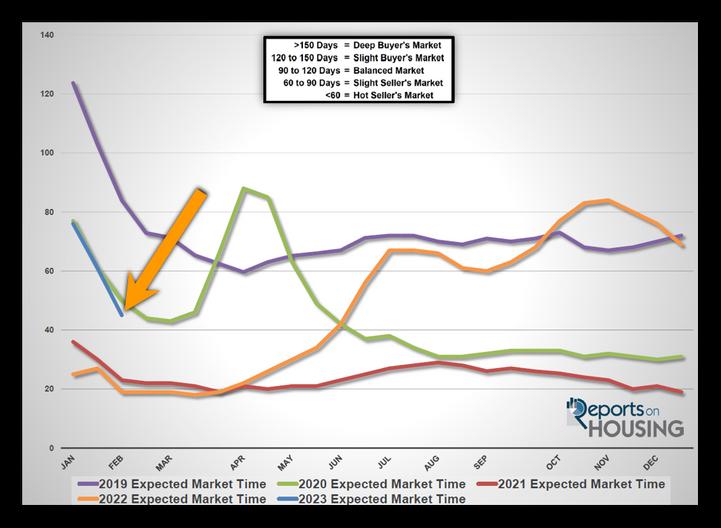
The current trend is rapidly increasing demand matched up against a lack of available homes to purchase, which is slowly dropping As a result, market times are plunging In the past two weeks alone, the Expected Market Time, the time between coming on the market and changing to pending status, tumbled from 61 to 45 days, shedding 16 days, its lowest level since June last year. For buyers in the trenches, the change is palpable. Suddenly, homes are selling a lot quicker. When a home is appropriately priced according to its Fair Market Value, considering location, condition, upgrades, amenities, and age, it will acquire plenty of immediate attention and sells fast. As market times drop, buyers are losing some of the momentum developed over the past six months That does not mean that buyers are willing to stretch and pay over the asking price Housing is not back to the heydays of the pandemic years of 2020 through the first half of last year It does mean that the increased competition will slow the pressure on falling home values.
A WARNING TO SELLERS: Home values are NOT climbing right now. Overpricing a home in this market will result in a lack of success and waste valuable market time. Until rates fall considerably from here to at least the mid-5s, home values will not rise.
A WARNING TO BUYERS: Lowball offers to purchase and looking for a “deal” will be an exercise in futility Due to the high mortgage rate environment, the market has lined up in favor of buyers up to this point. That advantage is diminishing with the significant drop in market times. Sellers are not desperate and are not panicking to sell, unable to afford their monthly mortgage payments. Instead, carefully arriving at an offer to purchase based on a home’s Fair Market Value is a winning formula for isolating a home.
choose to stay in their homes. An astonishing 89% of all homeowners with a loan have a mortgage rate at or below 5%, and 71% are at 4% or lower. There will continue to be fewer sellers until mortgage rates drop to the mid-5s or lower, closing the gap between current rates and their underlying fixed rates Expect more homeowners to list their homes during the Spring Market, between mid-March and mid-June, the optimal time for families to place their homes on the market so that they can close during the summer months while the kids are out of school.
Homeowners continue to “hunker down” in their homes, unwilling to move due to their current underlying, locked-in, low fixed-rate mortgage The difference between their underlying rate and today’s prevailing rate is significant and precludes many homeowners from listing their homes for sale and moving to another house. This will continue until t t d F J 2 204 ll t d th k t i S Di
are a memory at this point. Expect demand to continue to rise through the month of February rapidly. If mortgage rates fall below 6% with duration, that will instigate more demand
Last year, demand was at 2,407, 42% more than today, or an extra 709. The 3-year average before COVID (2017 to 2019) was 2,683 pending sales, 58% more than today, or an additional 985.
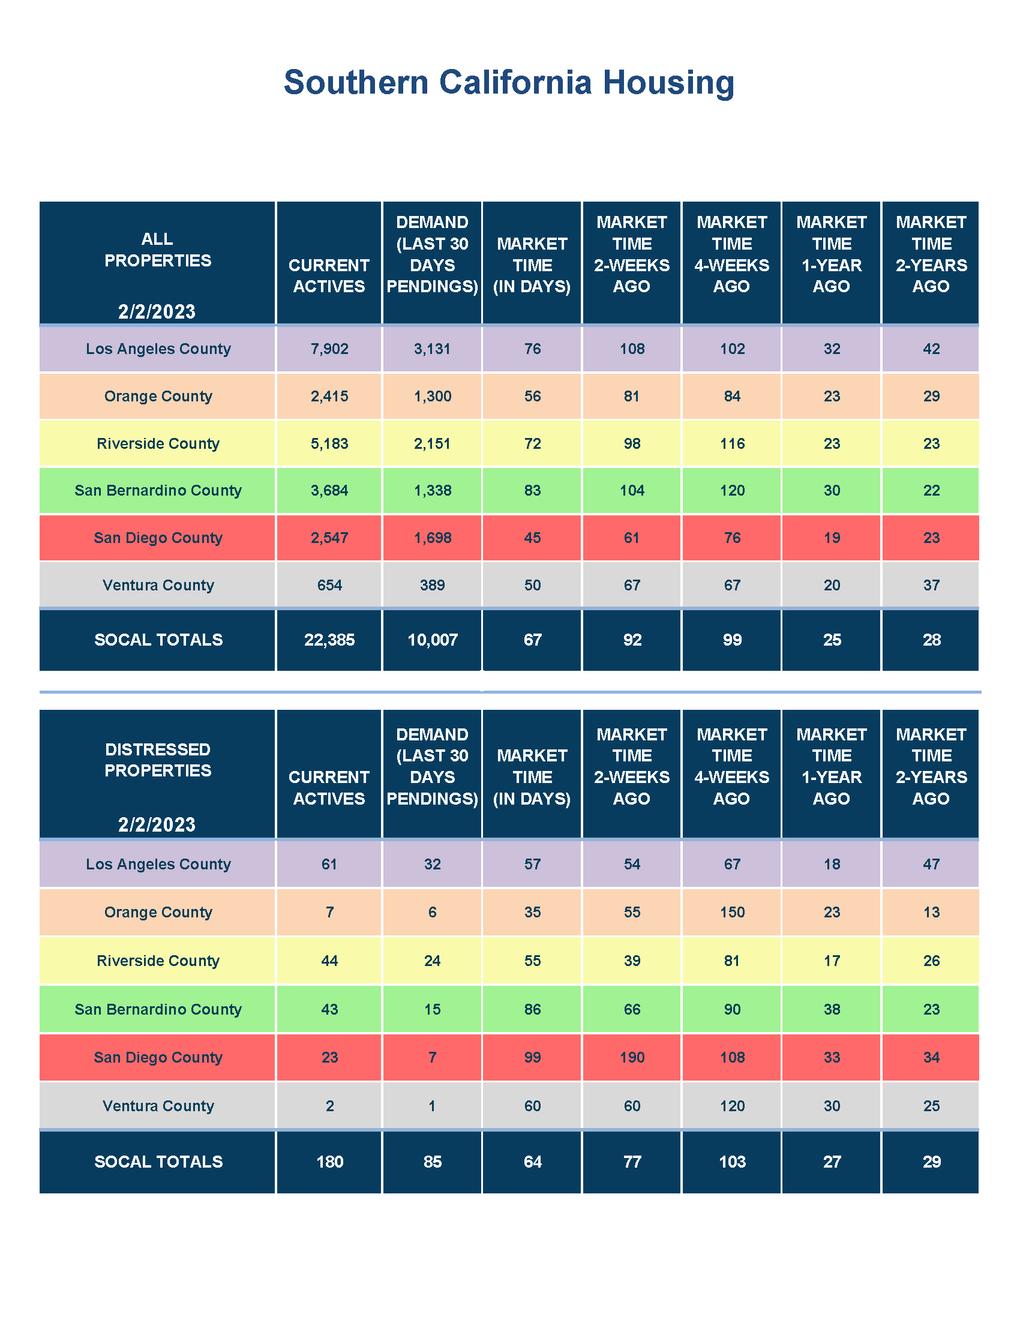
With demand surging higher and the supply falling, the Expected Market Time (the number of days to sell all San Diego County listings at the current buying pace) plunged from 61 to 45 days in the past couple of weeks, its lowest level since June Last year the Expected Market Time was 19 days, substantially faster than today, and home values were screaming higher. The 3-year average before COVID was 61 days, a slower pace than today.
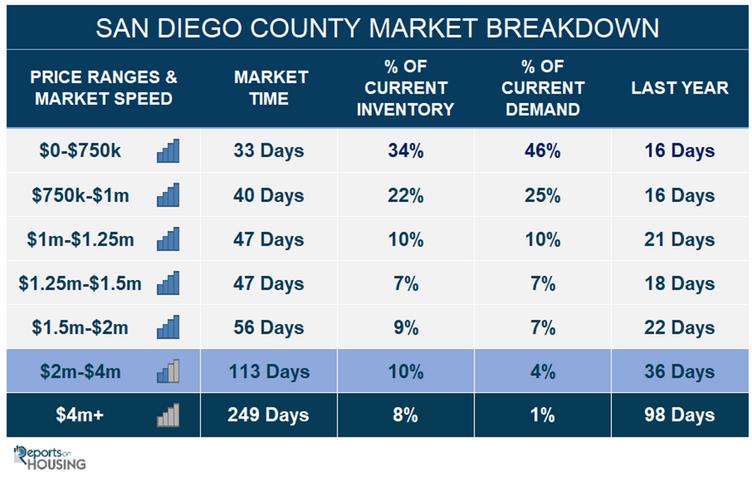
In the past couple of weeks, the luxury inventory of homes priced above $1.5 million decreased from 697 to 683 homes, down 14 homes or 2%. Luxury demand increased by 73 pending sales, up 51%, and now sits at 216. With demand increasing faster than supply, the overall Expected Market Time for luxury homes priced above $1.5 million decreased from 146 to 95 days The luxury market is not quite as slow as before COVID but is not as fast as in the past couple of years either Expect the luxury market to continue to improve over the next month.
Year over year, luxury demand is down by 93 pending sales or 30%, and the active luxury listing inventory is up by 282 homes or 70%. Last year’s Expected Market Time was 39 days, which is extremely hot for luxury.
For homes priced between $1 5 million and $2 million, the Expected Market Time in the past two weeks decreased from 92 to 56 days For homes priced between $2 million and $4 million, the Expected Market Time decreased from 185 to 113 days. For homes priced above $4 million, the Expected Market Time decreased from 319 to 249 days. At 249 days, a seller would be looking at placing their home into escrow around December 2023.