Power BI Dashboard for Different Industries

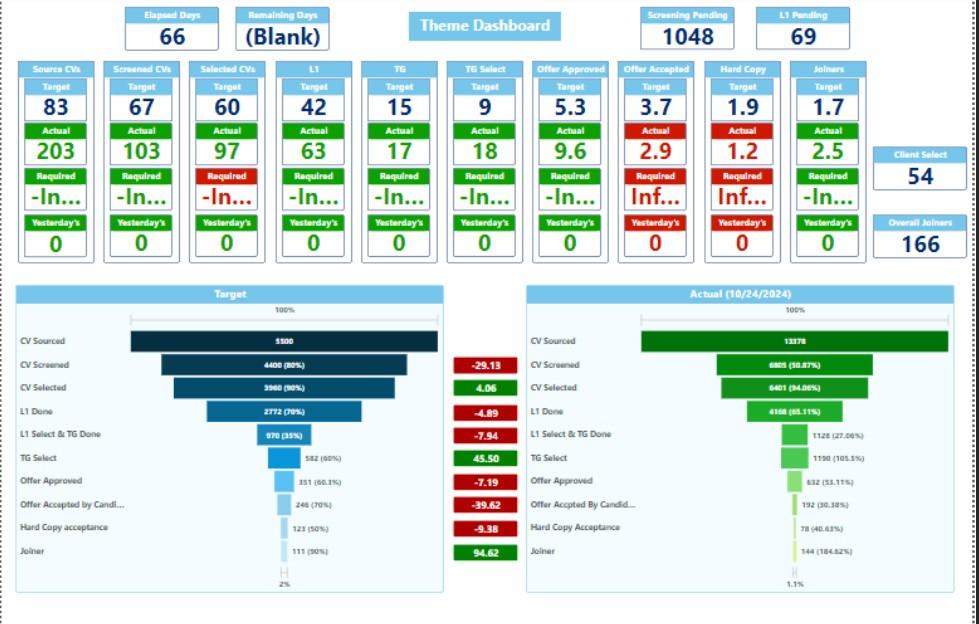
• Client: Pharma Company
• Previous Technology: Excel, .NET Reports, SAP Crystal Reports
• New Technology: Power BI (Primary), PowerApps, Power Automate
• Data Security Risks: Limited security and version control in Excel.
• Data Silos: Scattered information across platforms.
• Static Reports: Non-interactive reports with poor UI.
• Complexity: Difficult for non-technical users; outdated SAP Crystal Reports.
• Performance Issues: Server slowdowns with large reports.
• Manual & Outdated Data: No mobile access or real-time updates.
• Enhanced Security: Robust data governance and compliance.
• Centralized & Interactive Dashboards: Real-time insights with drill-down features.
• User-Friendly Interface: Modern UI with rich visualizations for easy use.
• Seamless Integration & Collaboration: Supports various data sources and collaboration.
• Automation & Mobile Access: Automated updates and mobile accessibility for on-thego reporting.
• Improved Efficiency: Streamlined workflows and scalability for future needs.
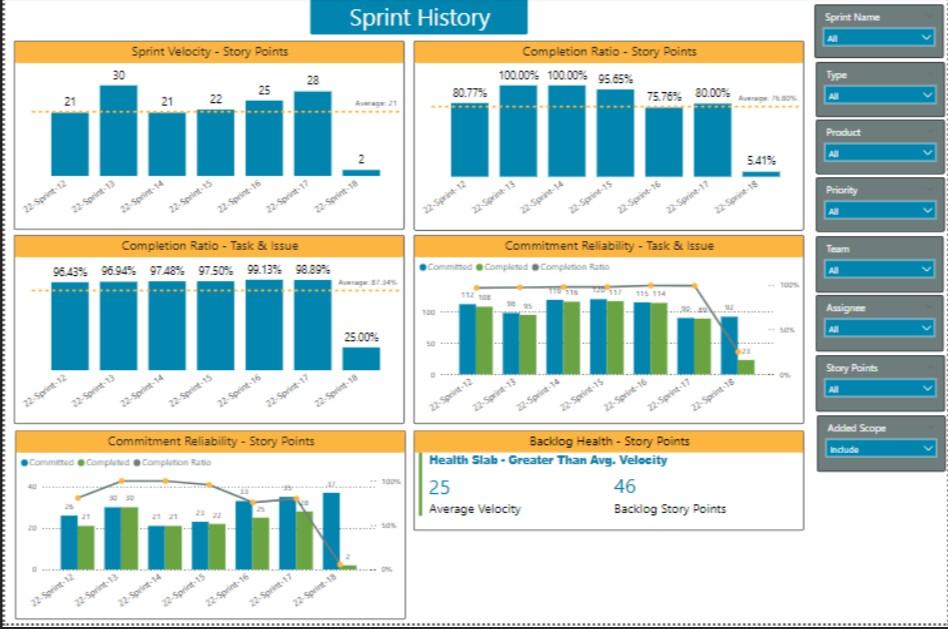
• Previous Technology Used : Used Excel
• New technology Used: Power BI and PowerApps
• Problem Statement
• Trouble in taking data driven decisions
• Outcome:
• Better reporting
• Data is used at its fullest for taking data driven decisions
• Better analysis and sales trends
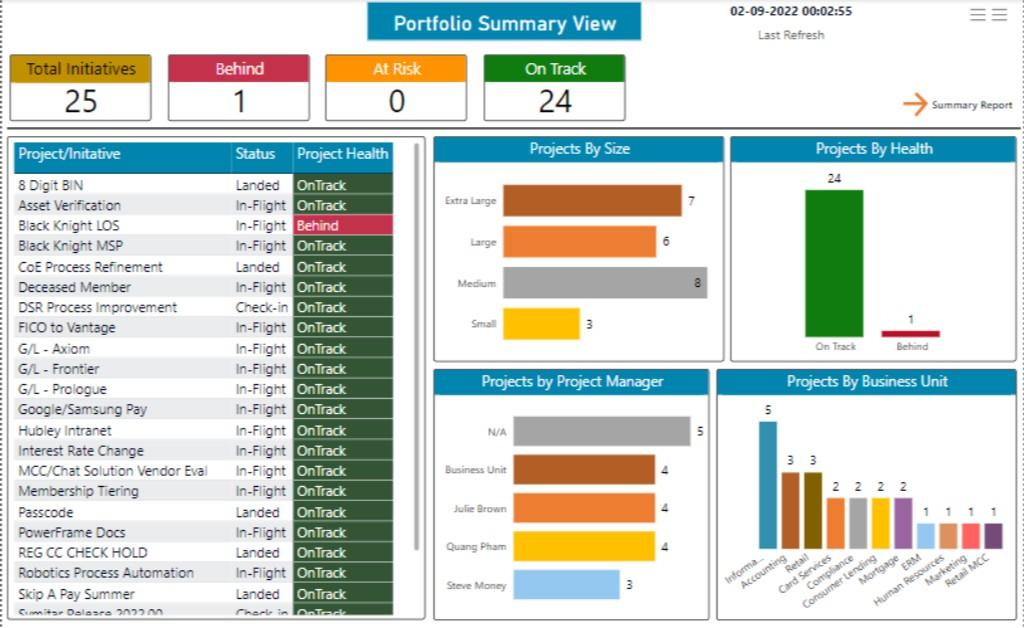
• Previous Technology Used: Mostly excel or nothing
• New technology Used: Power BI
• Problem Statement: Reporting and collaboration issue
• Outcome: Data-driven decisions and every dept now has Power BI for reporting