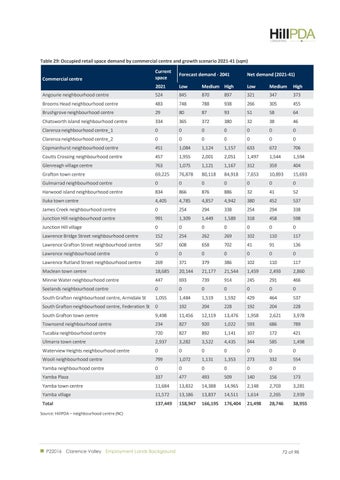
Table 29: Occupied retail space demand by commercial centre and growth scenario 2021-41 (sqm) Current space
Forecast demand - 2041
Net demand (2021-41)
2021
Low
Medium High
Low
Medium
High
Angourie neighbourhood centre
524
845
870
897
321
347
373
Brooms Head neighbourhood centre
483
748
788
938
266
305
455
Brushgrove neighbourhood centre
29
80
87
93
51
58
64
Chatsworth island neighbourhood centre
334
365
372
380
32
38
46
Clarenza neighbourhood centre_1
0
0
0
0
0
0
0
Clarenza neighbourhood centre_2
0
0
0
0
0
0
0
Copmanhurst neighbourhood centre
451
1,084
1,124
1,157
633
672
706
Coutts Crossing neighbourhood centre
457
1,955
2,001
2,051
1,497
1,544
1,594
Glenreagh village centre
763
1,075
1,121
1,167
312
359
404
Grafton town centre
69,225
76,878
80,118
84,918
7,653
10,893
15,693
Gulmarrad neighbourhood centre
0
0
0
0
0
0
0
Harwood island neighbourhood centre
834
866
876
886
32
41
52
Iluka town centre
4,405
4,785
4,857
4,942
380
452
537
James Creek neighbourhood centre
0
254
294
338
254
294
338
Junction Hill neighbourhood centre
991
1,309
1,449
1,589
318
458
598
Junction Hill village
0
0
0
0
0
0
0
Lawrence Bridge Street neighbourhood centre
152
254
262
269
102
110
117
Lawrence Grafton Street neighbourhood centre
567
608
658
702
41
91
136
Lawrence neighbourhood centre
0
0
0
0
0
0
0
Lawrence Rutland Street neighbourhood centre
269
371
379
386
102
110
117
Maclean town centre
18,685
20,144
21,177
21,544
1,459
2,493
2,860
Minnie Water neighbourhood centre
447
693
739
914
245
291
466
Seelands neighbourhood centre
0
0
0
0
0
0
0
South Grafton neighbourhood centre, Armidale St
1,055
1,484
1,519
1,592
429
464
537
South Grafton neighbourhood centre, Federation St
0
192
204
228
192
204
228
South Grafton town centre
9,498
11,456
12,119
13,476
1,958
2,621
3,978
Townsend neighbourhood centre
234
827
920
1,022
593
686
789
Tucabia neighbourhood centre
720
827
892
1,141
107
172
421
Ulmarra town centre
2,937
3,282
3,522
4,435
344
585
1,498
Waterview Heights neighbourhood centre
0
0
0
0
0
0
0
Wooli neighbourhood centre
799
1,072
1,131
1,353
273
332
554
Yamba neighbourhood centre
0
0
0
0
0
0
0
Yamba Plaza
337
477
493
509
140
156
173
Yamba town centre
11,684
13,832
14,388
14,965
2,148
2,703
3,281
Yamba village
11,572
13,186
13,837
14,511
1,614
2,265
2,939
Total
137,449
158,947
166,195
176,404
21,498
28,746
38,955
Commercial centre
Source: HillPDA – neighbourhood centre (NC)
P22016 Clarence Valley Employment Lands Background
72 of 98


