

The economic and social impact of United Colleges Group

A Report for United Colleges Group
July 2025
The economic and social impact of United Colleges Group
A Report for United Colleges Group
July 2025
London Economics is one of Europe's leading specialist economics and policy consultancies headquartered in London. We advise clients in both the public and private sectors on economic and financial analysis, policy development and evaluation, business strategy, and regulatory and competition policy.
Our consultants are highly qualified economists with experience in applying a wide variety of analytical techniques to assist our work, including cost-benefit analysis, multi-criteria analysis, policy simulation, scenario building, statistical analysis and mathematical modelling. We are also experienced in using a wide range of data collection techniques including literature reviews, survey questionnaires, interviews and focus groups.
Head Office: Somerset House, New Wing, Strand, London, WC2R 1LA, United Kingdom.
w: londoneconomics.co.uk
e: info@londoneconomics.co.uk : @LE_Education
t: +44 (0)20 3701 7700 @LondonEconomics
We would like to acknowledge the useful data, guidance and feedback provided by United Colleges Group throughout this research, with particular thanks to Stephen Davis, Rob Boucherat, Munish Bector, and Alec Meyeringh. Despite the assistance, responsibility for the contents of this document remains with London Economics.
Authors
Marina Symington, Economic Consultant, msymington@londecon co uk
Sam Hartshorn, Economic Analyst, shartshorn@londecon.co.uk
Maike Halterbeck, Partner, mhalterbeck@londecon.co.uk
Dr Gavan Conlon, Partner, gconlon@londecon.co uk
Source of pictures: United Colleges Group. Source of icons: Microsoft PowerPoint.


Wherever possible London Economics uses paper sourced from sustainably managed forests using production processes that meet the EU ecolabel requirements.
Copyright © 2025 London Economics. Except for the quotation of short passages for the purposes of criticism or review, no part of this document may be reproduced without permission.

I am pleased to introduce this London Economics–commissioned report, which explores the economic impact of United Colleges Group on both London and the wider UK economy. In the early days of a new government that has rightly recognised Further Education as the engine room for skills and growth, this report reinforces the vital role our college plays ─ one that is representative of the wider college sector across the country.
If further proof were needed that a well-funded Further Education sector is a smart and necessary investment, this report provides it. United Colleges Group serves as a clear example of an anchor institution, working at the heart of its communities to meet the skills needs of London and its people. The case for sustained and increased investment in skills is compelling. A longterm, equitable funding settlement over the next decade would demonstrate a commitment to national progress that transcends party politics. The stakes are simply too high for our country’s future to ignore.
I would like to thank London Economics for their rigorous analysis, which confirms what we have long believed about the transformative impact of our college. Now, it is no longer just what we believe, it is what we know and what you can now see for yourself.
The economic evidence is clear: colleges in England offer strong public value and impact ─ especially when compared with other uses of public funds. Our role extends far beyond opportunity and access; we contribute across all five missions central to the delivery of the new Industrial Strategy (IS8), both in the medium and long term. Let colleges show just how technically brilliant we are. Don’t just take our word for it… read the report.

Stephen Davis FRSA Chief Executive & Group Principal
United Colleges Group (UCG) was formed as a merger of City of Westminster College and the College of North West London, which combined into UCG in 2017 to form a new college group with a complementary curriculum, significant experience in the delivery of further education (FE) and training, and a wide geographical spread. With 6 campuses across 3 London boroughs in Central and North West London, UCG is the 7th largest general FE college in London, and a key anchor institution and core part of the local and regional community. UCG’s learners include 1618 year-olds, adult learners (aged 19+), apprentices, and learners with special needs, and the College1 provides learning and training opportunities across a wide range of areas and subjects.
London Economics were commissioned to analyse the economic impact of UCG’s activities, focusing on the 2023-24 academic year.
The total economic impact on the UK economy associated with UCG’s activities in 2023-24 was estimated at approximately £351 million (see Table 1).2 Within this total:
The impact of the College’s teaching and learning activities stood at £351 million (75%), including £244 million accrued by students and £108 million accrued by the Exchequer; and

The total economic impact associated with UCG’s activities in 2023-24 was estimated at £470 million.

The impact generated by the College’s operating and capital expenditures stood at £118 million (25%), including £59 million of direct impact, and £60 million of indirect and induced impact. In terms of location of impact, £100 million of the impact of UCG’s spending was generated in London, with the remaining £19 million generated throughout the rest of the UK.
Table 1 Total impact of United Colleges Group’s activities on the UK economy in 2023-24
Note: All estimates are presented in 2023-24 prices, rounded to the nearest £1m, and may not add up precisely to the totals indicated. Source: London Economics' analysis
1 While UCG retains both the College of North West London and the City of Westminster College as individual colleges, throughout this report, we refer to UCG as ‘the College’ (i.e. as a single combined provider) for simplicity.
2 All estimates here are presented in terms of economic output (equivalent to income/expenditure). The impact of the College’s operating and capital expenditures can also be converted into gross value added (GVA) and full-time (FTE) employment, and these additional findings are provided within Section 3 of this report.
The total economic impact associated with UCG’s activities in 2023-24 was estimated at £470 million.
Compared to the College’s relevant operational costs of £51 million in 2023-243 , the total impact of United Colleges Group’s activities on the UK economy was estimated at £470 million, which corresponds to a benefit-to-cost ratio of approximately 9.3:1
The analysis of the impact of the College’s teaching and learning activities estimates the enhanced employment and earnings benefits to learners, and, separately, the additional taxation receipts to the public purse associated with further education (FE) and apprenticeship attainment at the College.4 The analysis focuses on the 9,510 learners who started FE qualifications or apprenticeships at United Colleges Group in the 2023-24 academic year, and is adjusted for the specific characteristics of these students.
The economic impact of teaching and learning generated by the 2023-24 cohort of UCG students stood at £351 million.


Incorporating both the expected costs associated with qualification attainment and the labour market benefits expected to be accrued by students over their working lives, the analysis finds substantial net learner benefits and net Exchequer benefits associated with qualification attainment at UCG. For example, the average net learner benefit achieved by a representative student in the 2023-24 cohort completing a full-time Level 2 vocational qualification (with a Level 1 vocational qualification as their highest prior attainment) stands at approximately £68,000. Taking account of the benefits and costs to the public purse, the associated net Exchequer benefit was estimated at £27,000. The corresponding net learner benefit per student completing a full-time Level 3 vocational qualification at the College (relative to a Level 2 vocational qualification) was estimated at £62,000, with a net Exchequer benefit of £40,000.
Table 2 Impact of UCG’s teaching and learning activities associated with the 2023-24 cohort (£m), by beneficiary, mode, and level of study
Note: All estimates are presented in 2023-24 prices, discounted to reflect net present values, rounded to the nearest £1m, and may not add up precisely to the totals indicated. For simplicity, in the table, the estimates for apprenticeship learners are included within the results for full-time students. Source: London Economics’ analysis
The net learner benefits and net Exchequer benefits (by gender, study mode, and study level, and adjusted for the subject mix of the cohort (where possible)) were combined with information on the
3 This relates to the College’s operating expenditure in 202 3 24 excluding any depreciation, and also excluding any capital expenditure.
4 The estimation of the net learner benefit and net Exchequer benefit is based on a detailed econometric analysis of the UK Lab our Force Survey of the impact of further education qualification and apprenticeship attainment on earnings and employment outcomes . However, as no information is specifically available on the particular institution attended, the analysis is not specific to UCG’s students. Rather, the analysis is adjusted to reflect the characteristics of the 202 3 24 cohort of UCG students to the greatest extent possible (e.g. in terms of mode of study, level of study, subject mix, gender, average age at enrolment, or duration of qualification).
number of learners starting FE qualifications or apprenticeships at the College in 2023-24, as well as expected completion rates. The resulting aggregate economic impact generated by UCG’s teaching and learning activities associated with the 2023-24 cohort stood at approximately £351 million (see Table 2). Of this total, £244 million (69%) is accrued by students undertaking FE qualifications or apprenticeships at the College, and the remaining £108 million (31%) is accrued by the Exchequer.
UCG’s physical footprint supports jobs and promotes economic growth throughout London and the wider UK economy. This is captured by the direct, indirect, and induced impact associated with the College’s expenditures, which measure the additional economic activity generated by UCG’s expenditure, throughout its supply chain as well as through the expenditure of its employees.
The direct impact of the College’s physical footprint was based on its operating and capital expenditures, standing at £59 million in 2023-24 (including £51 million of operating expenditure5 and £8 million of capital expenditure). We then assessed the indirect and induced economic impacts associated with UCG’s expenditures, using economic multipliers derived from a (multi-regional) Input-output model. These effects capture the additional rounds of spending throughout the economy that are generated by the College’s expenditures (through the College’s supply chain and the spending of its staff). Applying relevant economic multipliers, the total direct, indirect, and induced impact associated with the College’s expenditures in the 2023-24 academic year was estimated at £118 million (see Figure 1). The majority of this impact (£100 million, 84%) occurred in London (including £54 million in Inner West London and £34 million in Outer West and North West London6). The remainder (£19 million, 16%) was accrued across the rest of the UK.

The impact of United Colleges Group’s expenditures in 2023-24 stood at £118 million.

In terms of the number of FTE jobs supported, the College’s expenditures supported a total of 1,145 FTE jobs across the UK economy in 2023-24, with 995 located in London (including 545 in Inner West London and 355 in Outer West and North West London).
1 Impact associated with United
Note: All estimates are presented in 2023-24 prices, rounded to the nearest £1m, and may not add up precisely to the totals indicated. Source: London Economics’ analysis
5 The total operational expenditure (excluding capital expenditure) of United Colleges Group in 2023-24 stood at £57 million. From this total, for the purpose of the analysis, we excluded £6 million in depreciation costs (from non-staff expenditure), as it is assumed that these costs are not relevant from a procurement perspective (i.e. these costs are not accounted for as income by other organisations).
This results in relevant operating expenditure of £51 million in 2023-24. Adding in capital expenditure of £8 million, we thus reach the total value of £59 million of expenditure included throughout the analysis.
6 Inner West London includes the boroughs of Camden, Kensington & Chelsea, Hammersmith & Fulham, Wandsworth, Westminster, and the City of London. Outer West and North West London includes the boroughs of Barnet, Brent, Ealing, Harrow, Hillingdon, Hounslow, and Richmond upon Thames.
£470m economic imp act
The econom ic im p act associated with U nited Colleges Group’s activ ities in 2023-24
£351m
Im p act of U CG’s teaching and learning activ ities, includ ing £244 m accr ued b y lear ner s, and £108m by the Ex cheq uer
£118m
Im p act of U CG’s op erating and cap ital ex p end itur es in 2023-24
UCG is one of the m ost d iverse FE Colleges in the countr y, with 69% of lear ner s b eing of non-White ethnicity 2 out of 3
The College supp or ts 1,150 FTE job s in the U K, including 545 in Inner West Lond on*, and 995 acr oss the whole of Lond on 1,150 FTE job s
*Includes Westminster, City of London, Camden, Kensington & Chelsea, Hammersmith & Fulham, Wandsworth

10,500 learners
Num b er of lear ner s who und er took FE q ualifications or ap p r enticeship s at U CG in 2023-24

U CG is the 7th largest General Further Education College in London* 7th *B ased on D fE statistics on enrolments in adult (19+) Further Education and Training in 2023-24
9.3
For ev er y £1 of operating expenditure, UCG generates £9.30 of economic impact
6 camp uses
U CG op erates 6 cam p uses acr oss 3 Lond on b or oughs:
Wem b ley Park Willesd en Euston
Padd ington Green Maid a Vale The Cockp it

£65m exp end iture
The total op erating (£57m) and capital (£8m) expenditures by United Colleges Group in 2023-24
Top 100
U CG was ranked as one of the National Centre for Diversity’s Top 100 Inclusive UK Eemployers in 2024. UCG was the only central London further edication college to feature in the Top 100, placing 53rd.
United Colleges Group (UCG) was formed as a merger of City of Westminster College and the College of North West London, which combined into UCG in 2017 to form a new college group with a complementary curriculum, significant experience in the delivery of further education (FE) and training, and a wide geographical spread. With 6 campuses (including Wembley Park, Euston, Willesden, Maida Vale, Paddington Green, and the Cockpit Theatre) across 3 London boroughs in Central and North West London (Westminster, Camden, and Brent), UCG is the 7th largest general FE college in London7 , and a key anchor institution and core part of the local and regional community. UCG’s learners include 1618 year-olds, adult learners (aged 19+), apprentices, and learners with special needs, and the College8 provides learning and training opportunities across a wide range of areas and subjects.
London Economics were commissioned to assess the economic impact of UCG on the United Kingdom. The analysis focuses on the 2023-24 academic year, and estimates the College’s contribution to the UK’s national prosperity through:
The economic contribution of UCG’s provision of teaching and learning, in terms of the wide range of FE qualifications and apprenticeships offered by the College. In particular, in Section 2, we assess the improved labour market earnings and employment outcomes associated with further education and apprenticeship attainment at the College. Through an assessment of the expected lifetime benefits and costs associated with educational attainment, we assess the net economic benefits of the College’s teaching and learning activity to its students and the public purse, focusing on the cohort of 9,510 students9 who started FE qualifications or apprenticeship training at UCG in 2023-2410; and
The impact of the College’s operating and capital expenditures. Given the size and geographical spread of the College and the significant expenditures with which it supports its activities, UCG’s substantial physical footprint supports jobs and promotes economic growth throughout London and the wider UK economy. Section 3 presents the estimated direct, indirect, and induced economic impacts associated with the operating and capital expenditures incurred by UCG in 2023-24.
Section 4 of this report summarises our main findings on the economic impact of UCG.
Finally, in addition to these economic effects, there are numerous noneconomic or societal benefits associated with skills and qualification acquisition at United Colleges Group. For example, these include an increased appetite for further learning, the acquisition of knowledge relevant to both current and future endeavours, a smoother transition into adulthood by preparing learners for working life, increased independence, the development of key social skills, and a higher likelihood
7 Based on further education and skills statistics published by the Department for Education (2025) in relation to the number of enrolments in adult (19+) further education and training by college in 2023-24.
8 While UCG retains both the College of North West London and the City of Westminster College as individual colleges, throughout this report, we refer to UCG as ‘the College’ (i.e. as a single combined provider) for simplicity.
9 In terms of domicile, note that all of these are UK (English) domiciled students, and there are no non-UK domiciled students studying at UCG.
10 Out of this total of 9,510 learners in the 2023-24 cohort, 9,405 students started FE qualifications at UCG, and the remaining 110 learners started apprenticeship training at the College (numbers may not add up precisely to the totals due to rounding). FE students here include students who started predominantly vocational qualifications (or a small number of academic qualifications) at the College, at Entry Level up to Level 5 on the Regulated Qualifications Framework (RQF) (though the number of students in the cohort undertaking Level 4 or 5 qualifications was very small, standing at less than 10 learners). Apprenticeships include Intermediate Apprenticeships (Level 2) and Advanced Apprenticeships (Level 3) offered at the College.
of community participation (among others). In Section 5, we present the wider impacts of the College on its students and society at large, based on the results of a survey of former learners conducted by J2 Research.
The College’s teaching and learning activities provide significant benefits to the UK economy, by improving the labour market productivity of the College’s learners. In this section, we analyse the economic impact of the teaching and learning activities undertaken at UCG, by considering the labour market benefits associated with enhanced qualification attainment and skills acquisition – to both the individual and the public purse
The analysis of the economic impact of the teaching and learning activities of United Colleges Group is based on the 2023-24 cohort of students studying at the College. In other words, instead of UCG’s entire student body of 10,480 students in the 2023-24 academic year (irrespective of when these learners may have started their studies), the analysis in this section focuses on the 9,510 (English domiciled11) students who started further education qualifications12 or apprenticeships in the 2023-24 academic year.13
United Colleges Group offers a wide range of qualifications to fulfil the skills needs of Central and North West London and beyond, including education programmes for young (1619) learners, adult learning programmes, apprenticeships, and programmes for learners with high needs - ranging from Entry Level to Level 5. As presented in Figure 2, in terms of level of study, approximately 32% (3,025 students) in the cohort were undertaking Entry Level qualifications14 , with a further 2,615 students (27%) undertaking Level 2 qualifications, 2,005 (21%) undertaking Level 3 qualifications, and 1,750 (18%) undertaking Level 1 qualifications. In addition, there was a very small number of students (less than 10, <1%) enrolled in Level 4 or 5 vocational qualifications (all on a part-time basis), and the remaining 110 learners were undertaking apprenticeships, including Intermediate (Level 2, 65 learners) and Advanced Apprenticeships (Level 3, 45 learners)15
As presented in Figure 3, the College’s curriculum also includes a wide range of subject areas, with 3,905 students in the 2023-24 cohort (41%) enrolled in courses in Preparation for Life and Work16 , 1,420 (15%) undertaking programmes in Construction, Planning and the Built Environment, 960 (10%) enrolled in Health, Public Services and Care courses, 595 (6%) enrolled in Business,
11 In terms of domicile, note again that there are no non-UK domiciled students studying at UCG, and all learners studying at the College in 2023-24 were English domiciled prior to starting their qualifications/apprenticeship training.
12 FE students predominantly include students who started vocational qualifications (such as BTECs or vocational diplomas, certificates, or other awards) at United Colleges Group (but there was also a small number of students who started academic qualifications (such as GCSEs or GCE A levels) at the College).
13 We received Individualised Learner Record (ILR) data on a total of 9,590 first-year students/apprentice learners from United Colleges Group. From this total, we excluded 60 students with an unspecified qualification level, and 15 students who were undertaking higher education qualifications. Individual learners might be undertaking multiple qualifications/learning aims at UCG in any given year. Here, to ensure that the analysis focuses on unique learners (i.e. to avoid double-counting), UCG ‘collapsed’ its original ILR data to the unique learner level by focusing on the ‘largest’ qualification/learning aim that each individual learner was undertaking (based on total planned learning hours).
14 For example, these include a range of ESOL (English for Speakers of Other Languages) courses offered at UCG.
15 In relation to students’ highest prior educational attainment before starting their learning at UCG, a relatively high proportion of students (17%) in the 2023-24 cohort had their prior educational attainment recorded as either ‘not known’ or ‘other qualification level not known’ (due to the generally limited coverage of the relevant prior attainment variable within the ILR data). In the absence of more consistent, reliable, and complete information on students’ highest level of prior attainment, we therefore assumed that all students starting a given level of FE qualification/apprenticeship at the College in 2023-24 were in possession of the next highest (lower) level of qualification (based on the assumed counterfactual groups presented in Table 11 in Annex A2.2.3). This potentially results in an underestimation of the ‘true’ economic benefits associated with qualification attainment at United Colleges Group, as, in reality, it is expected that a number of students in the cohort were in possession of lower levels of prior attainment than those assumed here.
16 These courses account for most of the College’s Entry Level students, and predominantly relate to ESOL courses offered at UCG.
Administration and Law courses, and 550 (6%) enrolled in Arts, Media and Publishing and Information and Communication Technology courses, respectively.
Overall, the 9,510 students in the 2023-24 cohort of UCG students were spread across more than 250 separate courses (i.e. learning aims).
Figure 2 Number of students in the 2023-24 cohort of UCG students, by level of study
Figure 3 Number of students in the 2023-24 cohort of UCG students, by subject area of study
Preparation for Life and Work
Construction, Planning and the Built Environment
Health, Public Services and Care
Business, Administration and Law
Arts, Media and Publishing
Information and Communication Technology
Other
Note: All numbers are rounded to the nearest 5, and the total values may not add up due to this rounding.
Source: London Economics’ analysis based on ILR data provided by United Colleges Group
In relation to mode of study (Figure 4), most students in the cohort (5,940, 62%) were undertaking their studies at United Colleges Group on a part-time basis (with these students predominantly being adult learners), while 3,465 (36%) were enrolled on a full-time basis (predominantly including 1619 learners). Again, the remaining 110 learners were undertaking apprenticeships.
Figure 4 Number of students in the 2023-24 cohort of UCG students, by mode of study
# of first year learners, 2023-24
Note: All numbers are rounded to the nearest 5, and the total values may not add up due to this rounding.
Source: London Economics’ analysis based on ILR data provided by United Colleges Group
Figure 5 presents a breakdown of the cohort by ethnicity. United Colleges Group is one of the most diverse FE colleges in the country, with as many as 69% of learners in the 2023-24 cohort being of non-White ethnicity, including Asian students (16%), Black/African/Caribbean students (22%), Arab students (13%), mixed ethnicity students (8%), and students from other ethnic groups (10%). Only 24% of students in the cohort were White17 . In comparison, across all adult (19+) FE learners in England in 2023-24 (see Figure 6), 68% were White, with only 28% having non-White ethnicities18 .
Figure 5 Number of students in the 2023-24 cohort of UCG students, by ethnicity
Note: All numbers are rounded to the nearest 5, and the total values may not add up due to this rounding. The information includes both adult and 1619 learners studying at United Colleges Group.
Source: London Economics’ analysis based on ILR data provided by United Colleges Group
Figure 7 presents the distribution of United Colleges Group’s 2023-24 cohort of student starters by Local Authority, based on each learner’s permanent/’home’ address. The map illustrates the
17 The remaining 7 had an unknown ethnicity (‘not provided’).
18 The remaining 4 had an unknown ethnicity (‘not provided’).
College’s importance as a key local anchor institution in Central and North West London, with special importance to the London Boroughs of Brent and Westminster. Among all first-year students studying at the College in 2023-24, the majority were living in Brent and its surrounding Local Authorities, with 36% of students (3,450) living in Brent; 7% coming to study at the College from Westminster (695 students), 6% living in Barnet (615 students), and 5% (respectively) living in Ealing (465 students) and Camden (430 students).
Finally, in terms of location of study, out of the 9,510 learners in the cohort, 4,085 (43%) were studying at the College of North West London, and 5,425 (57%) were enrolled at the City of Westminster College
Figure 7 Students in the 2023-24 cohort of UCG students, by Local Authority of home address
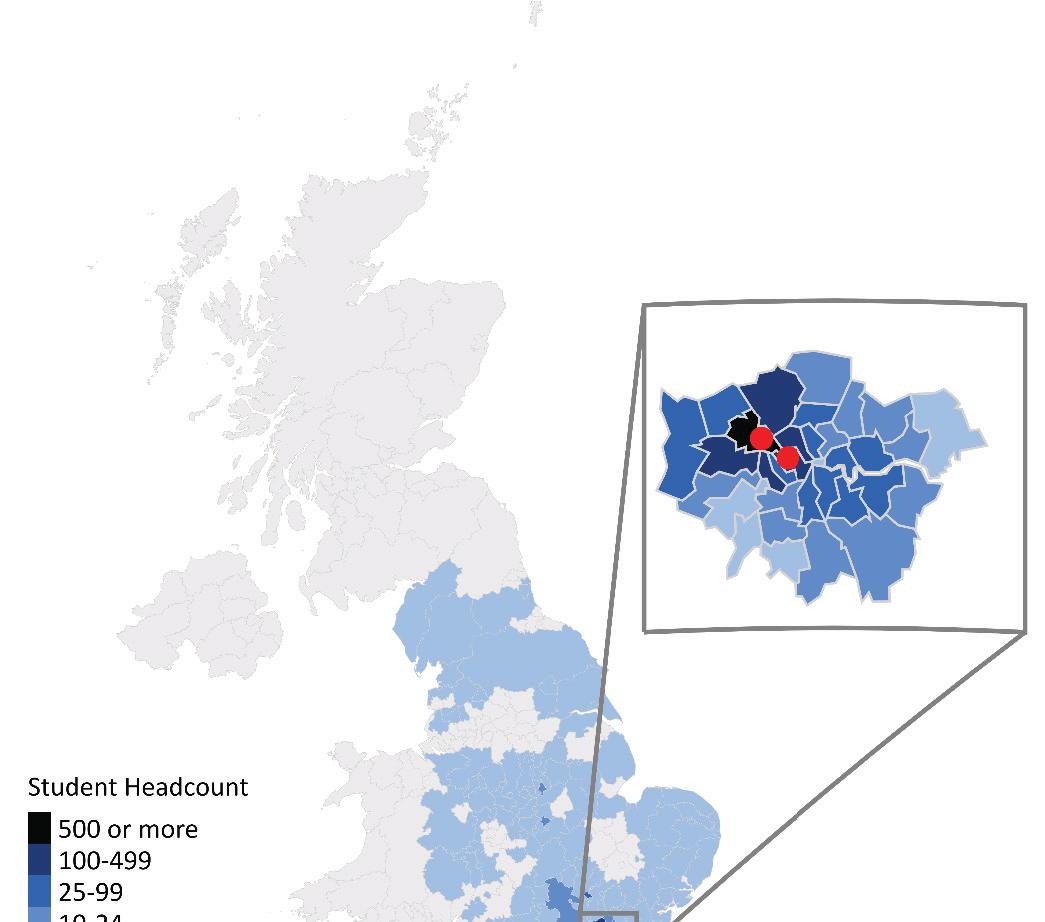

Note: Based on students’ home postcodes during their studies at United Colleges Group (which, in most cases, is expected to be the same as the postcode of their ‘domicile’ prior to their studies (i.e. their address prior to enrolment at the College)). The figure is based on 9,510 students (excluding 1 learner with an invalid postcode).
Source: London Economics’ analysis based on ILR data provided by United Colleges Group and the Office for National Statistics. Contains National Statistics, OS, Royal Mail, Gridlink, ONS, NISRA, NRS, and Ordnance Survey data © Crown copyright and database right 2024.
The above information provides an overview of the number of students starting FE qualifications or apprenticeships at United Colleges Group in the 2023-24 academic year. As outlined in further detail in the methodological annex (see Annex A2.2.1), to aggregate the individual level impacts of the College’s teaching and learning activity, we adjusted this number of ‘starters’ to account for completion rates.


United Colleges Group (UCG) were named as one of the National Centre for Diversity’s Top 100 Inclusive UK Employers for 2024.

Celebrating best practice in Fairness, Respect, Equality, Diversity, Inclusion and Engagement, the publication of the 2024 Top 100 Most Inclusive UK Employers acknowledges the remarkable achievements of organisations who have committed to building inclusive cultures. The Top 100 Index highlights employers across various sectors, including construction, education, charities and public service. The rankings are based on employee feedback from organisations that work towards the C D’s Investors in Diversity standard.

UCG is the only central London college to feature in the Top 100, placing 53rd, and one of only 17 colleges in total to feature in the latest annual list, which recognises organisations that have taken strong steps to embed inclusive practices into the core of their operations.
UCG was also previously officially recognised with its first Investors in People (IIP) accreditation – a testament to its unwavering commitment to employee development and organisational excellence.
“The inspiring organisations that make the Top 100, demonstrate excellent levels of employee retention and recruitment and clearly demonstrate how they value and respect the people that work for them.”


Solat Chaudhry, Chief Executive at the National Centre for Diversity

“It means so much to us all to be a part of helping to drive Equality, Diversity and Inclusion forward. Congratulations to every individual who works tirelessly to make UCG a better place to work, where everyone is included and belongs.”

Stephen Davis, CEO and Group Principal, United Colleges Group
In April 2025, United Colleges Group hosted the Westminster Council Community Eid Celebration at its Paddington Green Campus. Westminster City Council staff member, Rafika Ougad, led the event, which was organised to support social cohesion and reconciliation between local Kurdish and Iraqi communities.
The evening welcomed around 200 local residents, including children and adults. The community was encouraged to share and celebrate their heritage with one another over food and activities, including cultural exhibitions, games, VR experiences, DJs, henna stations, and photo booths.
Several Westminster Councillors and both current and former MPs joined the event, which marked an inspiring opportunity for neighbours of different cultural backgrounds to unite in the festivities.


The analysis of the impact of the College’s teaching and learning captures the enhanced labour market benefits and taxation receipts (minus the costs of attendance/provision) associated with students in the above cohort completing qualifications at United Colleges Group. Specifically, the fundamental objective of the analysis is to estimate the gross and net learner benefit to the individual and the gross and net public purse benefit to the Exchequer associated with FE qualification and apprenticeship attainment at UCG. These measures are defined as follows (and presented in Figure 8 and Figure 9 for further education qualifications and apprenticeships, respectively):
The gross learner benefit associated with qualification attainment is defined as the present value of enhanced after-tax earnings (i.e. after income tax, National Insurance and VAT are removed, and following the deduction of any foregone earnings during study) relative to an individual in possession of the counterfactual qualification;
The gross benefit to the public purse is defined as the present value of enhanced taxation (i.e. income tax, National Insurance and VAT, following the deduction of the costs of any foregone tax revenues during study) relative to an individual in possession of the counterfactual qualification;
The net learner benefit is defined as the gross learner benefit minus the present value of the direct costs associated with qualification attainment; and
Similarly, the net benefit to the public purse is defined as the gross public purse benefit minus the direct Exchequer costs of provision during the period of attainment.
The analysis examines the benefits of the above described single cohort of students (i.e. the cohort of 2023-24 starters) across their lifetimes in present value terms (i.e. in today’s money). A detailed description of our methodology is presented in Annex A2.219 .
19 The estimation of the gross and net learner benefit and gross and net Exchequer benefit is based on a detailed econometric an alysis of the Labour Force Survey, in terms of the impact of further education qualification and apprenticeship attainment on earnings and employment outcomes. However, as no information is specifically available on the particular institution attended, the analysis is not specific to United Colleges Group’s students. Rather, the analysis is adjusted to reflect the characteristics of the 202 3 24 cohort of UCG students to the greatest extent possible (e.g. in terms of mode of study, level of study, subject mix, gender, average age at enrolment, or duration of qualification).
Figure 8 Overview of the gross and net learner benefit, and gross and net Exchequer benefit, for further education qualifications
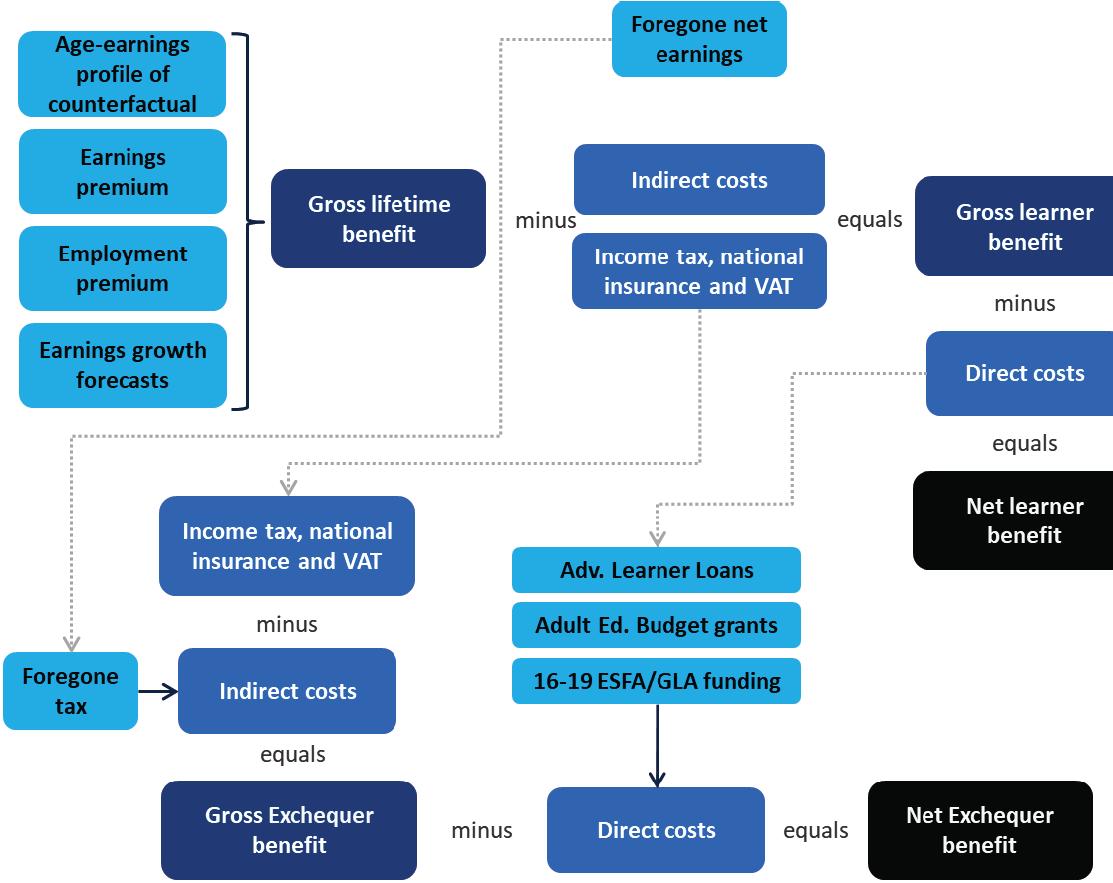

Source: London Economics’ analysis
Figure 9 Overview of the gross and net learner benefit, and gross and net Exchequer benefit, for apprenticeships
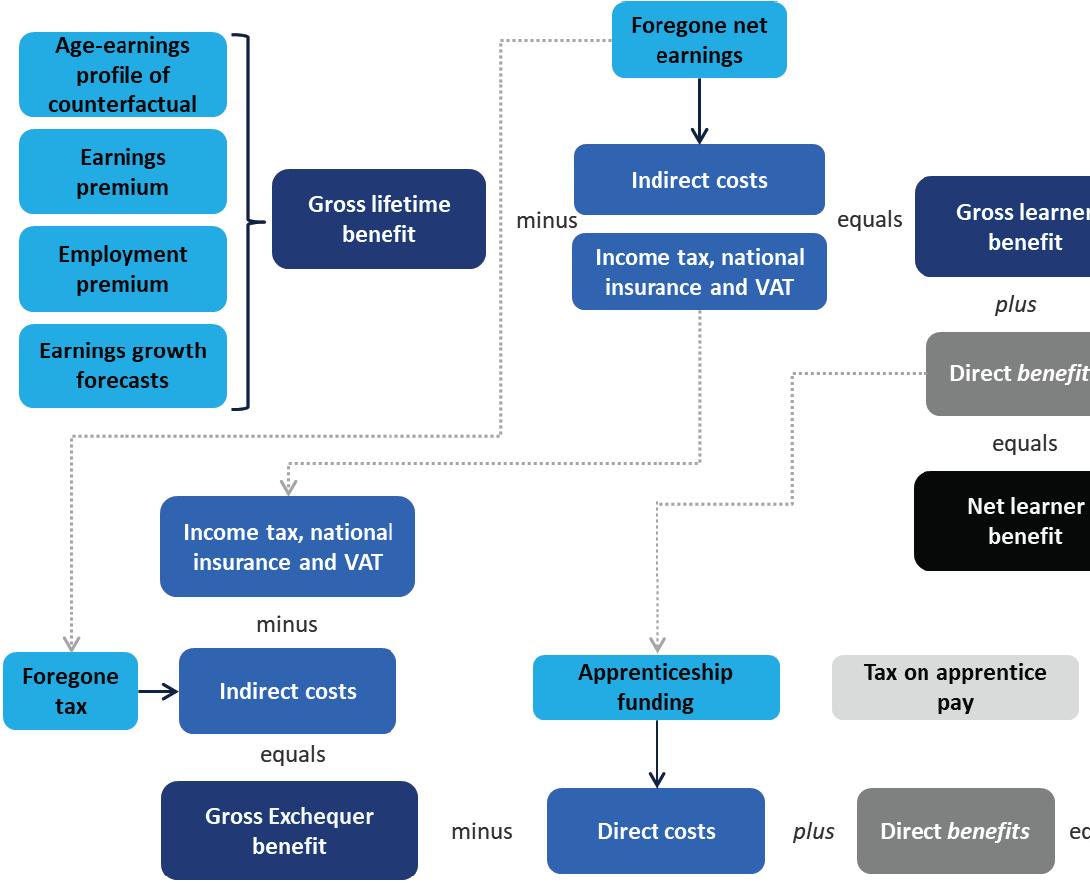
Source: London Economics’ analysis
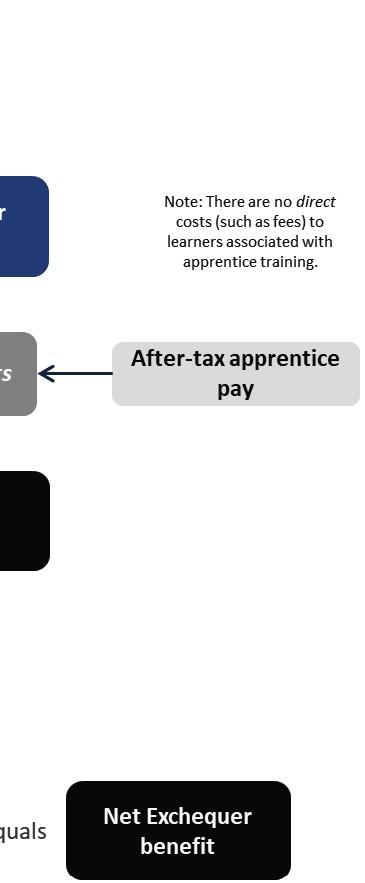
Table 3 presents the estimated net learner benefits and net Exchequer benefits achieved by students starting FE qualifications at United Colleges Group in the 2023-24 academic year (by study mode, on average across men and women20).
Table 3 Net learner benefit and net Exchequer benefit per student in the 2023-24 United Colleges Group cohort, by study level and mode Level
Entry Level vocational (vs. no qualifications)
Level 1 vocational (vs. no qualifications)
Level 2 vocational (vs. Level 1 vocational)
Level 3 vocational (vs. Level 2 vocational)
Note: All estimates constitute weighted averages across men and women (weighted by the estimated number of student completers in the 2023-24 cohort) and are presented in 2023-24 prices, discounted to reflect net present values, and rounded to the nearest £1,000. We assume that the gross learner benefit and Exchequer benefit associated with qualification attainment can never be negative – i.e. students will never incur a wage/employment penalty from achieving additional qualifications. In instances where this would be the case, we instead assume a £0 gross learner benefit and Exchequer benefit (while the costs of qualification attainment would still be incurred).
Estimates for students undertaking Level 4 or 5 vocational qualifications, or apprenticeships (at any level), are not presented here, as there were only few students in the 2023-24 UCG cohort undertaking these qualifications.
Source: London Economics’ analysis
The analysis indicates that there are substantial average net learner benefits and net Exchequer benefits associated with FE qualifications offered by United Colleges Group21 , particularly at RQF Levels 2 and 3. Specifically, for full-time students:
The average net learner benefit achieved by a representative22 student in the 2023-24 cohort completing a full-time Level 3 vocational qualification at United Colleges Group (with a Level 2 vocational qualification as their highest prior attainment) was estimated at £62,000, with an associated net Exchequer benefit of £40,000
The corresponding net learner benefit per student completing a full-time Level 2 vocational qualification at the College (relative to a Level 1 vocational qualification) was even higher, estimated at approximately £68,000, with a net Exchequer benefit of £27,000.
There are also relatively large net learner and net Exchequer benefits associated with fulltime Level 1 vocational qualifications (relative to holding no formal qualifications), where the average net learner benefit per student was estimated at £28,000, with a corresponding net Exchequer benefit of £5,000
20 For a breakdown of the results by gender, see the more detailed results presented in Annex A2.2.9. Note that the results for apprenticeships, and for FE Learners at Level 4 and 5, were not presented here, due to the relatively small number of students undertaking these qualifications in the 2023-24 United Colleges Group cohort.
21 Again, these estimates rely on a detailed econometric analysis of the Labour Force Survey of the impact of FE qualification and apprenticeship attainment on earnings and employment outcomes. However, importantly, as no information is available in the Labour Force Survey on the particular institution attended, the analysis is not specific to United Colleges Group’s students. Rather, the analysis is adjusted to reflect the characteristics of the 2023-24 cohort of UCG students to the greatest extent possible (e.g. in terms of mode of study, level of study, subject mix, gender, average age at enrolment, or duration of qualification).
22 Again, note that all students in the 2023-24 UCG cohort were English domiciled (see Section 2.1). The analysis is based on an average age at completion of 18 for students undertaking full-time Level 3 vocational qualifications at United Colleges Group in the 2023-24 cohort (also see Annex A2.2.5 for further information).
In contrast, there are relatively low/small negative estimated net benefits associated with full-time vocational qualifications at Entry Level (relative to holding no formal qualifications). These results are predominantly driven by the low average marginal earnings and employment returns associated with these qualifications23 (particularly for men). These reflect the general nature, and typically shorter duration and smaller size, of these qualifications (e.g. in terms of ESOL courses).
Although generally lower than the corresponding returns for full-time students, there are also considerable net learner benefits achieved by students completing part-time FE qualifications at Unites Colleges Group. For instance, for a representative part-time student in the 2023-24 cohort completing a Level 3 vocational qualification, the estimated net learner benefit and net Exchequer benefit stand at £52,000 and £36,000, respectively. The corresponding net learner benefit and net Exchequer benefit associated with part-time Level 2 vocational qualifications were estimated at £27,000 and £11,000, respectively. On the one hand, we assume that part-time students (which include predominantly adult learners) combine work with their studies at United Colleges Group, and thus do not incur any opportunity costs in the form of foregone earnings during their studies. On the other hand, these lower costs of qualification attainment are outweighed by the fact that part-time students tend to complete their studies much later in life24 (and, therefore, spend fewer years in the labour market post-completion), resulting in a relative reduction in the net learner benefits for parttime students compared to full-time students.
Combining the information on the number of learners in the 2023-24 United Colleges Group cohort (see Section 2.1), expected completion rates, and the net learner and net public purse benefits associated with the different qualification levels (relative to students’ specific (assumed) prior attainment), the aggregate economic benefit of UCG’s teaching and learning activities associated with the 2023-24 cohort was estimated at approximately £351 million (see Table 4).

The economic impact of teaching and learning generated by the 2023-24 cohort of UCG students stood
at £351 million.

In terms of the breakdown by beneficiary, £244 million (69%) of this total impact is accrued by students, and the remaining £108 million (31%) is accrued by the Exchequer. In terms of the breakdown by study level/type, reflecting the small number of apprentice learners in the cohort, the vast majority (92%, £325 million) of the estimated economic impact is generated by students undertaking FE qualifications at the College, with the remaining 8% (£27 million) generated by its apprentice learners.
It is important to note the following caveats:
As outlined in Section 2.1, due to the absence of consistent and complete information on students’ highest level of prior attainment, we assumed that all students starting FE qualifications or apprenticeships at United Colleges Group in 2023-24 were in possession
23 As outlined in further detail in Annex A2.2.4, for vocational qualifications at Entry Level (and Level 1), the underlying marginal earnings and employment returns were not adjusted for the specific subject mix of students studying at UCG (as the corresponding subject information is not available for these qualifications within the Labour Force Survey data). In other words, these labour mark et returns constitute ‘generic’ returns to Entry Level and Level 1 vocational qualifications across the UK, rather than being adjusted for the specific courses (in terms of subjects) offered by United Colleges Group
24 See Annex A2.2.5 for more information on the average age at enrolment.
of the next highest (lower) level of qualification25 . Given this assumption, the results here potentially underestimate the ‘true’ economic impact associated with the College’s teaching and learning activities, as it is expected that a number of students in the cohort were in possession of lower levels of prior attainment than those assumed here.
The analysis does not account for the fact that many students starting FE qualifications or apprenticeships at UCG in 2023-24 subsequently obtain additional qualifications (i.e. instances where students use their qualifications as ‘stepping stones’ towards subsequent further educational attainment). As discussed in more detail in Section 5, a large proportion of learners who study at United Colleges Group subsequently go on to undertake further study, and we do not account for the associated additional labour market benefits (and Exchequer tax receipts) that are likely to be achieved as a result. Again, this implies that the analysis likely underestimates the true economic impact associated with the College’s teaching and learning activities.
Table 4 Aggregate impact of United Colleges Group’s teaching and learning activities associated with the 2023-24 cohort (£m), by beneficiary, mode, and level of study
Note: All estimates are presented in 2023-24 prices, discounted to reflect net present values, rounded to the nearest £1m, and may not add up precisely to the totals indicated. For simplicity, in the table, the estimates for apprenticeship learners are included within the results for full-time students. Source: London Economics’ analysis
25 Based on the assumed counterfactual groups presented in Annex A2.2.3
On top of the above discussed impact of the College’s teaching and learning activities, in this section, we assess the direct, indirect, and induced impacts associated with the operational and capital expenditures of United Colleges Group. Analyses of these impacts consider education providers as economic units creating output within their local economies by purchasing products and services from their suppliers and hiring employees. The direct, indirect, and induced economic impacts of the College’s expenditures are defined as follows:
Direct effect: This considers the economic output generated directly by United Colleges Group itself, by purchasing goods and services (including labour) from the economy in which it operates.
Indirect effect (‘supply chain impacts’): The College’s purchases generate income for its supplying industries, who in turn spend this revenue to purchase inputs to meet UCG’s demand. This results in a chain reaction of subsequent rounds of spending across industries, often referred to as a ‘ripple effect’.
Induced effect (‘wage spending impacts’): The employees of United Colleges Group and of businesses operating in the College’s supply chain use their wages to buy consumer goods and services within the economy. This in turn generates wage income for employees within the industries producing these goods and services, again leading to subsequent rounds of spending, i.e. a further ‘ripple effect’ throughout the economy as a whole.
The total of the direct, indirect, and induced effects constitutes the gross economic impact of UCG’s operating and capital expenditures. An analysis of the net economic impact ideally needs to account for two additional factors potentially reducing the size of any of the above effects:
Leakage into other geographical areas, by taking account of how much of the additional economic activity actually occurs in the area of consideration (i.e. the UK); and
Displacement of economic activity within the region of analysis, i.e. taking account of the possibility that the economic activity generated might result in the reduction of activity elsewhere within the region26 .
The direct, indirect, and induced impacts are measured in terms of monetary economic output 27 , gross value added (GVA)28 , and full-time equivalent (FTE) employment supported29 , and are estimated using economic multipliers derived from an Input-output model30 . In addition to measuring these impacts on the UK economy as a whole, the analysis is broken down by geographic region31 and sector. In line with the impact of the College’s teaching and learning activities (discussed in Section 2), the analysis focuses on the 2023-24 academic year.
26 It is important to note that, while the analysis (wherever possible) takes account of leakage (e.g. adjusting for the extent to which any additional income for supplying industries might be spent on imports of goods and services from outside the UK), the estimated impacts here are not adjusted for displacement or additionality. Hence, our analysis effectively estimates the direct, indirect, and induced impacts associated with the College’s expenditures in gross terms.
27 In this analysis, economic output is equivalent to income/expenditure.
28 Gross value added is used in national accounting to measure the economic contribution of different industries or sectors, and is defined as economic output minus intermediate consumption (i.e. minus the cost of goods and services used in the production process).
29 FTE jobs represent the total number of full-time jobs supported, accounting for part-time positions on an equivalent full-time basis.
30 This is described in further detail in Section Error! Reference source not found. below.
31 Specifically, the underlying analysis is broken down into the UK’s 1 International Territorial Level 2 (ITL2) areas, based on 2021 ITL boundaries (for more information, see Office for National Statistics (2024)). The ITL classification was revised in 2025, but the 2021 boundaries are used as the underlying data required for the Input-Output analysis is based on the 2021 boundaries.
To measure the direct economic impact of UCG’s purchases of goods, services, and labour, we used information on the College’s operating expenditures (including staff and non-staff spending), capital expenditures, as well as the number of staff employed (in terms of full-time equivalent employees), for the 2023-24 academic year. 32
Based on this approach, in terms of monetary economic output (measured in terms of expenditure), the direct economic impact associated with the College’s expenditures stood at £59 million in 202324 (see Figure 10). This includes £33 million of operating expenditure on staff-related costs, £18 million of other (non-staff) operating expenses 33 , as well as £8 million of capital expenditure incurred in that academic year. In terms of employment, the College directly employed approximately 690 FTE staff in 2023-24, while the College’s direct impact in G A terms stood at £39 million34
Figure 10 Direct economic impact (in terms of output) of United Colleges Group’s expenditure in 2023-24, by type of expenditure
Note: rom the College’s total operating expenditure (of £57 million), we exclude £6 million of non-staff costs associated with depreciation, as it is assumed that these costs are not relevant from a procurement perspective (i.e. these costs are not accounted for as income by other organisations). All estimates are presented in 2023-24 prices and rounded to the nearest £1m.
Source: London Economics analysis based on United Colleges Group (2024) and capital expenditure data provided by UCG.
In addition to these total expenditures, we investigated the geographical breakdown of United Colleges Group’s procurement and staff (salary) expenditures, to demonstrate the College’s impact across London and the rest of the UK. Figure 11 presents the distribution of the College’s procurement expenditure (based on invoice data for 2023-24) by Local Authority. The map illustrates the economic significance of the College to London, with 53% (approximately £12.8 million) of its procurement expenditure taking place in London, including 9% in Camden, 8% in Tower Hamlets, 7% in Westminster, and 6% in Brent.35
32 Based on staff data and financial data included in United Colleges Group’s financial statements (see United Colleges Group (2024)), and separate capital expenditure data provided by United Colleges Group.
33 The total operational expenditure (excluding capital expenditure) of United Colleges Group in 2023-24 stood at £57 million. From this, for the purpose of the analysis, we excluded £6 million in depreciation costs (from non-staff expenditure), as it is assumed that these costs are not relevant from a procurement perspective (i.e. these costs are not accounted for as income by other organisations). This results in relevant operating expenditure of approximately £51 million in 2023-24. Adding in capital expenditure of £8 million, we thus reach the total value of £59 million included in Figure 10.
34 Direct G A is calculated as the sum of the College’s surplus on operations, staff costs, and interest and other finance costs. This is equivalent to income minus non-staff operating expenses (excluding interest and other finance costs).
35 Note that it is possible that the data somewhat overestimates the level of procurement expenditure occurring in London as compared to other regions, since the invoice data would often reflect suppliers’ head office locations, rather than reflecting the location where these activities took place.
Figure 12 Distribution of United Colleges Groups staff expenditure in 2023-24, by Local Authority (of staff home address)
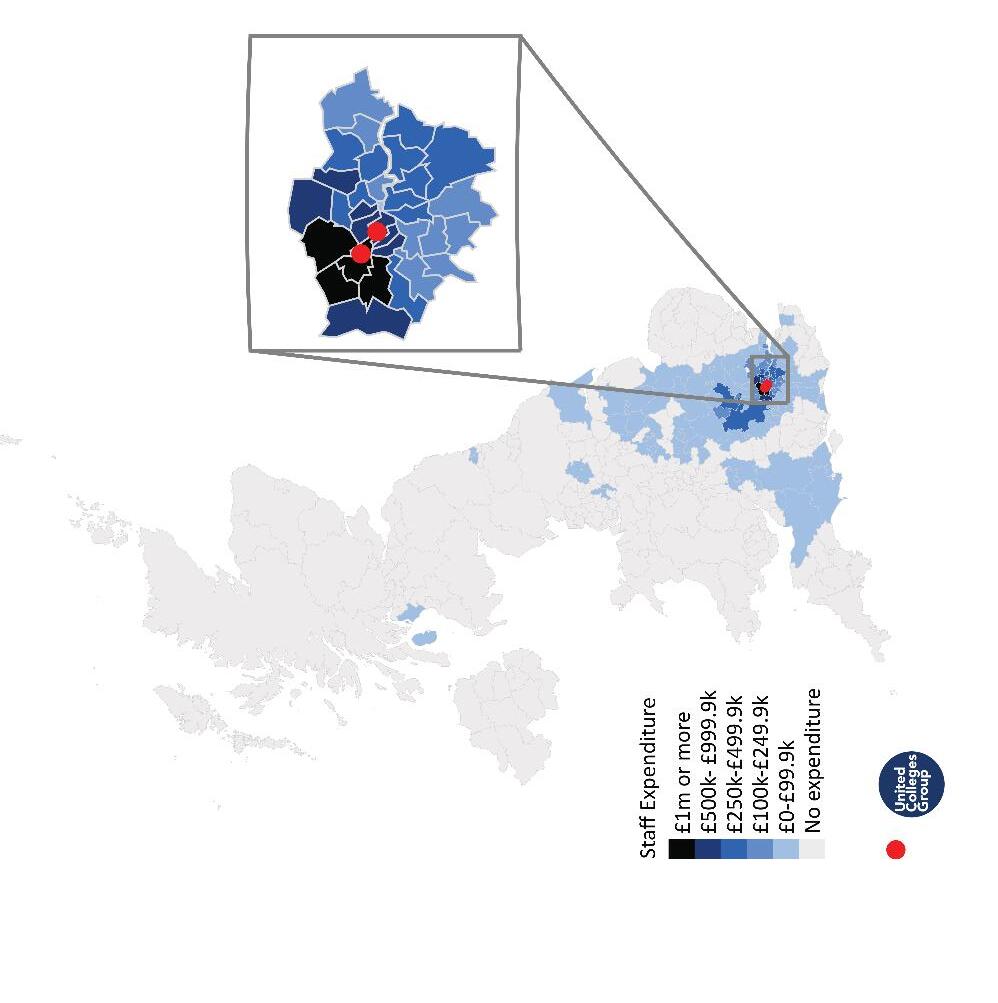
Note: We received data on the postcode for a total of £26m from United Colleges Group. Of that, £3.6m with missing postcodes could not be mapped. The figure is thus based on £23m of spending associated with 1,014 staff at United Colleges Group.
Source: London Economics' analysis based on data from United Colleges Group, and the Off ice for National Statistics. Contains National Statistics, OS, Royal Mail, Gridlink, ONS, NISRA, NRS and Ordnance Survey data ©Crown copyright and database right 2025.
Figure 11 Distribution of United Colleges Group’s procurement expenditure in 2023-24, by Local Authority (of invoice address)
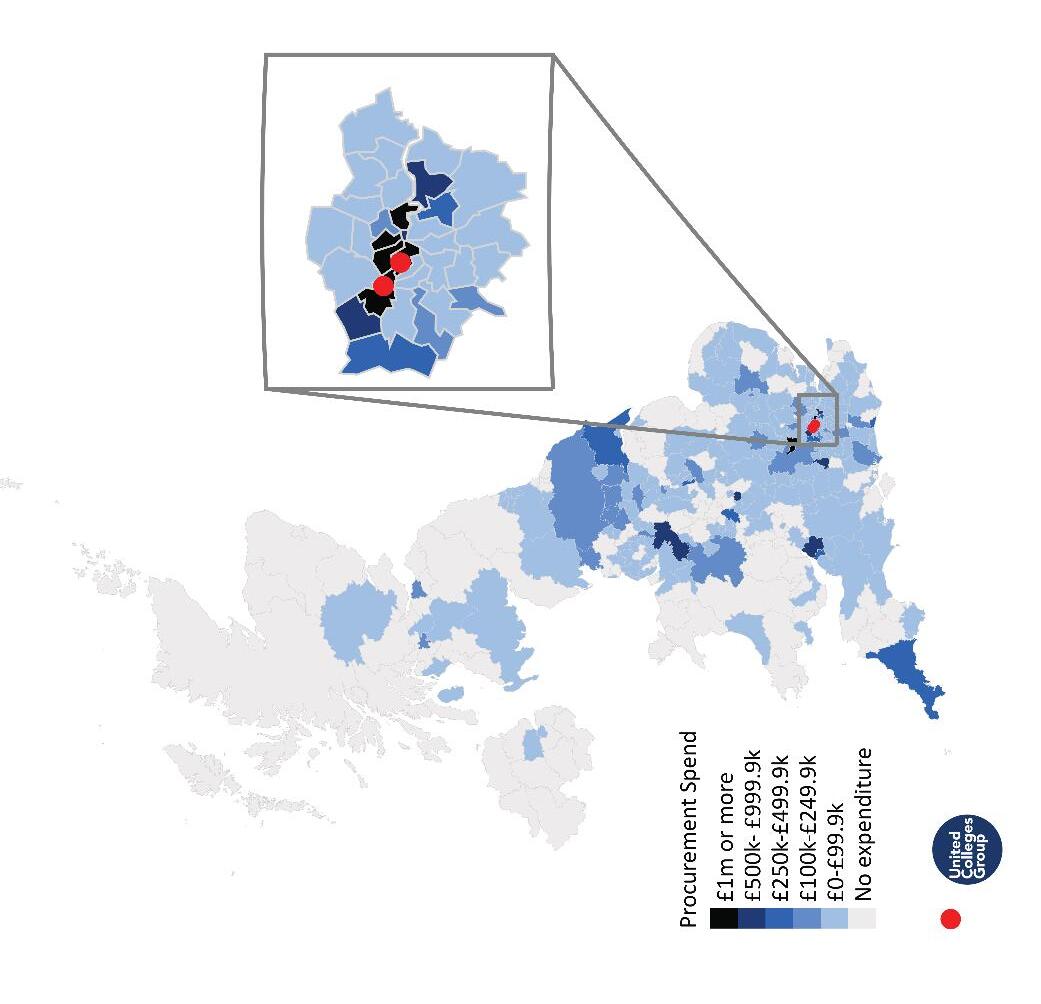
Note: We received data on the postcode for a total of £25m from United Colleges Group. Of that, £0.1m with missing or non-UK postcodes, and a further £0.6m with invalid postcodes could not be mapped. The figure is thus based on £24m of expenditure on 855 suppliers for UCG.
Source: London Economics' analysis based on data from United Colleges Group, and the Off ice for National Statistics. Contains National Statistics, OS, Royal Mail, Gridlink, ONS, NISRA, NRS and Ordnance Survey data ©Crown copyright and database right 2025.
-
In addition, Figure 12 presents the distribution of the College’s staff (salary) spending by Local Authority (again in 20232 , based on the postcode of employees’ home addresses). As expected, compared to UCG’s procurement expenditure, its staff expenditure is even more concentrated in and around London, again highlighting the College’s role as a key anchor institution in its local area. Approximately 80% (£18.1 million) of the College’s staff expenditure is related to staff living in London. This includes 12% (£2.8 million) for staff living in Brent, 6% (£1.3 million) in Ealing and Barnet, respectively, 5% (£1.1 million) in Harrow, and 4% (£1 million) for staff in Camden and Hillingdon, respectively.
The indirect and induced impacts associated with the expenditures of United Colleges Group were estimated using economic multipliers derived from Input-output tables36 , which measure the total production of each industry in the UK economy, and the interindustry (and intraindustry) flow of goods and services consumed and produced by each sector. In other words, these tables capture the degree to which different sectors within the UK economy are connected, i.e. the extent to which changes in the demand for the output of any one sector impact all other sectors of the economy. To be able to achieve a breakdown of the analysis by region, we developed a multi-regional Input-output model, combining UK level Input-output tables (published by the Office for National Statistics37) with a range of regional level data to achieve a granular breakdown by sector and region.38
To estimate the total direct, indirect, and induced impact associated with the College’s expenditures, we apply the relevant average economic multipliers39 associated with organisations in London’s government, health, and education sector. 40 More specifically, the multipliers here are based on a weighted average 41 of the multipliers for organisations located in ‘Inner London – West’ (where the City of Westminster College is located) and ‘Outer London - West and North West’ (where the College of North West London is located).42 These multipliers (for the impact on London and the UK economy as a whole) are presented in Table 5.
Based on these estimates, in terms of economic output, we assume that every £1 million of operating or capital expenditure incurred by United Colleges Group generates a total of £2.01 million of impact throughout the UK economy (on average), of which £1.69 million is accrued in London. Within London, this includes £0.93 million in Inner West London, £0.57 million in Outer West and North West London, and £0.19 million in other parts of the capital. In terms of employment, we assume that for every 1,000 FTE staff employed directly by United Colleges Group, a total of 1,670 staff are supported throughout the UK, of which 1,440 are supported in London (including 790 in Inner West London, 510 in Outer West and North West London, and 140 in other parts of London).
36 Input-Output tables quantify the interdependencies between different sectors and regions of an economy by detailing the origin and destination of resource flows between each sector and region.
37 See Office for National Statistics (2023d).
38 See Annex A2.1 for more details on the Input-Output analysis.
39 Specifically, the analysis makes use of Type II multipliers, defined as [Direct + indirect + induced impact]/[Direct impact].
40 i.e. we assume that the expenditure patterns of United Colleges Group are the same as for other institutions operating in London’s government, health, and education sector.
41 Weighted by the number of total learners enrolled at City of Westminster College (58%) vs. the College of North West London (42%) in 2023-24, respectively.
42 ‘Inner London – est’ includes the boroughs of Camden, Kensington & Chelsea, Hammersmith & Fulham, Wandsworth, Westminster, and the City of London. ‘ Outer London – West and North West’ includes the boroughs of Barnet, Brent, Ealing, Harrow, Hillingdon, Hounslow, and Richmond upon Thames. See Office for National Statistics (2024).
Table 5 Economic multipliers associated with United Colleges Group's expenditures
Note: All multipliers constitute Type II multipliers, defined as [Direct + indirect + induced impact]/[Direct impact].
Source: London Economics' analysis
Figure 13 and Figure 14 present the estimated total direct, indirect, and induced impacts associated with the expenditures incurred by United Colleges Group in the 2023-24 academic year (by region and sector of impact, respectively). This impact was estimated at approximately £118 million in economic output terms:

The impact of United Colleges Group’s expenditures in 2023-24 stood at £118 million.

In terms of type of impact, this includes £59 million (50%) of direct impact and £60 million (50%) of indirect and induced impacts.
In terms of region, the majority of this impact (£100 million, 84%) was generated in London, with the remaining £19 million (16%) occurring in other regions across the UK. Within London itself, £54 million (46% of the total expenditure impact) occurred in Inner West London, whilst £34 million (28%) occurred in Outer West and North West London.
In terms of sector, in addition to the impacts occurring in the government, health, and education sector itself (£64 million, 54%), there are also large impacts felt within other sectors, including the distribution, transport, hotels & restaurant sector (£13 million, 11%), the production sector (£12 million, 10%) and the professional and support activities sector (£9 million, 7%).43
In terms of employment, the College’s spending supported an estimated total of 1,145 FTE jobs across the UK in the 2023-24 academic year (of which 995 were located in London, including 545 in Inner West London and 355 in Outer West and North West London). In addition, the impact in terms of GVA was estimated at £72 million across the UK economy as a whole (with £63 million accrued in London).
43 For more detail on which industries are included in this high-level sector classification, please refer to A2.1.2.
Figure 13 Total economic impact associated with UCG’s expenditures in 2023-24, by region
Economic output, £m
Note: Monetary estimates are presented in 2023-24 prices, rounded to the nearest £1 million, and may not add up precisely to the totals indicated. Employment estimates are rounded to the nearest 5 and again may not add up precisely to the totals indicated.
Source: London Economics’ analysis
Figure 14 Total economic impact associated with UCG’s expenditures in 2023-24, by sector
Economic output, £m
GVA, £m
Number of FTE employees
Note: Monetary estimates are presented in 2023-24 prices, rounded to the nearest £1 million, and may not add up precisely to the totals indicated. Employment estimates are rounded to the nearest 5 and again may not add up precisely to the totals indicated.
Source: London Economics’ analysis


The Pantry is a new community-run café and cookery school set up by London’s Community Kitchen, based in Wembley. Proceeds from the café go towards helping local communities fight food insecurity.

Learners at City of Westminster College and the College of North West London make up the kitchen and front of house staff, as part of an employment training pathway and accreditation. As well as providing teas, soft drinks, and barista-style coffee, the students also build on their hospitality skills by creatively transforming produce that would otherwise be thrown away into delicious sandwiches and lunch options for customers. This produce is donated each day from companies including Marks & Spencer and Union CoOp store.
"During my work experience at the café, I’ve learned important skills such as food preparation, teamwork, time management and keeping the kitchen clean and safe. The staff are supportive, and the skills I’m learning have made me more confident and prepared to work in kitchens, cafes, or any job where teamwork, organisation, and communication are important. The experience has helped me decide which jobs I enjoy, what I am good at, and what kind of work makes me feel happy.”
David, United Colleges Group student
London’s Community Kitchen is founded by former Cordon Bleu chef, Taz Khan MBE, and is a ‘zero waste, zero hunger’ charity. Each week, it supports 25,000 individuals, and intercepts around 75 metric tonnes of food from going to landfill, as well as delivering courses on healthy food and nutrition.
The Pantry will form part of the new canal-side community being delivered by St George, comprising 3,350 homes, of which 35% are affordable.

The College of North West London took part in a huge litter-picking and shoreline cleanup at Brent’s Welsh Harp Reservoir for the UK’s biggest sustainability competition, Planet Earth Games.

The Clean Water Project was supported by The Canal and Rivers Trust, and involved both 1618 and adult ESOL learners. The Welsh Harp reservoir cleanup helped to raise awareness of the urgent need to protect local ecosystems, but also empowered students to become active players in building a more sustainable future. By participating, students developed valuable employability and life skills, including leadership, communication, teamwork, digital literacy, and negotiation.


Combining the above strands of analysis, the total economic impact on the UK economy associated with United Colleges Group’s activities in the 2023-24 academic year was estimated at £470 million (see Table 6). Within this total:
The impact of the College’s teaching and learning activities stood at £351 million (75%), including £244 million accrued by students and £108 million accrued by the Exchequer; and

The total economic impact associated with UCG’s activities in 2023-24 stood at £470 million.

The impact generated by the College’s operating and capital expenditures stood at £118 million (25%), including £59 million of direct impact, and £60 million of indirect and induced impact. In terms of location of impact, £100 million of the impact of UCG’s spending was generated in London, with the remaining £19 million generated throughout the rest of the UK44 .
Note: All estimates are presented in 2023-24 prices, rounded to the nearest £1m, and may not add up precisely to the totals indicated.
Source: London Economics' analysis
Compared to the College’s total relevant operational costs of approximately £51 million in 20232445, the total impact of the College’s activities on the UK economy was estimated at £470 million, which corresponds to a benefit-to-cost ratio of approximately 9.3:1
To place these findings into a wider context, we provide two points of comparison.
Firstly, in its framework for economic evaluation guidance, TASO (which is funded by the Office for Students)46 indicates that a benefit-to-cost ratio greater than or equal to 4 would be considered to be delivering ‘very high’ value for money 47. As such, according to these wider benchmarks used by UK Central Government, the College’s activities generate very high levels of value for money.
44 Note that a similar breakdown by region for the impact of the College’s teaching and learning activities was not possible due to learners’ geographic mobility (as it is very difficult to determine the specific region that the College’s students end up in after they complete their qualifications with the College (over the entirety of their working lives)).
45 This is again based on the College’s operating expenditure in 2023-24 (£57 million), excluding £6 million in depreciation (and excluding any capital expenditure).
46 See Transforming Access and Student Outcomes in Higher Education (TASO, 2024 (Table 12)).
47 Based on value for money ( f ) categories used by the Department for Levelling Up, Housing and Communities’ appraisal guide (see Department for Levelling Up, Housing and Communities (2023), Section 3.32). As acknowledged by TASO, these categories should only be considered as example categories, since the range of benefit-to-cost ratios associated with each category can vary across different sectors.
Secondly, we consider the ‘value for money’ generated by the College compared to a number of other educational institutions where a comparable methodology has been applied. Table 7 presents the benefit-to-cost ratio for United Colleges Group compared to the corresponding ratios for a number of UK higher education institutions for which London Economics has previously conducted similar economic impact analyses48 . These ratios have been calculated by comparing each institution’s total relevant operational costs to the total impact of its activities on the UK economy 49 . As can be seen from this comparison, the benefit-to-cost ratio associated with United Colleges Group’s activities (of approximately 9.3:1) is considerably higher than for most of these comparator institutions. The large ratio for the College is particularly driven by the relatively high impact of its teaching and learning activities (relative to UCG’s operating costs).
Note: 1 The analyses for these institutions included depreciation costs (as well as movements in pension provisions) in their operational costs when calculating the benefit-to-cost ratio.
Source: London Economics’ analysis
Finally, to further contextualise the findings, given UCG’s reliance on public funding to deliver its activities, it is important to also consider the potential impact that might be achieved with alternative uses of public funding. To understand the relative economic contribution of United Colleges Group, we undertook an analysis of the costs and benefits associated with almost 600 UK government regulatory impact assessments, in order to compare the return on investment (measured using the benefit-to-cost ratio) associated with these alternative publicly funded government interventions with that of the College50
48 In addition, we have also included the corresponding benefit-to-cost ratio for Waltham Forest College, based on our recent analysis for the college (see London Economics, 2024). Unfortunately, given the general lack of comparable economic impact assessments for further education colleges, it was not possible to undertake a similar comparison with any other colleges.
49 Note that these ratios are not exactly comparable across different institutions, as the total impact of some institutions’ activities may include additional strands of impact or exclude certain strands of analysis that have been included here. Additionally, there have been improvements to our methodology over time.
50 Estimates of the total economic benefit and total economic costs were web-scraped from the individual regulatory impact assessments published by a number of UK government departments and public sector agencies (including the Cabinet Office; the Department for Business, Energy & Industrial Strategy; the Department for Business, Innovation and Skills; the Department for Digital, Culture, Media & Sport; the Department for Education; the Department for International Trade; the Department for Transport; the Department of Energy and Climate Change; the Department of Health & Social Care; the Education Funding Agency; the Highways Agency; HM Revenue and Customs; HM Treasury; the Ministry of Defense; and the Office of Communications). In total, 579 regulatory impact assessments published on the UK government’s website (here) between 2010 and 2022 were identified as being machine readable and containing non-missing best estimates for total costs and total benefits (thereby allowing for the calculation of a benefitto-cost ratio).
Table 8 presents summary results for the benefit-cost ratio and total benefit across these regulatory impact assessments. The median economic benefit across all these government programmes/ projects stands at £65 million, with a median benefit-to-cost ratio of 1.8. In comparison, United Colleges Group’s activities generate an estimated economic benefit of £470 million, with a benefitto-cost ratio of 9.3.
Table 8 Comparison with benefit-to-cost ratios for UK government interventions
Note: Based on a total of 579 UK government regulatory impact assessments published between 2010 and 2022.
Source: London Economics’ analysis of published UK government regulatory impact assessments ( here )
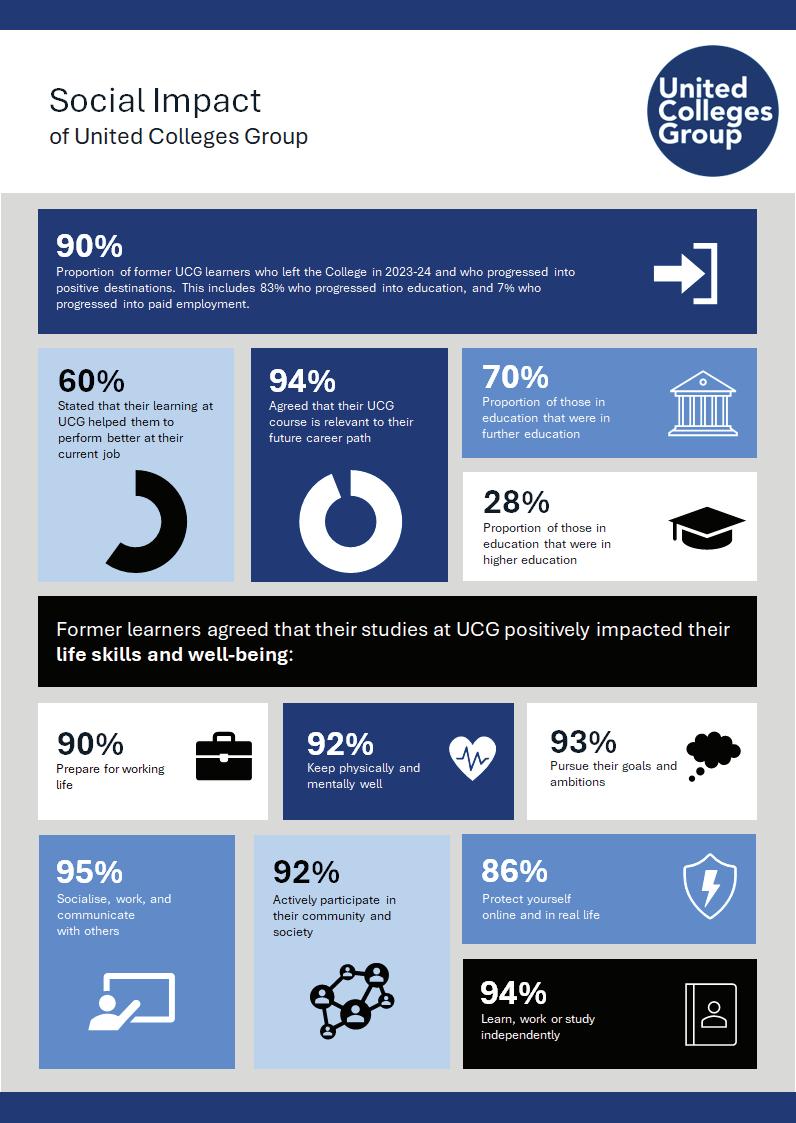
In addition to the above described economic impacts, there are numerous noneconomic or societal benefits associated with skills and qualification acquisition at United Colleges Group. For example, these include subsequent acquisition of further learning qualifications, the acquisition of knowledge relevant to both current and future endeavours, a smoother transition into adulthood by preparing individuals for working life, increased independence, and a higher ability to pursue personal goals and ambitions. By helping students develop social skills, encouraging community participation, and promoting both physical and mental wellbeing, in turn, this contributes to a healthier, more integrated society.
While equally important as the above economic effects, these impacts are generally more difficult to monetise in any robust way. As such, we do not attempt to monetise these wider impacts but instead demonstrate the impact of learning at UCG on former learners’ continued education, jobs, lives, and prospects. Specifically, to assess these wider impacts of the College on its students and society at large, we analysed the results of a survey of former learners who completed qualifications at UCG in the 2023-24 academic year, conducted by J2 Research in October 2024. The J2 Research report combines responses from 1,758 former learners (interviewed by telephone) with UCG’s internal progression data and UCA data for a further 1,708 and 440 students, respectively.
Here, we present key results from the J2 Research survey in relation to former learners’ destination after completion of their course, as well as the impact of their qualifications on their working lives, general and job-related skills, and personal development.
An overwhelming 83% of former learners had progressed into various forms of education by the time that the survey was undertaken (see Figure 15). Most of this group continued into full-time further education, with 20% progressing into higher education instead (see Figure 16). A relatively small number opted for part-time further education (2%) or traineeships, apprenticeships, or support internships (1%)
Meanwhile, 7% of students entered the workforce, either as paid employees or through self-employment. The remaining 10% were mostly not in paid employment and either looking or not looking for work (classified as not in employment or education).
Note: Based on 3,268 former learners (excluding 638 from the total sample due to the inability to contact the learner or unknown destination).
Source: London Economics analysis of J2 Research Destinations and Impact Report (2024) provided by United Colleges Group
Figure 16 Breakdown of education destinations after completing courses at United Colleges Group
Further Education (Full Time)
Higher Education
Traineeship, apprenticeship or supported internship
Further Education (Part Time)
Note: Based on 2,712 former learners currently undertaking education.
Source: London Economics analysis of J2 Research Destinations and Impact Report (2024) provided by United Colleges Group
The results presented in this section are based only on the sample of former learners that were interviewed by J2 Research by telephone, rather than the more comprehensive progression data outlined in Section 5.1.
The majority of former students that indicated that they were employed at the time that the survey was undertaken reported that their learning at UCG had positively impacted their working lives, with 60% stating that it helped them perform better in their current job. In addition, 29% agreed that their learning at UCG helped them to secure a pay rise and/or a promotion (though note that this relatively small proportion is likely driven by the fact that the survey was undertaken relatively soon after respondents’ completion of their learning with UCG).
Figure 17 Proportion of students who believe their learning helped them perform better at their current job
Figure 18 Proportion of students who believe their learning helped them get a pay rise and/or promotion
Note: Based on 199 responses of currently employed students to the question ‘Has your time learning helped you perform your current job better?’. Source: London Economics analysis of J2 Research Destinations and Impact Report (2024) provided by United Colleges Group
Note: Based on 194 responses of currently employed students to the question ‘Has your time learning helped you get a pay raise and/or promotion?’. Source: London Economics analysis of J2 Research Destinations and Impact Report (2024) provided by United Colleges Group
Former learners also believe that their time at UCG had a positive impact on their knowledge (see Figure 19). A total of 79% agreed (either ‘strongly’, ‘mostly’, or ‘partially’) that the course they studied is relevant to their current lives (i.e. what they are doing now), with 66% agreeing either ‘strongly’ or ‘mostly’. The perceived benefits are even more pronounced in relation to their future professional lives: 94% of respondents reported that the course was relevant to their future career path, including 81% agreeing either ‘strongly’ or ‘mostly’.
Figure 19 Perceived relevance of UCG courses to former learners’ knowledge
The course you studied is relevant to…
…what you're doing now
…your future career path
Strongly agree Mostly agree Partially agree Disagree
Note: Based on responses to the question ‘Is the course you studied relevant to your future career path?’ and 66 responses to the question ‘Is the course you studied relevant to what you’re doing now?’.
Source: London Economics analysis of J2 Research Destinations and Impact Report (2024) provided by United Colleges Group
In addition to benefits to their careers and knowledge, the majority of former UCG students also reported improvements in a wide array of life skills and behaviours (see Figure 20). Most respondents agreed that their time learning at UCG helped them prepare for working life (90%), become more independent (i.e. learning, working, or studying independently and making independent decisions; 94%), and pursue their goals and ambitions (93%). Respondents also ‘strongly’, ‘mostly’ or ‘partially’ agreed with various wellbeing related impacts. For example, the majority of respondents agreed that their time at UCG helped them to actively participate in their community and in society (92%), keep themselves mentally and physically well (92%), protect themselves online and offline (86%), and socialise, work, and communicate effectively with others (95%).
Socialise, work and communicate with others
Learn, work or study independently and make independent decisions
Pursue your goals and ambitions
Protect yourself online and in real life
Keep yourself physically and mentally well
Actively participate in your community and in society
Prepare for working life
Strongly agree Mostly agree Partially agree Disagree
Note: Based on responses to the question ‘ ow much do you agree that the course and your time at the group helped you to…?’. The number of responses for each aspect was as follows: ‘ prepare for working life’ (948), ‘Learn, work or study…’ (939), ‘Actively participate…’ (936), Keep yourself…’ (936), ‘Protect yourself…’ (930), Socialise, work…’ (937), and ‘Pursue your…’ (936).
Source: London Economics analysis of J2 Research Destinations and Impact Report (2024) provided by United Colleges Group


The first group of NHS staff members graduated from the Level 2 Higher Development Award programme at City of Westminster College in the 20232024 academic year.
The Level 2 Higher Development Award is designed in partnership with the Allied Health Professional Faculty for North Central London Integrated Care System (ICS) to empower NHS staff who are new to leadership roles. The course provides tools to manage a team, minimise conflict, encourage productivity, and support customers all of which are crucial skills required in managerial positions.
The NHS leadership team presented learners with their certificates in an awards ceremony at Paddington Campus. Now equipped with the award, graduates can approach leadership with greater confidence within a variety of NHS departments, including physiotherapy and business administration, across NHS ICS sites, including University College London Hospital and North Middlesex University Hospital.

“Learner feedback has been extremely constructive and positive. One of our learners even credited the course with helping them secure a new role. The added value course, Level 2 Mental Health, also went down well, enabling participants to discuss ideas on this timely subject area in a safe space.
Conversations are underway to develop a Level 3 team leadership qualification in the new year that is tailored to the needs of NHS staff. UCG is committed to working closely with the Allied Health Professional Faculty for North Central London ICS to design programmes that are both practical and impactful, ensuring learners continue to benefit from targeted professional development opportunities to help them excel in their career.”
Paula Cochrane, Curriculum Manager Security/Retail Employability Skills at UCG


Table
Table
Table
Table
Callender, C., Wilkinson, D., Gibson, A., and Perkins, C. (2011). ‘The impact of higher education for part-time students’.
http://webarchive.nationalarchives.gov.uk/20140108090250/http://www.ukces.org.uk/assets/ukces/docs/publications/ evidence-report-36-impact-of-he-for-pt-students.pdf
Department for Education (2024a). ‘Further Education and skills: Academic year 2023/24’.
https://explore-education-statistics.service.gov.uk/find-statistics/further-education-and-skills Department for Education (2024b). ‘Student loan forecasts for England: Financial year 2023-24’.
https://explore-education-statistics.service.gov.uk/find-statistics/student-loan-forecasts-for-england/2023-24 Department for Education (2024c). ‘Apprenticeship evaluation 2023: Learner, non-completer and employer surveys’. https://www.gov.uk/government/publications/apprenticeship-evaluation-2023-learner-non-completer-and-employersurveys
Department for Education (2025). ‘Further education and skills, academic year 2024/25’.
https://explore-education-statistics.service.gov.uk/find-statistics/further-education-and-skills/2024-25 Department for Levelling Up, Housing and Communities (2023). ‘DLUHC appraisal guide’.
https://www.gov.uk/government/publications/dluhc-appraisal-guide
Flegg, A. T., Lamonica, G. R., Chelli, F. M., Recchioni, M. C., & Tohmo, T. (2021). ‘A new approach to modelling the inputoutput structure of regional economies using non-survey methods’.
https://doi.org/10.1186/s40008-021-00242-8
Flegg, A. T., & Tohmo, T. (2014). ‘Estimating Regional Input Coefficients and Multipliers: The Use of FLQ is Not a Gamble’. https://doi.org/10.1080/00343404.2014.901499
GLA Economics (2019). ‘The London input-output tables’.
https://www.london.gov.uk/sites/default/files/london-input-output-tables-working-paper-97.pdf
Hermannsson, K. (2016). ‘Beyond Intermediates: The Role of Consumption and Commuting in the Construction of Local Input–Output Tables’.
https://doi.org/10.1080/17421772.2016.1177194
HM Treasury (2022). ‘The Green Book. Central Government Guidance on Appraisal and Evaluation’. https://assets.publishing.service.gov.uk/government/uploads/system/uploads/attachment_data/file/685903/The_ Green_Book.pdf
Jahn, M. (2016). ‘Extending the FLQ formula: A location quotient-based interregional input-output framework’. https://doi.org/10.1080/00343404.2016.1198471
Jahn, M., Flegg, A. T., & Tohmo, T. (2020). ‘Testing and implementing a new approach to estimating interregional output multipliers using input-output data for South Korean regions’.
https://doi.org/10.1080/17421772.2020.1720918
London Economics (2024). ‘The economic impact of Waltham Forest College’. https://www.waltham.ac.uk/news/2116-waltham-forest-college-s-economic-impact-celebrated-in-new-report Nomis (2014). ‘Location of usual residence and place of work by age’.
https://www.nomisweb.co.uk/census/2011/wu02uk
Nomis. (2023). ‘Business Register and Employment Survey’.
https://www.nomisweb.co.uk/datasets/newbres6pub
Office for Budget Responsibility (2024). ‘Economic and fiscal outlook – March 2024. Long-term economic determinants’.
https://obr.uk/efo/economic-and-fiscal-outlook-march-2024/
Office for Budget Responsibility (2025). ‘Economic and fiscal outlook – March 2025’.
https://obr.uk/efo/economic-and-fiscal-outlook-march-2025/
Office for National Statistics (2022a). ‘Earnings and hours worked, industry by two-digit SIC: ASHE Table 4’.
https://www.ons.gov.uk/employmentandlabourmarket/peopleinwork/earningsandworkinghours/datasets/ industry2digitsicashetable4
Office for National Statistics (2022b). ‘Estimates of the population for the UK, England, Wales, Scotland and Northern Ireland’.
https://www.ons.gov.uk/peoplepopulationandcommunity/populationandmigration/populationestimates/ datasets/populationestimatesforukenglandandwalesscotlandandnorthernireland
Office for National Statistics (2022c). ‘Impact of coronavirus (COVID-19) using Input-Output Supply and Use Tables, UK: 2019 to 2020’.
https://www.ons.gov.uk/economy/grossdomesticproductgdp/articles/ impactofcoronaviruscovid19usinginputoutputsupplyandusetablesuk/2019to2020
Office for National Statistics (2022d). ‘Regional gross disposable household income, UK: 1997 to 2020’.
https://www.ons.gov.uk/economy/regionalaccounts/grossdisposablehouseholdincome/bulletins/ regionalgrossdisposablehouseholdincomegdhi/1997to2020
Office for National Statistics (2022e). ‘UK SIC 2007’.
https://www.ons.gov.uk/methodology/classificationsandstandards/ ukstandardindustrialclassificationofeconomicactivities/uksic2007
Office for National Statistics (2023a). ‘Regional gross value added (balanced) per head and income components’.
https://www.ons.gov.uk/economy/grossvalueaddedgva/datasets/ nominalregionalgrossvalueaddedbalancedperheadandincomecomponents
Office for National Statistics (2023b). ‘Subnational trade in goods’.
https://www.ons.gov.uk/businessindustryandtrade/internationaltrade/datasets/subnationaltradeingoods Office for National Statistics (2023c). ‘Subnational trade in services’.
https://www.ons.gov.uk/businessindustryandtrade/internationaltrade/datasets/subnationaltradeinservices Office for National Statistics (2023d). ‘UK input-output analytical tables - industry by industry’.
https://www.ons.gov.uk/economy/nationalaccounts/supplyandusetables/datasets/ ukinputoutputanalyticaltablesindustrybyindustry Office for National Statistics (2024). ‘International geographies’.
https://www.ons.gov.uk/methodology/geography/ukgeographies/eurostat TASO (2024). ‘Framework for economic evaluation: Guidance’. https://taso.org.uk/libraryitem/economic-evaluation/ United Colleges Group (2024). ‘Financial Statements for the Year Ended 31 July 2024’.
https://cwcwebsite.blob.core.windows.net/sitefinityassets/docs/default-source/annual-accounts/20241209--ucg-financial-statements-2032-24-signed-(1).pdf?sfvrsn=ca55216d_2
Walker, I., & Zhu, Y. (2013), ‘The impact of university degrees on the lifecycle of earnings: Some further analysis’. Department for Business Innovation and Skills Research Report 112. https://www.gov.uk/government/uploads/system/uploads/attachment_data/file/229498/bis-13-899-theimpact-of-university-degrees-on-the-lifecycle-of-earnings-further-analysis.pdf
A2.1.1 Derivation of economic multipliers from multi-regional Input-output tables
This section provides further detail on the economic multipliers used in the analysis of the economic impact of UCG’s operating and capital expenditures (see section 3). The economic multipliers are calculated based on the UK’s 1 International Territorial Level 2 (ITL2) regions.51
The multi-regional Input- output analysis is undertaken by ‘regionalising’ UK Input-output tables for 2019 (see Office for National Statistics (2023d)).52 This technique relies on the assumption that there is ‘common technology’ (i.e. identical input structures) across all regions. In other words, for each unit of output produced by a sector, the analysis assumes that the same number of units of input from each supplying sector are required, regardless of the region that the producing sector is located in.53 however, a region’s producing sector may not be able to source all of its required inputs from its own region’s supplying sectors. The extent to which firms source production inputs from within their own regions is determined using Flegg Location Quotients,54 which are based on employment data by sector and ITL2 region (see Nomis, 2023). Trade between different regions is then determined using a gravity model,55 based on the distance between each of the ITL2 regions, whether regions border each other, and the size (measured in GVA) of the supplying and producing sectors (based on GVA data by sector and region (Office for National Statistics, 2023a)).
The multi-regional Input-output analysis also relies on a wide range of other data, including data on GVA components by sector and ITL2 region (Office for National Statistics, 2023a); employment by sector and ITL2 region (Nomis, 2023); gross disposable household income by ITL2 region (Office for National Statistics, 2022d); total household income by ITL2 region (Office for National Statistics, 2022d); total residents by Local Authority (converted to ITL2 regions) (Office for National Statistics, 2022b); mean weekly total paid hours worked by industry, for full-time vs. part-time employees (Office for National Statistics, 2022a); employed residents by Local Authority of usual residence and workplace (converted to ITL 2 regions) (Nomis, 2014); and UK imports into each ITL2 region and exports by each ITL2 region by sector, separately for goods and services (Office for National Statistics, 2023b and 2023c).
In terms of sector breakdown, the original UK-level Input-output tables are broken down into 105 relatively granular sectors. However, the wide range of regional-level data required to generate the multi-regional Input-output model is not available for such a granular sector breakdown. In-
51 For more information, see Office for National Statistics (2024). The classification is based on the ITL boundaries establishe d as of January 2021.
52 While more recent UK Input Output tables had been published (for 2020 and 2021) at the time that the analysis was undertaken , they are affected by the impact of the Covid 1 pandemic, so 201 tables are used instead to be more reflective of a ‘typical’ year (see ffice for National Statistics (2022c) and Office for National Statistics (2023d) for more details).
53 i.e. all firms within a given industry (irrespective of their region) use the same production techniques and have the same in put structures to produce their outputs. This assumption helps simplify the Input Output analysis, by treating each industry as if it were a single, homogeneous entity.
54 See Flegg & Tohmo (2014) and Flegg et al. (2021) for more detail on the implementation of Flegg Location Quotients. Similar l ocation quotient techniques have been used to generate other Input Output tables in the UK for different regions, such as for Lond on (see GLA Economics (2019)) and the Glasgow City Region (see Hermannsson (2016)).
55 Based on the specification and parameters given by Jahn (2016) and Jahn et al. (2020).
stead,the multi-regional Input-output model is broken down into 10 more high-level sector groups (see Table 9 in Annex A2.1.2).
While Input-output analyses are a useful tool to assess the total economic impacts generated by a wide range of activities, it is important to note several key limitations associated with this type of analysis. For example:
Input-output analyses assume that inputs are complements, and that there are constant returns to scale in the production function (i.e., that there are no economies of scale). The interpretation of these assumptions is that the prevailing breakdown of inputs from all sectors (employees, and imports) is a good approximation of the breakdown that would prevail if total demand (and therefore output) were marginally different.
Input-output analyses do not account for any price effects resulting from a change in demand for a given industry/output.
Input output models are ‘static’ in nature, in the sense that they assume fixed relationships between inputs and outputs, not accounting for changes in technology, prices, or production methods over time.
Given the complexity of the analysis and reliance on a wide range of industry level data, the sectors included within Input-output models are often highly aggregated, therefore masking likely differences between different industries.
Input-output models typically do not account for potential supply constraints, i.e. they assume that overall supply can meet any level of demand.
A2.1.2 Industry classifications for multi-regional Input-Output analysis
Table 9 provides an overview of the high-level industry classifications used throughout the multi-regional Input-output analysis.
Table 9 Industry grouping used as part of the multi-regional Input-Output analysis
Industries included in original UK Input-output table
Crop and animal production, hunting and related service activities
Forestry and logging
Fishing and aquaculture
Mining and quarrying
Manufacture of food products, beverages, and tobacco products
Manufacture of textiles, wearing apparel and leather products
Manufacture of wood and of products of wood and cork, except furniture; manufacture of articles of straw and plaiting materials
Manufacture of paper and paper products
Printing and reproduction of recorded media
Manufacture of coke and refined petroleum products
Manufacture of chemicals and chemical products
Manufacture of basic pharmaceutical products and pharmaceutical preparations
Manufacture of rubber and plastic products
Manufacture of other nonmetallic mineral products
Manufacture of basic metals
Manufacture of fabricated metal products, except machinery and equipment
Manufacture of computer, electronic and optical products
Manufacture of electrical equipment
Manufacture of machinery and equipment n.e.c.
Manufacture of motor vehicles, trailers and semitrailers
Manufacture of other transport equipment
High-level industry group [and UK SIC Codes]
Agriculture [13]
Production [539]
Industries included in original UK Input Output table
Industries included in original UK Input-output table
Manufacture of furniture; other manufacturing
Repair and installation of machinery and equipment
Electricity, gas, steam, and air conditioning supply
Water collection, treatment and supply
Sewerage; waste collection, treatment, and disposal activities; materials recovery; remediation activities and other waste management services
Construction
Wholesale and retail trade and repair of motor vehicles and motorcycles
Wholesale trade, except of motor vehicles and motorcycles
Retail trade, except of motor vehicles and motorcycles
Land transport and transport via pipelines
Water transport
Air transport
Warehousing and support activities for transportation
Postal and courier activities
Accommodation and food service activities
Publishing activities
Motion picture, video and television programme production, sound recording and mu-
sic publishing activities; programming and broadcasting activities
Telecommunications
Computer programming, consultancy and related activities; information service activities
Financial service activities, except insurance and pension funding
Insurance, reinsurance and pension funding, except compulsory social security
Activities auxiliary to financial services and insurance activities
Real estate activities excluding imputed rents
Imputed rents of owner-occupied dwellings
Legal and accounting activities; activities of head offices; management consultancy activities
Architectural and engineering activities; technical testing and analysis
Scientific research and development
Advertising and market research
Other professional, scientific, and technical activities; veterinary activities
Rental and leasing activities
Employment activities
Travel agency, tour operator reservation service and related activities
Security and investigation activities; services to buildings and landscape activities; office administrative, office support and other business support activities
Public administration and defence; compulsory social security
Education
Human health activities
Social work activities
Creative, arts and entertainment activities; libraries, archives, museums, and other cultural activities; gambling and betting activities
Sports activities and amusement and recreation activities
Activities of membership organisations
Repair of computers and personal and household goods
Other personal service activities
Activities of households as employers; undifferentiated goods- and services producing activities of households for own use
High level industry group [and UK SIC Codes]
High-level industry group [and UK SIC Codes]
Construction [4143]
Distribution, transport, hotels, and restaurants [4556]
Information and communication [5863]
Financial and insurance [6466]
Real estate [68.1268.3]
Professional and support activities [69.182]
Government, health & education [8488]
Other services [9097]
Note: ‘n.e.c.’ = not elsewhere classified
Source: London Economics’ analysis, based on Office for National Statistics (2023d) and UK SIC Codes (see Office for National Statistics, 2022e)
A2.2.1 Adjusting for completion rates
Section 2.1 above provides an overview of the number of UK domiciled students starting FE qualifications or apprenticeships at the College in 2023-24. However, to aggregate the individual level impacts of the College’s teaching and learning activity, it is necessary to adjust the number of student ‘starters’ to account for completion rates
For this purpose, for further education students, we made use of achievement rate information provided by UCG (which mirrors the published National Achievement Rate Tables for the College56). These achievement rates are based on the individual FE qualification aims that were completed in 2023-24, calculated as the number of aims achieved divided by the number started (excluding the aims of any learners that transferred onto another qualification within the same provider), broken down by level of study57 . For apprenticeships, in the absence of any comparable separate data, we applied the corresponding completion rates for FE students from the equivalent RQF Levels (i.e. we applied the achievement rates for RQF Level 2 FE students to Intermediate Apprenticeships, and for Level 3 FE students to Advanced Apprenticeships).
Table 10 presents the resulting completion rates for further education students and apprenticeship learners applied throughout the analysis. For example, we assume that, of those students starting a Level 2 vocational qualification (or an Intermediate Apprenticeship) at United Colleges Group in 202324, 83% complete the qualification/training as intended. The corresponding assumed completion rate for Level 3 vocational qualifications (and Advanced Apprenticeships) stands at approximately 75%.
Table 10 Assumed completion rates for UCG FE students and apprenticeship learners Level
Source: London Economics’ analysis based on achievement rates data provided by United Colleges Group
A2.2.2 Defining the gross learner and gross Exchequer benefit
As summarised in Section 2.2, to measure the economic benefits of FE qualifications and apprenticeships, we assess the labour market value associated with these qualifications, rather than simply assessing the labour market outcomes achieved by individuals in possession of these qualifications. The standard approach to estimating this labour market value is to undertake an econometric analysis where the ‘treatment’ group consists of those individuals in possession of the qualification of interest, and the ‘counterfactual’ group consists of individuals with comparable personal and socioeconomic characteristics but with the next highest (lower) level of qualification.
56 See Department for Education (2025).
57 The data included no information on achievement rates for (the very small number of) Level 4 or 5 FE students studying at UCG. In the absence of this information, we instead assumed the same achievement rate for these students as for Level 3 students at UCG.
The rationale for adopting this approach is that the comparison of the earnings and employment outcomes of the treatment group and the counterfactual group ‘strips away’ (to the greatest extent possible with the relevant data) those other personal and socioeconomic characteristics that might affect labour market earnings and employment (such as gender, age, or sector of employment), leaving just the labour market gains attributable to the qualification itself (see Figure 21 for an illustration of this). The treatment and counterfactual groups, and details of the econometric approach, are presented in Annex A2.2.3 and Annex A2.2.4, respectively.
Throughout the analysis, the assessment of earnings and employment outcomes associated with qualification attainment (at all levels) is undertaken separately by gender, reflecting the different labour market outcomes between men and women. Further, where possible, the analysis is adjusted for the specific subject composition of students studying at UCG58 , to reflect the fact that the qualifications offered by the College focus on specific subject areas, and that there is significant variation in post-graduation labour market outcomes by subject of study. In addition, given the fact that part-time students (i.e. predominantly adult learners) generally undertake and complete FE qualifications later in life than full-time students, the analysis for part-time students applies a ‘decay function’ to the returns associated with qualification attainment, to reflect the shorter period of time in the labour market (see Annex A2.2.5 for more information).
58 This adjustment for subject composition was only feasible for FE qualifications at Levels 2 to 5. For students studying towards vocational qualifications at Entry Level and Level 1, it was not possible to condition on subject area of study, since the corresponding subject information is not available fo r these qualifications within the Labour Force Survey data that was used for the estimation of marginal labour market returns. In addition, it was also not possible to condition on subject area for learners undertaking apprenticeships, as the resulting sample size within the Labour Force Survey data would have been too small to produce meaningful results (since the few learners in the UCG cohort undertaking apprenticeships are concentrated across a small number of specific subject areas).
Figure 21 Estimating the gross learner benefit and gross Exchequer benefit (example for fulltime Level 2 vocational qualifications)
Note: The analysis assumes that the opportunity costs of foregone earnings associated with qualification attainment are applicable to full-time students only. For part-time students (i.e. predominantly adult learners), we have assumed that these students are able to combine work with their studies and as such, do not incur any opportunity costs in the form of foregone earnings. This illustration is based on an analysis of UCG’s student cohort data for 2023-24, where the average age at enrolment for full-time students undertaking vocational qualifications at Level 2 stands at 18, with an average study duration of 1 year.
Source: London Economics
To estimate the gross learner benefit, based on the results from the econometric analysis, we then estimate the present value of the enhanced post-tax earnings of individuals in possession of different FE qualifications and apprenticeships (i.e. after income tax, National Insurance and VAT are removed, and following the deduction of foregone earnings (where applicable)) relative to an individual in possession of the counterfactual qualification (see Annex A2.2.6 for more detail).
The gross benefits to the Exchequer from the provision of FE qualifications and apprenticeships are derived from the enhanced taxation receipts that are associated with a higher likelihood of being employed and the enhanced earnings associated with more highly skilled and productive employees. Based on the analysis of the lifetime earnings and employment benefits associated with qualification attainment, and combined with administrative information on the relevant taxation rates and bands (from HM Revenue and Customs59), we estimate the present value of additional income tax, National Insurance, and VAT associated with FE qualification and apprenticeship attainment (by gender, level of study, mode of study, and prior attainment). Again, please refer to Annex A2.2.6 for more detailed information on the calculation of the gross Exchequer benefit.
A2.2.3 Qualifications and counterfactuals considered in the econometric analysis
Reflecting the qualifications offered by UCG, our econometric analysis of the earnings and employment returns to FE qualifications and apprenticeships (described in more detail in Annex A2.2.4) considered:
Six different further education qualification groups (i.e. six ‘treatment’ groups for FE qualifications), separately for Entry Level, Level 1, Level 2, Level 3, Level 4, and Level 5 vocational qualifications60; and
Two different apprenticeship levels, including Intermediate Apprenticeships and Advanced Apprenticeships.
Table 11 presents these different FE qualifications and apprenticeships (i.e. treatment groups) considered in the analysis, along with the associated counterfactual group used for the marginal returns analysis in each case61 . As outlined above, we compare the earnings of the group of individuals in possession of each FE qualification or apprenticeship to the relevant counterfactual group, to ensure that (to the greatest extent possible) we assess the economic benefit associated with the qualification itself (rather than the economic returns generated by the specific characteristics of the individual in possession of the qualification). This is a common approach in the literature and allows us to control for other personal, regional, or socioeconomic characteristics that might influence both the determinants of qualification attainment as well as earnings/employment.
Table 11 Treatment and comparison groups used to assess the marginal earnings and employment returns to FE qualifications and apprenticeships
Treatment group – highest qualification
FE qualifications
Level 5 vocational qualifications
Level 4 vocational qualifications
Level 3 vocational qualifications
Level 2 vocational qualifications
Level 1 vocational qualifications
Entry Level vocational qualifications
Apprenticeships
Advanced Apprenticeships
Intermediate Apprenticeships
Source: London Economics
Comparison group - highest qualification
Level 3 vocational qualifications
Level 3 vocational qualifications
Level 2 vocational qualifications
Level 1 vocational qualifications
No qualifications
No qualifications
Level 2 vocational qualifications
Level 1 vocational qualifications
60 Again, note that students in the 2023-24 UCG cohort starting FE qualifications at Level 2 and 3 include a small number of students who started academic qualifications at these levels (e.g. GCSEs in English Language or Mathematics, or a GCE A Level). For simplicity, these are implicitly treated as vocational qualifications throughout the analysis here.
61 In this respect, note again that a relatively large proportion of students in UCG’s 2023-24 cohort had their prior educational attainment recorded as either ‘not known’ or ‘other qualification level not known’ (due to the generally limited coverage of the relevant prior attainment variable within the Individualised Learner Record data). In the absence of more consistent, reliable, and complete information on students’ prior attainment, we therefore assumed that all students starting a given level of FE qualification/apprenticeship at the College in 2023-24 were in possession of the next highest (lower) level of qualification (based on the assumed counterfactual groups presented in Table 11). This potentially results in an underestimation of the ‘true’ economic benefits associated with qualification attainment at UCG, as, in reality, it is expected that a number of students in the cohort were in possession of lower levels of prior attainment than those assumed here
A2.2.4 Marginal earnings and employment returns to FE qualifications and apprenticeships
To estimate the impact of qualification attainment on earnings, using information from the Labour Force Survey (LFS), we estimated a standard ordinary least squares linear regression model, where the dependent variable is the natural logarithm of hourly earnings, and the independent variables include the full range of qualifications held alongside a range of personal, regional, and job-related characteristics that might be expected to influence earnings. In this model specification, we included individuals who were employed on either a full-time or a part-time basis. This approach has been used widely in the academic literature.
The basic specification of the model was as follows:
���� (����) = �� + ������ + ���� for i = 1 to n
where ln(����) represents the natural logarithm of hourly earnings, ����represents an error term, �� represents a constant term, i is an individual LFS respondent, and ���� provides the independent variables included in the analysis, as follows:
Highest qualification held;
Age;
Age squared;
Ethnic origin;
Disability status;
Region of work;
Marital status;
Number of dependent children under the age of 16;
Full-time / part-time employment;
Temporary or permanent contract;
Public or private sector employment;
Workplace size; and
Yearly dummies.
Using the above specification, we assessed the earnings returns in aggregate and for men and women separately. Further, to analyse the benefits associated with different education qualifications over the lifetime of individuals holding these qualifications, where possible, the regressions were estimated separately across a range of different age bands for the working age population, depending on the qualification considered62 . Where possible, the estimated marginal earnings returns also take account of the specific subject mix of students in the 2023-24 UCG cohort63 (see Section 2.1 for more information on this cohort, including a breakdown by subject).
62 This breakdown of marginal earnings (and employment) returns by age band was only possible for the estimation of the returns to Level 2, Level 3, and Level 4 vocational qualifications. For all other FE qualifications (and apprenticeships), the underlying sample sizes within the LFS data were too small to produce a breakdown by age band. Therefore, for all other qualifications except Level 2, 3, and 4 vocational qualifications, we instead use average marginal earnings and employment returns across individuals of all ages.
63 This subject mix adjustment was made by applying weights within in the LFS regressions reflecting the proportion of students in the cohort enrolled in each subject area. Note again that this adjustment for subject composition was only feasible for FE qualifications at Levels 2 to 5. For Entry Level and Level 1 qualifications, the corresponding subject information is not available from the LFS data. In addition, it was also not possible to condition on subject area for learners undertaking apprenticeships, as the resulting sample size within the LFS data would have been too small to produce any meaningful results (since the few learners in the UCG cohort undertaking apprenticeships are concentrated across a small number of specific subject areas).
Further note that the analysis of earnings premiums was undertaken at a national (UK-wide) level (i.e. using LFS data on individuals living anywhere in the UK).
To estimate the impact of FE qualifications and apprenticeships on labour market outcomes using this methodology, we used information from pooled Quarterly UK Labour Force Surveys between Q1 2010 and Q4 2024.
The resulting estimated marginal wage returns to the different qualifications of interest are presented in Table 12. In the earnings regressions, the coefficients provide an indication of the additional effect on hourly earnings associated with possession of the respective qualification/apprenticeship relative to the counterfactual level of qualification:
For Level 2, Level 3, and Level 4 vocational qualifications (only), it was possible to estimate separate marginal earnings (and employment) returns by age band. For example, the analysis suggests that men aged between 31 and 35 in possession of a Level 3 vocational qualification achieve a 17% hourly earnings premium compared to comparable men holding a Level 2 vocational qualification as their highest level of attainment. The comparable estimate for women aged between 31 and 35 stands at 11%
For all other FE qualifications and all apprenticeships, the underlying sample sizes within the LFS data were too small to disaggregate the estimates by age band. Therefore, for all other qualifications (except Level 2, Level 3, and Level 4 vocational qualifications), we instead estimate and apply average marginal earnings and employment returns across all ages/age bands. For example, the analysis suggests that men in possession of a Level 1 vocational qualification achieve a 2% hourly earnings premium (on average across all ages/age bands) compared to comparable men with no formal qualifications. The corresponding estimate for women stands at 5%
To estimate the impact of qualification attainment on employment, we instead adopted a probit model to assess the likelihood of different qualification holders being in employment or otherwise. The basic specification defines an individual’s labour market outcome to be either in employment (working for payment or profit for more than 1 hour in the reference week (using the standard International Labour Organisation definition) or not in employment (being either unemployed or economically inactive)). The specification of the probit model was as follows:
������������(��������������) = �� + ������ + ���� for i = 1 to n 64
The dependent variable adopted represents the binary variable �������������� , which is coded 1 if the individual is in employment and 0 otherwise.65 We specified the model to contain a constant term (��) as well as a number of standard independent variables, including the qualifications held by an individual (represented by ���� in the above equation), as follows:
Highest qualification held;
Age;
Age squared;
Ethnic origin;
Disability status;
Region of usual residence;
64 Where i is again an individual LFS respondent.
65 The probit function reflects the cumulative distribution function of the standard normal distribution.
Marital status;
Number of dependent children under the age of 16; and
Yearly dummies.
Again, ���� represents an error term. Similar to the methodology for estimating earnings returns, the above described probit model was estimated in aggregate and separately for men and women, with the analysis further split by respective age bands (again, for Level 2, Level 3, and Level 4 qualifications only), and adjusted for the specific subject mix of students in the 2023-24 cohort of students attending United Colleges Group (again, where possible). Further, and again similar to the analysis of earnings returns, employment returns were estimated at the national (i.e. UK-wide) level.
The resulting estimated marginal employment returns are presented in Table 13. The returns here provide estimates of the impact of each qualification on the probability of being in employment, expressed in percentage points:
Again, for Level 2, Level 3, and Level 4 vocational qualifications (only), we estimated separate returns by age band. For example, the analysis estimates that a man aged between 31 and 35 in possession of a Level 3 vocational qualification is 5.8 percentage points more likely to be in employment than a man of similar age holding only a Level 2 vocational qualification as their highest level of attainment. The comparable estimate for women aged between 31 and 35 stands at 7.5 percentage points
For all other FE qualifications and all apprenticeships, we again instead estimate and apply average marginal earnings and employment returns across all ages/age bands. For example, the analysis suggests that men in possession of a Level 1 vocational qualification are 3.3 percentage points more likely to be in employment (on average across all ages/age bands) than comparable men with no formal qualifications. The corresponding estimate for women stands at 8.8 percentage points
12 Marginal earnings returns to FE qualifications and apprenticeships, in % (following exponentiation), by gender and age band
Note : Regression coefficients have been exponentiated to reflect percentage wage returns. In cases where the estimated coefficients are not statistically significantly different from zero (at the 10% level), the coefficient is assumed to be zero; these are displayed as gaps in the table. The only exception to this rule here was made for Entry Level and Level 1 vocational qualifications, where we used all estimates irrespective of their statistical significance.
1 The returns to Level 2 , Level 3 , and Level 4 vocational qualifications were estimated separately across different age bands. For all other qualifications, we instead estimated average returns across all ages/age bands, due to relatively limited underlying sample sizes within the LFS data.
2 There are no estimated returns for Level 4 and Level 5 vocational qualifications for men , as there are no male students undertaking such qualifications in the 2023 24 cohort of UCG students .
Source: London Economics' analysis of pooled Quarterly Labour Force Survey data for 2010 Q1202 4
Marginal employment returns to FE qualifications and apprenticeships, in percentage points, by gender and age band
13
Note : In cases where the estimated coefficients are not statistically significantly different from zero (at the 10% level), the coe fficient is assumed to be zero; these are displayed as gaps in the table. The only exception to this rule here was made for Entry Level and Level 5 vocational qualifications, where we used all estimates irrespective of their statistical significance.
1 The returns to Level 2 , Level 3 , and Level 4 vocational qualifications were estimated separately across different age bands. For all other qualifications, we instead esti mated average returns across all ages/age bands, due to relatively limited underlying sample sizes within the LFS data.
2 There are no estimated returns for Level 4 and Level 5 vocational qualifications for men , as there are no male students undertaking such qualifications in the 2023 24 cohort of UCG students .
Source: London Economics' analysis of pooled Quarterly Labour Force Survey data for 2010 Q1202 4 Q4
Many existing economic analyses of the lifetime benefits associated with education qualifications to date (e.g. Walker and Zhu (2013), who focus on higher education qualifications) have focused on the returns associated with the ‘traditional path’ of post16 education qualification attainment –e.g. progression directly from secondary level education and completion of a three- or four-year undergraduate degree from the age of 18 onwards (completing by the age of 21 or 22). These analyses assume that there are direct costs as well as an opportunity cost (the foregone earnings while undertaking the qualification full-time) associated with qualification attainment. More importantly, these analyses make the implicit assumption that all of the estimated earnings and/or employment benefit achieved accrues to the individual.
However, the labour market outcomes associated with the attainment of qualifications on a parttime basis are fundamentally different to those achieved by full-time students. In particular, parttime students typically undertake their qualifications much later than full-time students (e.g. the estimated average age at enrolment among students in the 2023-24 cohort completing Level 2 vocational qualifications at UCG on a part-time basis is 36, compared to 18 for corresponding fulltime students – since the College’s part-time learners are predominantly adult learners); often undertake their studies over an extended period of time; and often combine their studies with fulltime employment. Table 14 presents the assumed average age at enrolment, study duration, and age at completion for students in the 2023-24 United Colleges Group cohort66 .
Given these characteristics, we adjust the methodology when estimating the returns to part-time education attainment at UCG, through the use of an ‘age-decay’ function. This approach assumes that possession of a particular education qualification is associated with a certain earnings or employment premium, and that this entire labour market benefit accrues to the individual if the FE qualification or apprenticeship is attained before the age of 24. However, as the age of attainment increases, it is expected that a declining proportion of the potential value of the estimated earnings and employment benefit accrues to the individual.67 This calibration ensures that those individuals completing qualifications at a relatively older age will see relatively lower earnings and employment benefits associated with qualification attainment, while those individuals attaining qualifications earlier in their working life will see a greater economic benefit.
66 The assumed average duration of study (by qualification level and mode) is based on information on the total expected study duration per learner in the 2023 24 cohort of students provided by UCG (based on ILR data). In each instance, since the underlying model is undertaken on a per annum basis, any students undertaking qualifications that are shorter than 1 year have been assigned a (maximum) 1 year study duration.
67 E.g. Callender et al. (2011), focusing on higher education qualifications, suggest that the evidence points to decreasing emp loyment returns with age at qualification: older graduates are less likely to be employed than younger graduates three and a half years after graduation; however, there are no differences in the likelihood of graduates undertaking part time and full time study being employed according to their age or motivations to study.
Table 14 Average age at enrolment, study duration, and age at completion for students in the 2023-24 UCG cohort
Qualification
Note: All values have been rounded to the nearest integer. In the table, for simplicity (for presentational purposes), apprenticeship learners have been included in the same columns as full-time students. Again, note that there were no students in the cohort undertaking full-time Level 4 or 5 vocational qualifications.
Source: London Economics' analysis based on UCG data
Table 15 presents the assumed age-decay adjustment factors that we apply to the marginal earnings and employment returns for full-time and part-time students undertaking qualifications at United Colleges Group in the 2023-24 cohort. To take an example, we have assumed that a student undertaking a Level 2 vocational qualification on a full-time basis achieves the full earnings and employment premium identified in the econometric analysis (for their entire working life). However, for a part-time Level 2 student, we assume that because of the late attainment (at age 34 (on average)), these students recoup only 73% of the corresponding earnings and employment premiums from that age (of attainment).
Note: Shaded areas indicate relevant average age at completion per full-time/part-time student at each level of study at UCG (see Table 14): Full time students Part time students.
In the table, for simplicity (for presentational purposes), apprenticeship learners have been categorised as full-time students. Again, note that there were no students in the cohort undertaking full-time Level 4 or Level 5 vocational qualifications.
Source: London Economics' analysis based on UCG data
The gross learner associated with qualification attainment is defined as the present value of enhanced post-tax earnings (i.e. after income tax, National Insurance and VAT are removed and following the deduction of foregone earnings) relative to an individual in possession of the counterfactual qualification. To estimate the value of the gross learner benefit, it is necessary to
extend the econometric analysis (presented in Annex A2.2.4) by undertaking the following elements of analysis (separately by qualification level, gender, and study mode):
1. We estimated the employment-adjusted annual earnings achieved by individuals in the counterfactual groups (see Annex A2.2.3 for more detail), again using pooled Quarterly UK Labour Force Survey data between Q1 2010 and Q4 2024.
2. We inflated these baseline or counterfactual earnings using the marginal earnings premiums and employment premiums (presented in Annex A2.2.4), adjusted to reflect late attainment (as outlined in Annex A2.2.5), to produce annual age-earnings profiles associated with the possession of each particular qualification.
3. We adjusted these age-earnings profiles to account for the fact that earnings are expected to increase over time (based on average annual earnings growth rate forecasts estimated by the Office for Budget Responsibility (2024, 2025)68).
4. Based on the earnings profiles generated for individuals in possession of each particular qualification of interest, and income tax and National Insurance rates and allowances for the relevant year 69 , we computed the future stream of net (i.e. post-tax) earnings70 . Using similar assumptions, we further calculated the stream of (employment-adjusted) foregone earnings (based on earnings in the relevant counterfactual group 71) during the period of study, again net of tax, for full-time students (as well as apprentices) only.
5. We then calculated the discounted stream of additional (employment-adjusted) future earnings compared to the relevant counterfactual group (using a standard real discount rate of 3.5% (Years 130) and 3.0% (Years 31+) as outlined in HM Treasury Green Book (HM Treasury, 2022)), and the discounted stream of foregone earnings during qualification attainment (for full-time students), to generate a present value figure. We thus arrive at the gross learner benefit.
6. The discounted stream of enhanced taxation revenues minus the tax income foregone during students’ qualification attainment (where relevant) derived in element then provides an estimate of the gross public benefit associated with qualification attainment.
The difference between the gross and net learner benefit relates to students’ direct costs of qualification acquisition72:
For further education qualifications, the direct costs to students associated with attaining these qualifications include any tuition fees paid by students themselves73 , offset against any Advanced Learner Loans (provided by the Student Loans Company74) and Adult
68 Specifically, we make use of the office for budget Responsibility’s most recent short-term forecasts (for 2024-25 to 2029-30 (see OBR, 2025)) and long-term forecasts (for 2030-31 onwards (see OBR, 2024)) of nominal average earnings growth that were available at the time that the analysis here was undertaken.
69 i.e. 2023-24. Note that the analysis assumes fiscal neutrality, i.e. it is asserted that, in subsequent years, the earnings tax and National Insurance income thresholds/bands grow at the same rates of average annual earnings growth (again based on Office for Budget Responsibility forecasts).
70 The tax adjustment also takes account of increased VAT revenues for HMT, by assuming that individuals consume 90.9% of their annual income, and that 49% of their consumption is subject to VAT at a rate of 20%. The assumed proportion of income consumed and the proportion of consumption subject to VAT are both based on forecasts by the Office for Budget Responsibility (2025) (where the proportion of income consumed is calculated as 100% minus the projected household savings rate).
71 The foregone earnings calculations are based on the relevant earnings among individuals in the relevant counterfactual group (again, see Annex A2.2.3 for more detail).
72 Note again that the indirect costs associated with qualification attainment, in terms of the foregone earnings during the period of study (for full-time students only), are already deducted from the gross learner benefit (as discussed in Annex A2.2.6).
73 i.e. for the (very small) number of full cost (fee-paying) students studying at the College (for whom no public funding is provided).
74 Advanced Leaner Loans are available to students aged 19 and over, studying at RQF Levels 3 to 6.
Education Budget grants (provided by the Education and Skills Funding Agency (ESFA) and the Greater London Authority (GLA))75. In this respect, the student benefit/Exchequer cost associated with Advanced Learner Loans equals the Resource Accounting and Budgeting charge (RAB charge), capturing the proportion of the loan that is expected not to be repaid76
For apprenticeships, these learners incur the indirect costs of foregone earnings associated with the counterfactual level of qualification during their training (which are already accounted for in the above described gross learner benefit). However, there are no direct costs incurred by apprentices associated with their training. Instead, these learners benefit from receiving apprentice wages during their training, and these net (after-tax) wages constitute a significant benefit component associated with apprentice training77 . For more information on our methodology for estimating apprentice pay during training, please refer to Annex A2.2.8.
Similarly, the difference between the gross and net Exchequer benefit relates to the direct costs to the public purse associated with funding education provision:
For FE qualifications, the direct Exchequer costs of funding these qualifications include the (above-mentioned) costs of providing Advanced Learner Loans78 and ESFA/GLA Adult Education Budget grants to students, as well as the ESFA grant funding provided to UCG to subsidise the College’s provision of FE teaching to 1619 learners.79
Finally, for apprenticeships, in addition to the indirect costs of foregone tax revenues during the training (again already accounted for in the gross public purse benefit), we deduct the Exchequer costs of Apprentice Levy funding 80 In addition, and as a key Exchequer benefit during training (rather than a cost), the Exchequer accrues the tax receipts (again including income tax, National Insurance employee and employer contributions, and VAT), associated with the apprentice wages received by learners during their training81 .
These direct costs during the period of study (and direct benefits, for apprentices) to both students and the Exchequer (by qualification level and study mode) are calculated from start to completion of a student’s learning aim (i.e. over the entire expected study/training duration). Throughout the analysis, to ensure that the economic impacts are computed in present value terms (i.e. in 2023-24
75 The average level of funding per student per year for each of these types of FE funding (as well as for the corresponding direct Exchequer costs of provision, outlined below) was estimated by dividing the total amount of funding associated with students in the 2023-24 UCG cohort (by type of funding, mode of study, and level of study) by the corresponding total number of students in the cohort – all based on ILR data provided by United Colleges Group.
76 We assumed a RAB charge of 35% for Advanced Learner Loans, based on RAB charge estimates (for Plan 5 Advanced Learner Loans issued in 2023-24) published by the Department for Education (2024b).
77 As a result of these in-training benefits, for apprentice learners, the estimated ‘net’ learner benefits are always larger than the estimated ‘gross’ learner benefits.
78 Again, adjusted for the RAB charge – i.e. the cost to the Exchequer of providing Advanced Learner Loans is captured by the proportion of the loan outlay that is expected not to be repaid by students.
79 Again, this is based on detailed ILR data provided by United Colleges Group (see Footnote 75 for more information).
80 The estimated average cost of Apprentice Levy funding per learner per year is again based on ILR data provided by UCG (see Footnote 75 for more information). The Apprentice Levy is a levy placed on employers with an annual pay bill in excess of £3 million; however, for small employers that do not meet this threshold, and for Levy-paying employers that want to invest more in apprenticeship training than they have available in their levy accounts, the Exchequer ‘co-invests’ 95% of the costs of provision, paid directly to the training provider (so that employers only have to cover the remaining 5% of the costs). For simplicity (and given the very small number of apprentice learners in the 2023-24 UCG cohort), in the absence of a breakdown of how much of the total negotiated price (negotiated between the employer and UCG) per apprenticeship standard for learners in the 2023-24 cohort was provided through employers’ Levy accounts vs. co-invested by the government, we have included the entirety (i.e. 100%) of the negotiated price per apprenticeship standard as a cost to the Exchequer.
81 Again, see Annex A2.2.8 for more information.
money terms), all benefits and costs occurring at points in the future were discounted using the standard HM Treasury Green Book real discount rates of 3.5%/3.0% (see HM Treasury, 2022).
Deducting the resulting individual and Exchequer costs from the estimated gross learner and gross public purse benefit82 , respectively, we then arrive at the estimated net learner benefit and net public purse benefit per student (presented in Annex A2.2.9).
While incurring the (indirect) costs of foregone earnings (associated with the baseline/counterfactual level of qualification), apprentice learners receive apprentice wages during their training
To estimate these benefits for the 2023-24 cohort of learners starting apprenticeships at United Colleges Group, we made use of the Department for Education’s 2023 Apprenticeship Evaluation Learner Survey83 . The survey provides detailed information on the median hourly pay 84 and average number of actual hours worked per week85 among apprentices in England in 202386 , with separate breakdowns available by gender, age band (1618, 1924, and 25+), and RQF level.
Given that the original survey results are only published separately by either gender, age band, or level, we estimated a combined breakdown of apprentice wages across all three of these dimensions. Specifically, we first estimated a breakdown by age band and level, by multiplying the pay rates by level by the ratio of overall average hourly pay for each age band relative to the overall average hourly pay for all apprentices (i.e. we assume the same pay distribution by age band across all apprenticeship levels87). We then proceeded similarly to estimate the breakdown by level, age band, and gender, assuming the same pay distribution by gender across all age bands and levels.
To estimate learners’ aggregate (net) apprentice pay over the total training duration, we then undertook the following calculation steps:
1. By combining the above average hourly pay rates with the associated average number of hours worked per week and the average number of weeks per year (52.2), we calculated the estimated average annual earnings in 2023-24. Table 16 presents our resulting estimated annual apprentice pay rates in 2023-24 by gender, age band and level.
2. Using the assumptions on the average age at which apprentice learners in the 2023-24 UCG cohort start their training, and the assumed average duration of training (by level)88 , we estimated the total gross (i.e. pretax) apprentice earnings per learner over the total training duration.
3. As with earnings post-completion, we adjusted the estimates to account for Office for Budget Responsibility forecasts of average nominal earnings growth for the UK (where relevant, i.e. for Advanced Apprenticeships only (where the average training duration stands at 2 years, rather than 1))89
82 And, for apprentices, adding the benefits of apprentice pay (and associated tax receipts) during training.
83 See Department for Education (2024c).
84 We use information on gross hourly pay, including any overtime pay (or other income).
85 Actual hours per week includes contracted hours as well as any paid or unpaid overtime.
86 The survey was undertaken between July and September 2023.
87 For the 16-18 age band specifically, we apply the ratio of overall average hourly pay for each age band relative to the overall average hourly pay for Level 2 and 3 apprentices only. This is because individuals aged 16-18 generally do not undertake Level 4+ apprenticeships.
88 See Annex A2.2.5 for more detail.
89 Again, see Office for Budget Responsibility (2025).
4. Based on the relevant income tax and National Insurance employee contribution rates and thresholds, we then computed the stream of net (post-tax) apprentice earnings.
Finally, we again discounted the results to present value terms in 2023-24 prices (where relevant).
Table 16 Average apprentice pay in England: Estimated annual pay in 2023-24 by gender, age band, and apprenticeship level
Age band
Level 2 (Intermediate App.)
Male
Level 3 (Advanced App.)
Female
Level 2 (Intermediate App.)
Level 3 (Advanced App.) 1618
£13,200
£19,600
£24,100
Note: All pay rates are presented in 202 3 24 values and rounded to the nearest £100. There were no students in the 2023 24 UCG cohort undertaking Higher Apprenticeships (at Level 4+).
Source: London Economics’ analysis based on Department for Education (2024c)
A2.2.9 Estimated gross and net learner and Exchequer benefit
Table 17 and Table 18 present the estimated gross learner benefits and public purse benefits (respectively) per student associated with FE qualification and apprenticeship attainment at United Colleges Group (based on the 2023-24 learner cohort, and broken down by study mode, level of study90 , gender, and prior attainment) resulting from the above-outlined analysis. Table 19 and Table 20 then provide corresponding information on the associated net learner benefits and public benefits per student, respectively.
90 Due to the small number of learners undertaking these qualifications in the 202 3-24 cohort, the results for FE learners at Levels 4/5 and apprentices have not been presented here (see the grey shaded cells in the tables).
17 Gross learner benefits per student associated with FE qualification and apprenticeship attainment at UCG, by study mode, level, gender, and prior attainment
Apprenticeships
Note: All values are rounded to the nearest £1,000. Gaps may arise where there are no students in the 2023-24 UCG cohort expected to complete the given qualification (with the given characteristics). In terms of prior attainment, note again that there was only relatively incomplete prior attainment information available for students in the cohort, so we assumed that all students starting a given level of FE qualification/ apprenticeship at the College in 2023-24 were in possession of the next highest (lower) level of qualification (see Annex A2.2.3). Due to the underlying small sample sizes (in terms of the small number of learners undertaking these qualifications), the results for FE learners at Levels 4/5 and for apprentices have not been presented here (see the grey shaded cells).
Source: London Economics' analysis
18 Gross Exchequer benefits per student associated with FE qualification and apprenticeship attainment at UCG, by study mode, level, gender, and prior attainment
Note: All values are rounded to the nearest £1,000. Gaps may arise where there are no students in the 2023-24 UCG cohort expected to complete the given qualification (with the given characteristics). In terms of prior attainment, note again that there was only relatively incomplete prior attainment information available for students in the cohort, so we assumed that all students starting a given level of FE qualification/ apprenticeship at the College in 2023-24 were in possession of the next highest (lower) level of qualification (see Annex A2.2.3). Due to the underlying small sample sizes (in terms of the small number of learners undertaking these qualifications), the results for FE learners at Levels 4/5 and for apprentices have not been presented here (see the grey shaded cells).
Source: London Economics' analysis
learner benefits per student associated with FE qualification and apprenticeship attainment at UCG, by study mode, level, gender, and
Apprenticeships
Note: All values are rounded to the nearest £1,000. Gaps may arise where there are no students in the 2023-24 UCG cohort expected to complete the given qualification (with the given characteristics). In terms of prior attainment, note again that there was only relatively incomplete prior attainment information available for students in the cohort, so we assumed that all students starting a given level of FE qualification/ apprenticeship at the College in 2023-24 were in possession of the next highest (lower) level of qualification (see Annex A2.2.3). Due to the underlying small sample sizes (in terms of the small number of learners undertaking these qualifications), the results for FE learners at Levels 4/5 and for apprentices have not been presented here (see the grey shaded cells).
Source: London Economics' analysis
Exchequer benefits per student associated with FE qualification and apprenticeship attainment at UCG, by study mode, level, gender, and
Note: All values are rounded to the nearest £1,000. Gaps may arise where there are no students in the 2023-24 UCG cohort expected to complete the given qualification (with the given characteristics). In terms of prior attainment, note again that there was only relatively incomplete prior attainment information available for students in the cohort, so we assumed that all students starting a given level of FE qualification/ apprenticeship at the College in 2023-24 were in possession of the next highest (lower) level of qualification (see Annex A2.2.3). Due to the underlying small sample sizes (in terms of the small number of learners undertaking these qualifications), the results for FE learners at Levels 4/5 and for apprentices have not been presented here (see the grey shaded cells).
Source: London Economics' analysis