_Uniform Crime Reporting
Violent Crime & property crime
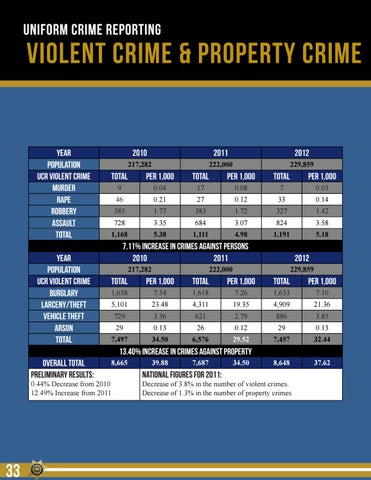
Year Population UCR Violent Crime Murder Rape Robbery Assault Total Year Population UCR Violent Crime Burglary Larceny/Theft Vehicle Theft Arson Total
2010
2011
2012
217,282
222,000
229,859
Total
Per 1,000
Total
Per 1,000
Total
Per 1,000
9
0.04
17
0.08
7
0.03
46
0.21
27
0.12
33
0.14
385
1.77
383
1.72
327
1.42
728
3.35
684
3.07
824
3.58
1,168
5.38
1,111
4.98
1,191
5.18
7.11% INCREASE in crimes against persons 2010 2011 217,282
2012
222,000
229,859
Total
Per 1,000
Total
Per 1,000
Total
Per 1,000
1,638
7.54
1,618
7.26
1,633
7.10
5,101
23.48
4,311
19.35
4,909
21.36
729
3.36
621
2.79
886
3.85
29
0.13
26
0.12
29
0.13
7,497
34.50
6,576
29.52
7,457
32.44
8,648
37.62
13.40% INCREASE in crimes against property Overall Total Preliminary Results:
8,665
0.44% Decrease from 2010 12.49% Increase from 2011
33
39.88
7,687
National figures for 2011:
34.50
Decrease of 3.8% in the number of violent crimes. Decrease of 1.3% in the number of property crimes

