This page was intentionally left blank.


This page was intentionally left blank.
Caroline Wiggins, Accreditation Manager
Brian Austerman, Deputy Chief
Arby Todd, Deputy Chief
Mike Weissenbach, Assistant Chief
Kris Presnell, Assistant Chief
Mike Mohrman, Assistant Chief
Kevin McCaw, Assistant Chief
Jim Eden, Assistant Chief
Wes Blanscet, Assistant Chief
David Tucker, Communications Supervisor
Bryce Buchanan, Captain, IAFF Local 2195 President
Michael Liebig, Engineer
Tyler Hartman, Engineer
Jeremy Blunt, Engineer
Becky Carson, Lead Communications Specialist
Eric Thompson, Firefighter
Carla Krska, Lead Communications Specialist
Joshua Rife, Firefighter
Laura Kreglo, Firefighter
Laura DeCourcy, Administrative Assistant
Cynthia Stacks, Applications Administrator, ITS
Liz Wilkerson, Senior GIS Technician, ITS
Carson Stone, GIS Technician, ITS
Table
Table
Table
Table
Table
Table
Table
Table
Table
Table
Table
Table
Table
Table
Table
Table
Table
Figure
Figure
Figure
Figure
Figure 40: Operational Demand Frontline Apparatus (2019-2023) ......................................................................................
Every community is different, and each community has its unique hazards, risks, and vulnerabilities and its unique capabilities to respond to those risks. As part of a community-focused continuous improvement process, the Lee’s Summit Fire Department (LSFD) has completed a Community Risk Assessment (CRA) and Standards of Cover (SOC) for the City of Lee's Summit and contract service areas.
The information and data collected have identified the risks to the community and the resources available to mitigate them and describes the current response performance capabilities of the Lee’s Summit Fire Department. The accreditation model established by the Commission on Fire Accreditation International (CFAI) requires that these risk and deployment assessments be reviewed annually as part of an every five-year peer review to ensure that hazards and vulnerabilities are constantly assessed and analyzed to provide the highest level of protection for the community. This document provides an overview of Lee’s Summit and contract service areas, the fire department structure and services, risk assessment of the community, current deployment, and performance data. It also identifies critical tasking for effective response force determination and includes a plan to maintain and improve these response capabilities in the future.
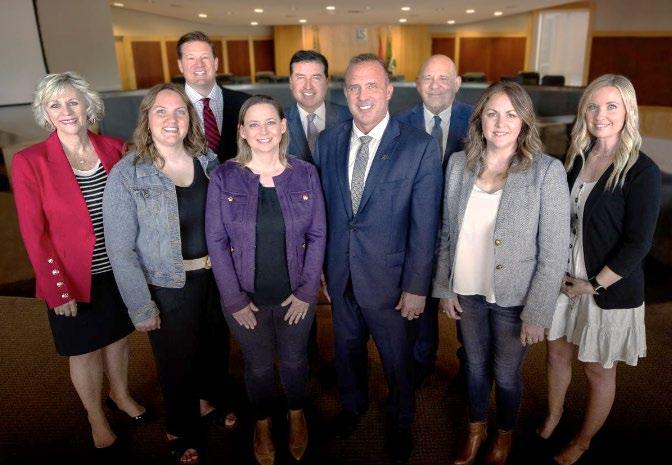
Lee’s Summit governance model comprises a mayor and eight city council members, with two council members representing each of the four council districts. Lee's Summit is a charter form of government, setting the terms for council members to four years in length. Each of the four districts is represented by two council members whose terms are staggered and expire every four years. The mayor also serves a four-year term and is elected at-large. All elected offices are subject to a two-term consecutive limit. The city manager serves as the city’s executive officer, overseeing all city departments directly or indirectly. Lee’s Summit Fire Department falls under the organizational system of the city as a self-regulating department, creating internal policies and regulations while adhering to the overhead policies and direction of the governing body.
On October 12, 1971, the City of Lee’s Summit Board of Aldermen ordained Chapter 16 ½ within the amended Ordinance 1317, thereby “providing for a modern, efficient fire department.” Once approved by the mayor, the fire department became legally established within the code of ordinances for the City of Lee’s Summit. Contracted fire department response services are also provided for the City of Greenwood and Unity Village, Missouri. Currently, the Lee’s Summit Fire Department has several mutual aid agreements with other agencies, but no automatic aid agreements.
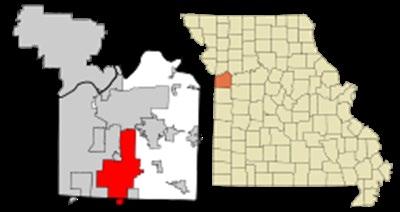
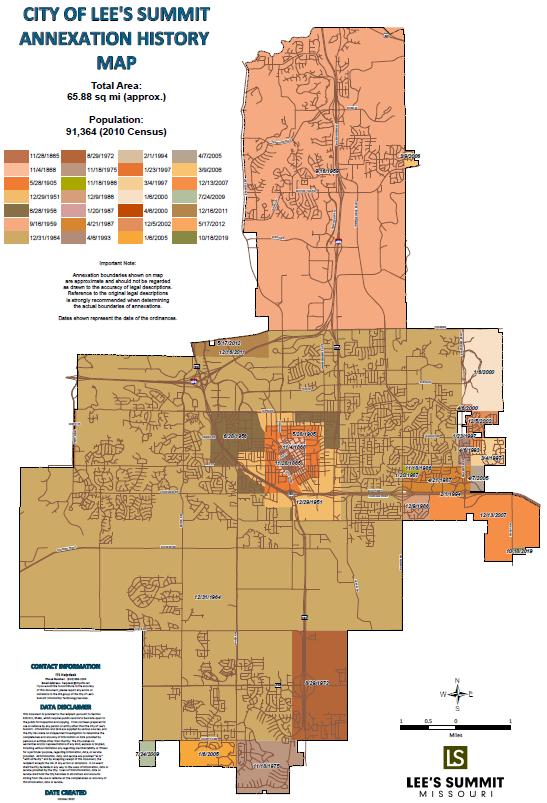
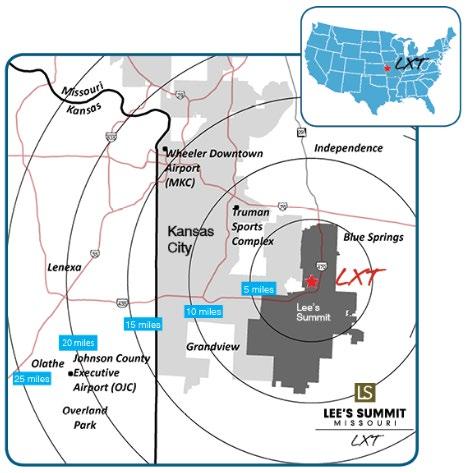
Lee’s Summit is in the southeast portion of the Kansas City metropolitan area. The city was incorporated in 1865 and originally included the 70 acres of land (0.109 square miles) that surrounded the railroad depot. The city has grown steadily for 158 years and has annexed land 28 different times. Several land annexations included neighborhoods extending out of the southern border of Jackson County into Cass County.
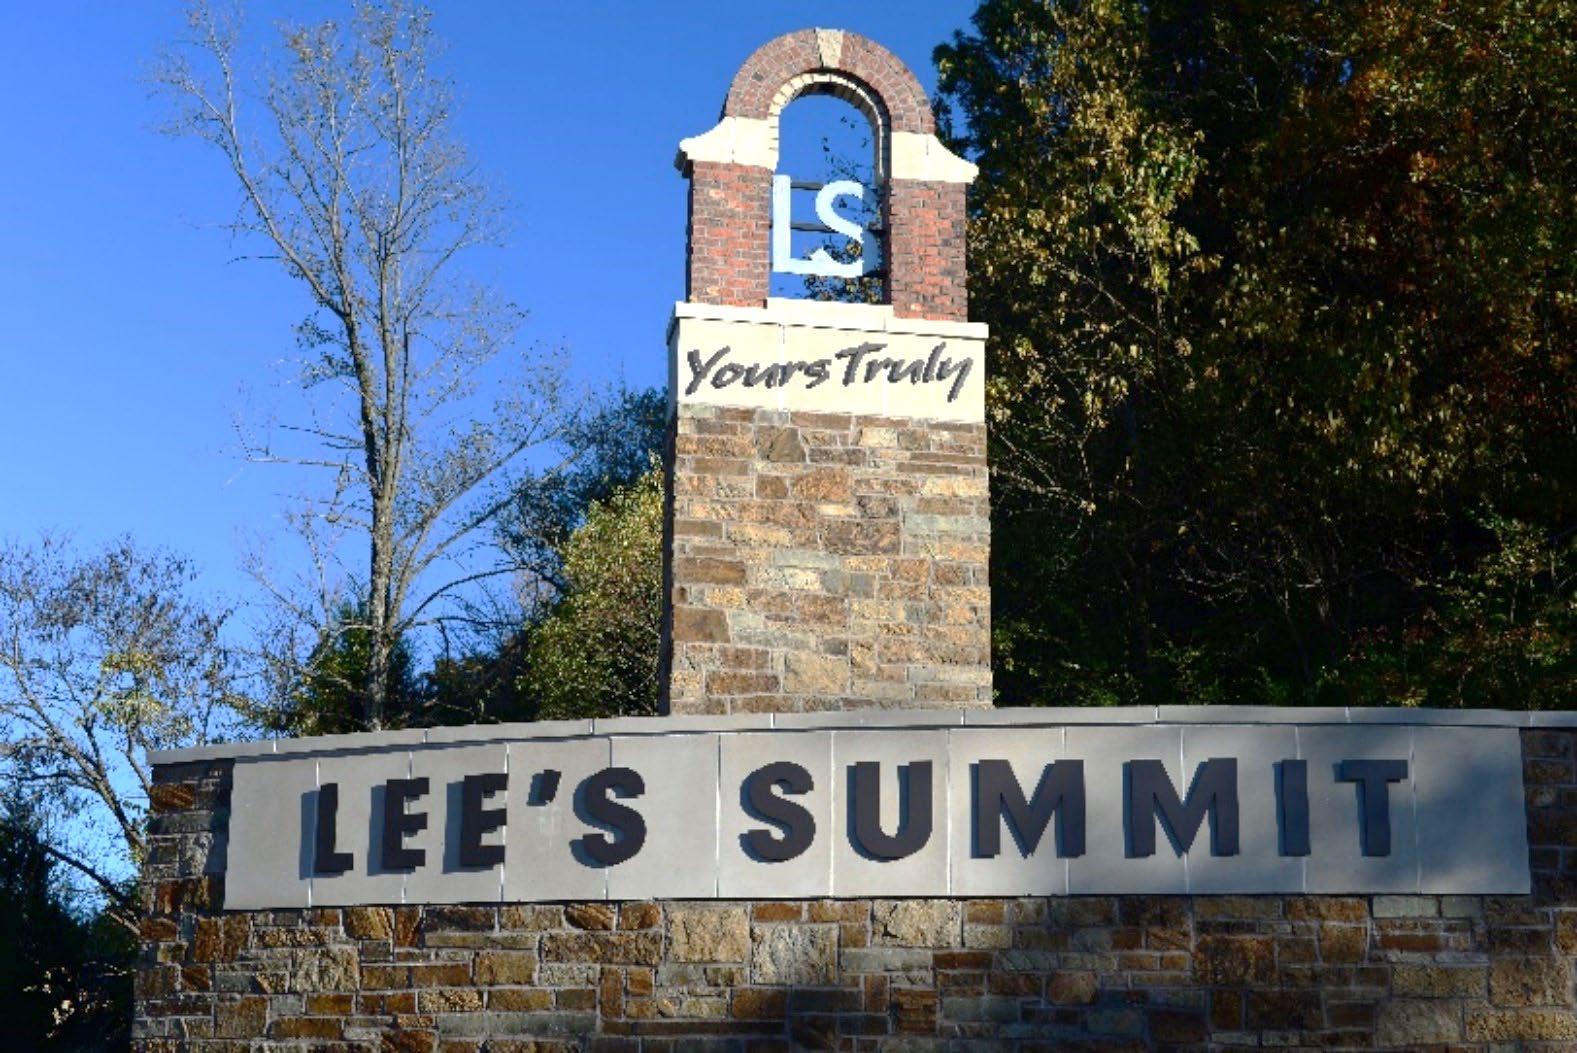
Today, Lee’s Summit has grown to be the sixth largest city in Missouri, with a current population of 106,031 within a 65.87 square mile jurisdictional boundary. In recent years, the city has experienced accelerated development and investment throughout the city in all sectors, including commercial, industrial, and residential. At the same time, the city government has maintained a strong commitment to quality services for the citizens of Lee’s Summit. The city has the unique distinction of being one of only a few cities in the nation to hold five national-level accreditations in its organization: Parks and Recreation, Public Works, Water Utilities, Police, and Fire. This commitment has not gone unnoticed; the city’s exceptional services and amenities have helped it receive regional and national recognition. In 2023, Lee’s Summit earned the #14 spot on Fortune’s “50 Best Places to Live for Families” and Livability’s “One of the Best Cities to Live in America”. Lee’s Summit has also been named a “Community for All Ages” and a “Walk and Bicycle Friendly Community.” The city has also received the “SolSmart Gold” designation for advancing solar energy growth.
Two regional hospitals call Lee’s Summit home: Saint Luke’s East and Lee’s Summit Medical Center. These healthcare facilities provide the needs of the community with state-of-the-art services, and they continue to expand to meet the growing demand for service in the community.
The Lee’s Summit R-7 school district provides education to the children of Lee’s Summit from elementary through high school. The approximate enrollment for pre-K through 12th grade in 2023-24 was 17,820 students and a support staff of 2,700 team members, with more than 1,300 being teachers. The district also added an additional middle school in the Fall of 2022 located on SE Bailey Road and SE Ranson Road. The school district is currently 117 square miles, including 18 elementary schools, four middle schools, three high schools, an alternative secondary school, a secondary technology academy, an early education center, and a special-education day-treatment center.
The northern portion of the city is home to three schools in the Blue Springs School District. Delta Woods Middle School has a staff of 90 teachers and administrators and educates over 850 seventh and eighth-grade students coming from Lee’s Summit, Independence, and Blue Springs. Voy Spears Elementary and Chapel Lakes Elementary schools each have a staff of 70 teachers and administrators, and each educates over 500 students from first grade through sixth grade. These schools, their staff, and students also fall under the protection of the Lee’s Summit Fire Department due to their location within the jurisdictional boundary of the city.
The Lee's Summit Fire Department also serves the communities of Unity Village, Missouri, and Greenwood, Missouri. Unity Village is a 1.52 square mile village located northwest of Colbern and Lee's Summit Roads. Unity Village has a population of 66 residents and is the headquarters for the Unity World Church. The centerpiece of Unity Village is a campus with historic buildings. The tower and an office building were used for the Silent Unity Prayer Ministry, which opened in 1929 and is currently on the National Register of Historic Places. Greenwood, Missouri, is a 5.23 square mile community with a population of 6,021 per the 2020 census. Greenwood is on the southeast corner of Lee's Summit.
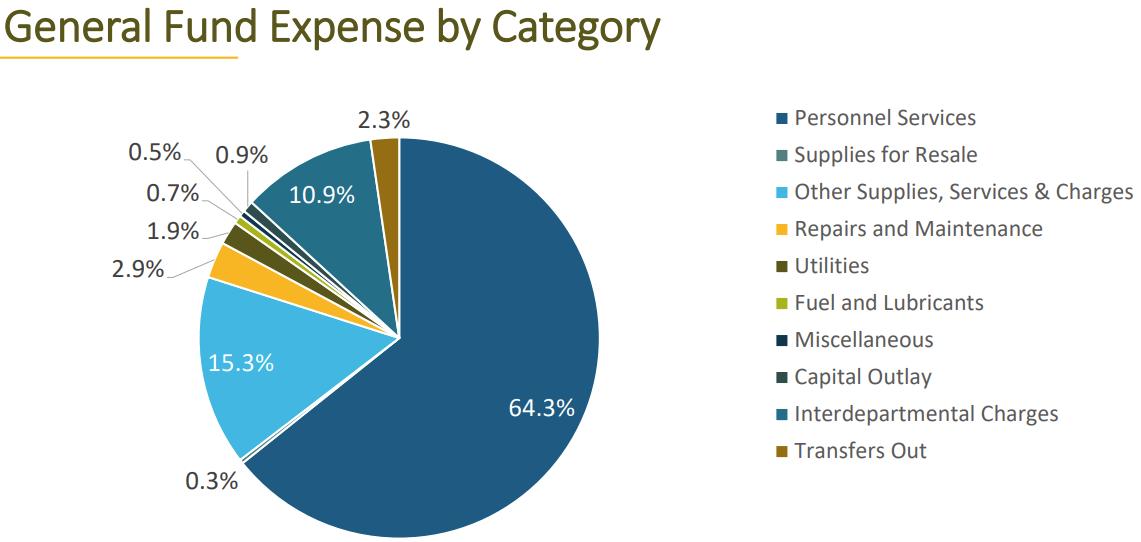
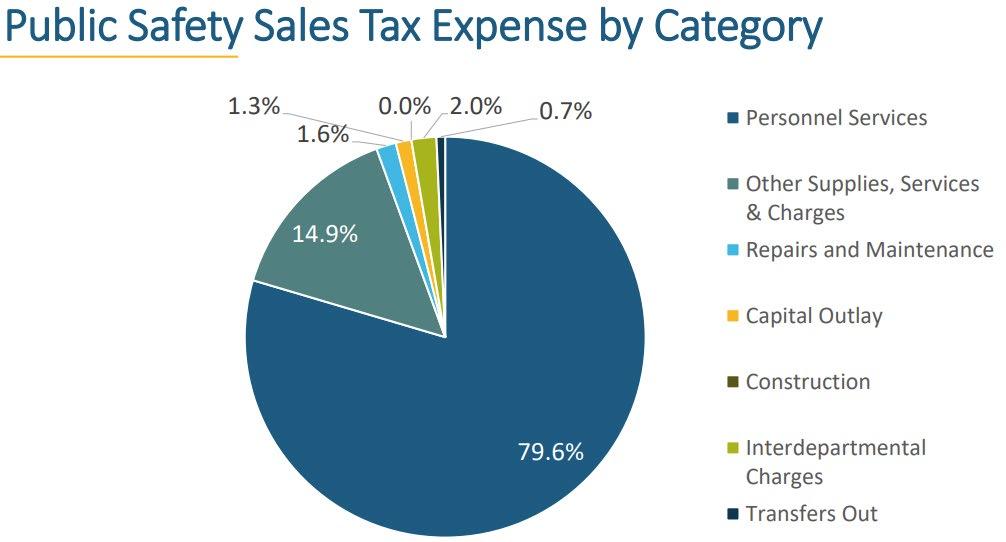
The city’s primary operating fund is called the General Fund, which is shared by nine city departments. The majority of general fund revenues come from property, sales, and franchise taxes. All fire department revenue received from contract services or ambulance billing is remitted to the city’s general fund. The department is funded through the general fund and through a Use Tax passed in June 2020 and a Public Safety Sales Tax (PSST). The PSST was approved by the citizens in Spring of 2022, with collections and revenues beginning in January of 2023. The PSST also provides additional funding to support Lee’s Summit Police Department. Both agencies coordinate the use of those available funds as per a plan each defines to enhance staffing and equipment for each respective department. The PSST budget is adopted alongside the general fund budget as part of the overall budget approval process.
The fire department’s budget is developed by input from staff members who look at existing and possible new programs and services, staffing requirements, and past fiscal year trends. Once the department’s budget is developed, the fire chief, with the help of staff, presents it to the city manager. The city manager, in turn, presents the general fund budget to the Finance and Budget Committee of the City Council. Once the committee members evaluate and recommend passage of the total budget, it is then introduced to the full council for passage. A balanced annual budget is a requirement per the City’s Charter. The city’s annual budget is formulated by revenue predictions based on actuarial and predictive trends.
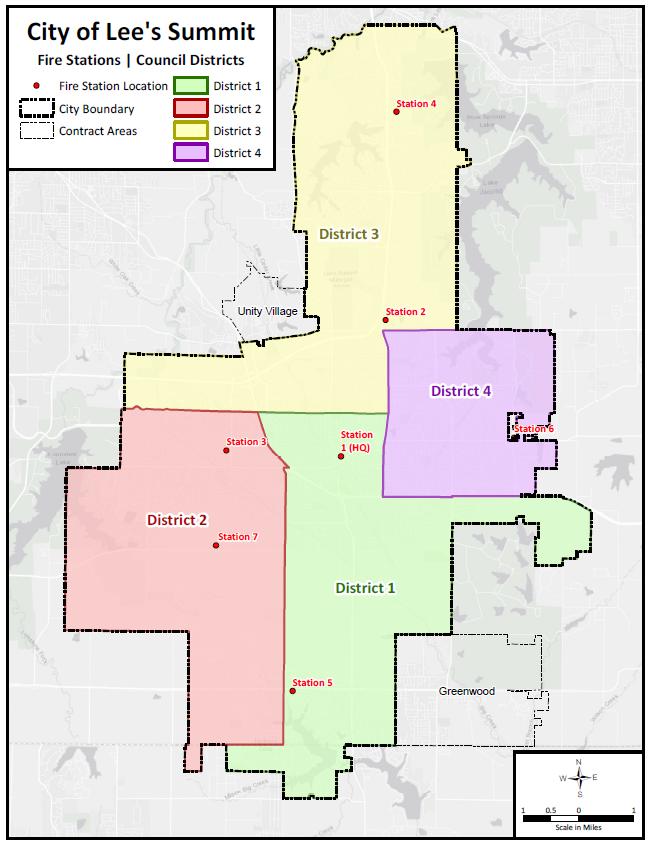
The fire department’s jurisdictional boundaries are created by the City of Lee’s Summit’s geographical boundaries and the boundaries of its contract agencies, Unity Village and Greenwood, Missouri. Unity Village comprises a total of 1.52 square miles, and Greenwood comprises 5.23 square miles of land, which increases the total response area for the LSFD to 72.62 square miles. There are five neighboring fire departments or fire protection services that border the coverage areas and have mutual aid agreements with the LSFD: Kansas City Fire Department to the west, South Metro Fire Protection District to the south, Southern Jackson County Fire Protection District to the east, Central Jackson County Fire Protection District to the northeast, and Independence Fire Department to the north.
The Ignite Comprehensive Plan was recently completed and is the City’s master plan of all plans. It articulates a series of goals, policies, actions, and standards to guide the community’s physical development and programs over a 15 to 20-year timeframe. It is a dynamic document as it is reviewed annually and presented to City officials along with any recommended policy changes. A more complete update to the plan will be produced every five years. The document serves as the basis for economic development, quality residential growth and general improvements for the protection of the quality of life for Lee's Summit residents and businesses, including public safety.
The Ignite Comprehensive Plan, as well as the other plans developed by the city, should fully integrate and support the vision, goals, and objectives of the comprehensive plan. A few of those recommended include:
Capital Improvement Plan, Greenway Master Plan, Thoroughfare Master Plan, Community for All Ages, Water Master Plan, Wastewater Master Plan, Stormwater Management Plan, 2004 Downtown Master Plan, Regional Parking Structures in Downtown Study, Historic Preservation Plan, Cultural Resources Survey, and Bicycle Transportation Plan
The fire department is actively involved in the City’s development process to ensure the current and future public safety needs are being addressed.
Five Big Ideas were developed to help define the overall direction of the Ignite Comprehensive Plan. They are:
1. Preserve natural resources, open space, and recreational, cultural, and historic resources.
2. Maintain thriving, quality neighborhoods that connect the diversity of residents throughout the community.
3. Concentrate multi-family and commercial development in five special and unique Activity Centers.
4. Grow the tax base and good-paying jobs.
5. Sustain and enhance City services, public facilities, and infrastructure to protect a high quality of life.
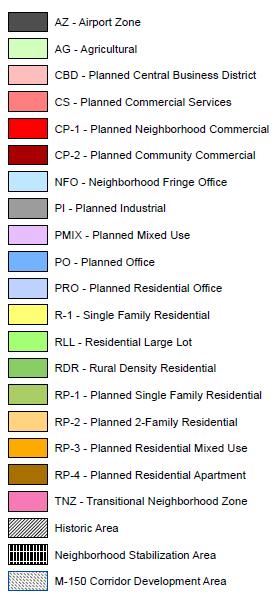
The Ignite Comprehensive Plan approach to land use falls within four categories: Preserve, Enhance, Strengthen, and Transform.
4: Ignite Comprehensive Plan - Preserve
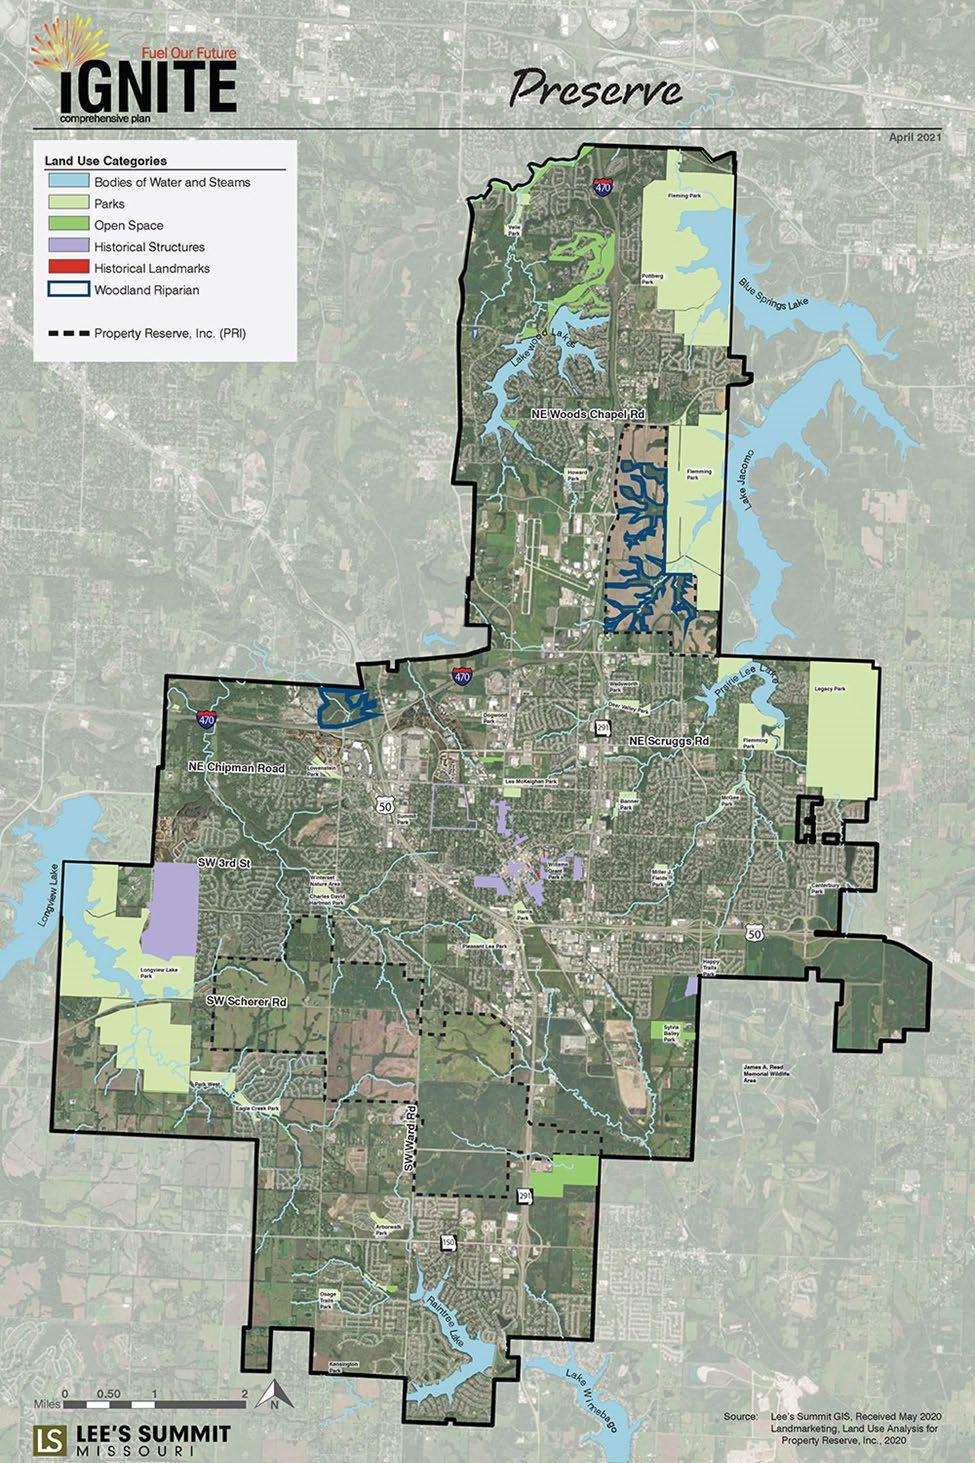
PRESERVE Lee's Summit's high-value resources for enjoyment by future generations. The map includes parks and open spaces, natural wooded areas, streams, lakes and rivers, historic places, and cultural resources.
5: Ignite Comprehensive Plan - Enhance
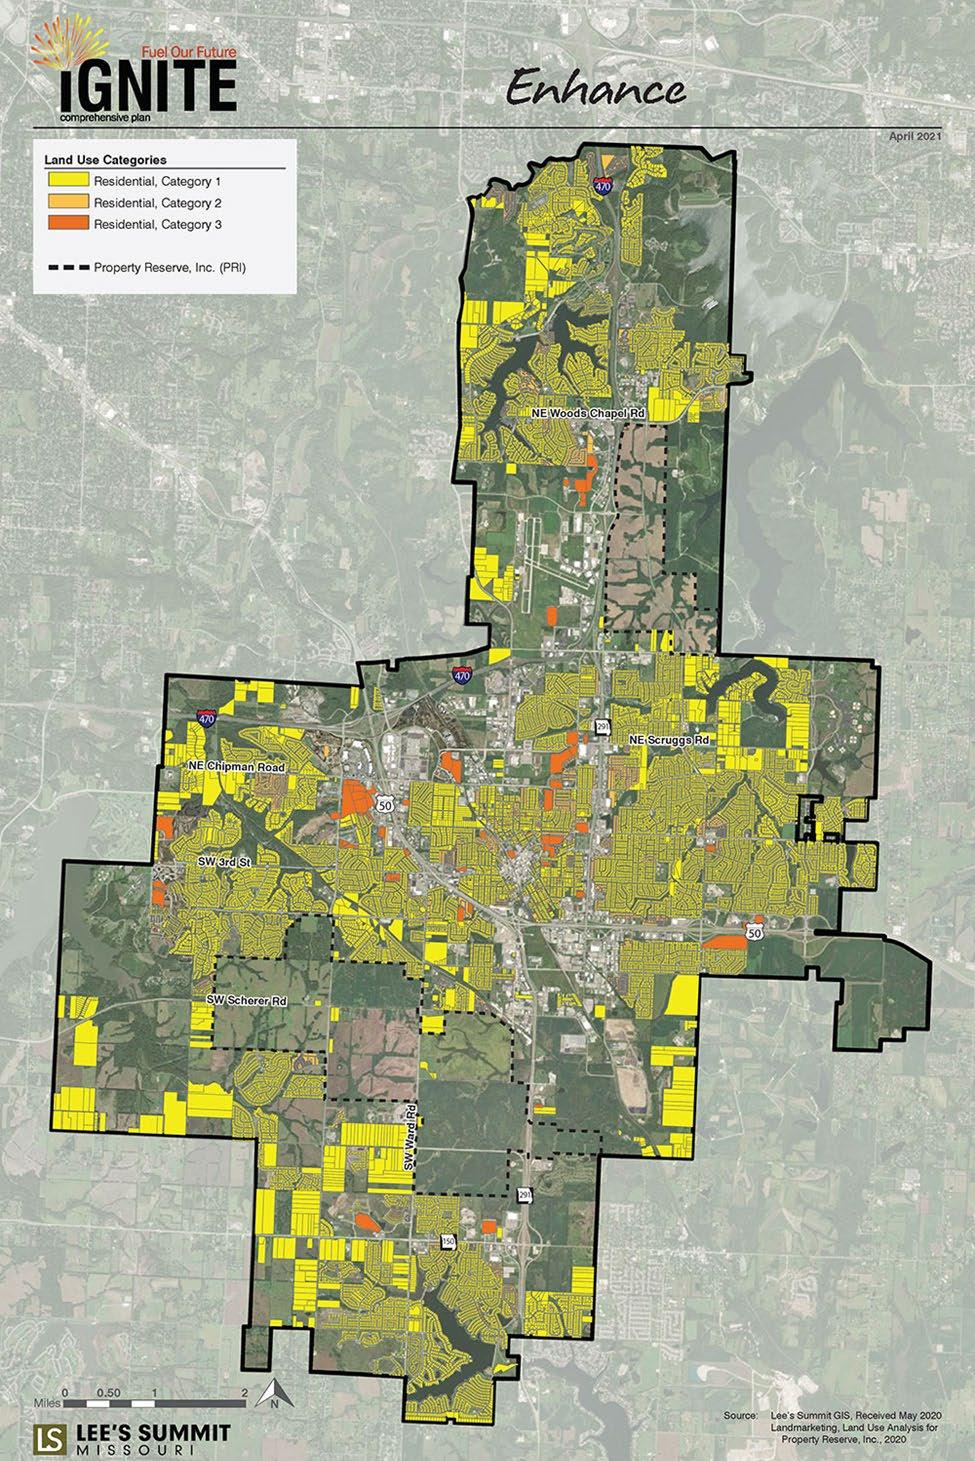
ENHANCE existing single-family neighborhoods with public infrastructure investment, connectivity improvements, and flexibility to keep the character but meet changes in market demand over the next 20 years. The map includes existing residential neighborhoods.
6: Ignite Comprehensive Plan - Strengthen
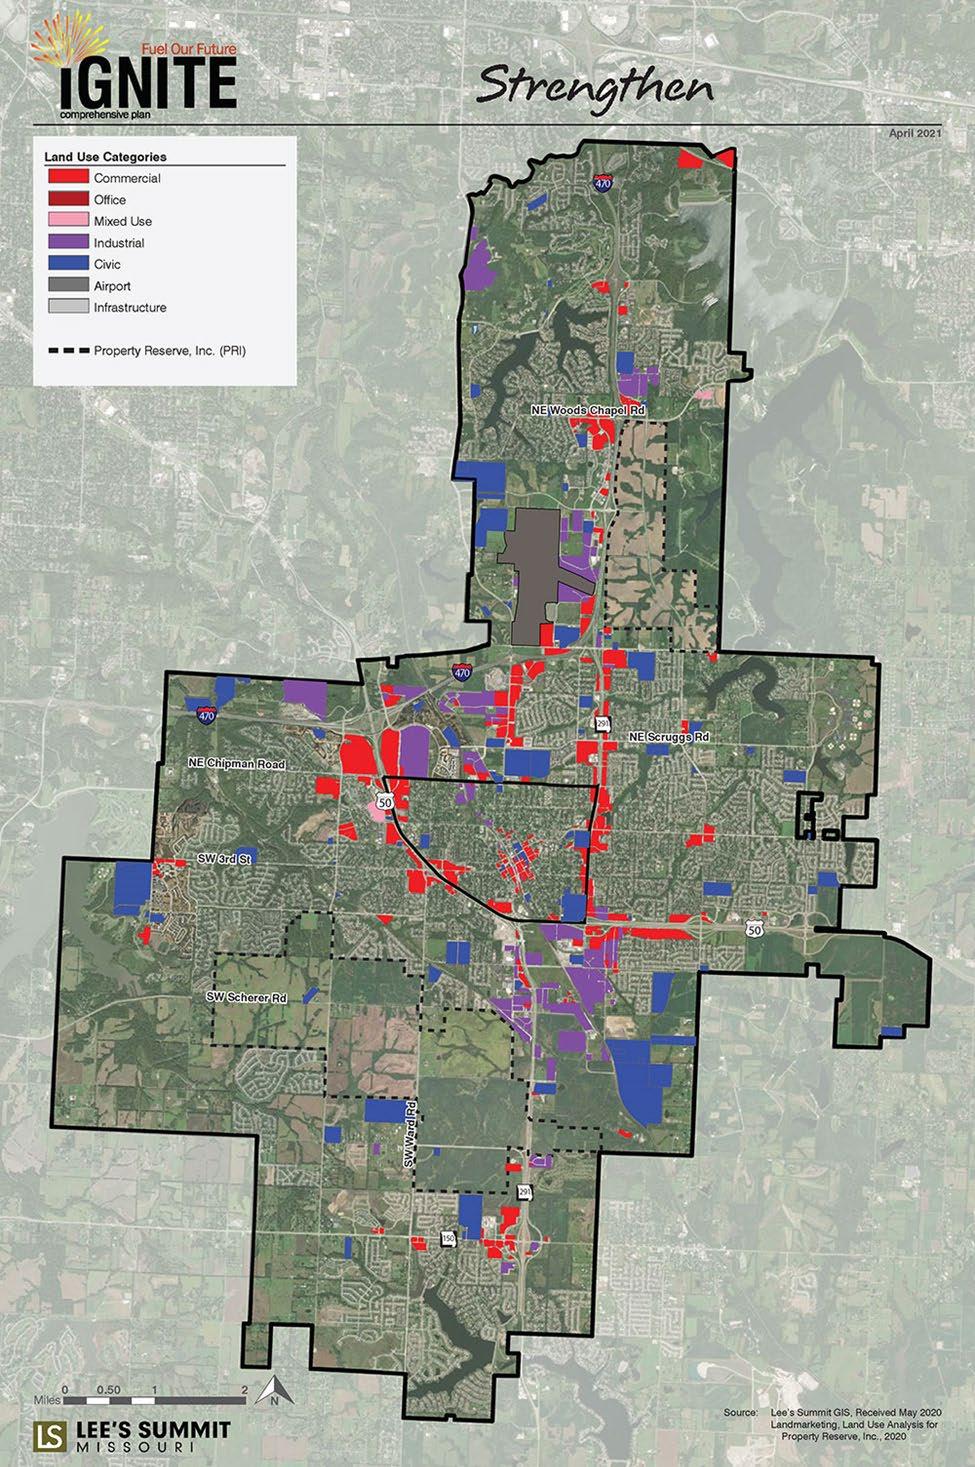
STRENGTHEN access, appearance, activity, connectivity, and resiliency of community anchors and downtown. The map includes Downtown Lee’s Summit, existing commercial nodes, existing neighborhood centers, Lee’s Summit Municipal Airport, industrial, community anchors, civic facilities, emergency service facilities, and primary/secondary education facilities.
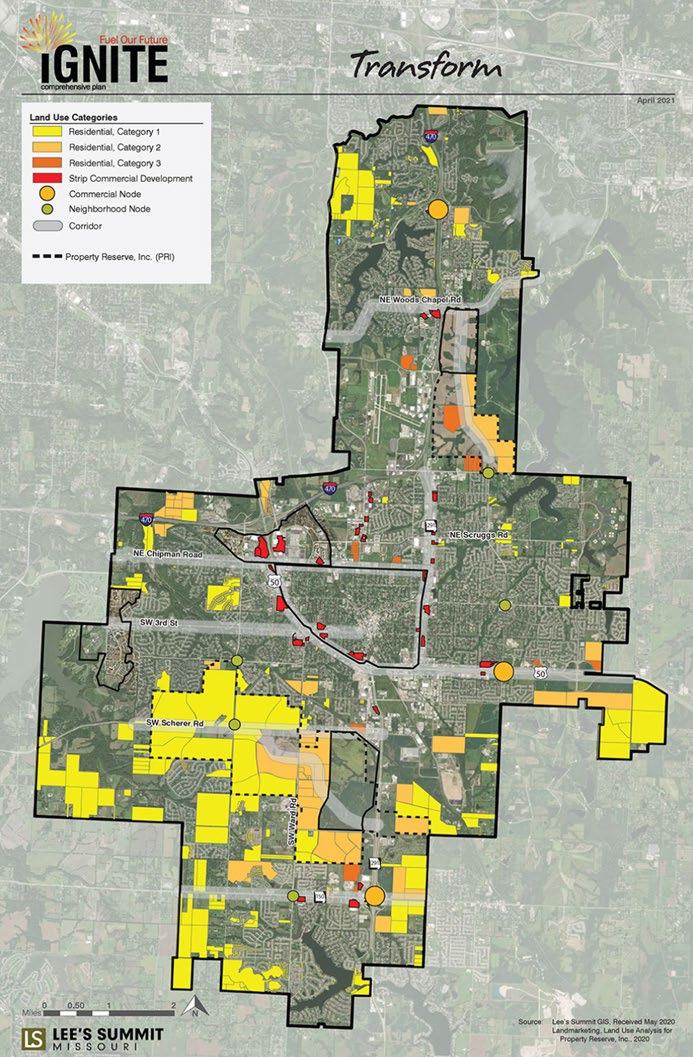
TRANSFORM and revitalize areas of the community using public improvements, incentives, and community partnerships to make them more resilient and adaptive to future change. The map includes activity centers, major corridors, new commercial nodes, Lee’s Summit Municipal Airport, existing strip commercial, community anchors, new neighborhood centers, and new residential.
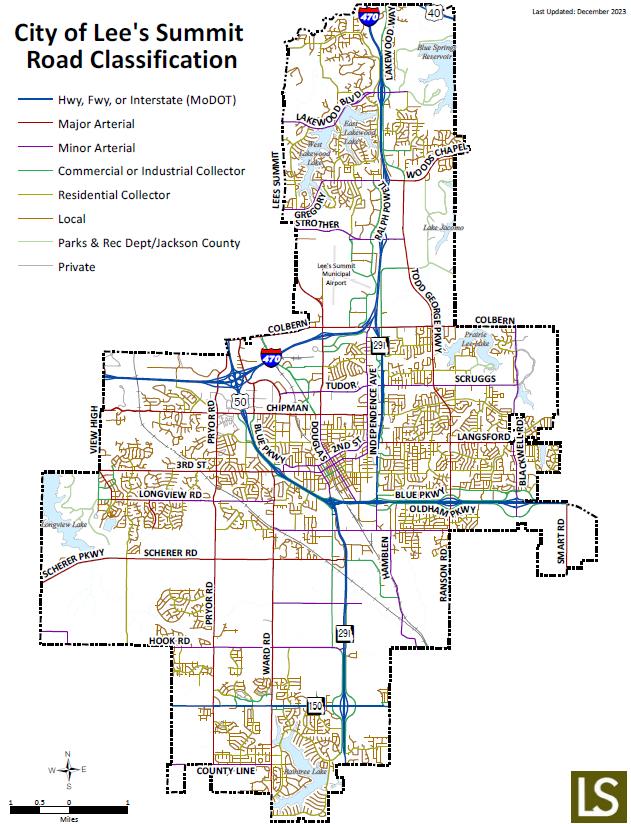
The transportation network for the City of Lee’s Summit, City of Greenwood, and Unity Village are comprised of streets/highways, runways, and railways. Lee’s Summit is intersected by six highway corridors, including I-470, US 40, US 50, M-291, M-150, and M-350. These corridors are used daily by commuters to reach destinations throughout the Kansas City metropolitan region for work and travel. These same corridors are also utilized daily by semi-tractor trailers transporting various quantities of hazardous materials throughout the region and beyond.
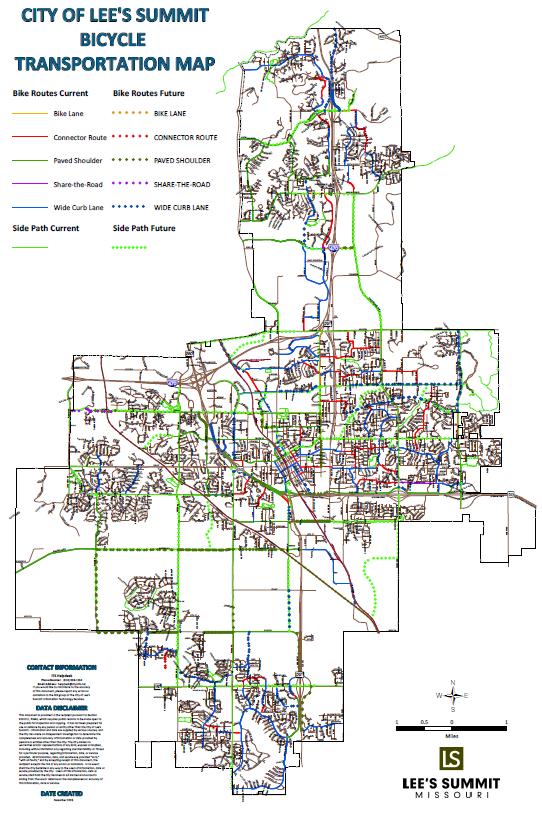
The city of Lee’s Summit currently boasts 17 miles of park trails, 39 miles of shared/mixed-use paths, and 36 miles of bike lanes/share-the-road lanes. Unity Village and Greenwood also have trail systems.
and Future
On May 11, 2018, a ribbon-cutting ceremony was held for the completion of a new interchange at US 50 and Route 291 South. Changing the old 291 overpasses into a diverging diamond design has eased traffic congestion and allows for higher traffic volumes along the heavily traveled route. In addition, the interchange is expected to increase
economic growth and expansion south of US 50. It is estimated that by the end of 2025, a similar project will be started at the east junction of the interchange of US 50 and Route 291 North.
Ingress and egress from the department service area are primarily served by maintained federal, state, and city roadways. Traffic flow and accessibility are often affected by weather conditions and rush hour traffic volume.
Lee’s Summit Municipal Airport (LXT) is located in the north-central sector of the city. The regional airport is a nontowered facility with no on-site air traffic control and is primarily utilized by smaller aircraft. As a result, the airport is not currently required to have onsite fire and rescue support. This will soon change as the airport is in the midst of an expansion project that will allow for larger aircraft. Current runways are positioned in north-south/east-west directions. Runway 18-36 is 5,501 feet long and 100 feet wide, while runway 11-29 is 4,000 feet long and 75 feet wide. The FAA has rated the runway at a 60,000-pound capacity. However, with prior permission, they can take up to a 100,000-pound aircraft. There is a 40,000-square-foot heated and enclosed hanger available, and construction of a second hanger was approved in March 2024. According to airport administrative staff, Lee’s Summit Municipal Airport experiences approximately 50,000 takeoffs/landings annually. Residential homes, businesses, and highways are located directly in the landing patterns of both runways.
Pacific in 1905. Several downtown streets were built along the northwest to the southeast direction of the track. Part of the city’s current name (Summit) is derived from the fact that the train depot is located along the highest elevation of the railway between Kansas City and St. Louis.
The line is utilized for both freight and passenger service. Freight trains ordinarily carry agricultural, automotive, chemicals, coal, industrial products, and intermodal. Amtrak provides passenger service twice daily for northbound and twice daily for southbound departures. According to Amtrak, 145,000 passengers traveled the Missouri River Runner service corridor from Kansas City to St. Louis in 2023.
Lee’s Summit had not experienced a derailment until the Spring of 2024. The derailment took place in a remote area of Unity Village. There have been train versus auto collisions at the four at-grade railroad crossing intersections in the area of service; three are cross-armed controlled, with one uncontrolled. There are business and residential corridors along the railway. Two of the four railroad crossing intersections in Lee’s Summit city limits are centrally located in the Historic Downtown Main Street core, where festivals and concerts are conducted annually. LSFD apparatus have a response option of utilizing unimpeded Second Street to avoid delays during railway crossing use and festivals in the downtown core. The two other railroad crossings are on less-traveled response routes but could pose delays encountering railway use.
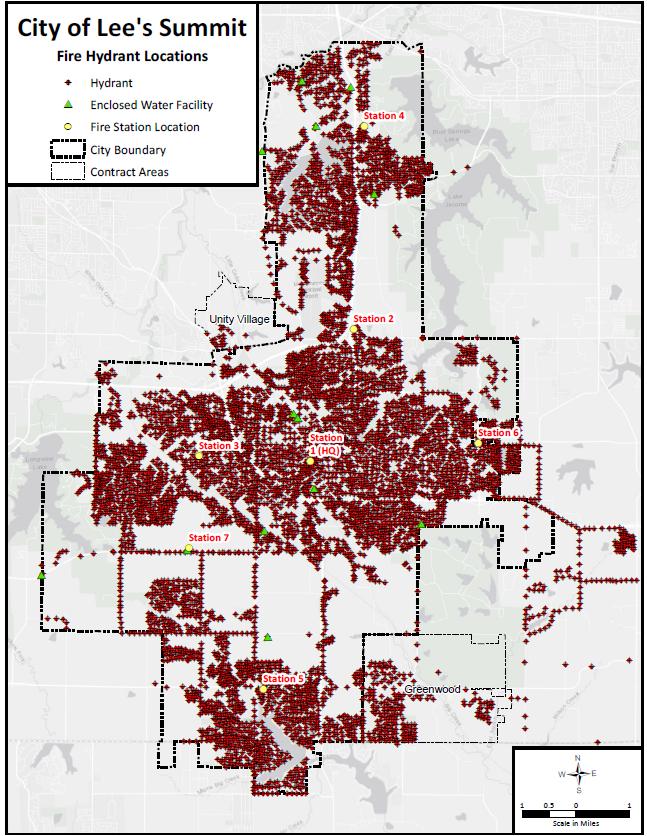
The City of Lee’s Summit is currently served by two primary water purveyors: Lee’s Summit Water Utilities (LSWU) and Public Water and Sewer District #13 (PWSD13). The LSWU and PWSD13 provide reliable water throughout the city, except for several areas along the city borders that are served by the neighboring jurisdictions, such as the City of Independence, City of Kansas City, and Cass County Public Water District #3. LSWU receives its water from two suppliers, Kansas City and the City of Independence. LSWU has a system capacity of approximately 32.5 million gallons per day and maintains over 5,300 fire hydrants in its system. They have four pumping stations, nine water towers, and storage tanks. PWSD13 covers areas of the northeast central portions of the city and receives its water from the Tri-County Water Authority. PWSD13 has a storage capacity of one million gallons. The department serves two additional areas by contract. Those areas are Unity Village and the City of Greenwood, Missouri. Unity Village is served by its own water system and has a storage capacity of 100,000 gallons. Fire hydrants within Unity Village are supplied by both Unity Village and LSWU. The City of Greenwood is served by Public Water and Sewer District #12 (PWSD12) and Cass County Water District #6 (CWD6). PWSD12 receives its water from Kansas City and the Tri-County Water Authority. PWSD12 has a storage capacity of one million gallons. LSWU has emergency interconnects to supplement all purveyors in all areas of service, including contract service areas.
The city’s MS4 Stormwater Management Plan has identified 14 sub-watersheds within the city limits. Stormwater management is overseen by the city’s public works department, and the plan is updated annually.
The City of Lee’s Summit has an extensive natural gas infrastructure serving the community that is owned and operated by Spire Energy.
Evergy owns and operates the electrical power grid for the City of Lee’s Summit. The city has three electrical substations within its jurisdictional boundaries, located on Longview Road, Tudor Road, and Blackwell Road. From those substations, the power is distributed throughout the city by overhead and underground transmission lines.
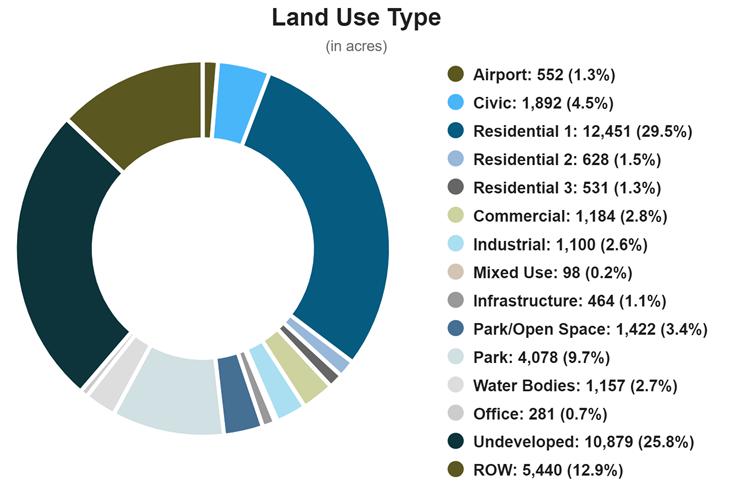
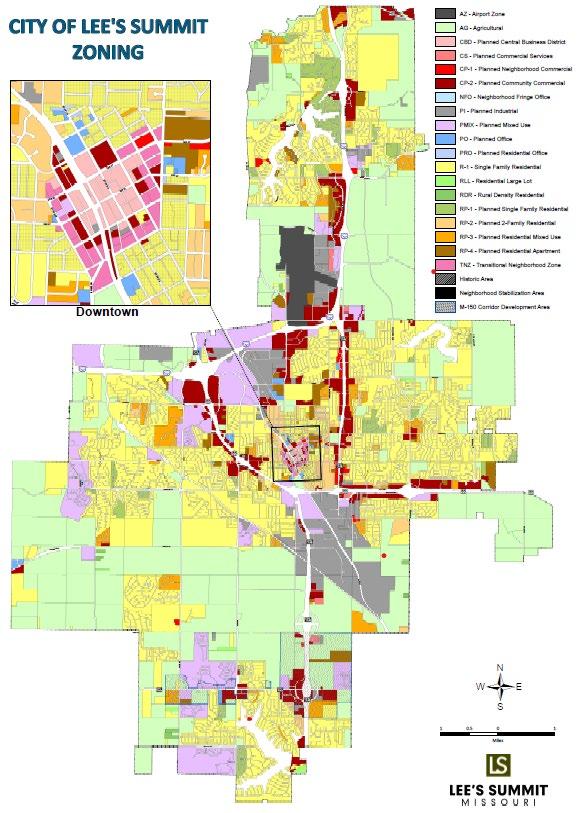
The city uses zoning areas guided by the Ignite Comprehensive Plan and adopted zoning ordinances to define land uses (such as commercial, residential, and industrial) and where they can be located to determine land use. Currently, Lee’s Summit has a ratio of approximately 74.2% developed land, with 25.8% of land remaining undeveloped. In January 2019, it was announced that two large tracks of land are coming open for development within city limits that have, up to now, been untouched open spaces. The 4,100 acres are owned by Property Reserve Inc. (PRI), and planning has begun between city leaders and PRI towards the development of these land holdings in the near future.
Lee’s Summit has historically been considered a bedroom community, with people choosing to live here but work elsewhere. Specific to land use by types: 32.3% is dedicated to some residential living, and 6.3% is used for commercial, office, mixed-use, or industrial. The remaining 61.4% is made up of parkland, government holdings, right of ways, and undeveloped land. In recent years, there has been an increase in commercial building construction, which indicates that the city is transitioning from a bedroom community to one where people choose to live, work, raise families, and seek entertainment opportunities.
The city has adopted an Economic Development Incentive Policy supporting the Economic Development Vision outlined by the city council. This policy provides information on the type and availability of incentive programs as well as targeted economic development outcomes and geographic areas. The city is prepared to strategically and responsibly consider the use of incentive programs to meet the economic development goals and outcomes in support of this vision.
At an elevation of 1,040 feet, the City of Lee’s Summit is one of the highest points between St. Louis and Kansas City in the state. With this elevation come slight rolling hills as well as flat and low-lying areas. During periods of heavy rain, some of these low areas are prone to swift water and flooding. The city is home to four county lakes and two private lake communities. There are several creeks and ponds scattered throughout the city as well. In total, 2.7% of the city is covered by water.
Lee’s Summit is located southeast of the Kansas City Metro in northwestern Missouri. After 28 land annexations, Lee’s Summit currently consists of 65.87 miles, including 1,157 acres of water. Lee’s Summit is bordered by the Missouri cities of Independence to the north, Unity Village to the northwest, Kansas City to the west, Raymore to the southwest, Greenwood to the southeast, and primarily unincorporated areas to the east.
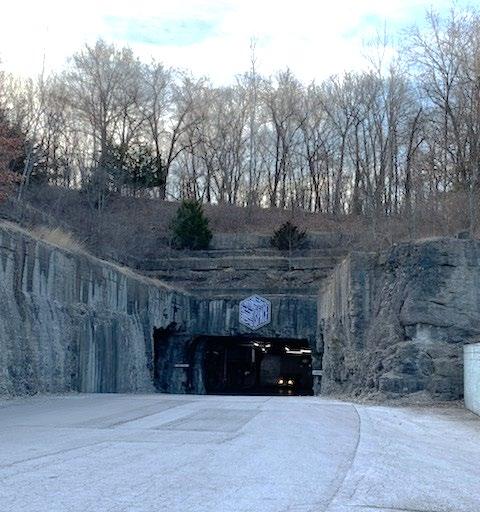
Located in the rolling hills of northwestern Missouri, Lee’s Summit is situated in the stable crustal platform of the midcontinent region. The region is tectonically stable, so earthquakes are rare. Interbedded limestone and shale are typical of the bedrock formation in Lee’s Summit, which provides a strong foundation for the building construction in the region. The subsurface rocks of the region are consolidated limestone, sandstone, and shale. The thick limestone beds of the region provide valuable resources for building materials like cut stone, crushed aggregate, and cement, much of which is mined in several large quarries surrounding Lee’s Summit. A former underground mined cave, which is now utilized for 1.5 million square feet of subterranean warehouse rental space, is in the northern part of the city.
The Missouri Department of Natural Resources has divided the state into three physiographic regions: Interior Plains – Central Lowlands, Interior Highlands – Ozark Plateau, and Atlantic Plain – Coastal Plain Lee’s Summit is in the Osage Plains within the Interior Plains – Central Lowlands region. What used to be woody vegetation and prairies in Lee’s Summit have developed into residential and business lands. Residential developments consist mostly of transplanted trees and lawn grass conducive to the region. It is not uncommon for residential neighborhoods to be located adjacent to agricultural farms and livestock properties. The undeveloped sections consist of approximately 17 miles of park trails, pockets of native trees, native grasslands, and agriculture. Large portions of Lee’s Summit are still
dedicated to farming due to fertile soil, predictable growing cycles, and climate zones. Approximately 242 acres are zoned for agricultural use. Also, Lee’s Summit has approximately 6,500 acres of land owned by Property Reserve Inc. (PRI) that are still used for agricultural purposes and are slated to be developed in the coming years.
Lee’s Summit, Missouri, is in the Midwest, which is classified as a humid continental climate according to the Koppen climate classification. Lee's Summit has a temperate climate that experiences all four seasons: the summers are hot and muggy; the winters are cold and windy, and there is year-round precipitation.
Table 1: Climate Data
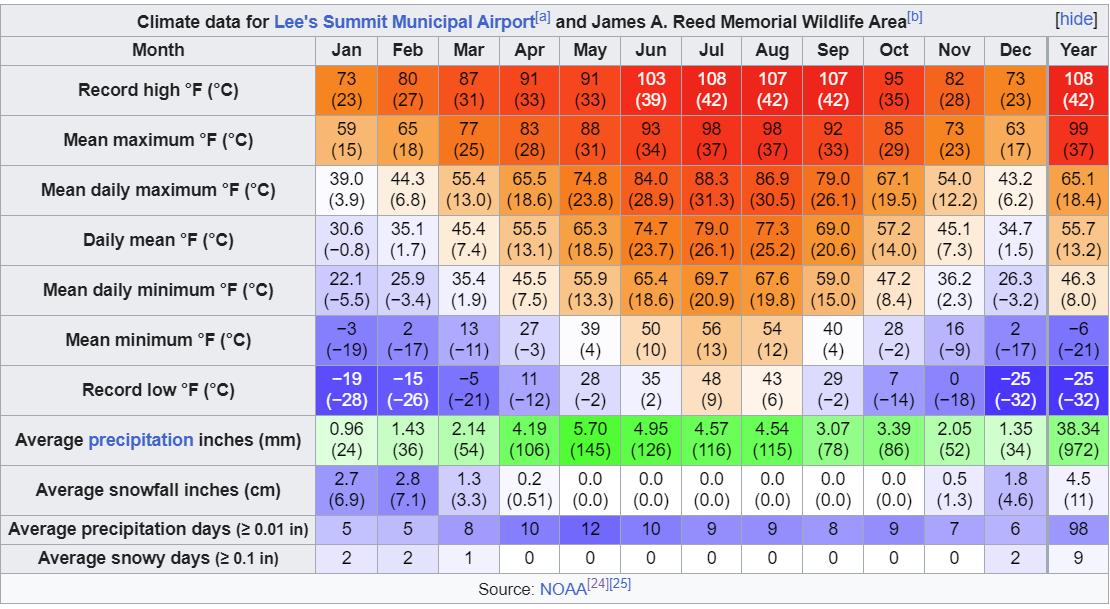
Similar to much of the Midwest, Lee’s Summit is subject to extreme weather. Drought conditions are common during the summer, as well as periods of excessive heat and humidity. The Emergency Management Plan includes a collaborative agreement with Lee’s Summit Parks and Recreation and the Mid-Continent Library system to operate as “cooling centers” during excessive heat warnings. Winter precipitation is common in the area, with sleet, freezing rain, and snow or a combination of the three during a single event. Mainly during the spring, powerful thunderstorms and flash floods affect the area. In the past ten years, the city has been impacted by three tornados ranging in strength from EF0 to EF1 on the Enhanced Fujita scale.
The length of daylight varies greatly throughout the year in this area. The most daylight occurs on June 22 at 14:43 hours, compared to the shortest being on December 21 at 09:16 hours.
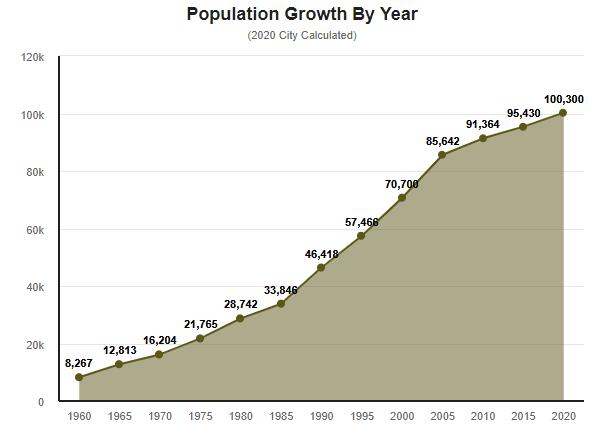
In 2023, the population of Lee’s Summit was 106,031; this is a population increase of 7.67% since 2019. This ranks Lee’s Summit as the sixth largest city in the state of Missouri. The City of Lee’s Summit stretches over 65.87 square miles, making its population density 1,609 people per square mile. The city, divided into four distinct Council districts, has different characteristics in population demographics and each is represented by two elected officials.

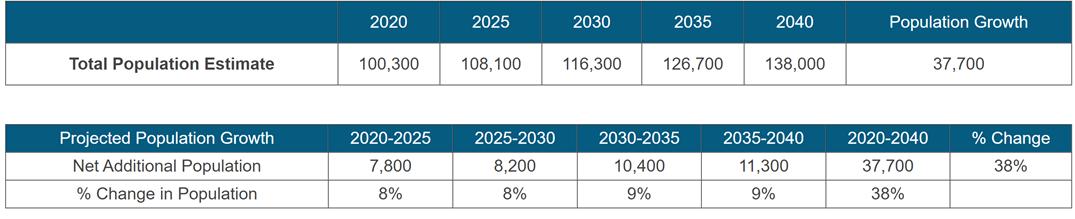
Like many urban communities across the United States, Lee’s Summit began to experience its transformation from a rural, mostly agrarian community to an urban community in the decades after the Second World War. As the city grew, its population nearly doubled every decade. In 1980, the population was approximately 28,000. By 1990, the population had reached 46,500. From 1990 to 2000, the city experienced a 53% increase in population and another 29% increase from 2000 to 2010. Today, the population is estimated at 106,031.
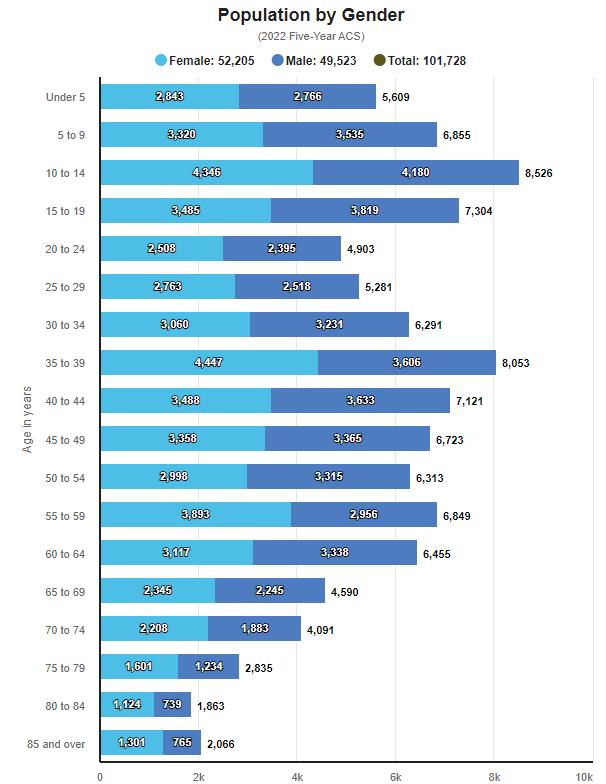
Taking a closer look at the data indicates the City of Lee’s Summit is 51.32% female and 48.68% male. The city has a largely diversified age population. The smallest age groups are those 80 years of age and older, with the largest population in the city being those aged 10 to 14. This demographic distribution provides valuable information related to risk assessments and emergency service trends for the department and the elected officials relative to planning.
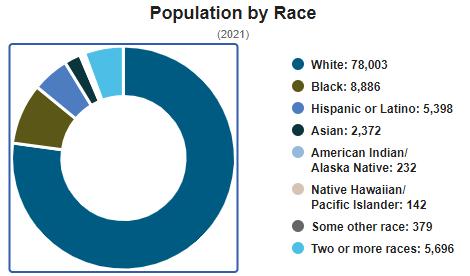
Lee’s Summit continues to diversify its population. The city can be broken down as follows: 76.6% white, 8.73% black, 2.33% Asian, 2.33% Hispanic/Latino, 5.30% Native Hawaiian, 0.13% American Indian/Alaska Native, 0.22% some other race category, 0.37% and 5.59% were two or more races. Comparatively, this signifies a small change since 2010. Some of the noticeable differences are that the white population has decreased by 9.56%, and all other demographics have increased. If Lee’s Summit continues to follow the trends of the rest of the nation, in the next 20 years, the population of Lee’s Summit will be vastly different and continue to diversify.
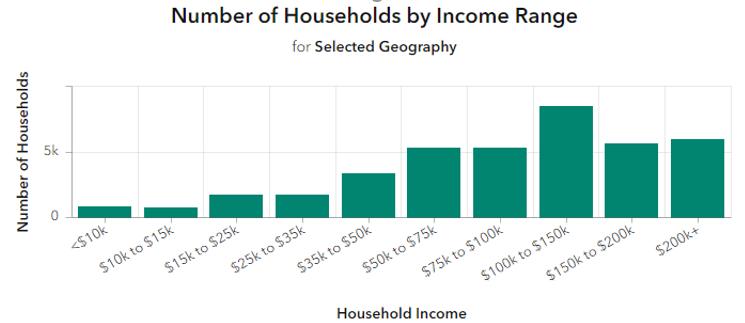
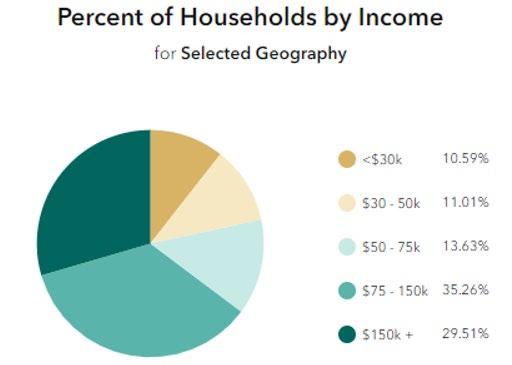
Lee’s Summit has one of the higher median household incomes in the Mid-America Regional Council (MARC) region. Lee’s Summit has an average median household income of $102,695 when compared to the MARC regional average of $70,097. Not only does the city have a higher median household income, but it also has a lower housing vacancy rate of 4.72% versus the MARC vacant housing rate of 7.21%. Lee’s Summit has a higher percentage of homeowners at 72.76% versus 22.52% who rent. All these factors are positive correlators when measured against community risk for Lee’s Summit.
The Lee’s Summit Fire Department (LSFD) was established by the city founders in 1875 as a volunteer fire department. The equipment, a four-person pump, was pulled by firefighters or horses and was housed in City Hall beside the jail. This initiated pumping operations and formed a “bucket brigade” to combat fires from strategically placed cisterns in the downtown district.
In 1885, a downtown fire devastated the largest part of the Lee’s Summit’s business district, which prompted the city to invest in a larger, six-man pump for superior firefighting capabilities. In 1909, another downtown fire erupted. Unfortunately, the city-owned pump failed, leaving firefighters unable to halt the fire’s spread. Kansas City Fire eventually extinguished it after three and a half hours.
The evolution of the LSFD milestones continued with acquiring its first gasoline internal combustion fire engine in 1924 and then purchasing a 1951 Howe Fire Truck. In marking significant growth, in 1960, the department transitioned from a volunteer force to a paid one.
Further expansions, station openings, and equipment upgrades followed. This included the integration of Emergency Medical Services (EMS) in 1971, pioneering a modern concept adopted by many departments.
The department has experienced a wide range of events, from a tragic loss in 1999 to achieving accreditation and reaccreditation. In recent years, LSFD has seen extensive growth and modernization with new facilities and equipment acquisitions to enhance capabilities.
Today, as the department plans new facilities and continues to grow, it stands as a testament to its dedication to serving and protecting the community. Amidst challenges and milestones, the department remains committed to its mission: The Lee’s Summit Fire Department is dedicated to serving its community through prevention, preparedness, and response with PRIDE. The values of the Lee’s Summit Fire Department are Professionalism, Respect, Integrity, Duty, and Excellence.
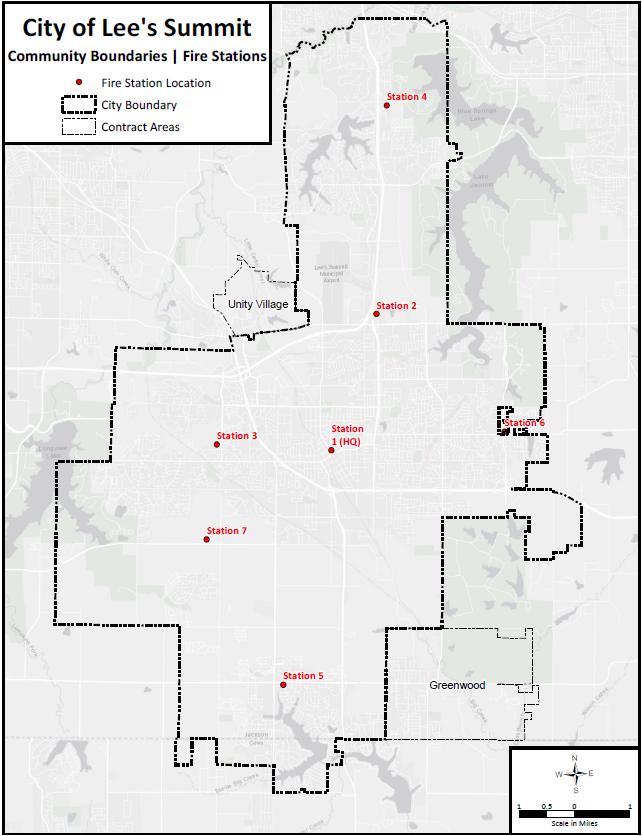
The legal boundary of the service area for the department is contained within the jurisdictional city limits of the city of Lee’s Summit as established by city ordinance, as well as the contractual legal obligation to provide all hazard response to the cities of Unity Village and Greenwood, Missouri. The department is under the Western Missouri Fire Chiefs Association Mutual Aid agreements.
Map 13: Community Boundaries and Fire Stations
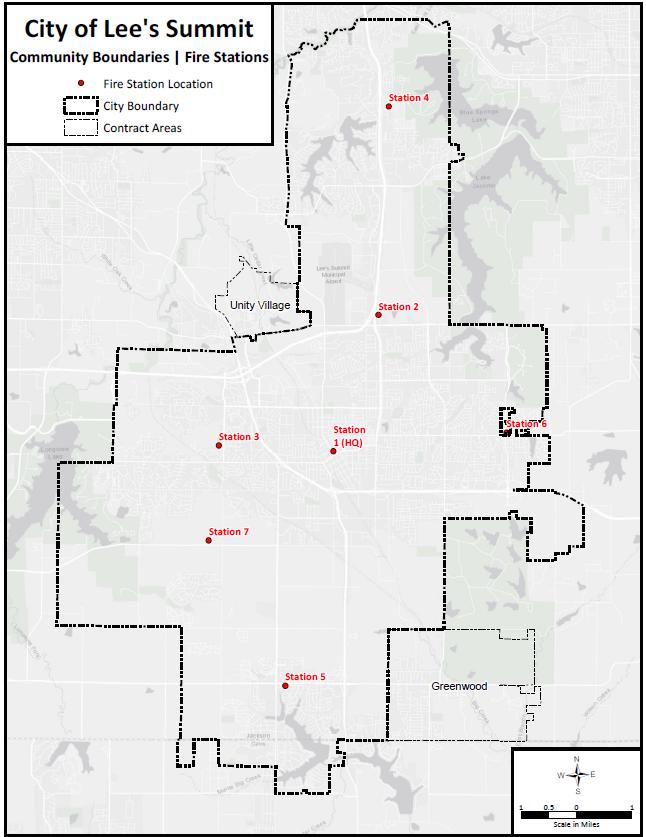
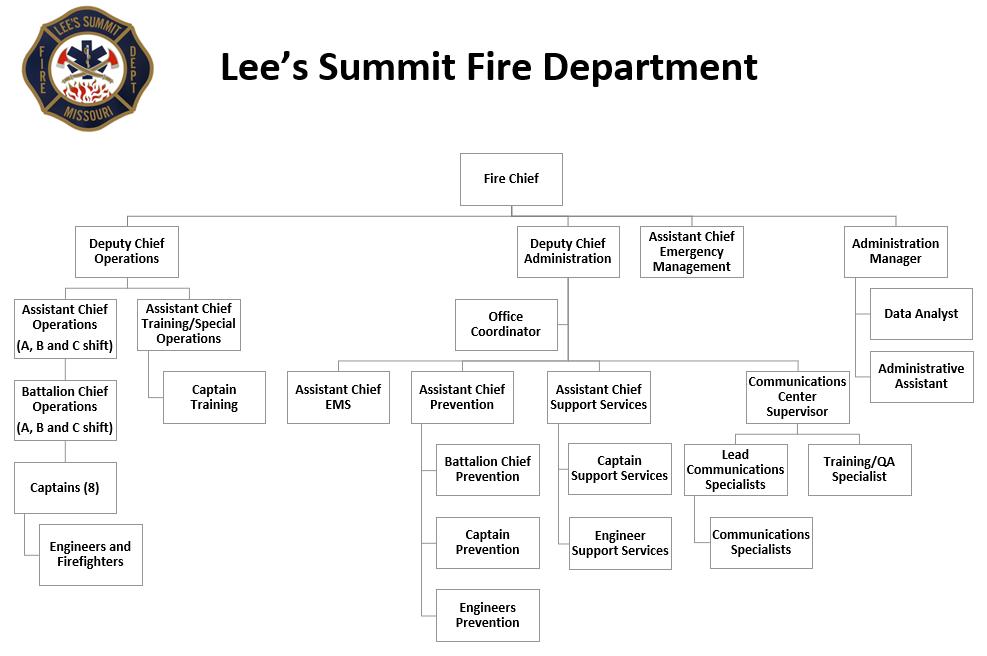
Figure 9: Organizational Chart
The department consists of eight divisions: Administration, Emergency Services (Operations), Training, EMS, Emergency Management, Communications Center, Support Services and Fire Prevention. The fire department is overseen by the fire chief.
The Administration Division, overseen by a deputy chief, is comprised of an administration manager, an administrative assistant, and an office coordinator to fulfill the administrative functions of the department. The approved department budget for FY25 includes an expansion position for a data analyst. Project management, budget formulation, record retention, data analysis, and accreditation are the responsibilities of this division.
The Emergency Services (Operations) Division is overseen by a deputy chief with an assistant chief and battalion chief for each shift. Fire station operations have been structured on a three-shift (A, B, and C) system, with a shift change at 0800. Each shift works 48 hours of continuous duty followed by 96 hours off.
The department staffs seven fire stations and 15 frontline emergency response apparatus, with all fire suppression apparatus overseen by a company officer at the fire captain or acting-captain rank. Department-wide operational staffing consists of 24 fire captains and 126 engineers and firefighters. The operations division is responsible for emergency medical services, fire suppression, rescue, and mitigation of both natural and human-caused disasters. Operations personnel also provide a wide range of services to the community through business inspections, public education, and station and apparatus tours. All members of operations have been trained to, at minimum, the awareness and operations level for hazardous materials and technical rescue.
The Training Division, overseen by an assistant chief and captain, provides initial and in-service training in all nonEMS-related areas of service provided by the department. The training division is supported by department members with Fire Instructor I certifications who act as recruit academy drill masters and apparatus certification instructors.
The EMS Division, overseen by an assistant chief, provides initial and in-service training in all EMS-related areas of service and coordinates all facets of EMS service within the department. This division is also supported by members of the department to deliver training to personnel and a contracted Medical Director. Additional annual training required for Advanced Life Support (ALS) and Basic Life Support (BLS) recertification is also performed by the division.
The Emergency Management Division, overseen by an assistant chief, coordinates the daily activities of emergency response for the department as well as the city as a whole. The fire chief serves as the City’s Emergency Management Director. This division is also involved with regional committees and coordination of Statewide Region A deployments.
The Communications Center is overseen by a communications supervisor, with 16 communications specialists working 12-hour shifts. The Communications Center has four lead communications specialists who have a different level of responsibility than a communications specialist. The approved department budget for FY25 includes an expansion position for a training/quality assurance specialist and two additional communications specialist positions. The center provides dispatching services to four contract agencies in addition to Lee’s Summit and is in fire headquarters.
The Support Services Division, overseen by an assistant chief, has a captain and fire engineer. Facility construction, facility repair, station supply delivery and apparatus procurement, and maintenance are the responsibility of the members of this division.
The Fire Prevention Division, overseen by an assistant chief, has a battalion chief, a captain, and three engineers (working 24-hour shifts) providing support. Community risk reduction coordination is the responsibility of the division, including plan review, business and sprinkler inspections, public education, and station tours.
There are currently seven fire stations strategically located within the city which are also utilized for primary response to Greenwood and Unity Village through contractual agreements. Deployed from the seven stations are five pumpers, three ladder trucks, and seven med units, which are all staffed 24 hours a day. All frontline apparatus is ALS-equipped, and all med units are ALS-staffed each day. In 2019, automatic vehicle location (AVL) was implemented, and apparatus are assigned to incidents based upon closest unit response (CUR). Analyzing data, such as total response time and effective response force, based on CUR and typical response areas for each station will aid in future decisionmaking as it pertains to future station/apparatus additions, apparatus placement, and staffing.
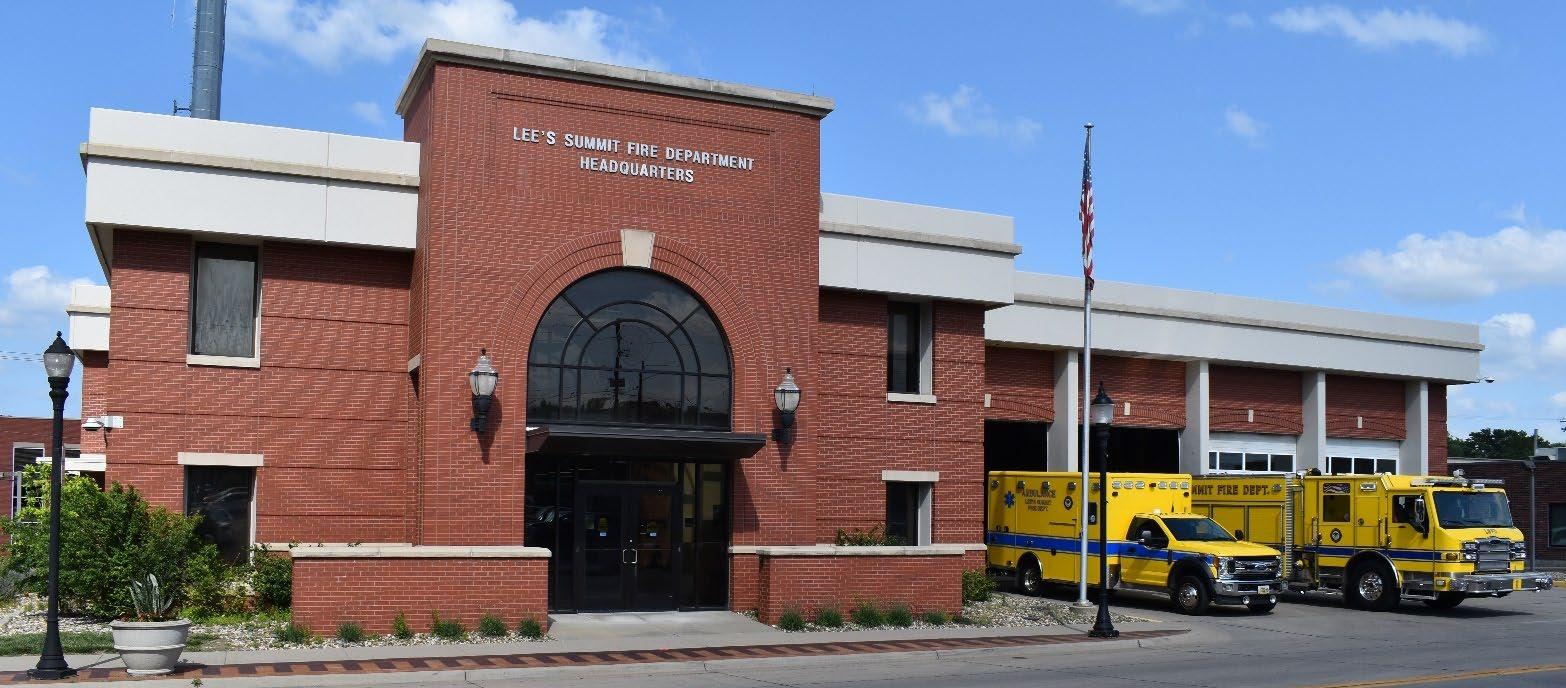
Fire Headquarters (Station 1) is located at 207 SE Douglas Street and was dedicated in October 1975. Pumper 1, Med 1, and the on-duty prevention engineer deploy from this station. Boat 1 is also located here and is cross-staffed as needed. The department’s administration, fire prevention, and communications center, and multiple reserve apparatus are also housed at this station. Fire Headquarters is staffed by a minimum of five personnel.
This district is in the heart of downtown Lee’s Summit. This diverse district consists of a historical downtown, elementary and high schools, historic residential housing, high-density apartments, a passenger, and freight railroad that bisects downtown, commercial shops, and industrial areas and is bordered by three highways.
During 2024, work began on the construction planning for building a new Station 1 and a new Joint Operations Center. The Joint Operations Center facility will house both the Fire and Police Communications Centers, Fire administration staff, and additional city staff.
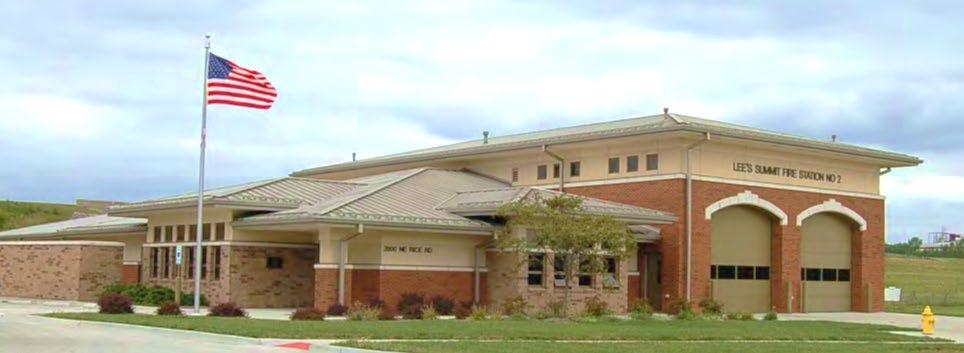
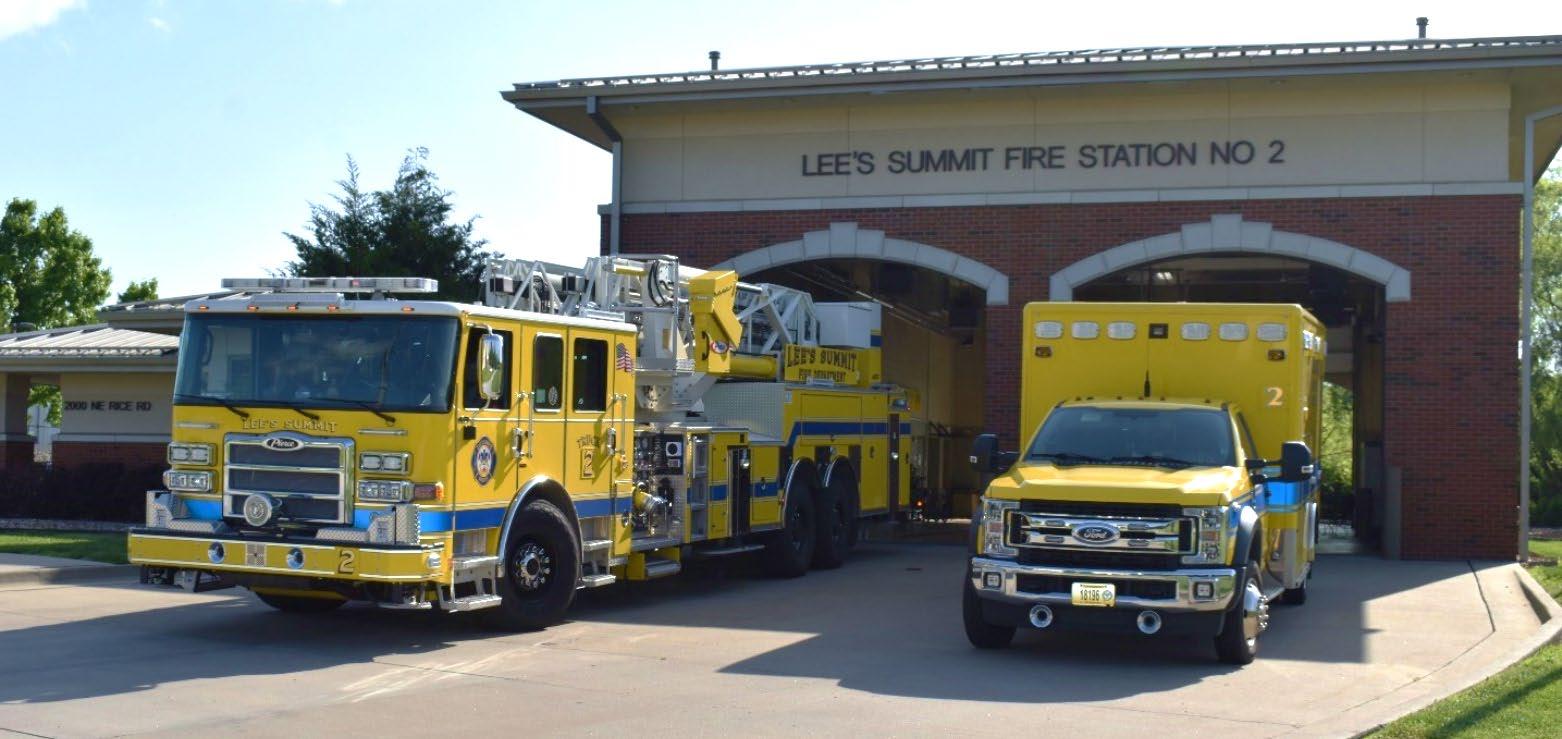
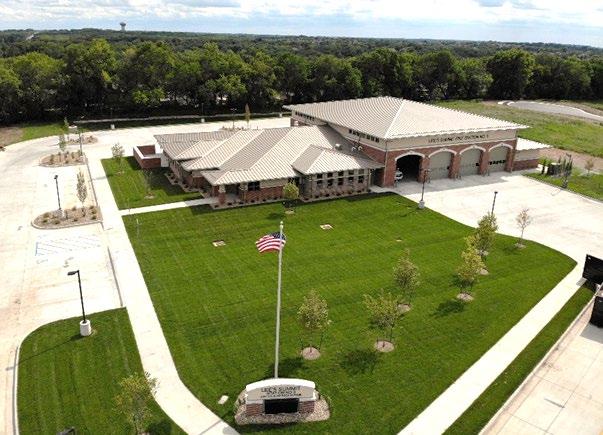
Station 2 is located at 2000 NE Rice Road and was dedicated in July 2011. Truck 2 (a 100-foot platform ladder truck), Med 2, and an Operations Battalion Chief all deploy from this station. Station 2 is staffed by a minimum of six personnel.
This district is in the northern portion of the city with elementary and middle schools, lakes and woodland areas, residential and senior living housing, an airport, and two highways located near commercial and industrial areas. District 2 also protects a contract city with a large religious organization campus called Unity Village.
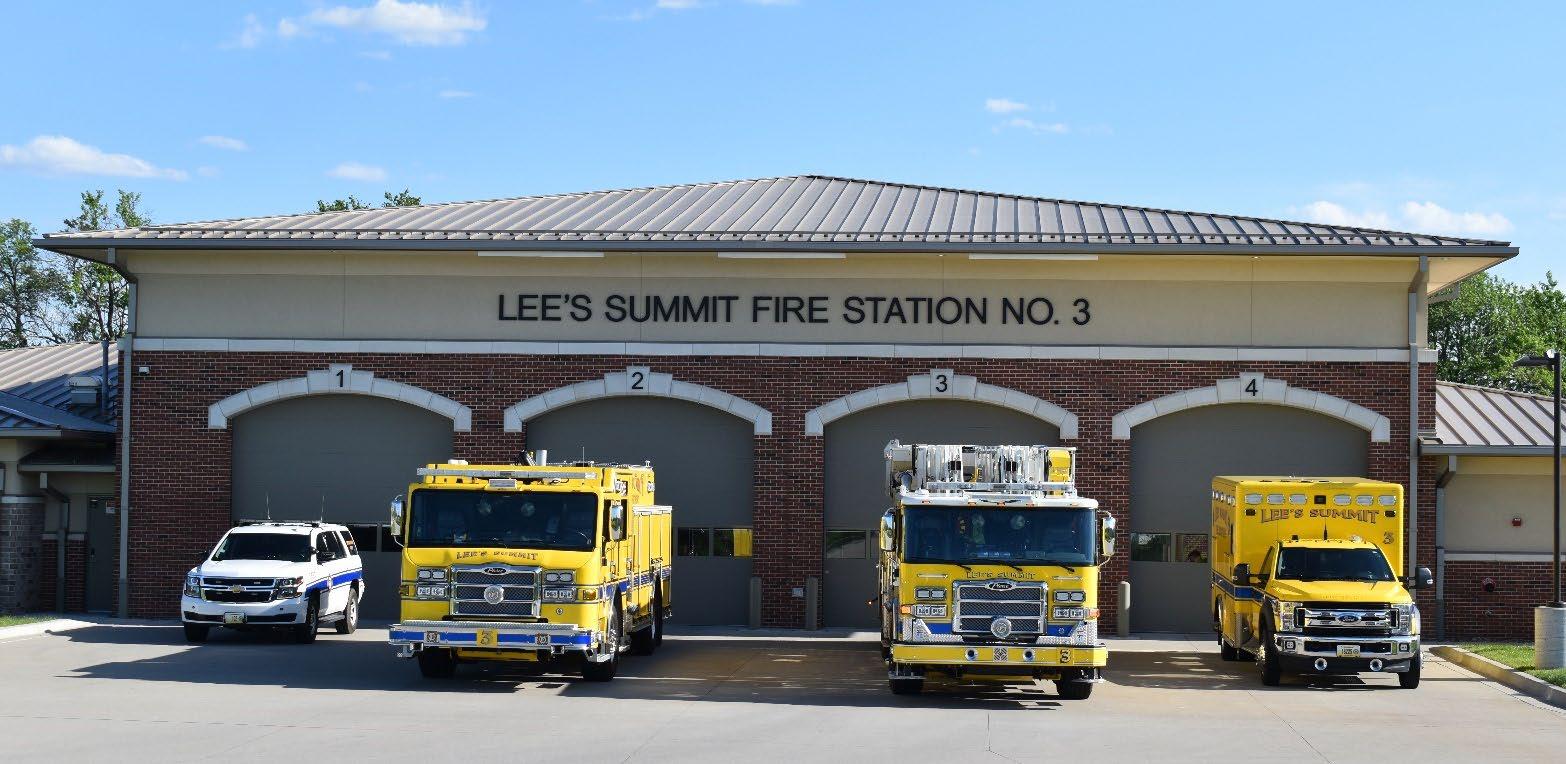
Station 3 is located at 2023 NW Shamrock Avenue and was dedicated in August of 2020. It houses Pumper 3, Med 3, Truck 3 (a 100-foot platform ladder truck), and an Operations Assistant Chief. Squad 1 is housed at this station and is cross-staffed as needed. Station 3 is staffed by a minimum of nine personnel.
This district is in the city’s core on the western boundary. It consists of a 300-acre senior living complex, elementary and middle school, singlefamily residential, high-density apartments, a large commercial district, and two highways.

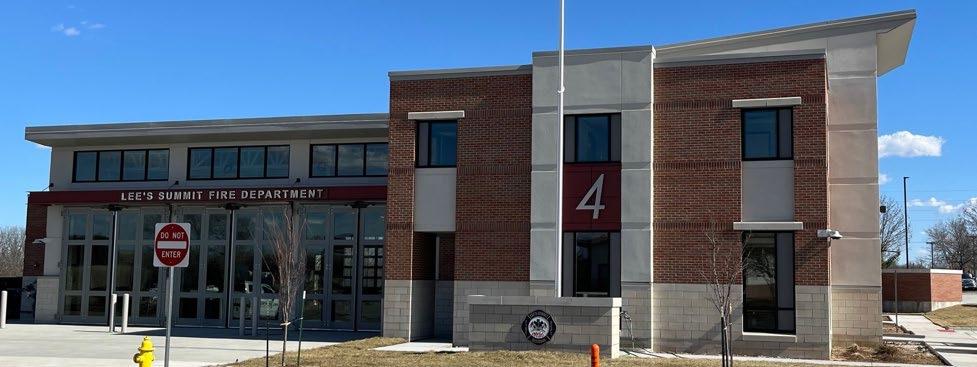
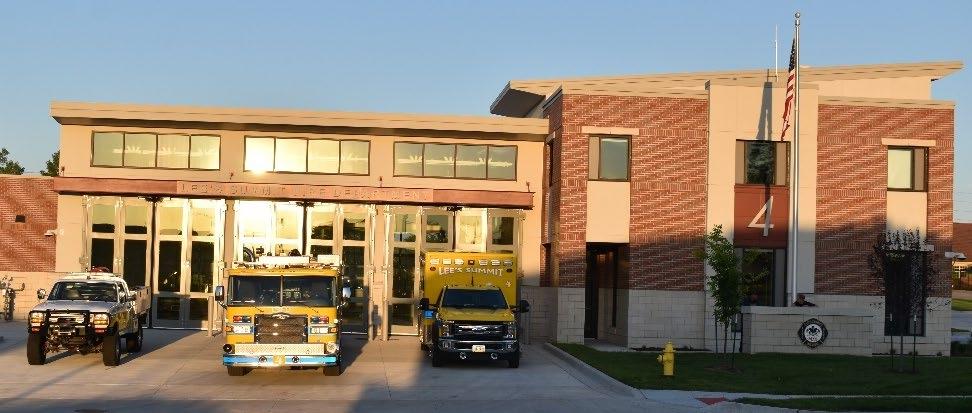
Station 4 is located at 5031 NE Lakewood Way and was dedicated in April of 2024. Pumper 4 and Med 4 deploy from this station. Grass 4, a cross-staffed vehicle, is also located here. Squad 4 is an unstaffed asset that is housed inside the subterranean warehouse space (Space Center) located in that district. Station 4 is staffed by a minimum of five personnel.
This district is on the northern boundary of Lee’s Summit. It protects a large senior living complex, single-family residential housing, several large lakes, elementary, middle, and high schools, the airport, a 1.5 million square foot subterranean complex, and a major highway.
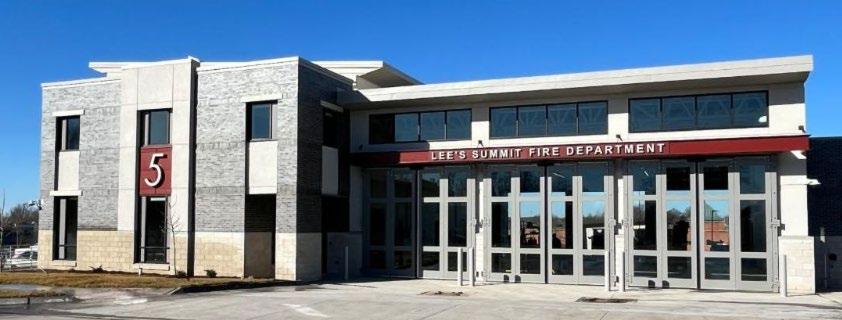
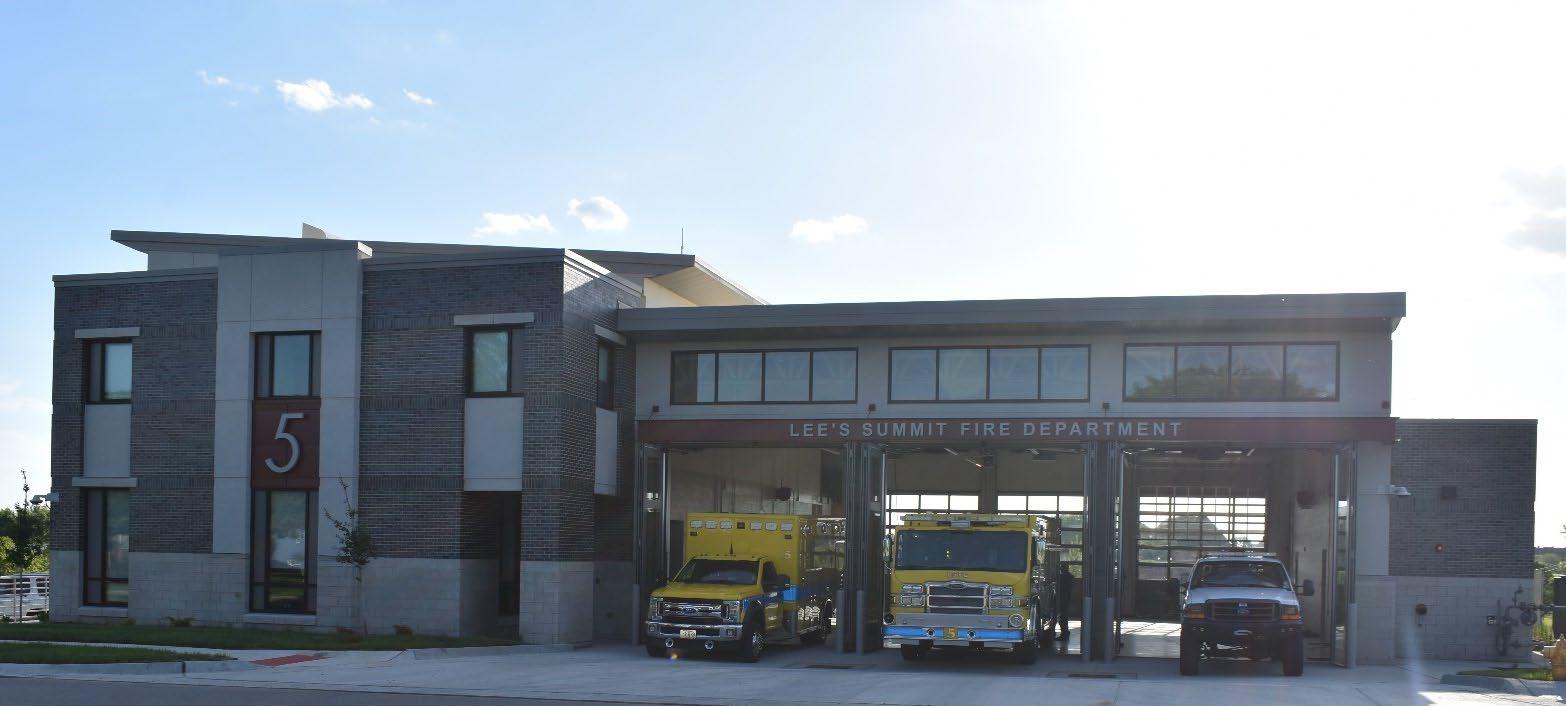
Station 5 is located at 801 SW M 150 Highway and was dedicated in March of 2024. Pumper 5 and Med 5 deploy out of this station. Grass 5, a cross-staffed vehicle, is also located here. A second cross-staffed boat is on order and will deploy from this station. Station 5 is staffed by a minimum of five personnel.
This district protects single-family residential and high-density apartments, commercial centers, lakes, elementary, middle, and high schools, as well as two highways and the contract area of Greenwood.
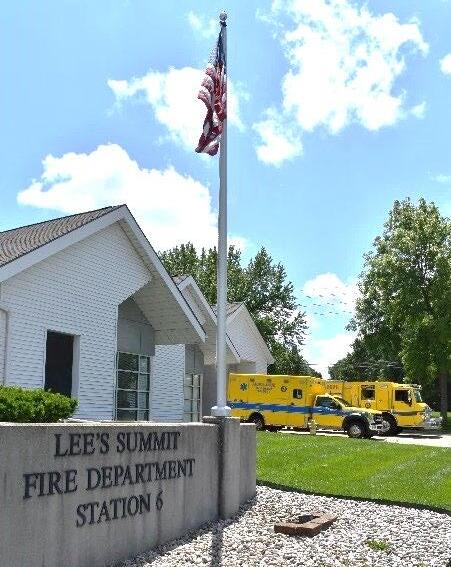
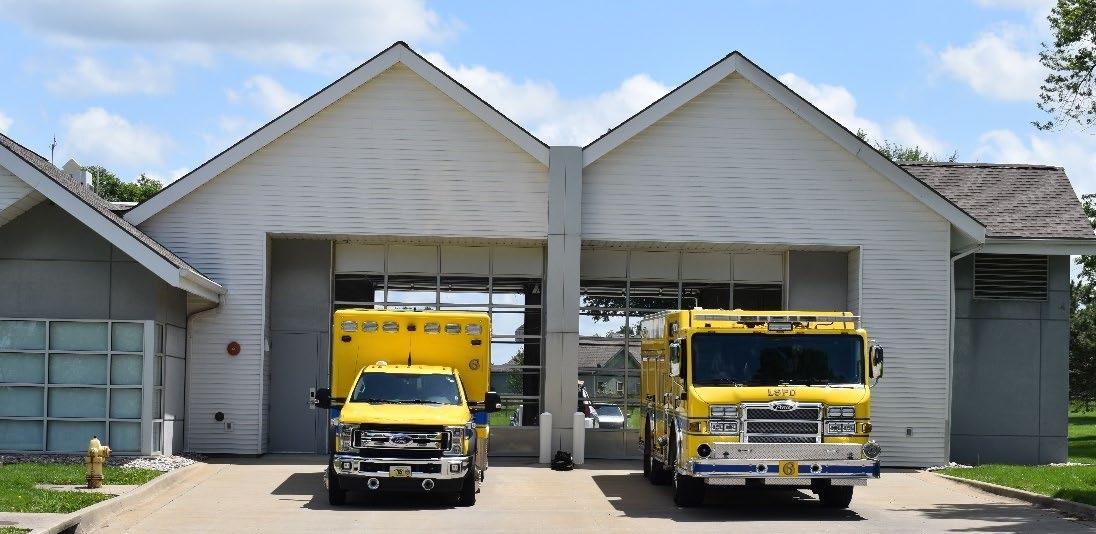
Station 6 is located at 101 NE Blackwell Road and was dedicated in April 1998. Pumper 6 and Med 6 deploy out of this station. Station 6 is staffed by a minimum of five personnel.
This district is located on the eastern boundary of Lee’s Summit. It protects single-family residential, an elementary school, a senior living complex, lakes, and a large city park system, as well as a highway.

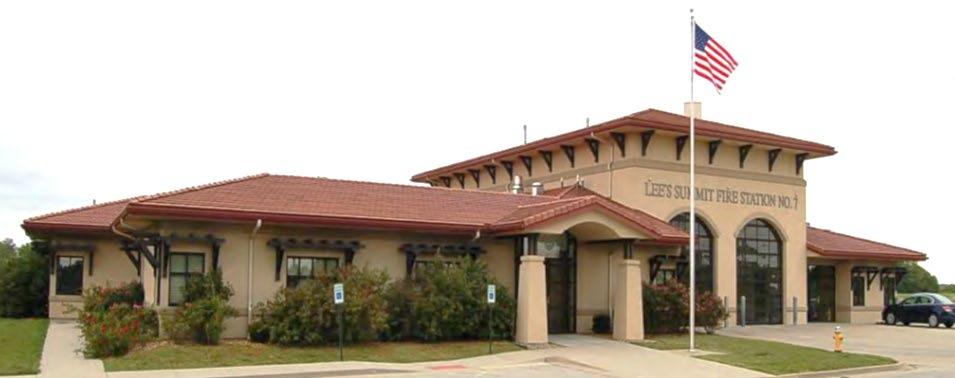
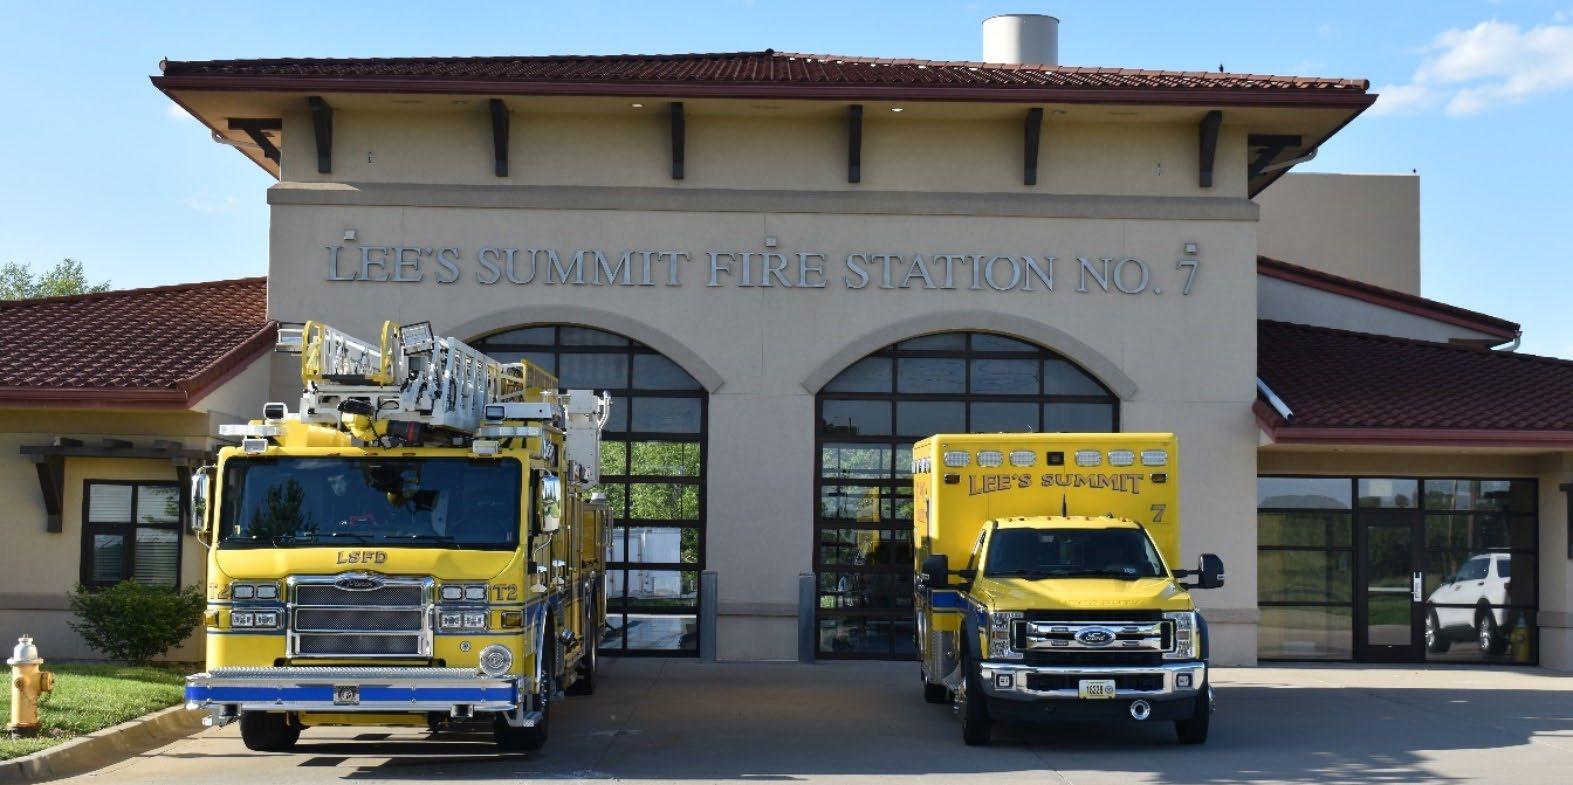
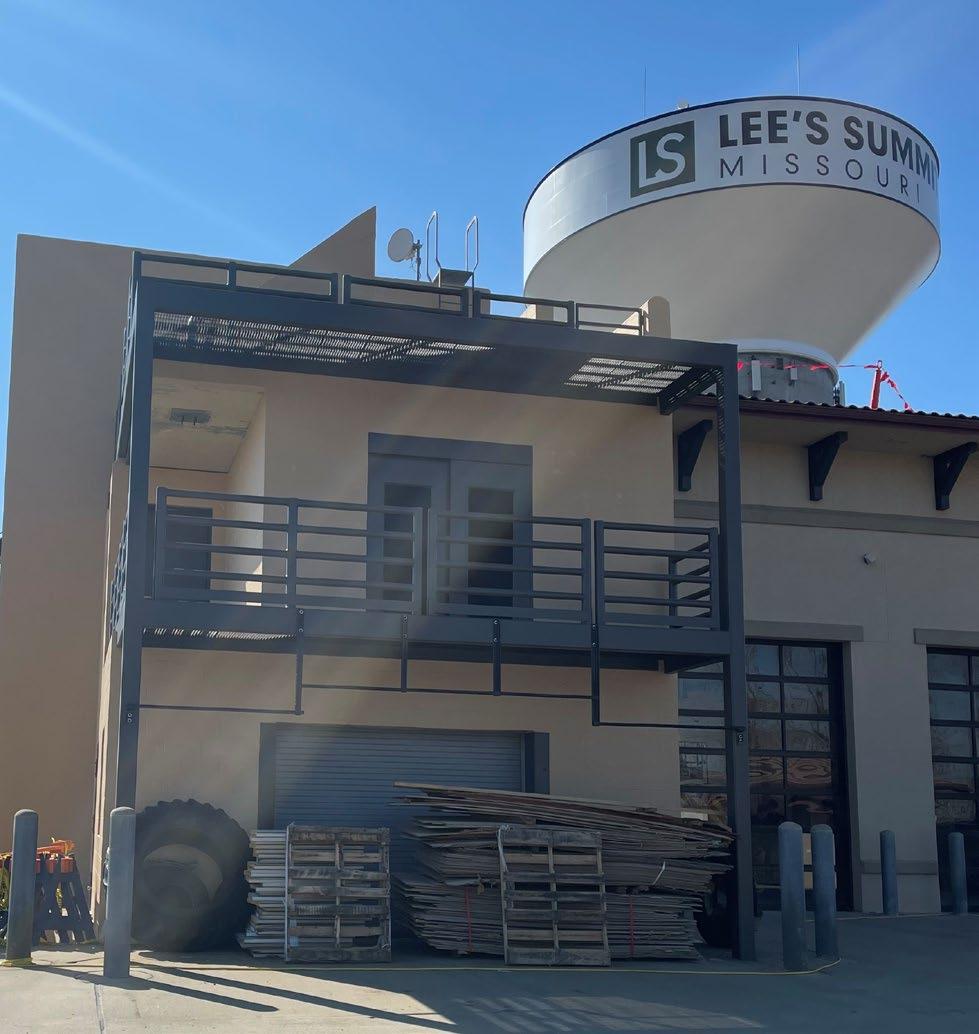
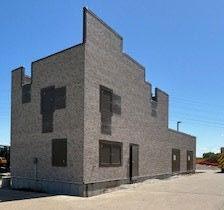
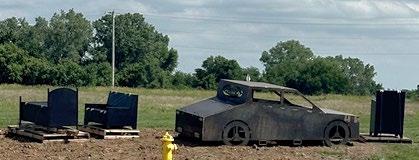
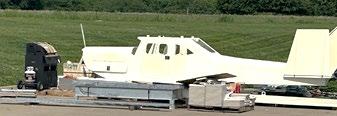
Station 7 is located at 2150 SW Scherer Road and was dedicated in March of 2007. Truck 7 (a 107-foot straight stick ladder truck) and Med 7 deploy from this station. Station 7 is staffed by a minimum of five personnel. The Department’s Training Division is located at Station 7. The station includes a three-story training facility for practical training sessions that encompass all service delivery areas of the department. In 2024 the addition of a Class A and Class B burn facility was built on the grounds of Station 7. This has many gas training props such as a vehicle, Cessna airplane, and propane tank. The tower includes a vertical ventilation prop, which allows the angle of the roof to be changed.
This district is located on the western boundary of Lee’s Summit and protects single-family residential, an elementary school, and a large amount of agricultural property.

The department has acquired land acquisition and design funding for Station 8 The city began the initial process of identifying land for the purchase and construction of this additional station during this SOC cycle. Property has been purchased at a location near the airport, which would also include the addition of an aircraft firefighting apparatus. A program has been developed and implemented in 2023 to rotate apparatus to different response areas to keep mileage and hours of use in check. This practice will become even more important once the department receives the nine lease-to-own pumpers, which are anticipated to be delivered in the summer of 2025, in which the mileage and hours will be more scrutinized.
The LSFD responds to fire incidents within the city and the contract areas of Greenwood and Unity Village, Missouri, and provides mutual aid when requested. LSFD has seven fire stations, staffed 24 hours daily with a minimum of 40 personnel and a maximum of 52 personnel. Fire operations are managed by an assistant chief and a battalion chief assigned to each shift and overseen by an administrative deputy chief.
There are five frontline and two reserve pumpers, which carry 500 gallons of water and have a pumping capacity of 1,500 gallons per minute. There are two mid-mount 100-foot platform ladder trucks and one rear-mount 107-foot straight ladder truck, which all carry 300 gallons of water and have a pumping capacity of 1,250 gallons per minute.
Each fire company is equipped to meet or exceed the recommendations of ISO and NFPA 1901, standards for fire department apparatus equipment assemblies. Each pumper carries a minimum of 1000 feet of 4-inch supply line, 500 feet of pre-connected 1.75-inch fire hose, and 400 feet of pre-connected 2.5-inch fire hose. Each ladder truck carries a minimum of 600 feet of 4-inch supply line and 500 feet of pre-connected 1.75-inch fire hose. Additional accessory fire hose is carried in various lengths; 1-inch forestry line, 1.75-inch fire hose, 2.5-inch fire hose, and 4-inch supply line.
Each pumper and ladder truck carries four self-contained breathing apparatus (SCBA). Each med unit carries two SCBAs. Each person assigned to the operations division is assigned a personal SCBA mask. Two additional SCBA masks with thermal imaging capability are assigned to each pumper and ladder truck. Each minimum staffing position has a personal thermal imaging camera (TIC) assigned to the SCBA. Each pumper, ladder truck, and med unit have air monitoring equipment and various hand tools.
Each pumper and ladder truck has a minimum staffing of three personnel and an optimal staffing of four personnel. Each med unit has a minimum staffing of two personnel which are utilized in the fire suppression framework on fire incidents. All personnel are trained or certified, at a minimum, to the Missouri Division of Fire Safety (IFSAC) certification of Firefighter I and II.
Stations 1, 3, 4, 5, and 6 house frontline pumpers, and Stations 2, 3, and 7 house frontline ladder trucks. All stations have a med unit. The department has reserve and specialized apparatus that are utilized for maintenance purposes of frontline apparatus or cross-staffed for incident-specific resources. Station 1 houses two reserve pumpers, two reserve med units, and a reserve operations chief vehicle. Station 3 houses the Squad, which is used for specialty or large incidents.
Stations 4 and 5 each house a type 7 apparatus for wildland fires. Each grass rig has booster reels, 250-gallon water tanks, and fire pumps with pre-piping on the front bumper for remote pumping operations. The grass rigs are crossstaffed with two on-duty personnel as needed or with overtime personnel during high-fire hazard days.
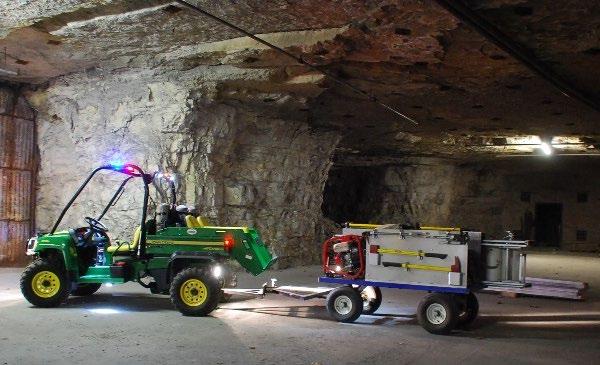
To address the target hazard of the subterranean space the department houses a John Deere UTV equipped with 200 feet of 2.5-inch attack line and 400 feet of 1.75-inch attack line for connections to the standpipe system. In addition, the UTV is equipped with four SCBAs, a gas-powered fan, and various hand tools. The UTV is staffed by personnel arriving to alarms at this target hazard.
The department has ordered two boats scheduled to be delivered in 2025. Each boat will have fire pumping capability. The department has also been granted funding and is beginning the process for an additional fire station near the airport, which will accommodate a piece of apparatus capable of fighting aircraft fires.
The LSFD is staffed and equipped to respond to any medical incident within the city and its contract areas and is capable of providing mutual aid when requested. LSFD also provides both emergency and non-emergency transfer services for Lee’s Summit Medical Center as well as Saint Luke’s East Hospital.
The department has seven ground transport ambulances that are identified as med units. One med unit is based at each of the seven stations throughout the city. In addition to the frontline med units, LSFD has two reserve med units that are currently housed at Station 1. The reserve med units can be staffed on an as-needed basis as additional resources as well as supplement the frontline units when maintenance is needed allowing the department to always have seven units in service.
The state of Missouri licenses Emergency Medical Technicians at both the basic level (EMT-B) and the Paramedic level (EMT-P). Each med unit is staffed with an EMT-B and EMT-P as minimum staffing. LSFD provides the opportunity for EMT-Bs to attend Paramedic school. All members have and maintain licensing at the EMT-B level as a minimum, and the department staffs a minimum of 16 paramedics per shift.
While state licensure is the minimum standard for either level, a number of members maintain certification through The National Registry of Emergency Medical Technicians (NREMT). This agency has strict requirements for certification, as well as a shorter certification cycle than the state.
Three paramedic members have also begun training as community paramedics, a certification that focuses on nonacute care to prevent patients with chronic medical issues from numerous hospital visits. The community paramedic program has not been implemented yet within the department, but training is needed to help prepare staff to begin the process of adding to service delivery.
Staffing levels at each station ensure paramedic-level care service delivery on department med units at minimum staffing points and all apparatus when stations are fully staffed.
All med units, pumpers, and ladder trucks carry an assortment of BLS/ALS medical equipment (LIFEPAK 15 cardiac monitor/defibrillators, cardiac and respiratory medications, basic and advanced airway adjuncts, oxygen, and various splints and bandages including tourniquets).
The LSFD is equipped and staffed to respond to technical rescue incidents within the city, contract areas, and mutual aid responses when requested. Each pumper and ladder truck carries equipment that can be utilized and deployed in the initial phase of a rescue. All firefighters are trained to the minimum of the awareness level. Depending on the complexity of the rescue, the department may be able to mitigate or stabilize the incident until Regional Technical Mutual aid units arrive to perform the rescue. Technical rescue mutual aid would be provided by the neighboring Central Jackson County Fire Protection District, Olathe Fire, or Kansas City Fire Department.
Equipment carried by pumper and ladder trucks consists of high-angle equipment, swift water rescue gear, ice rescue equipment, and auto extrication equipment.
Squad 1 and all pumpers carry a complement of specialty stabilization struts that are used for vehicle stabilization, and trench or structural collapse wall support. The three frontline ladder trucks and Pumper 1 also carry an assortment of high-pressure airbags used for vehicle stabilization during auto extrication. All frontline pumpers carry lumber for cribbing, and Holmatro electric extrication tools that are light enough to be carried by a single firefighter. This system improves the efficiency of deploying essential extrication equipment at the incident location.
Squad 1 is a triple-use apparatus with additional rescue equipment to support the incidents of high angle, swift water, ice, trench, and confined space rescue. This vehicle also contains equipment to help mitigate hazardous materials incidents and the technological capabilities to serve as a mobile command post.
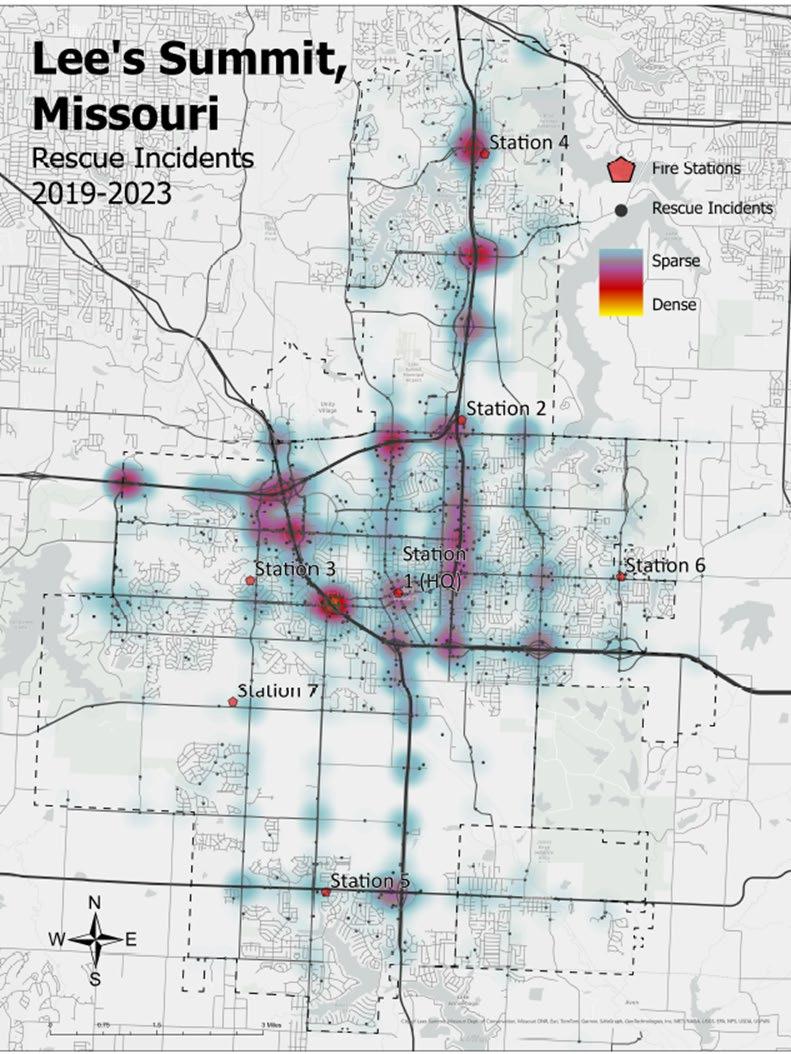
23: Technical Rescue Incidents (2019-2023)
The LSFD is staffed and equipped to respond to hazardous conditions incidents within the city, its contracted response areas, and mutual aid when requested. All firefighters in the department are trained to the hazardous materials awareness and operations levels. All pumpers, ladder trucks, med units, and command vehicles carry air monitoring equipment, isolation, and decontamination equipment, and/or supplies to contain or isolate hazardous material spills.
Currently, the department has a hazardous materials team consisting of 14 members spread across the 3 shifts that are trained to the hazardous materials technician level. This team can respond to incidents within the city and is one of eight in the area (Olathe; Overland Park; Kansas City, Kansas; Leavenworth; Kansas City, Missouri; Independence; and Central Jackson County) available to respond for mutual aid to other departments. The Hazardous Materials team utilizes Squad 1, a cross-staffed command vehicle, which carries monitoring equipment capable of detecting and identifying hazardous materials, personal protective equipment, decontamination supplies, research computers, and additional equipment to contain/isolate hazardous material spills.
The LSFD is also one of three departments to house a Regional Weapons of Mass Destruction trailer supplied by the Mid-America Regional Council (MARC). The trailer is supplied with equipment to respond to biological, nuclear, incendiary, chemical, and explosive incidents in the region.
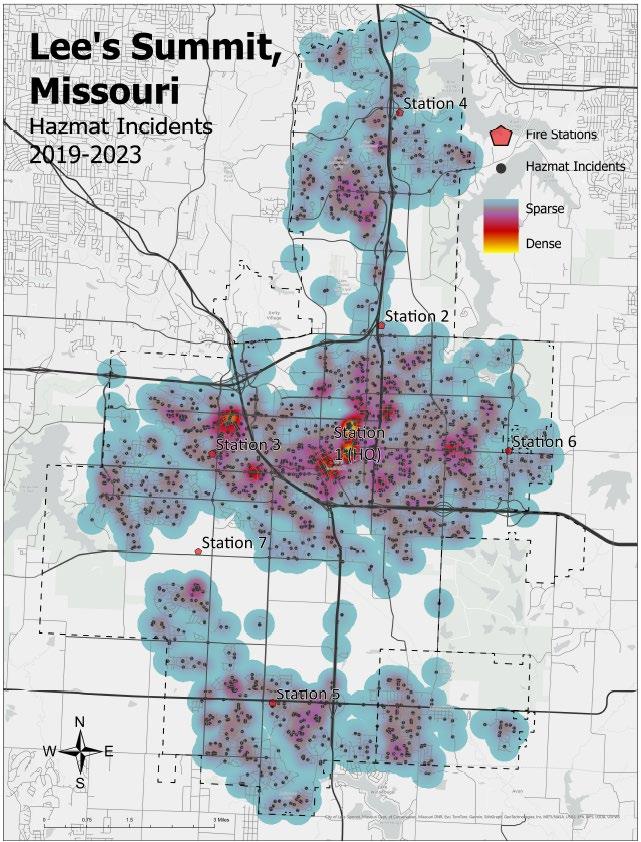
Map 24: Hazardous Conditions Incidents (2019-2023)
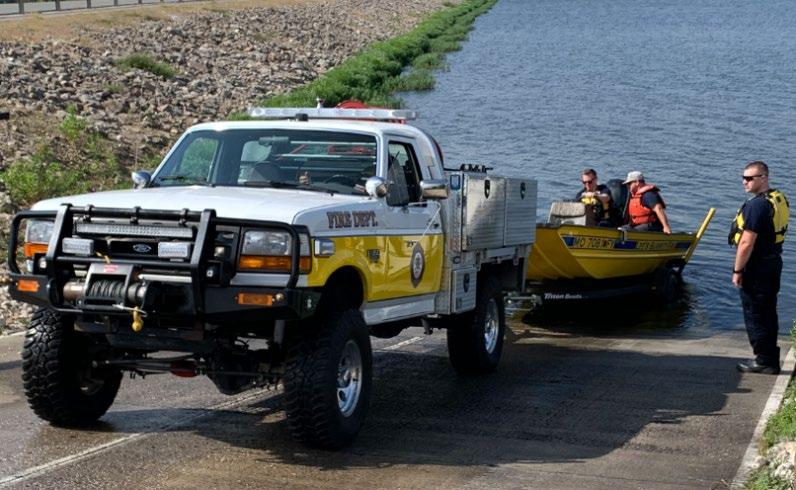
The department has an 18’ Triton Boat that has been retrofitted for fire department operations. This water response unit is trailered at Station 1 and cross-staffed by on-duty crews. Boat 1 can also be staffed with personnel from other responding apparatus, or by recalled personnel. The boat is designed to be utilized for surface water rescue and personnel transport for medical calls on the water, the boat is not equipped for firefighting operations. The boat is equipped with sonar equipment which is utilized for victim location and recovery. The department carries Rapid Deployment Crafts (RDC) on four front-line pumpers and both reserve pumpers, with large bodies of water in their response districts. These RDCs can be assembled and deployed for emergency response by the first arriving apparatus for emergent water and ice rescue events. All boat operational training is facilitated by the department. All operations personnel are required to take training to qualify for their Missouri Boater Education license.
The department also has a 1.5 million square foot subterranean space (cave system) that is occupied by multiple businesses. The department has an apparatus (Squad 4) stationed inside the subterranean space. This apparatus is a John Deere Gator with a trailer that carries SCBA, hose, ventilation fan, and extinguishers. This response vehicle is utilized on fire incidents inside the subterranean space by the first arriving units on scene. The department has developed standard operational guidelines for all operations within the subterranean space due to the specialized operations and the communication challenges the cave system presents. The department responds to all incidents in the subterranean space, covering all mission programs.
The department also has a Tactical Medic Team, which is used within Lee’s Summit Police Department’s Emergency Service Squad. The team is committed to providing ALS support at the request of law enforcement and acts as a liaison with LSFD personnel. The team is comprised of a minimum of seven personnel, with one of those being the Tactical Medic Team Coordinator and all others as Tactical Medic Operators, overseen by an assistant chief. All team members must be veteran paramedics and be able to
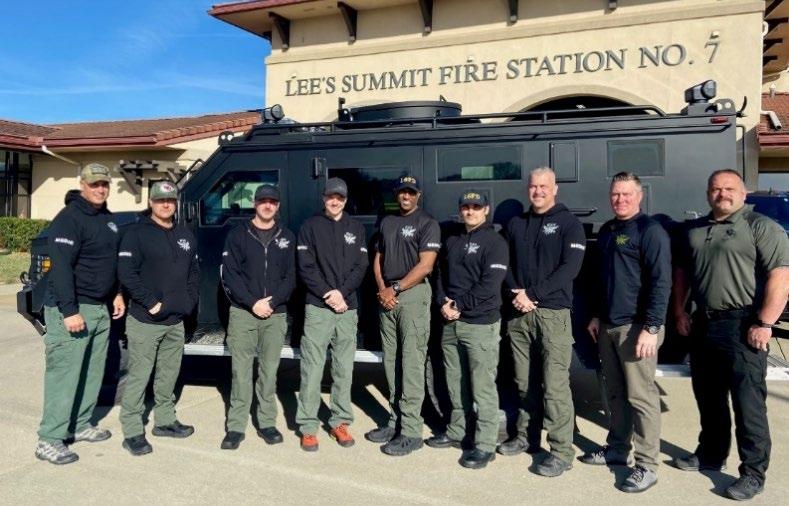
pass rigorous physical agility tests. The team is trained to assist in a variety of scenarios ranging from mass casualty incidents and K-9 operations to operations involving hostage situations.
The department currently has one drone and four drone pilots. The drone program is in its early stages, with very limited capabilities, but the plan is to expand the program to include reconnaissance capabilities.
The Fire Prevention Division of the LSFD is responsible for the Community Risk Reduction programs. This division is also responsible for the department’s loss prevention programs, Fire Investigation Unit, youth and adult fire education program, fireworks inspections, building plan reviews, and inspections of new construction, as well as tiered inspections of existing businesses. Six personnel are assigned to this division, led by the assistant chief of prevention, who is assisted by a battalion chief and a captain. Three engineers were added to the Prevention Division in 2023 and are assigned to a shift as inspectors/investigators. The additional inspectors are the first addition to the division since 1996.
Education programs created by the Fire Prevention Division are delivered to adult and youth classes by the Public Education Team and members of the division. The department is working to establish and revamp programs in the schools or find alternatives to in-class presentations. This team consists of various personnel from the department that have received training in this discipline with most being Fire Instructor 1 certified. Youth classes include, but are not limited to, elementary school fire safety classes, as well as station tours and fire safety for youth groups within the city. Adult education classes delivered jointly by the fire prevention and training divisions include CPR classes and home safety classes, as well as career days for high school age and up.
The Fire Prevention Division is responsible for doing all inspections on new construction. Existing building inspections are done by the Operations and Fire Prevention Divisions. Inspections are done on a tiered system based on risk to life, infrastructure, and economic impact. Existing building inspections are distributed between the three shifts and stations to allocate resources efficiently. The tiered inspection program, the addition of an electronic inspection program with the new records management system (RMS), and the use of a compliance engine have improved the overall effectiveness of existing building inspections. This has allowed for proactive enforcement of building systems as the occupants are notified before the department shows up for the inspection. This has resulted in more timely voluntary compliance by building owners/occupants on compliance issues.
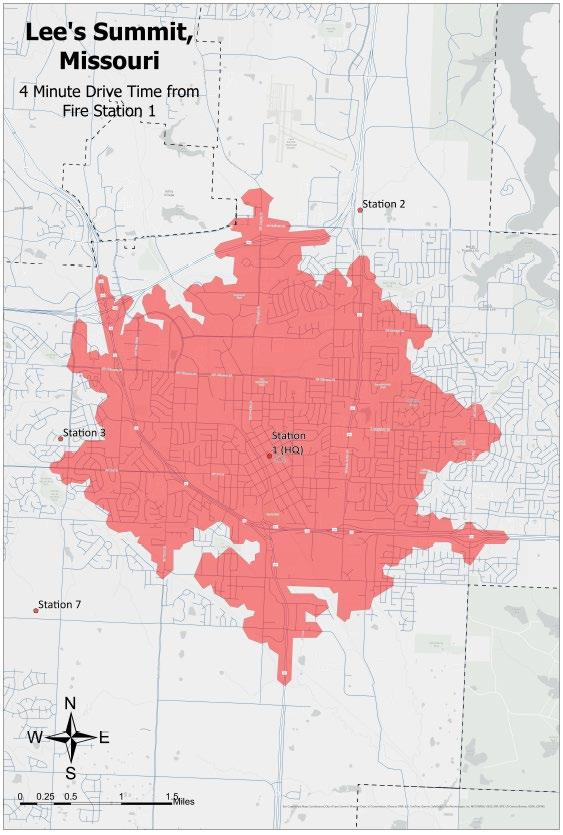
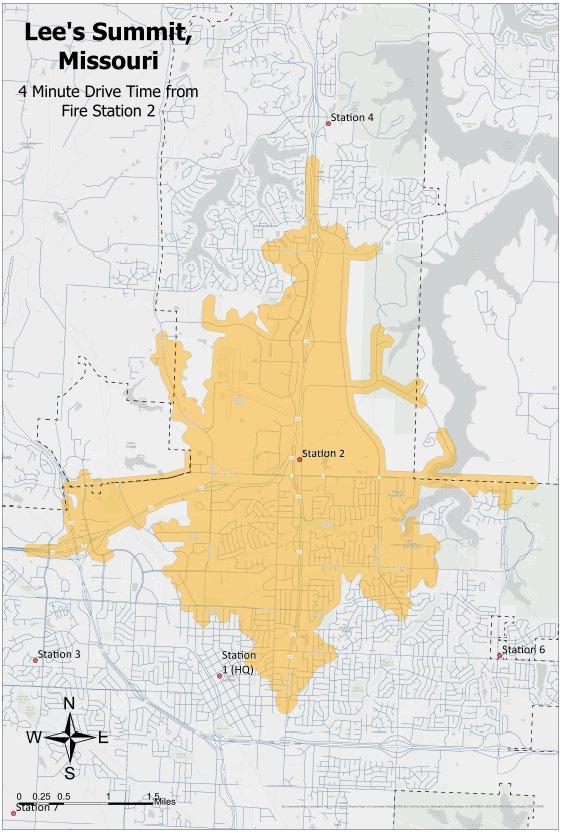
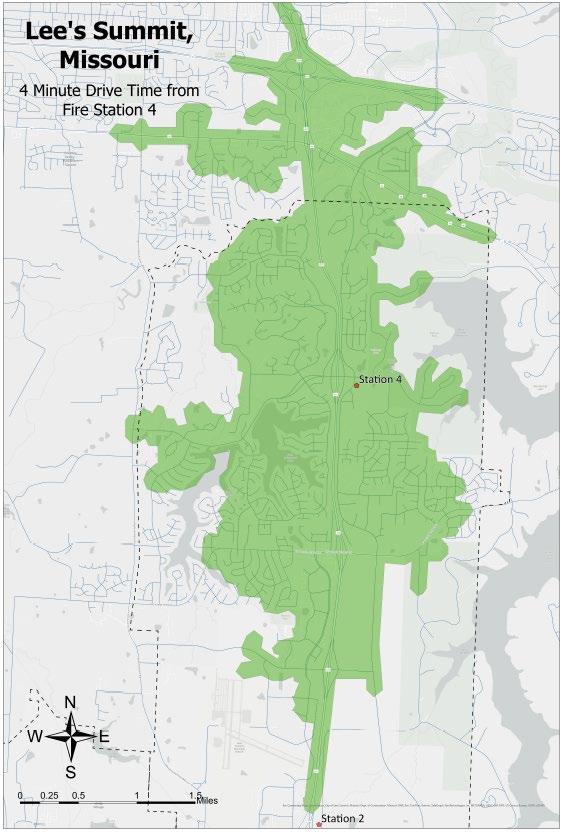
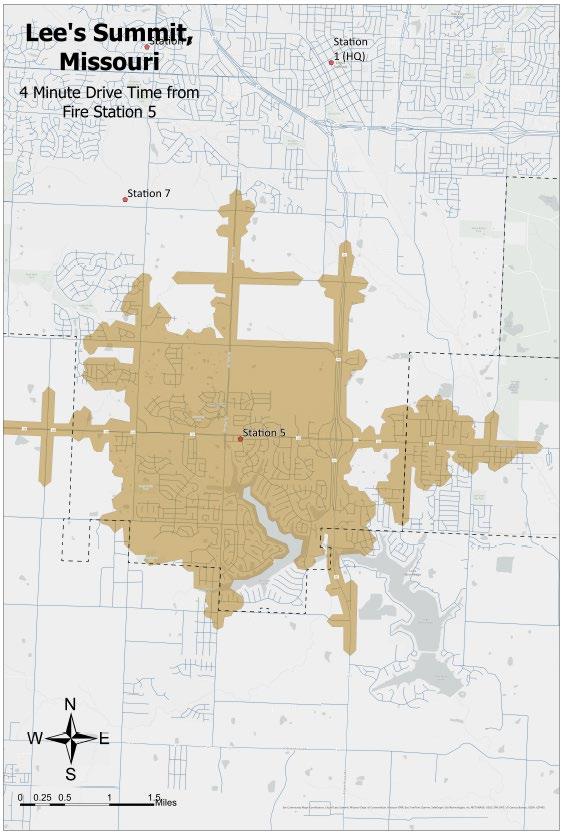
Map 25: Four-Minute Drive Time from all Fire Stations
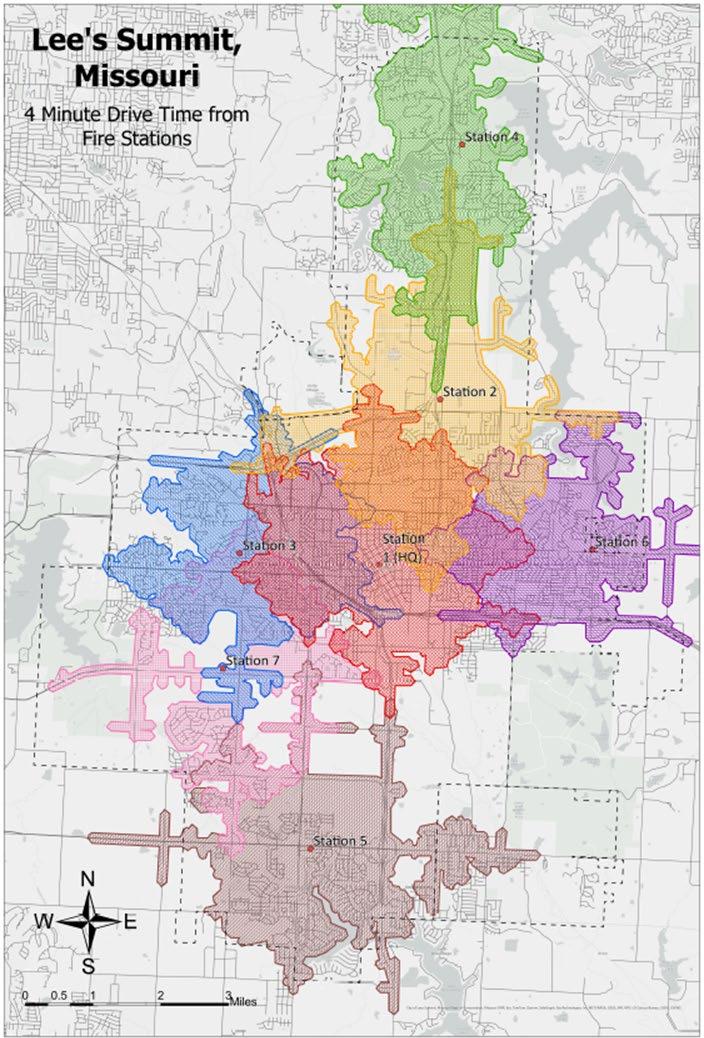
There are currently seven fire stations strategically located within the city which are also utilized for primary response to Greenwood and Unity Village through contractual agreements. Deployed from the seven stations are five pumpers, three ladder trucks, and seven med units, which are all staffed 24 hours a day. The four-minute drive time map provides details about what areas of the service area are outside the benchmark and areas that are reached by more than one station within that timeframe. Analyzing drive time data based on CUR, current speed limits, and typical response areas for each station will aid in future decision-making as it pertains to future station and/or apparatus additions, apparatus placement, and staffing.
Table 3: Deployable Resources by Station
*Personnel at Station 1 includes an on-duty shift Prevention Engineer. Stations 2 and 3 include a shift commander.
*Gator at Station 4 is in the subterranean space in Station 4's district.
There are currently seven planning zones within the city and one for each contracted service area. Inside each planning zone within the city is a deployment location for emergency operations: a fire station. The department transitioned to automatic vehicle locating (AVL) on all frontline apparatus and most reserve apparatus in 2019. This allows for the fastest routable deployments for all incidents within the city, Greenwood, and Unity Village. Fastest routable dispatching considers the location of all apparatus, roadway speeds, and closed road segments and then assigns the available units. Frequently, units will respond from different areas throughout the community. This occurs while performing emergent and non-emergent functions, such as training, business fire inspections, public education events, refueling, or maintenance transitions.
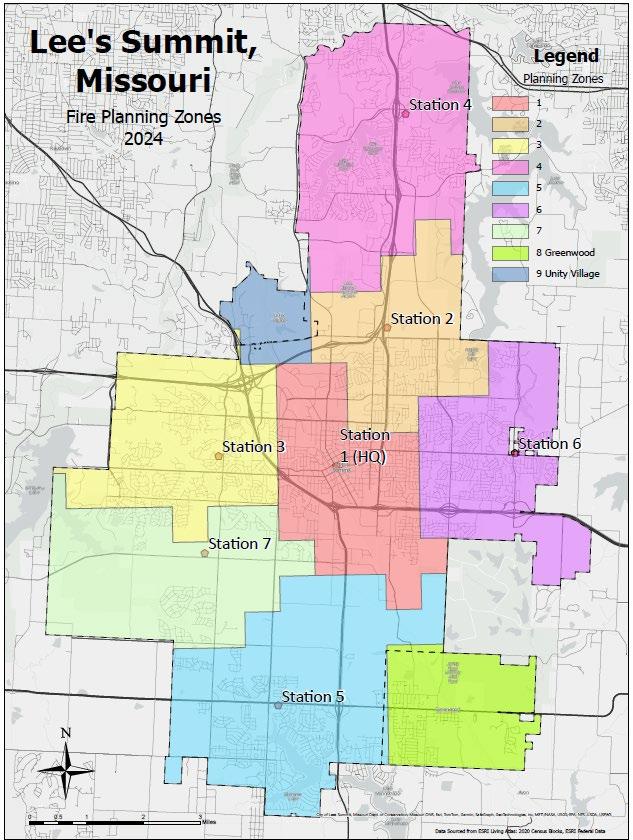

Table 4: Area
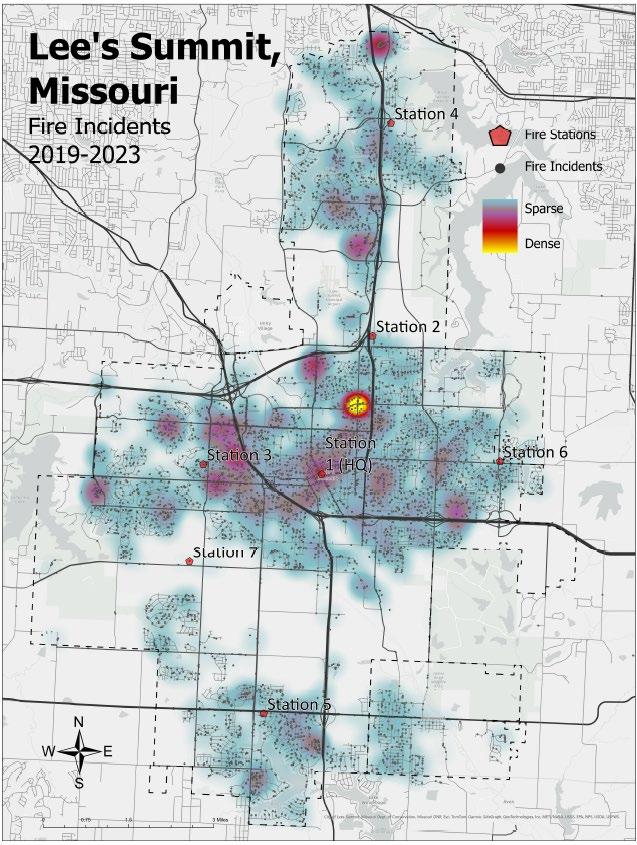
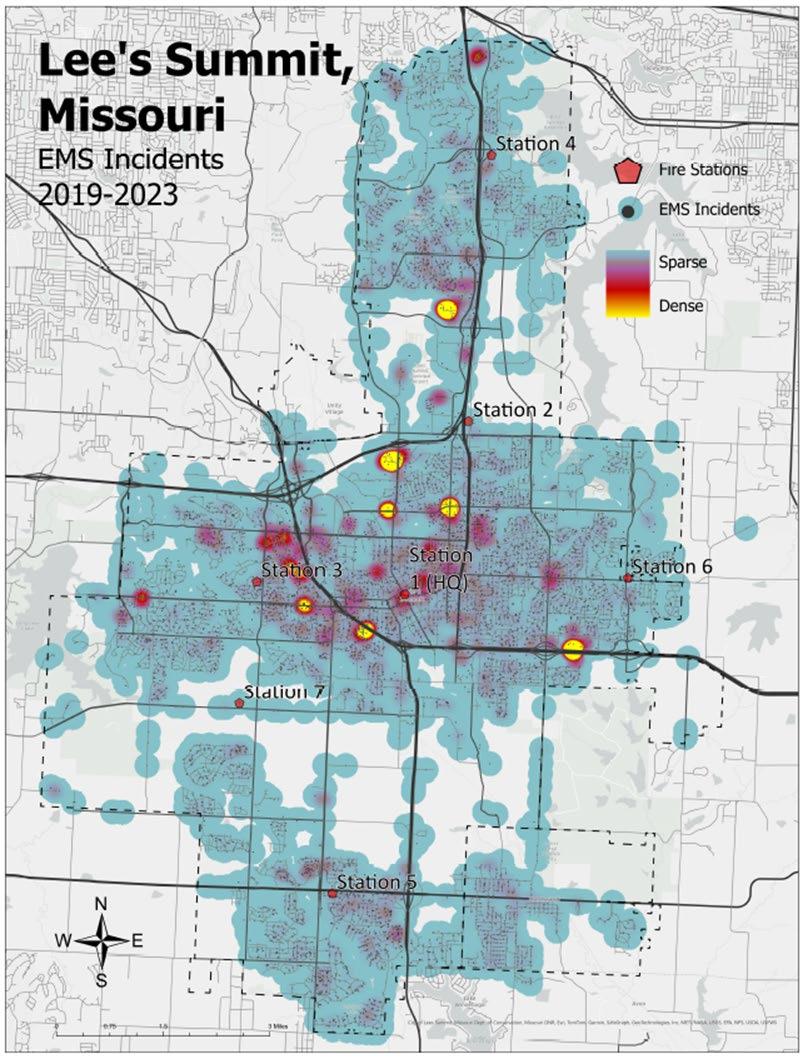
The following table depicts the service demand in the jurisdiction by incident type over the past five years. The risk classifications are established based on the dispatch information received rather than on the type of incident found at the scene. EMS incident examples include emergency medical calls and patient transfers. Fire incident examples include car and structure fires as well as smoke alarms. Hazardous Conditions (HazMat) examples would be fuel spills, carbon monoxide, gas line breaks, or other hazardous materials-related incidents. Technical rescue incidents include all motor vehicle collisions and other technical rescue events.
Table 7: Call Types by
Mission Statement
The Lee’s Summit Fire Department is dedicated to serving our community through prevention, preparedness, and response with PRIDE.
Values
Professionalism
A commitment to consistently achieve high standards through training and personnel development.
Respect Compassion and empathy for our community and each other.
Integrity
Duty
An uncompromised commitment to trust, honesty, and ethical services to our community and each other.
A commitment to carry out the mission of the department.
Excellence Continually striving to be the best.
In 2013, the department published a mission statement during the first strategic planning process, and in 2018, during another strategic planning process, the department revised the statement. During the 2023 strategic planning process, the mission statement was revisited and updated through internal stakeholder consensus. The department felt that this revised mission statement accurately reflected the commitment of the department to the community and was current, relevant, and accurately reflected the motivation of the sworn and non-sworn personnel in this department.
In 2023, the department conducted a strategic planning process with assistance from the Center for Public Safety Excellence (CPSE) Technical Advisor Program (TAP). This process engaged the community through an external stakeholder group that provided insight into their expectations of the services provided by the Lee’s Summit Fire Department. The external stakeholder group consisted of 26 members of the community from the areas of business, education, non-profit, faith-based, health care, city departments and governance, and area residents.
Participants were asked to prioritize the programs offered by the department, using a matrix to rank how important each service was to them via a direct comparison to the other services that are provided by the department. The individual responses were then totaled, and the results of the comparison were as follows:
1. Emergency Medical Services
2. Fire Suppression
3. Technical Rescue
4. Fire Prevention
5. Emergency Management
6. HazMat Mitigation
7. Fire Investigation
8. Public Education
Understanding what the community expects of its fire and emergency services organization is critically important to developing a long-range perspective. In 2023, the external stakeholders provided a total of 24 expectations of Lee’s Summit Fire Department and its personnel. The top four expectations received are listed verbatim and in priority order below.
1. Response Times. Quick response times. Low response times. Timely response. Reducing emergency response time as much as possible. Quick response time. Respond to emergencies in the shortest time possible. Timely arrival. Quick response times to an emergency. Fast, effective response.
2. Training. Well-trained and educated team members. Capable/knowledgeable/well trained. Continued education and support for all responders. Ongoing training. Trained and experienced staff. Proper training. To remain current with training. Well-trained employees. Consistency - ability to perform what is needed.
3. Public Safety. Public safety. Emergency response. Safety and security of residents and business/organizational stakeholders. Quality care of residents in need of assistance.
4. Community Involvement. Community education. Partnerships in the community. Partner with other stakeholders to better serve the community. Community outreach. Great communication with stakeholders. Community engagement.
Prior to becoming accredited, Lee’s Summit Fire Department utilized a goal of five-minute emergency response travel time for the first arriving unit at the scene of an emergency incident. This goal was unwritten but had been expressed during council meetings and discussions with the public as the department’s benchmark.
Through the department’s involvement with the CFAI model, it became apparent that basing performance goals on travel time alone did not include all the information necessary along the response time continuum to make informed decisions on areas in which improvement was indicated and achievable. Travel time alone was but one component of a more accurate and detailed process for measuring performance.
A fundamental element of the standards of cover is total response time reporting. This includes benchmarks for alarm handling, turnout time, travel time, and travel time for an effective response force, resulting in a benchmark for the total response time of the first arriving unit and total response time for an effective response force.
As a result, the department set and published performance goals as recommended by CPSE and in compliance with the 10th Edition Quality Improvement for the Fire and Emergency Services To provide the community with the best service possible, the department chose to adopt the performance goal standards established in the National Fire Protection Association (NFPA) 1710. The adopted standards provide the department with the opportunity to continue to improve to meet the benchmarks and provide transparency to the dataset. The response time standards identified within NFPA 1710 set service delivery objectives (benchmarks), including specific time objectives for each applicable department risk class (Fire Suppression, EMS, Technical Rescue, and Hazardous Conditions).
There are four components of response time identified and benchmarked: alarm handling, turnout time, travel time for the first arriving unit, and total response time for an effective response force to mitigate the incident. Alarm handling refers to the time interval from receiving the alarm at the secondary public safety access point (PSAP) to dispatching the responding units. Turnout time refers to the time interval from the dispatch information to responding with the assigned apparatus. Travel time refers to the time interval from en route to the emergency incident and ends with the unit’s arrival on scene. Effective response force (ERF), also known as concentration, is the total time to get all assigned units on scene of the emergency. Total response time refers to the interval from receipt of the alarm at the PSAP to when the first emergency unit initiates an action or intervenes to control the incident. There is a primary PSAP time value that has not been included in this analysis due to the department’s inability to accurately capture that information from the Mid-America Regional Council (MARC) and the multiple primary PSAPs from which calls are received.
Table 8: Response Time Benchmarks
The Lee’s Summit Fire Department elected to continue to evaluate risk using a three-axis categorization measurement approach consisting of threat probability (Y-axis), consequences to the community (X-axis), and impact on the agency (Z-axis). This three-axis measurement utilizes Heron’s Formula, modified for tetrahedrons, to produce a quantifiable value for risk based on numerical values representing each axis in the formula.
Probability refers to the likelihood of an event occurring in the community. It is based on the incidents reported to the National Fire Incident Reporting System (NFIRS) for the past five years (2019-2023).
Consequence assesses how a specific type of incident would affect the community by assessing the number of patients, number of vehicles or structures involved, types of structures, and the impact on community infrastructure.
The impact is related to the number of personnel on fire department resources used to mitigate each specific incident and the reliability of the resources remaining to continue to deliver services to the community.
Probability, consequence, and impact were each quantified with an assigned value from 2 to 10, with the 2-value representing a lower element of risk and the 10-value representing a maximum element of risk. Each value was represented as a point on the axis, which, when combined, forms a tetrahedron that is measured to illustrate the overall risk score of the event.
All fire suppression, emergency medical, hazardous conditions, and technical rescue incidents underwent a critical task analysis to determine the quantifier used in the impact determination before completing an overall risk score. The incidents were evaluated, scored, and ranked, creating multiple distinct risk categories. Impact, probability, and consequence were scored, and that defined risk levels from low to maximum modified depending on the hazard against the incident type, facility, or location.
All emergency incident types were evaluated and scored for each program classification by members of the Standards of Cover (SOC) team. The SOC team consisted of one deputy chief, two assistant chiefs, two engineers from the Operations Division, the supervisor and one lead communications specialist from the Communications Center, and the accreditation manager.
Apparatus in the department are dispatched based on the type of incident that a caller describes, and each incident type has a set alarm assignment. Each incident type in the Computer Aided Dispatch (CAD) system is assigned an alarm assignment of either low, low modified, moderate, moderate modified, high, high modified, maximum, or maximum modified. If additional staffing is needed, these alarm assignments can be upgraded, or the incident commander or the first due unit can request additional apparatus. The list of incident types, incident descriptions, and the amount and type of units to be dispatched on the initial alarm are in the department’s guiding documents. All dispatched alarm levels are based on the information provided to the communications center by the caller through Emergency Medical Dispatch (EMD) or Emergency Fire Dispatch (EFD) questioning.
Critical tasks and associated staffing that are needed to mitigate a low-level fire risk incident are listed in the following table. Examples of these types of incidents are lift assists, passenger vehicle fires, unknown type fires, automatic commercial or residential alarms, and haze of smoke inside a residential structure. The critical task analysis determines the effective response force deployment necessary to mitigate the reported incident associated with the risk level assignment.
Table 9: Critical Tasks - Low Risk Fire
Critical tasks and associated staffing needed to mitigate a moderate-level fire risk incident are listed in the tables to follow. There are different tables due to the type of apparatus that are needed to mitigate different kinds of moderatelevel fire risk incidents. The critical task analysis determines the effective response force deployment necessary to mitigate the reported incident associated with the risk level assignment. Examples of these types of incidents are power lines down/transformer fire with a patient and a vehicle fire (car, pickup, van) with a patient.
Table 10: Critical Tasks - Moderate Risk Fire
Examples of these types of incidents are automatic commercial alarms with water flow, haze of smoke in a commercial structure, and shed/detached outbuilding fires.
Table 11: Critical Tasks - Moderate Risk Fire
Examples of these types of incidents are grass/brush fires with a patient and large grass/brush fires. Table
Examples of these types of incidents are boat fire on the water with or without a patient.
Table 13: Critical Tasks - Moderate Risk Fire
Critical tasks and associated staffing needed to mitigate a moderate modified-level fire risk incident are listed in the following table. Due to the type of apparatus that are needed to mitigate different kinds of moderate modified-level fire risk incidents, there are two different resource dispatches. The critical task analysis determines the effective response force deployment necessary to mitigate the reported incident associated with the risk level assignment. Examples of these types of incidents are commercial vehicle fire, aircraft fire, and unknown situation/investigation of a train.
An example of this type of incident is a flue/chimney fire.
15:
Critical tasks and associated staffing needed to mitigate a high-level fire risk incident are listed in the following table. Examples of these types of incidents are residential structure fires (single-family, duplex, or row townhome), a lightning strike of a structure, large outside fire, and a residential explosion. The critical task analysis determines the effective response force deployment necessary to mitigate the reported incident associated with the risk level assignment.
Critical tasks and associated staffing needed to mitigate a high modified-level fire risk incident are listed in the following tables. There are different tables due to the type of apparatus that are needed to mitigate different kinds of high modified-level fire risk incidents. The critical task analysis determines the effective response force deployment necessary to mitigate the reported incident associated with the risk level assignment. An example of this type of incident is a boat fire on the water with multiple patients.
Examples of these types of incidents are a grass/brush fire associated with a structure and a grass/brush fire with multiple patients.
An example of this type of incident is a commercial structure fire.
Table 19: Critical Tasks - High Modified Risk Fire
An example of this type of incident is a residential structure fire in a rural water area.
Table 20: Critical Tasks -
Critical tasks and associated staffing needed to mitigate a maximum-level fire risk incident are listed in the following
table. Examples of these types of incidents are commercial building explosion, high life hazard commercial structure fire (churches, hospitals, apartment complexes, hotels, nursing homes, and schools), and commercial aircraft fires/crashes. The critical task analysis determines the effective response force deployment necessary to mitigate the reported incident associated with the risk level assignment.
Table 21: Critical Tasks - Maximum Risk Fire
Critical tasks and associated staffing needed to mitigate a maximum modified-level fire risk incident are listed in the following table. Examples of these types of incidents are a train crash/fire and explosions with mass casualties. The critical task analysis determines the effective response force deployment necessary to mitigate the reported incident associated with the risk level assignment.
Table
Critical tasks and associated staffing needed to mitigate a low-level emergency medical services (EMS) risk incident are listed in the following table. Examples of these types of incidents are a medical alarm and an EMS response to a low-risk single patient. The critical task analysis determines the effective response force deployment necessary to mitigate the reported incident associated with the risk level assignment.
Table 23: Critical Tasks -
Critical tasks and associated staffing needed to mitigate a moderate-level EMS risk incident are listed in the following table. An example of this type of incident is an EMS response with one to two patients. The critical task analysis determines the effective response force deployment necessary to mitigate the reported incident associated with the risk level assignment.
Table 24: Critical Tasks - Moderate Risk EMS
Critical tasks and associated staffing needed to mitigate a moderate modified-level EMS risk incident are listed in the following table. An example of this type of incident is an EMS response with a non-breather or critical patient. The critical task analysis determines the effective response force deployment necessary to mitigate the reported incident associated with the risk level assignment.
Table 25:
Critical tasks and associated staffing needed to mitigate a high-level EMS risk incident are listed in the following table. An example of this type of incident is an EMS response with 3 to 4 patients. The critical task analysis determines the effective response force deployment necessary to mitigate the reported incident associated with the risk level assignment. Table
Critical tasks and associated staffing needed to mitigate a maximum-level EMS risk incident are listed in the following table. An example of this type of incident is an EMS incident with five or more patients. The critical task analysis determines the effective response force deployment necessary to mitigate the reported incident associated with the risk level assignment. Table 27: Critical Tasks -
Critical tasks and associated staffing needed to mitigate a low-level technical rescue risk incident are listed in the following table. Examples of this type of incident are an elevator alarm/malfunction, a minor rescue, and a subject locked out of a structure. The critical task analysis determines the effective response force deployment necessary to mitigate the reported incident associated with the risk level assignment.
Critical tasks and associated staffing needed to mitigate a low modified-level technical rescue risk incident are listed in the following table. Examples of these types of incidents are a subject locked in a vehicle in extreme temperatures, motor vehicle collision (MVC) with pedestrian/bicycle struck (1 patient), and an MVC with a minor or unknown injury. The critical task analysis determines the effective response force deployment necessary to mitigate the reported incident associated with the risk level assignment.
Critical tasks and associated staffing needed to mitigate a moderate-level technical rescue risk incident are listed in the following table. Examples of these types of incidents are an MVC with 1 to 2 patients, swimming pool water rescue, and an elevator alarm with medical. The critical task analysis determines the effective response force deployment necessary to mitigate the reported incident associated with the risk level assignment.
Critical tasks and associated staffing needed to mitigate a moderate modified-level technical rescue risk incident are listed in the following table. Examples of these types of incidents are an MVC with 3 to 4 patients and an MVC with pedestrian/bicycle struck (2 to 4 patients). The critical task analysis determines the effective response force deployment necessary to mitigate the reported incident associated with the risk level assignment.
Table 31: Critical Tasks - Moderate Modified Risk Technical
Critical tasks and associated staffing needed to mitigate a high-level technical rescue risk incident are listed in the following table. Due to the type of apparatus that are needed to mitigate different kinds of high-level technical rescue risk incidents, there are two different resource dispatches. The critical task analysis determines the effective response force deployment, necessary to mitigate the reported incident associated with the risk level assignment.
Examples of these types of incidents are a vehicle in the water, machinery/industrial rescue, and high-angle rescue.
Examples of these types of incidents are an MVC with extrication, an MVC with five or more patients, and trench rescue.
Table 33: Critical Tasks - High Risk Technical Rescue
Critical tasks and associated staffing needed to mitigate a high modified-level technical rescue risk incident are listed in the following table. Due to the type of apparatus that are needed to mitigate different kinds of high modified-level technical rescue risk incidents, there are two different resource dispatches. The critical task analysis determines the effective response force deployment necessary to mitigate the reported incident associated with the risk level assignment.
Examples of these types of incidents are floodwater rescues and floodwater rescues with multiple patients. Table
Examples of these types of incidents are boat accidents on the water and water rescue. Table
Critical tasks and associated staffing needed to mitigate a maximum-level technical rescue risk incident are listed in the following table. An example of this type of incident is a large building/structure collapse. The critical task analysis determines the effective response force deployment necessary to mitigate the reported incident associated with the risk level assignment.
Critical tasks and associated staffing needed to mitigate a low-level hazardous conditions risk incident are listed in the following table. Examples of these types of incidents are fuel spills of 55 gallons or less, odor investigation unknown, and carbon monoxide alarms with no symptoms. The critical task analysis determines the effective response force deployment necessary to mitigate the reported incident associated with the risk level assignment.
Table 37: Critical Tasks - Low Risk Hazardous Conditions
Critical tasks and associated staffing needed to mitigate a moderate-level hazardous conditions risk incident are listed in the following table. Examples of these types of incidents are natural gas/propane line break outside, carbon monoxide alarm with symptoms and odor of natural gas/propane inside (residential). The critical task analysis determines the effective response force deployment necessary to mitigate the reported incident associated with the risk level assignment.
Table 38: Critical Tasks - Moderate Risk Hazardous Conditions
Critical tasks and associated staffing needed to mitigate a moderate modified-level hazardous conditions risk incident are listed in the following table. Examples of these types of incidents are a fuel spill greater than 55 gallons, natural gas/propane line break inside (commercial or residential), and odor of natural gas/propane inside (commercial). The critical task analysis determines the effective response force deployment necessary to mitigate the reported incident associated with the risk level assignment.
Table 39: Critical Tasks - Moderate
Critical tasks and associated staffing needed to mitigate a high-level hazardous conditions risk incident are listed in the following table. Examples of these types of incidents are a radiological incident and HazMat chemical spill or release. The critical task analysis determines the effective response force deployment necessary to mitigate the reported incident associated with the risk level assignment.
Critical tasks and associated staffing needed to mitigate a maximum-level hazardous conditions risk incident are listed in the following table. An example of this type of incident is a mass casualty hazardous material incident. The critical task analysis determines the effective response force deployment necessary to mitigate the reported incident associated with the risk level assignment.
The community was assessed to evaluate what the fire risks are, and three major considerations were evaluated for fire risk; they are as follows:
1. The probability of the event occurring is based on historical incidents found for scene data documented over the past five years.
2. The consequence to the community is based on the number of patients, number of vehicles or structures involved, types of structures, and the impact on community infrastructure. Table 43: Consequence
to
3. The impact on the operational fleet is based on the critical tasks associated with the incident. Table 44:
According to the Missouri Department of Public Safety, State Emergency Management Agency (SEMA), “structure fires are the most common type of fire in Missouri.” Compared to nationally, Missouri has a greater fire risk than many states. According to 2022 information from the United States Fire Administration, Missouri residents have a relative risk of 1.4 compared to the US general population of 1.0 of dying in a fire. Also, the United States Fire Administration has collected data on fire injuries by age and gender.
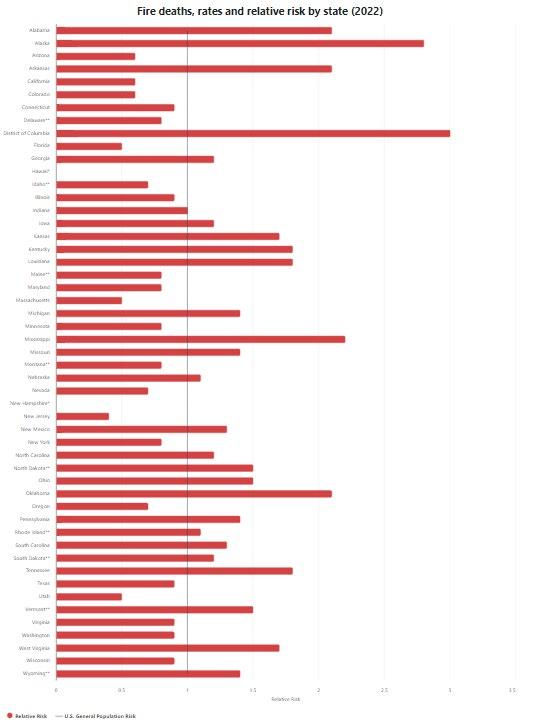
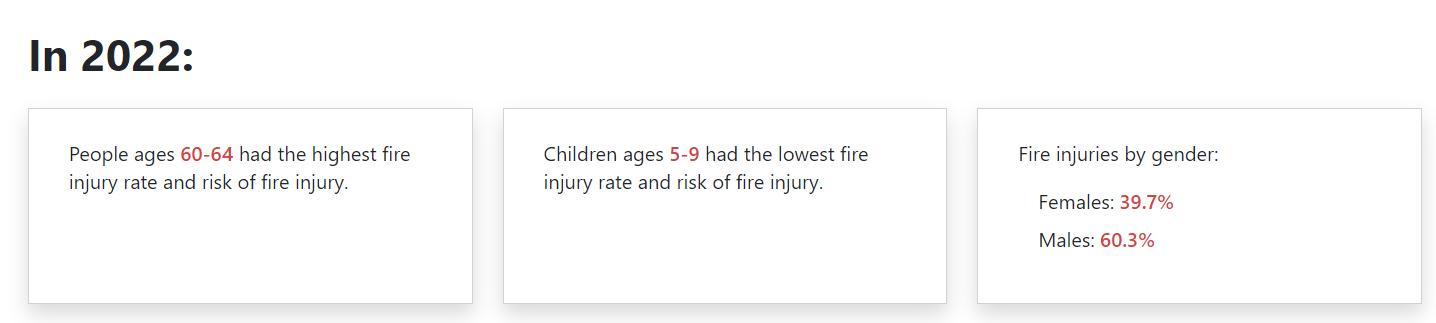
*Denotes risks that exceed the low-risk threshold due to high probability values but do not have a significant impact on operational resources based on a critical task analysis; as a result, these incidents are dispatched as low risk alarms.
**Denotes risks that exceed the moderate-risk threshold due to a higher impact on operational resources based on a critical task analysis; as a result, these incidents are dispatched as moderate modified risk alarms.
***Denotes risk that exceeds the high risk threshold due to a higher impact on operations resources (tankers and/or boats) based on critical task analysis; as a result, these incidents are dispatched as high modified alarms.
****Denotes risks that are less than the maximum modified risk threshold due to a lower impact of personnel (28) based on a critical task analysis; as a result, these incidents are dispatched as maximum risk alarms.
The community was assessed to evaluate what the emergency medical risks are, and three major considerations were assessed when evaluating emergency medical risk; they are as follows:
1. The probability of the event occurring is based on historical incidents found on scene data documented in the past five years.
Table 46: Probability
2. The consequence to the community is based on the number and status of patients.
Table
3. The impact the incident has on the operational forces of the department is based on the critical tasks associated with the incident.
Table 48: Impact Scoring - EMS
The majority of incidents run by the department are for emergency medical services.
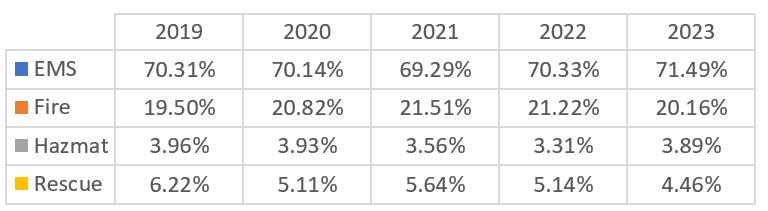
11: Annual Incidents by Type (2019-2023)
Certain assignments are dispatched with higher or lower amounts of personnel based on the type of call and the level of risk associated. The department’s communications center implemented the electronic version of Emergency Medical Dispatch (EMD) and Emergency Fire Dispatch (EFD) in September of 2024. EMD and EFD is a protocolbased system that provides a list of questions for dispatchers to ask callers. These questions and answers provide a determination of what incident type and resources are needed.
The risk level is determined in this class of risk due to the complaint of the patient or patients, regardless of their location. If the patient is located in a compromised location, adding an additional hazard can change the class of risk. For example, if the patient is trapped in a car, it becomes a technical rescue response. If the patient is trapped in a building on fire, it becomes a fire response.
The community was assessed to evaluate what the technical rescue risks are, and three major considerations were evaluated for technical rescue risk; they are as follows:
1. The probability of the event occurring is based on historical incidents found on scene data documented in the past five years.
Table
2. The consequence to the community is based on the number of patients, number of vehicles or structures, types of structures, and the impact on community infrastructure. Technical rescue incidents are broadspectrum response types. The consequence can vary in severity, given the location of a technical rescue event and the possibility of involvement on a road or highway affecting a large number of people.
Table 51: Consequence Scoring - Technical Rescue
5 to 9 people, multiple vehicles, 3 to 4 patients, trapped victim
to 24 people, multi-family occupancy, multiple occupancies, institutional structure, strip mall, box store
or more people, major hazard class disaster
3. The impact the incident has on the operational forces of the department is based on the critical tasks associated with the incident.
Table 52: Impact Scoring -
The risk level is determined in this class of risk due to the location or position of a victim. The at-risk individual is considered a victim, while the location of the entrapped victim determines the hazard type. For example, if the patient is trapped in a car, it becomes a technical rescue response. If the patient is trapped in a building on fire, it becomes a fire response.
*Denotes a risk score that exceeds the low modified risk threshold due to higher probability values but does not have a significant impact on operational resources based on a critical task analysis; as a result, these incidents are dispatched as low modified risk alarms.
**Denotes a risk score that exceeds the low modified risk threshold due to a higher consequence; as a result, these incidents are dispatched as moderate risk alarms.
***Denotes a risk score that exceeds the moderate risk threshold due to a higher probability value and a lower consequence value; as a result, these incidents are dispatched as moderate risk alarms.
The community was assessed to evaluate what the hazardous conditions risks are, and three major considerations were evaluated for hazardous conditions risk; they are as follows:
1. The probability of the event occurring is based on historical incidents found on scene data documented in the past five years.
Table 54: Probability Scoring - Hazardous Conditions
2. The consequence to the community is based on the number of patients, number of vehicles or structures, types of structures, and the impact on community infrastructure. Hazardous conditions events affect the community in several ways. Not only are they dangerous to health and react to other materials in the area, but they can affect the community infrastructure by roadway, railway and/or water systems. Fortunately, these events are usually infrequent, but the risk is still present.
Table 55: Consequence Scoring - Hazardous Conditions
3. The impact the incident has on the operational forces of the department is based on the critical tasks associated with the incident, given the location of the hazard.
Table 56: Impact Scoring - Hazardous Conditions
The risk level is determined in this class of risk due to the volume or type of hazardous material and if patients are present. These factors affect the number of critical tasks needed to mitigate the risk, thus changing the risk level.
Table 58: Risk Classification - Fire Suppression
Low Risk
• Appliance fire contained
• Assist PD/Law Enforcement
• Automatic alarm – residential or commercial
• Citizen assist
• Fire standby
• Grass/brush fire (small)
• Hazard Check
• Haze of smoke inside a residential structure
• Helicopter standby/Landing zone
• Illegal burn
• Lift assist
• Odor of smoke inside
• Outside fire (small)
• Power lines down/transformer fire
• Smoke investigation outside (including odor of smoke)
• Trash/rubbish fire
• Unknown type of fire
• Vehicle fire (car, pickup, van)
Moderate Modified
• Aircraft crash or emergency landing
• Aircraft fire
• Hazard Check – multiple pts
• Flue/chimney fire Outside fire (small) – multiple pts
• Power lines down/transformer fire – multiple pts
• Train – unknown situation/investigation
• Vehicle fire (commercial, RV, industrial)
• Vehicle fire (commercial, RV, industrial) – 1 pt
• Vehicle fire (car, pickup, van) – multiple pts
• Vehicle fire (commercial, RV, industrial) – multiple pts
High Modified Risk
• Boat fire (on water) – multiple pts
• Grass/brush fire (large) - multiple pts
• Grass/brush fire – structure
• Grass/brush fire (small) – multiple pts
• Structure fire commercial
Moderate Risk
• Automatic alarm waterflow - commercial
• Boat fire (on water)
• Boat fire (on water) – 1 pt
• Explosion (other)
• Explosion (other) - 1 pt
• Fire with exposures
• Fire with exposures – 1 pt
• Grass/brush fire (large)
• Grass/brush fire (large) – 1 pt
• Grass/brush fire (small) – 1 pt
• Hazard Check – 1 pt
• Haze of smoke inside a commercial structure
• Lightning strike
• Lightning strike (other)
• Lightning strike (other) – 1 pt
• Outside fire (small) – 1 pt
• Power lines down/transformer fire – 1 pt Shed/detached garage fire
• Vehicle fire (car, pickup, van) – 1 pt
High Risk
• Explosion (other) – multiple pts
• Explosion (residential)
• Explosion (residential) – 1 pt
• Explosion (residential) – multiple pts
• Fire with exposures – multiple pts
• Lightning strike (other) – multiple pts
• Lightning strike (structure)
• Lightning strike (structure) – 1 pt
• Lightning strike (structure) – multiple pts
• Outside fire (large)
• Outside fire (large) – 1 pt
• Outside fire (large) – multiple pts
• Structure fire residential
Maximum Risk
• Aircraft (commercial) fire or crash
• Explosion (commercial building)
• Explosion (commercial building) – 1pt
• Explosion (commercial building) – multiple pts
• Refinery/tank farm fire
• Structure fire commercial – high life hazard
• Vehicle fire (car, pickup, van) – mass casualty
• Vehicle fire (commercial, RV, industrial) – mass casualty
Maximum Modified Risk
• Explosion (commercial building) – mass casualty
• Explosion (other) – mass casualty
• Explosion (residential) – mass casualty
• Train crash/fire (not train vs car unless derailment)
Table 59: Risk Classification - EMS
• EMS patient transfers
• EMS standby
• ESS operation/SWAT Tac Medic Medical alarm
• Medical call
• Emergency medical non-breather/critical
• Emergency medical – 5+ patients (mass casualty)
Table 60: Risk Classification - Technical Rescue
• Animal rescue (large) – non-water
• Animal rescue (small) – non-water
• Elevator alarm/malfunction
• Locked in a vehicle
• Locked out of a structure
• Locked out of vehicle (unoccupied)
• Minor rescue
• Elevator rescue with medical
• MVC injury – 1 to 2 patients
• Vehicle stuck on railroad tracks
• Water rescue (swimming pool)
• Building/structure collapse (small)
• Confined space rescue
• High angle rescue
• Ice rescue
• Machinery/industrial rescue
• Minor rescue – multiple pts
• Mud rescue
• Mud rescue – multiple pts
• MVC vehicle into building
• MVC vs bus/train/heavy vehicle
• MVC with extrication
• MVC with injuries – 5+ pts
• Trench rescue
• Vehicle in water
• Water rescue - swift
• Water rescue (swimming pool) – multiple pts
• Building/structure collapse (large)
• Natural/Manmade disasters
• Emergency medical –1 to 2 patients
• Emergency medical - 3 to 4 patients
• Locked in a vehicle – extreme temp (<32 or >70 degrees)
• Minor rescue – 1 pt
• MVC minor or unknown injury
• MVC with pedestrian/bicycle struck – 1 pt
• MVC with injuries – 3 or 4 patients
• MVC with pedestrian/bicycle struck – 2 to 4 patients
• Boat accident (on water)
• Flood water rescue (large)
• Flood water rescue (large) – multiple pts
• Flood water rescue (small)
• Flood water rescue (small) – multiple pts
• Water rescue
Table 61: Risk Classification - Hazardous Materials Low Risk
• Carbon monoxide detector – no symptoms
• Fluid clean-up/washdown
• Fuel spills 55 gallons or less
• HazMat – unknown type of material
• Odor investigation unknown
• Odor of natural gas outside
• Fuel spills > 55 gallons
• Fuel spills > 55 gallons – 1 pt
• Natural gas/propane line break inside (commercial)
• Natural gas/propane line break inside (commercial) –1 pt
• Natural gas/propane line break inside (residential)
• Natural gas/propane line break inside (residential) – 1 pt
• Odor natural gas/propane inside (commercial)
• Odor natural gas/propane inside (commercial) – 1 pt
• Carbon monoxide detector with symptoms
• EOD threat/bomb (no explosion)
• Fuel spills 55 gallons or less – 1 pt
• HazMat – unknown type material – 1 pt
• Natural gas/propane line break outside
• Natural gas/propane line break outside – 1 pt
• Odor investigation unknown – 1 pt
• Odor of natural gas/propane inside – (residential)
• Odor natural gas/propane inside (residential) – 1 pt
• Odor natural gas/propane outside – 1 pt
• Carbon monoxide with symptoms – multiple pts
• Fuel spills >55 gallons – multiple pts
• Fuel spills 55 gallons or less - multiple pts
• HazMat – unknown type material – multiple pts
• HazMat chemical spill or release (not fuel)
• Natural gas/propane line break inside (commercial) –multiple pts
• Natural gas/propane line break inside (residential) –multiple pts
• Natural gas/propane line break outside – multiple pts
• Odor investigation unknown – multiple pts
• Odor natural gas/propane inside (commercial)multiple pts
• Odor natural gas/propane inside (residential) –multiple pts
• Odor natural gas/propane outside – multiple pts
• Radiological incident
• HazMat mass casualty
There are currently seven planning zones within the city, one for each contracted service area, for a total of nine. Inside each planning zone within the city is a deployment location for emergency operations: a fire station. These zones were identified by evaluating all emergency responses within the city and contract areas and plotting the first fire apparatus on scene. Drive time analysis from stations was used on areas with consistent responses from more than one station. Following is a map of all planning zones, as well as all nine individual planning zone maps and risk analyses for each.

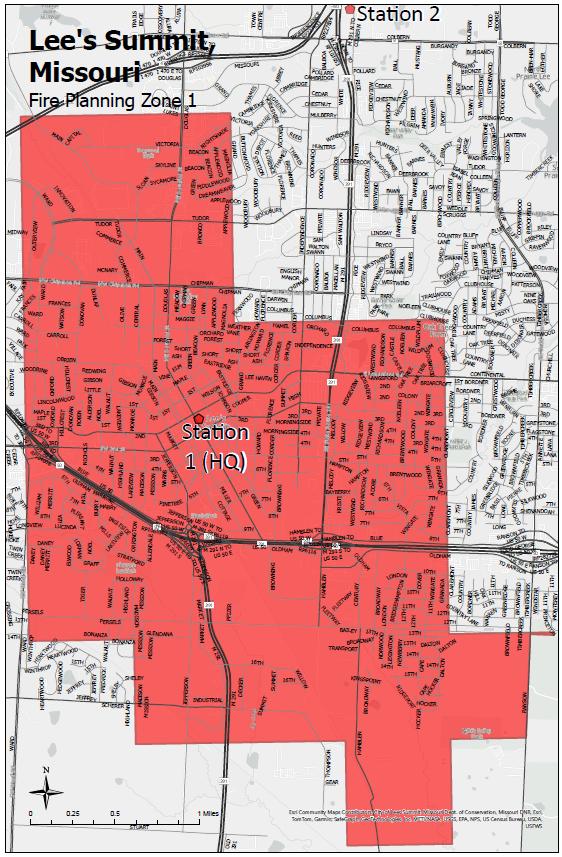
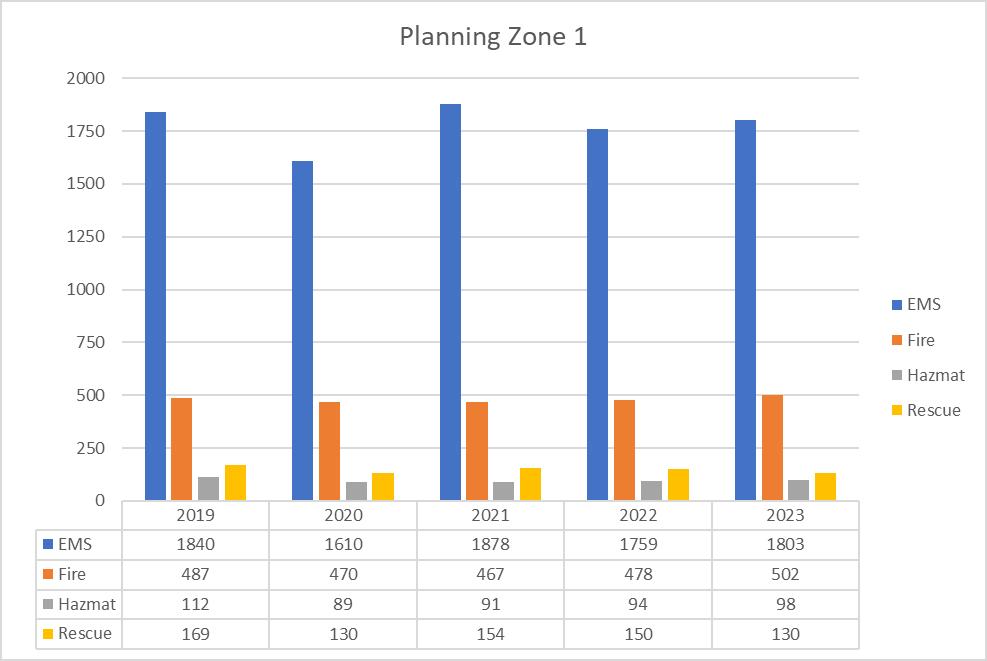
12: Call Demand - Planning Zone 1 (2019-2023)
This planning zone is comprised of dense residential, light commercial, and industrial occupancies. The zone contains the historic downtown district in which buildings are packed closely together, and many of the buildings were constructed around the turn of the twentieth century. The historic downtown also contains Lee’s Summit City Hall. The zone contains two high schools, a secondary technology academy, a private school, a middle school, and four elementary schools. Commercial occupancies contain a mix of industrial processing, big box stores, and commercial strip malls.
Residential areas in the Downtown core have been added throughout the history of the city, allowing for a wide variation in construction types and age. Multi-family housing exists throughout, with the majority being duplexes or townhomes. There are numerous garden style apartment complexes that are aging, and the demographics of these multi-family residences tend to generate a higher emergency medical response demand. In recent years there has been a significant amount of apartment units built in this zone, including along Chipman Road and in the Downtown core. There are also several senior living and care facilities in this zone. The Lee’s Summit Housing Authority has two different locations within this zone.
US 50 Highway runs through the middle of this planning zone east/west and is a conduit for traveling from areas to the east of Lee’s Summit into Kansas City. M-291 Highway runs north and south through this zone. US 50 Highway connects with M-291 Highway in two separate locations. Union Pacific railroad runs the length of this planning zone north/south and has four intersections controlled by crossing gates.
The City’s historic downtown contains several blocks of older buildings. Many buildings can be dated back around 100 years and contain numerous void spaces for fire to advance. Although some have been updated, most lack modern fire protection systems.
Due to demographics and socioeconomic makeup, the downtown district generates a high demand for emergency medical services. There is also a nursing home and senior living facilities that generate higher demand.
The most common risk for hazardous conditions response is for residential emergencies involving carbon monoxide and natural gas. The industrial areas spread around this planning zone offer a high risk for hazardous conditions emergencies depending on the manufacturing processes involved. Hazards also exist with rail traffic coming through the downtown district with the potential for train derailment involving hazardous materials.
The corridors of US 50 Highway and M-291 Highway pose the greatest risk for motor vehicle accidents.
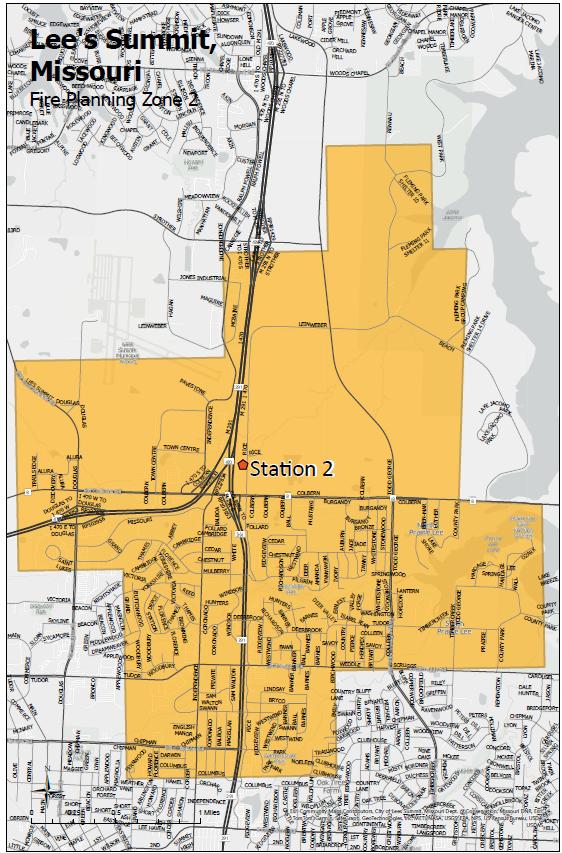
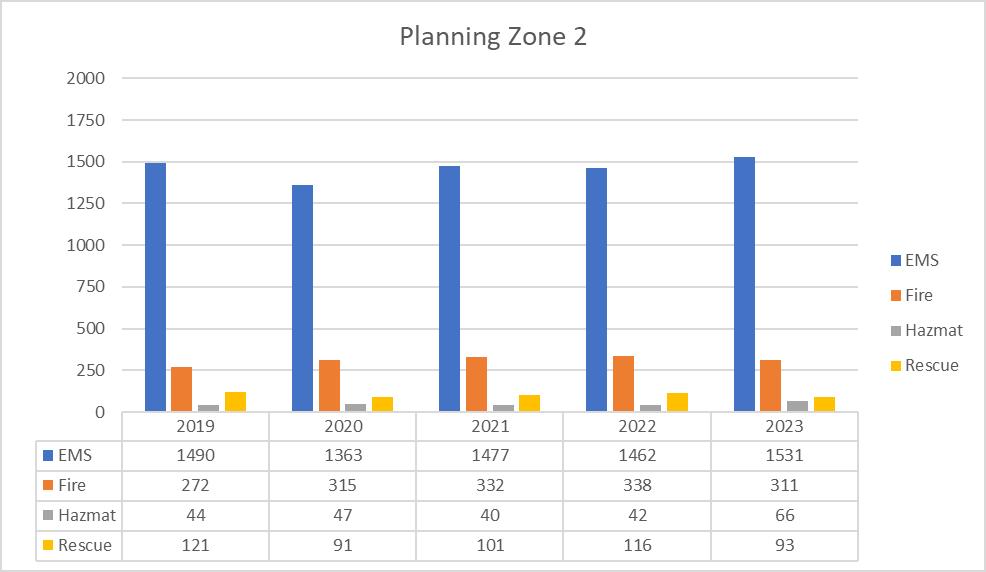
Figure 13: Call Demand - Planning Zone 2 (2019-2023)
This planning zone may be one of the more diverse zones within the City of Lee’s Summit. This planning zone is comprised of dense single-family and multiple-family residential structures. It includes two elementary schools, one middle school, and multiple early childhood care businesses. Along Colbern Road, early morning and afternoon congestion must be noted due to a middle school, elementary school, and early childhood care, as this can impact response to the east of the nearest fire station. I-470 and M-291 converge in the middle of this zone. Access to the northern part of the city can be impacted due to traffic congestion on I-470 at certain times of the day. Along M-291, several large intersections present a moderate risk to EMS and technical rescue services.
This planning zone has a wide range of residential structures. These include multiple large apartment complexes, duplexes, fourplexes, and single-family residences of 1000 to 4000+ square feet.
Demographic and socioeconomic factors are wide-ranging within this zone and will contribute to the variations on a heat map for calls for service in certain areas. There are several commercial zones within the area including light industrial. Saint Luke’s Lee’s Summit Hospital (238-bed facility) offers an emergency room, ICU, maternity, and various other specialties via 24-hour service to the community. Lee’s Summit Municipal Airport is partly within the borders of this zone and is a focal point of growth within the City of Lee’s Summit. The western edge of the zone’s border is in the early construction phases for major community development. Discovery Park is an approximately 268-acre development that will consist of retail, restaurants, general and medical offices, entertainment, hospitality, and luxury multi-family housing, creating a live, work, and play culture. Property Reserve Incorporated (PRI), owner of much of the property on the east side of the planning zone, has released the land for development. Close attention must be paid to this multi-year development and its impact on services.
Highest Fire Risk Location(s)
The highest fire risk is the multi-story non-sprinklered apartments. The greatest impact from a fire would be in Saint Luke’s East Hospital due to the critical nature of the facility and the number of patients incapable of self-preservation.
Highest EMS Risk Location(s)
Solstice Senior Living poses the highest risk to EMS resources within this zone. With the full capacity of a 120-unit facility with a high risk demographic and no caretakers on site, EMS service demand will continue to remain high if not increase. A multi-story senior living, assisted living, and memory care has been approved for the area and will likely have an impact on EMS call volume.
Highest Hazardous Conditions Risk Location(s)
This zone includes light industrial, carbon monoxide events from the multiple types of residential and commercial structures that remain a high probability. With the interstate, there are potential vehicle accidents involving hazardous materials in transit. The most protected hazardous materials facility is the radiation therapy unit at Saint Luke’s East Hospital, containing a gamma source.
Highest Technical Rescue Risk Location(s)
The converging roadways of M-291 Highway and I-470 pose the greatest risk of motor vehicle collisions within this area. The intersections along M-291 at Tudor, Chipman, and Scruggs also present a high risk of motor vehicle collisions. The spillway at Prairie Lea Lake has been the location of several high-angle and water rescues over the years. As the airport gets busier, the potential for aircraft emergencies increases.
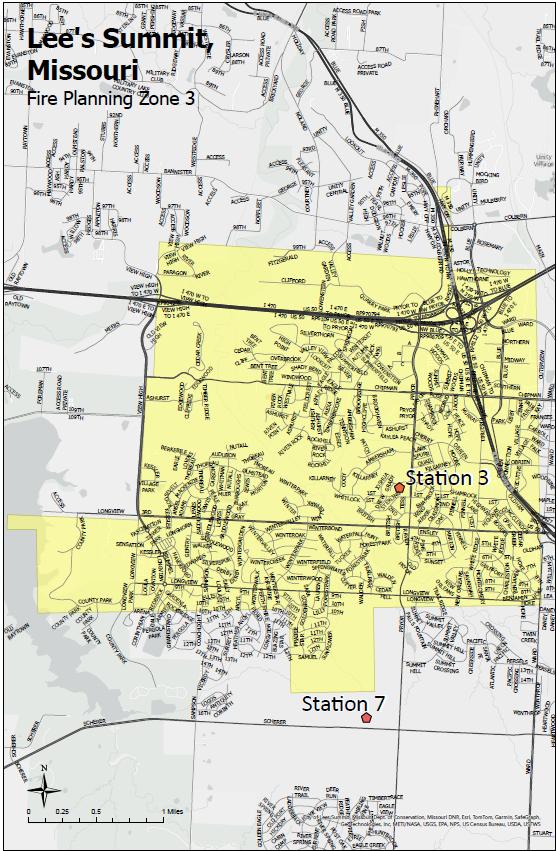
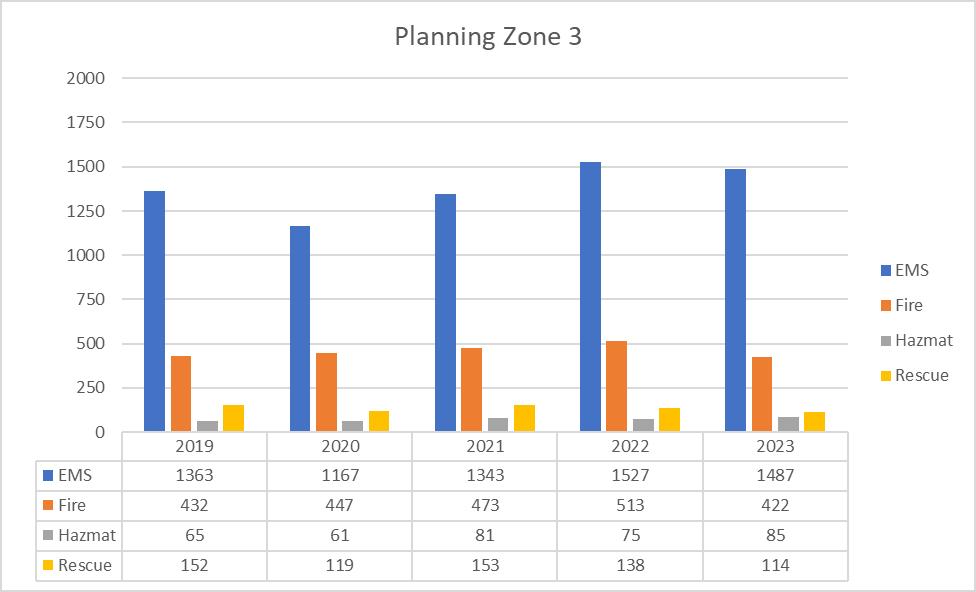
14: Call Demand - Planning Zone 3 (2019-2023)
This planning zone is comprised of dense residential, one private and two public elementary schools, a community college, light commercial, two large outdoor shopping malls, along with two large facilities holding corporate offices. The residential areas consist largely of single-family homes, duplexes, and two large apartment complexes.
John Knox Village retirement community sits on approximately 200 acres and contains a nursing home, assisted living facilities, apartments, townhomes, and single-family homes. There is also a medical office building located on the periphery of John Knox Village. There are two other independent nursing homes in this planning zone.
Commercial occupancies line the frontage roads of US 50 Highway, and both outdoor shopping malls contain businesses with large, big box style occupancies. The majority of businesses in this planning zone are sprinklered.
The southwest corner of this planning zone contains a portion of Longview Lake and the county park with outdoor shelters. US 50 Highway runs through this planning zone north/south and intersects with I-470, which runs east/west.
The northeast section of this planning zone contains a new development that includes a large outdoor soccer complex and a mix of commercial occupancies that are in the process of being completed. This area also includes a large quarry area.
Highest Fire Risk Location(s)
The outdoor shopping malls contain large, big box-style retail occupancies. While most occupancies are sprinklered, there is a risk to property and firefighter safety due to the large and densely packed occupancies. There are also several large multi-family residential complexes within this planning zone.
Highest EMS Risk Location(s)
John Knox Village retirement community is a large area that has a high demand for emergency medical services.
Highest Hazardous Conditions Risk Location(s)
Due to the composition of this planning zone being primarily residential and retail, the highest risk probability for a hazardous material incident would be a carbon monoxide event in a residential or commercial structure.
Highest Technical Rescue Risk Location(s)
I-70 and US 50 Highway pose the greatest risk for motor vehicle accidents in this planning zone. During the summer months, the use of the public lake increases the risk for rescue services.

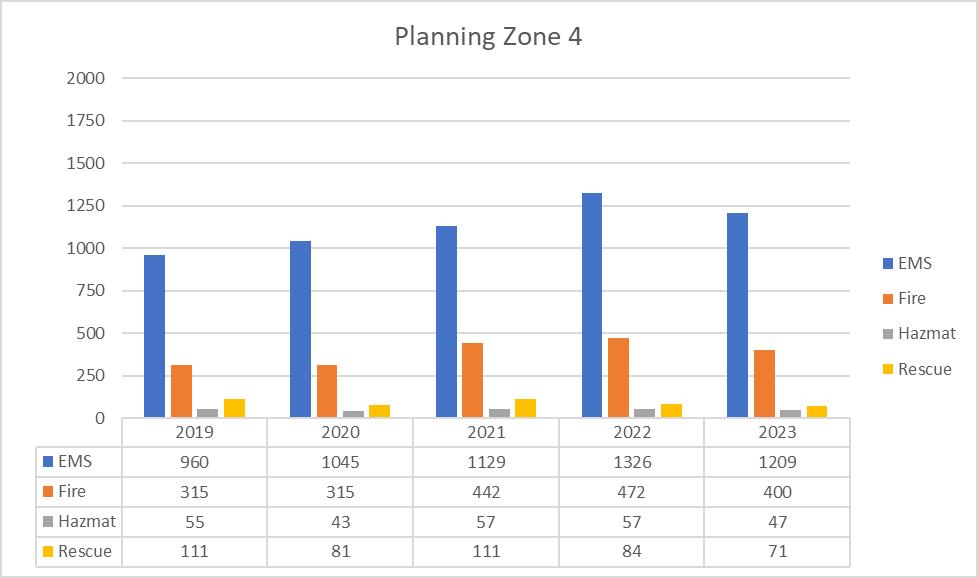
Figure 15: Call Demand - Planning Zone 4 (2019-2023)
This planning zone is predominantly comprised of single-family residential structures and neighborhoods. Residential structures vary from approximately 1000 square feet up to 10,000+ square feet. There is a large multifamily complex with three-story garden-style apartments and two-story townhomes (35 buildings in the complex).
Servicing the education of the citizens are two elementary schools belonging to the Blue Springs School District R-4, one middle school (R-4), and a private Catholic high school. A large nursing care facility that provides 24-hour care to rehab and memory care patients is at the southern end of the zone. In the northern portion of the zone is a 1.2 million square foot developed subterranean space in a former limestone mine.
A large section of the northwest part of the area is covered by the Lakewood Property Owners Association. It is a 2,200-acre master-planned community with a lake and golf course. In the northeast section of the zone lies the northwest part of Blue Springs Lake. Public access to the lake is made by a public marina, public boat dock and public beach. Also located in this area is a year-round campground. This zone is also where the Bryan Pottberg Memorial Park is located. Development over the past few years in the area has seen commercial growth increase and multifamily structures increase.
The southern area includes the northern part of Lee’s Summit Municipal Airport. As the airport gets busier, the potential for aircraft emergencies increases.
Moving north, there is a high concentration of medical offices with multiple specialties. The planning zone is split east and west by I-470, which has high congestion on the southbound side in the morning and on the northbound side in the evening. The fire station in this area recently has been moved farther to the north to provide better coverage and access to the northern parts of the City of Lee’s Summit.
Large (greater than 3,600 square feet) single-family residential structures are a high risk fire hazard for this zone, requiring large amounts of water and staffing to complete tasks. In the northern portion of the zone is a 1.2 million square foot developed subterranean space in a former limestone mine. The Federal Government is the primary tenant and uses the space for records storage. Although the space is fully sprinklered, any fire event would have a significant impact and risk to tenants and firefighters due to it being underground.
Jackson County operates a Group 5 youth detention facility in the planning zone. Although sprinklered, the facility has had several intentionally set fires in the past, and evacuating the occupants may be difficult.
Wilshire at Lakewood and Cross Creek Memory Care will continue to be the highest risk for EMS services in this zone. This area also has the Kansas City Cancer Center, this is a cancer treatment center that has a high demand for EMS calls. A third multi-story senior living facility is being built, which will further add to the EMS demand.
Due to the composition of this area being primarily residential and retail, the highest risk probability for a hazardous material incident would be a carbon monoxide event in a residential or commercial structure. Other hazardous materials risks include a gamma radiation source at the Kansas City Cancer Center and an 8-inch high-pressure hazardous products pipeline owned by Holly Frontier (formerly Sinclair) that enters the City along the west border of the zone and leaves in the northeast corner of the zone. The pipeline runs through several neighborhoods, placing them in a High Consequence Area (HCA) in the event of a failure.
I-470 poses the greatest risk for motor vehicle collisions within this area, but it must be noted that during the summer months, the use of private and public lakes increases the risk for rescue services.
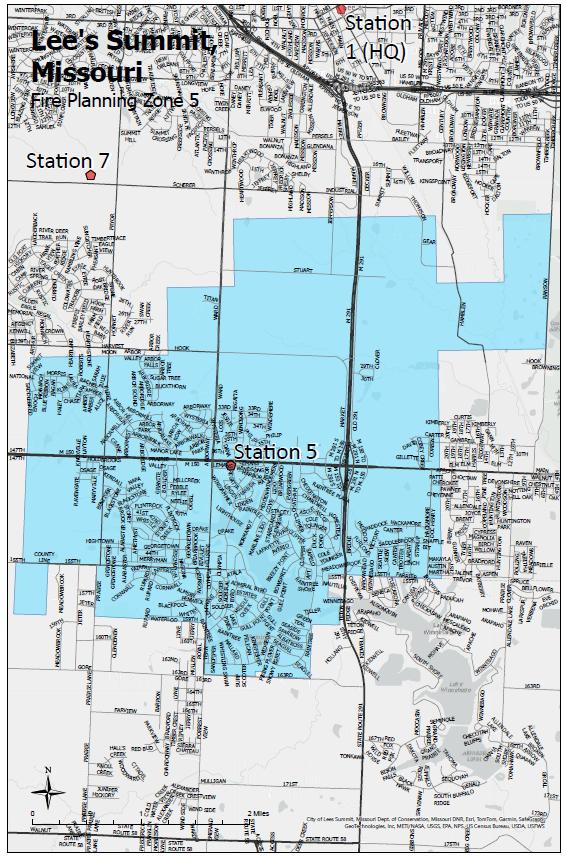
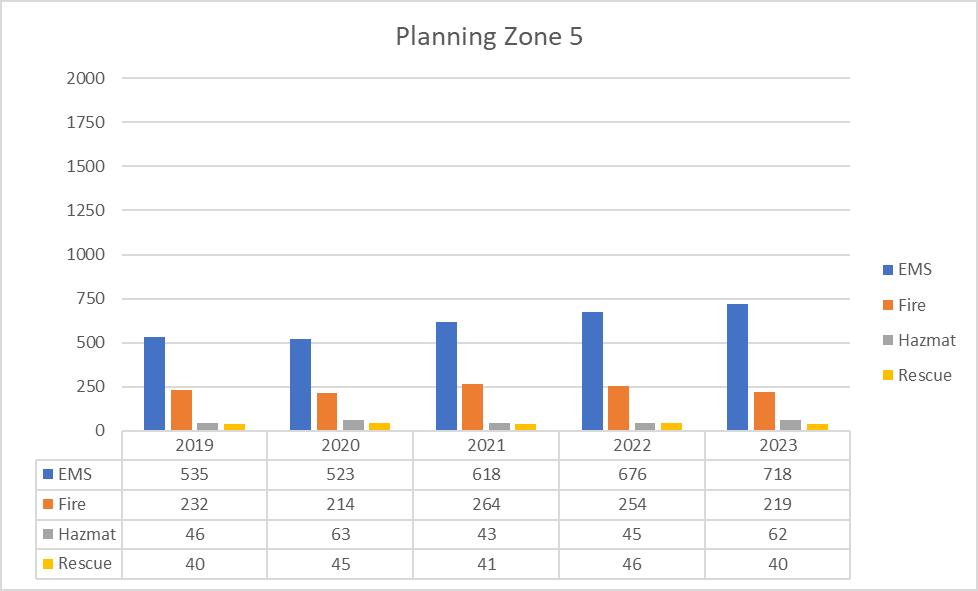
Figure 16: Call Demand - Planning Zone 5 (2019-2023)
Planning Zone Characteristics
This planning zone includes a lake community, Raintree, and a mix of residential and commercial. The residential component is primarily single-family homes with some apartment complexes and multiplex townhomes. The commercial portion of the zone lines M-150 Highway, with Walmart and a Price Chopper grocery store being the largest staples in the area. M-150 Highway is a major thoroughfare that runs east/west with multiple controlled intersections along the route. M-150 Highway provides access to Greenwood to the east and I-49 in Kansas City to the west. Also intersecting the zone is M-291 Highway, a major thoroughfare that runs north/south through the city. The zone has an elementary school as well as a middle school. Currently under construction in this zone is Raintree Village, a large senior living facility with independent living, assisted living, and short-term and long-term rehab that is set to open in 2025.
Highest Fire Risk Location(s)
Lemans Lane is a narrow street with four-plex townhomes, and these townhomes are unprotected by a fire suppression system, nor do they have a monitored fire detection system. These units pose a threat to rapid fire propagation with multiple residents affected.
Highest EMS Risk Location(s)
Currently, Lemans Lane drives a large number of emergency medical responses. With the opening of Raintree Village, it can be expected to see the highest EMS risk to be placed at this facility as historically, nursing homes request a high number of emergency medical responses.
Highest Hazardous Conditions Risk Location(s)
With the nature of the response zone being primarily residential and retail, the highest risk probability for a hazardous material incident would be a carbon monoxide event in a residential or commercial structure.
Highest Technical Rescue Risk Location(s)
The M-291 and M-150 Highway thoroughfares running through the planning zone pose the highest rescue risk for motor vehicle collisions. During the summer months, the use of Raintree Lake increases the risk for rescue services.
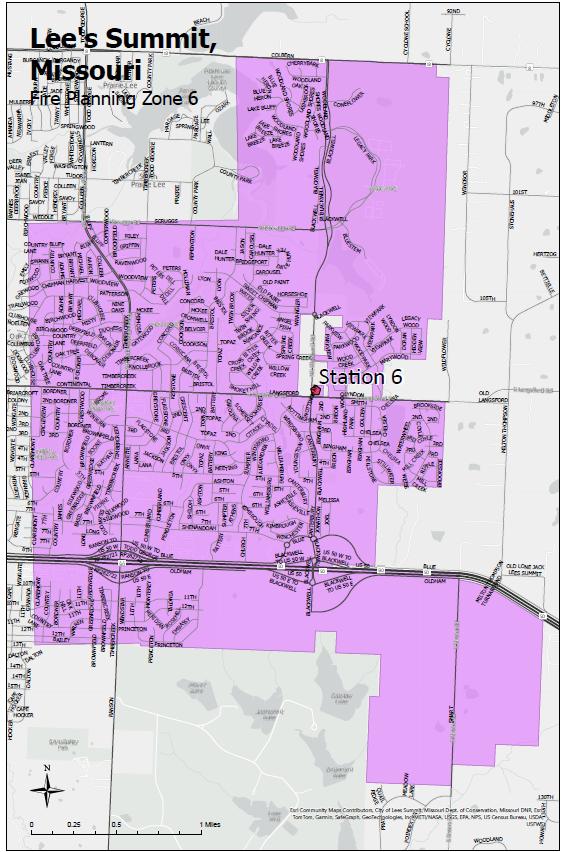
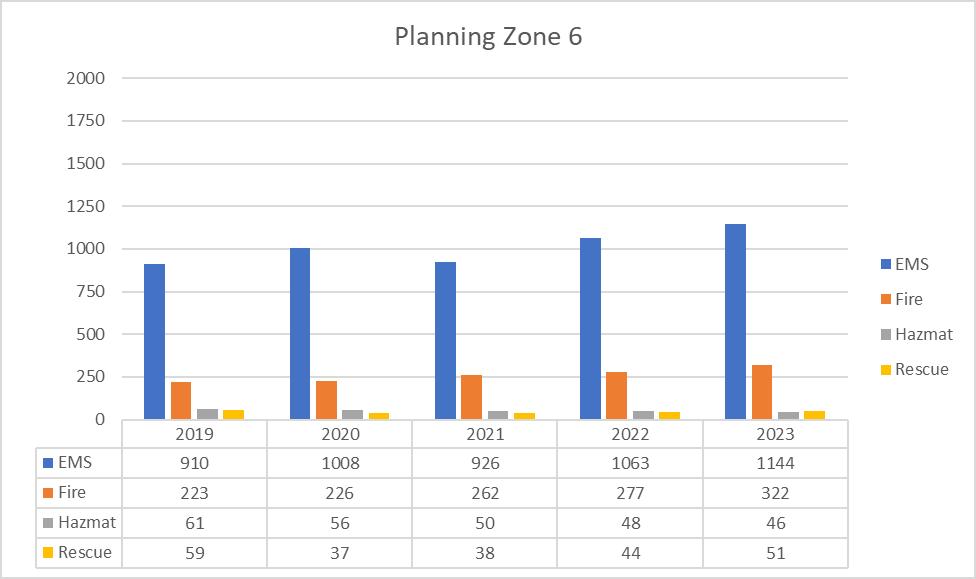
Figure 17: Call Demand - Planning Zone 6 (2019-2023)
Planning Zone Characteristics
This planning zone is primarily residential with commercial pockets. The residential component is primarily singlefamily homes with some duplex and multi-plex townhomes. Five of Lee’s Summit R-7 School District’s facilities are located within this response zone: four elementary schools and one middle school. This response zone also includes parts of Prairie Lee Lake, a small lake surrounded by homes. Legacy Park is a unique feature of this response zone, a 692-acre park with three shelters, a community center, a 22-acre lake, a disc golf course, an amphitheater, sports fields, and 4.7 miles of trails.
Lee’s Summit Medical Center (LSMC), one of Lee’s Summit’s two hospitals, is located within this response zone. LSMC is a Level II stroke and STEMI center offering 24/7 emergency care as well as many additional inpatient and outpatient services. There are two nursing homes, Princeton Senior Living & Addington Place. The response zone also is home to The Village Cooperative, a three story 55 and over apartment complex. US 50 Highway passes through this district, running east and west. Currently, there is an expansion of new homes being built with the development of the Bailey Farms subdivision at Ranson Road and Bailey Road, as well as a multi-story apartment complex under construction near Blackwell Road and Oldham Parkway.
Highest Fire Risk Location(s)
Fourplex townhomes located in the vicinity of Churchill Street and Knollbrook Street are unprotected by a fire suppression system, nor do they have a monitored fire detection system. These units pose a threat to rapid fire propagation with multiple residents affected.
The greatest EMS risk would be Princeton Senior Living. As a nursing home with independent living, assisted living, and memory care, the facility generates a large number of EMS calls. It is notable to mention that Addington Place and The Village Cooperative may pose an increased risk due to the nature of their operation. Lee’s Summit Medical Center also poses a high EMS risk due to the requirement for non-emergency and emergency transfers.
With the nature of the response zone being primarily residential and retail, the highest risk probability for a hazardous material incident would be a carbon monoxide event in a residential or commercial structure.
With US 50 and M-291 Highways running through the planning zone along with multiple controlled intersections, the highest rescue risk is for motor vehicle collisions.
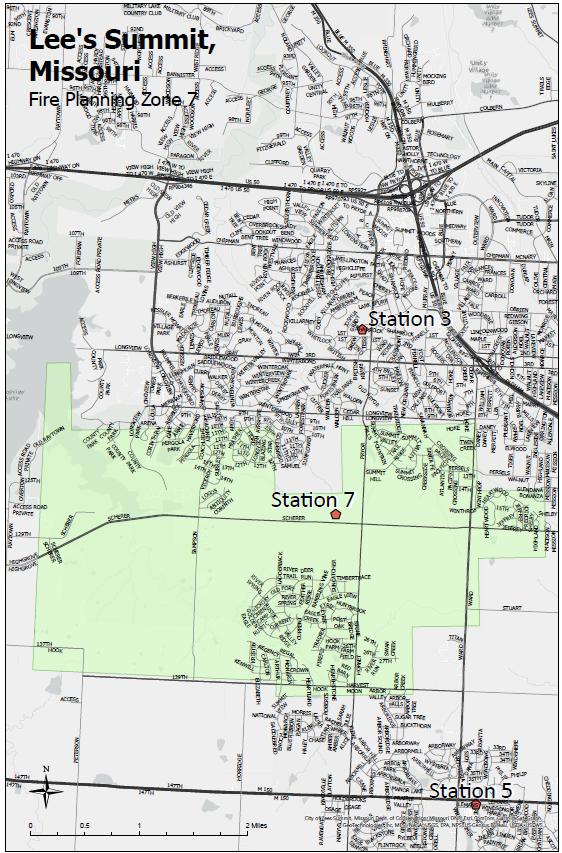
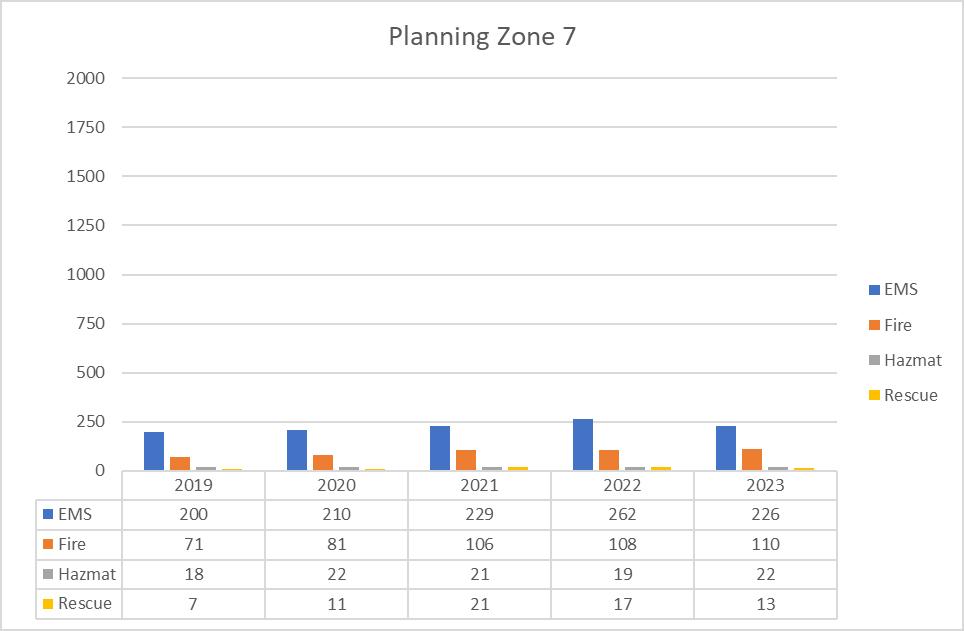
Figure 18: Call Demand - Planning Zone 7 (2019-2023)
Planning Zone Characteristics
This planning zone is comprised primarily of single-family residences and open agricultural areas. There is limited multi-family housing in the Eagle Creek subdivision. There is an elementary school located at the southeast corner of the planning zone that generates moderate traffic during the beginning and end of school days. Part of Longview Lake and the Mouse Creek boat ramp lay along the western edge of the planning zone. The county park, outdoor shelters, and gathering areas are located adjacent to Longview Lake. The Longview historic mansion hosts large gatherings.
Highest Fire Risk Location(s)
The highest risk for fires is the single-family residences that comprise the majority of occupancies.
Highest EMS Risk Location(s)
Multi-family residences in the Eagle Creek subdivision drive the largest percentage of emergency medical responses within this zone.
Highest Hazardous Conditions Risk Location(s)
With the nature of the response zone being primarily residential, the highest risk probability for a hazardous material incident would be a carbon monoxide event or natural gas emergency. The potential for risk exists also with the storage and application of chemicals used for agricultural purposes.
Highest Technical Rescue Risk Location(s)
The highest risk for rescue exists on and near Longview Lake. The lake is used for recreational boating, bringing the potential for boating accidents and water rescues.
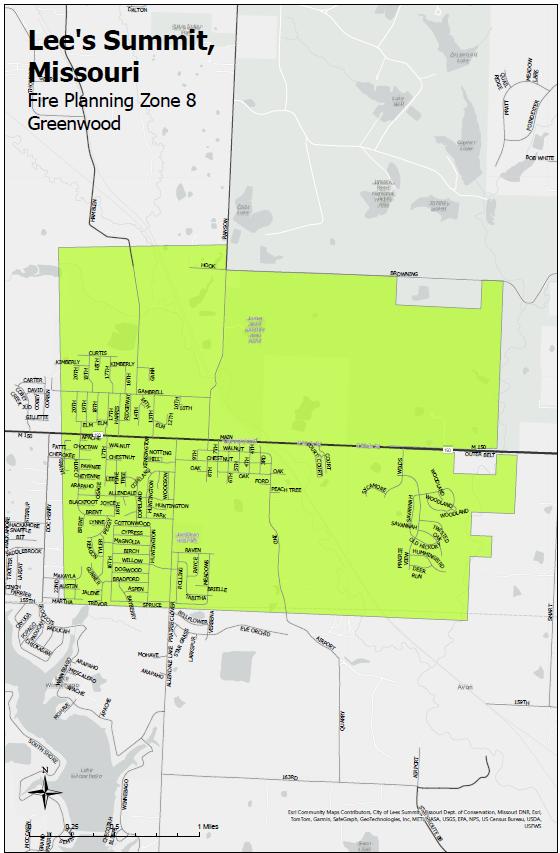
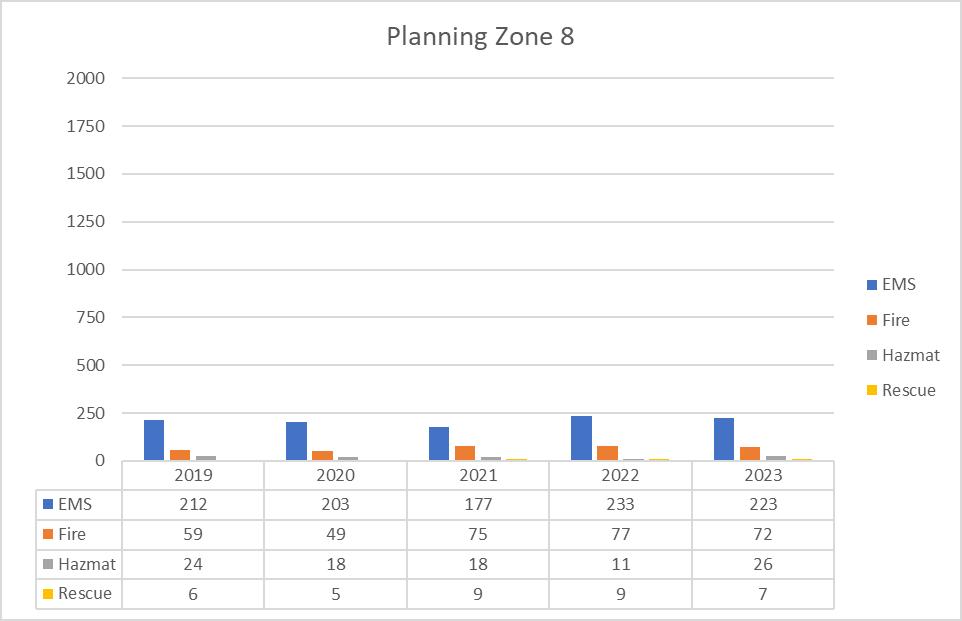
19: Call Demand - Planning Zone 8 (2019-2023)
The City of Greenwood, Missouri, makes up this planning zone. The city has a total area of roughly five square miles. The town has a small creek running through it in the southwest. The land area of Greenwood is mainly lightly wooded and open fields, along with several small ponds. A rail line comes into Greenwood from the southeast and heads north as it leaves the city. The area southwest of the rail line is mostly suburban, consisting of residential housing and a small downtown area with small commercial real estate. Greenwood Elementary School, which is a part of the Lee’s Summit R-7 School District, is located within this zone. Lee’s Summit Fire Department is a contract agency for the city, providing fire suppression, emergency medical, hazardous conditions, and technical rescue response services for the city. Additionally, a part of Greenwood falls into a dual response zone where response services are provided by the Lee’s Summit Fire Department and Southern Jackson County Fire Protection District.
Residential homes in the area between M-150 Highway & Gambrell Street pose the highest risk for potential fires. Most residential structures within this area were built over 50 years ago. Additionally, the water supply within this area is limited.
Additionally, Buckley Powder Co., which is a supplier of goods and services to the mining, construction, seismic exploration, and energy exploration industries, is in this zone. While this location historically has not generated many calls for service, the potential for a severe fire incident does exist.
Residential homes in the area of M-150 Highway and Allendale Road drive a large number of emergency medical responses within this zone.
With the nature of the response zone being primarily residential and retail, the highest risk probability for a hazardous material incident would be a carbon monoxide event in a residential or commercial structure. Buckley Powder Co., which historically has not generated many calls for service, has the potential for a severe hazardous materials incident.
The intersections along M-150 Highway running through the planning zone pose the highest rescue risk for motor vehicle collisions.
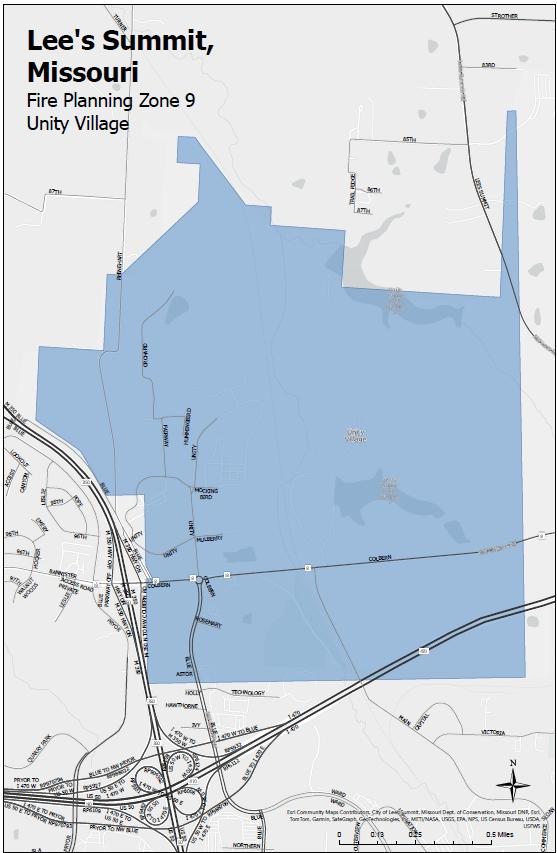
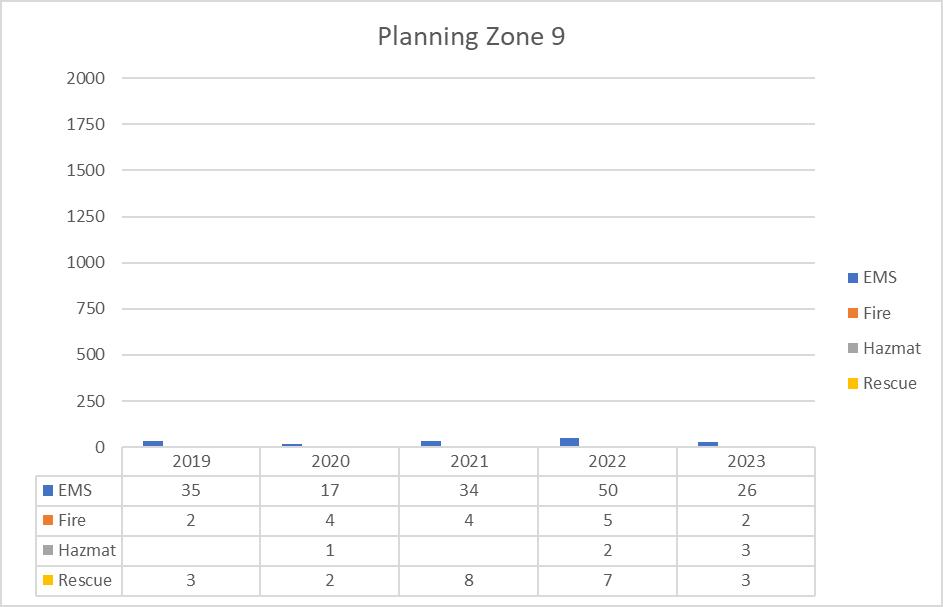
This planning zone is comprised mostly of wooded land but has a self-sustaining community located within it. Unity Village is a 1200-acre multi-use community for spiritual, corporate, and personal retreats. Lee’s Summit Fire Department is a contract agency for the city, providing fire suppression, emergency medical, hazardous conditions, and technical rescue response services for the city. It has a water treatment facility which provides water for fire suppression. There are two manufactured lakes for recreation, along with several miles of walking trails. There is a garden-style apartment complex, and this zone contains a railway utilized by Amtrak and operated by Union Pacific. The eastern edge of this zone will continue to develop rapidly with the Discovery Park development. Colbern Road, which splits the zone north and south, is currently seeing a major upgrade from a two-lane road to a four-lane road with improved intersections. Hazel Grove Elementary School is located on the west side of Unity Village.
The majority of the main Unity Village complex is protected by an automatic fire sprinkler system. However, the main complex of buildings is connected by a system of basement and below-grade service tunnels that could allow for fire and smoke to spread if not properly protected.
The interior fire hydrant system is served by the Unity Village water tower with a connection to the City of Lee’s Summit Water Utilities. Most recently Unity Village has been receiving water from the City of Lee’s Summit.
There is multifamily housing in this area that residents live in year-round. The campus in this area has a hotel and conference center that is occupied by visitors that come from all over the world. Several of the houses on the complex are rented out as vacation rentals.
There is a maintenance facility with onsite fuel storage for vehicles. Unity Village has a water treatment facility that could pose a hazardous conditions incident. The Union Pacific railroad runs through this area as well. This was the location of a train derailment in 2024.
Water rescues are possible on the lakes, and the potential for swift water rescues on two low-water bridges on Little Cedar Creek. High-angle rescues on the large concrete truss dam and from the six-story water/observation tower. An abandoned limestone mine exists on the property with the potential for illegal entry, resulting in subterranean search and rescue.
The appropriate deployment of resources is critical to the ability of any fire department to fulfill its core public safety and fire protection mission effectively, efficiently, and safely. In determining an acceptable level of risk, fire officials, city staff, and elected officials in every community must ask questions about the fire, technical rescue, emergency medical service (EMS), and hazardous conditions mitigation resources, such as:
1) What level of protection do we need?
2) What level of protection can we afford?
To provide maximum benefit to the community, fire departments must assess station locations and apparatus deployment methodologies. These are never easy decisions, especially when virtually any decision on emergency service deployment that involves moving and/or relocating a resource, even for the considerable benefit of the community as a whole, may have a negative impact on at least a small percentage of the population.
From the perspective of stations and apparatus, three main factors are evaluated to determine the optimum deployment of resources: response time, travel distance, and call volume.
For most evaluations, response time is the most critical factor for both structure fires and emergency medical incidents.
Heart attack and stroke victims require rapid intervention, care, and transport to a medical facility. The longer the time duration without care, the less likely the patient is to recover fully. Numerous studies have shown that irreversible brain damage can occur if the brain is deprived of oxygen for more than four minutes. In addition, the potential for successful resuscitation during cardiac arrest decreases exponentially with each passing minute that CPR or cardiac defibrillation is delayed.
Structural firefighting has become increasingly more challenging over the past 40 years due to the widespread use of plastic, synthetic, and foam-based materials in furnishings and construction. These materials ignite rapidly, produce intense heat and toxic smoke, and can double a fire’s size and intensity every 30 seconds. If firefighters don’t arrive quickly, a flashover, where all combustibles in a room ignite simultaneously, can occur in as little as five to seven minutes, requiring significantly more resources to control.
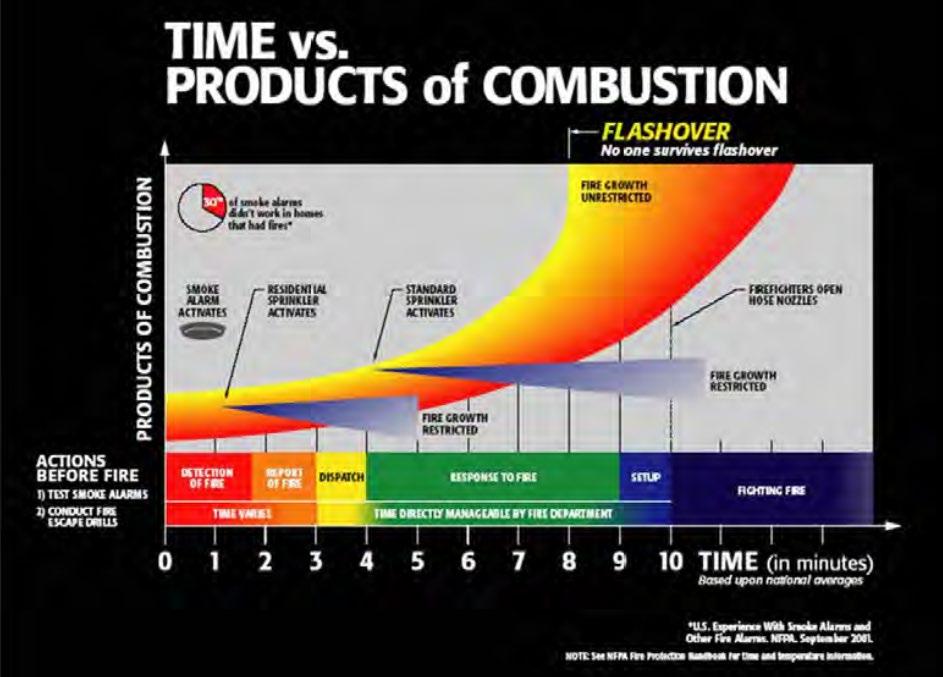
The rise in lithium-ion battery use in electronics, tools, and vehicles adds further risks, as these batteries can progress from smoke to explosion within 15 seconds, according to the U.S. Fire Administration (USFA).
Rapid response is critical upon arriving at a fire scene. The National Fire Protection Association (NFPA) recommends that initial fire attack operations begin within two minutes of arrival, 90% of the time. Fire departments must meet these standards to avoid the serious consequences of delayed responses, ensuring resources are ready and available.
The USFA’s report "Structure Fire Response Times" shows the impact of quick travel times. About half of fires confined to the room or floor of origin had a travel time of under five minutes, demonstrating the benefit of a prompt response in limiting damage. Longer response times correlate with fires spreading beyond the room or building, increasing risks to occupants and firefighters. The report underscores the need to meet response benchmarks, such as those set by NFPA Standard 1710.
Quick arrival enhances the ability to perform critical tasks like search and rescue, ventilation, and establishing water supply. Maintaining staffing levels, positioning resources strategically, and minimizing response barriers are essential for effective firefighting and improved outcomes.
NFPA Standard 1710 – Standard for the Organization and Deployment of Fire Suppression Operations, Emergency Medical Operations, and Special Operations to the Public by Career Fire Departments (2020 Edition), is the nationally recognized consensus standard on staffing and deployment by career fire departments.
The first arriving pumper or ladder truck company shall have travel time to arrive on the scene of fire suppression, hazardous conditions, or technical rescue incident within four minutes. The entire dispatched incident response should have travel time to arrive on scene within eight minutes. For EMS incidents, a unit with a first responder or higher-level trained personnel should arrive within four minutes, and an Advanced Life Support (ALS) unit should arrive on scene within eight minutes.
The Insurance Services Office (ISO) Fire Suppression Rating Scale also provides directions on the appropriate deployment and allocation of resources. ISO awards points in their Fire Suppression Rating Schedule based on a geographic deployment analysis and the 1710 evaluation. The geographical deployment is based on an analysis of roads within 1.5 road miles of pumpers and 2.5 miles of ladder trucks. During the agency’s last ISO evaluation, effective on June 1, 2017, the department improved from an ISO 3 rating to an ISO 2 rating. The department is scheduled to go through the ISO evaluation process beginning in early 2025 and will receive information in mid-2025 on any updates to the rating.
For Lee’s Summit Fire Department, planning zones provide the geographical division within the city that is utilized to measure response performance. Continuing to analyze data based on historical station response districts, current planning zones, and closest unit response data will aid strategic planning for placement, staffing, and additional resources required to ensure the department is effectively fulfilling its mission.
There are currently seven planning zones within the city and one for each contracted service area. Inside each planning zone within the city is a deployment location for emergency operations: a fire station. At all seven fire stations, there is a minimum of two fire apparatus within the deployment location. The department transitioned to
automatic vehicle locating (AVL) on all frontline apparatus and most reserve apparatus in 2019. This allows for the fastest routable deployments for all incidents within the city, Greenwood, and Unity Village. Fastest routable dispatching considers the location of all apparatus, roadway speeds, and closed road segments and then assigns the available units. Frequently, units will respond from different areas throughout the community. This occurs while performing emergent and non-emergent functions, such as training, business fire inspections, public education events, refueling, or maintenance transitions.
Each planning zone was evaluated in terms of area protected in square miles, road miles, and population. The call demand by day of week and time of day was also evaluated.
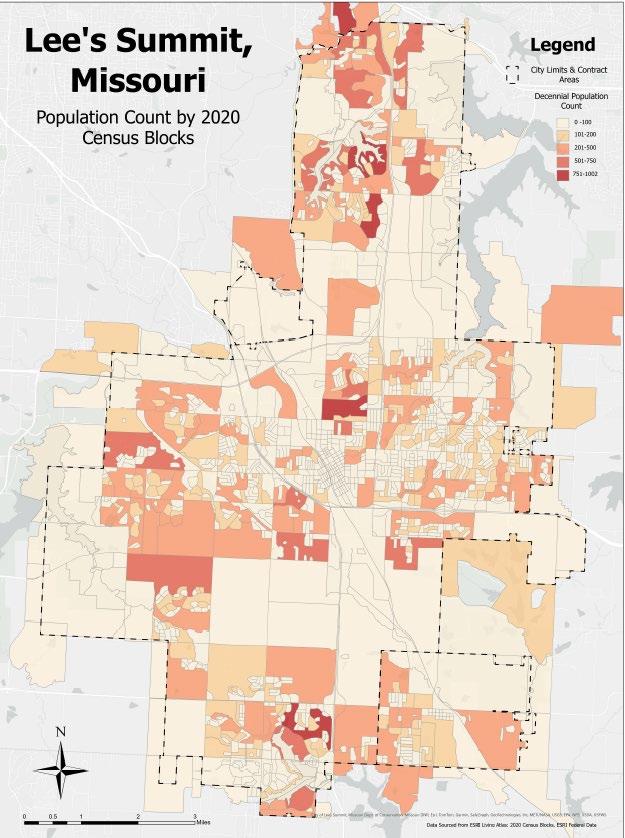
Travel Time Potential
To evaluate deployment capability against industry benchmarks, it is necessary to evaluate travel time polygons from fire stations. The following maps show the travel capabilities within four minutes from all current deployment locations. There is also a travel capability map for ladder trucks that are only housed at Stations 2, 3, and 7. This is the benchmark standard for a first-arriving resource at the 90th percentile of responses within urban density planning zones.
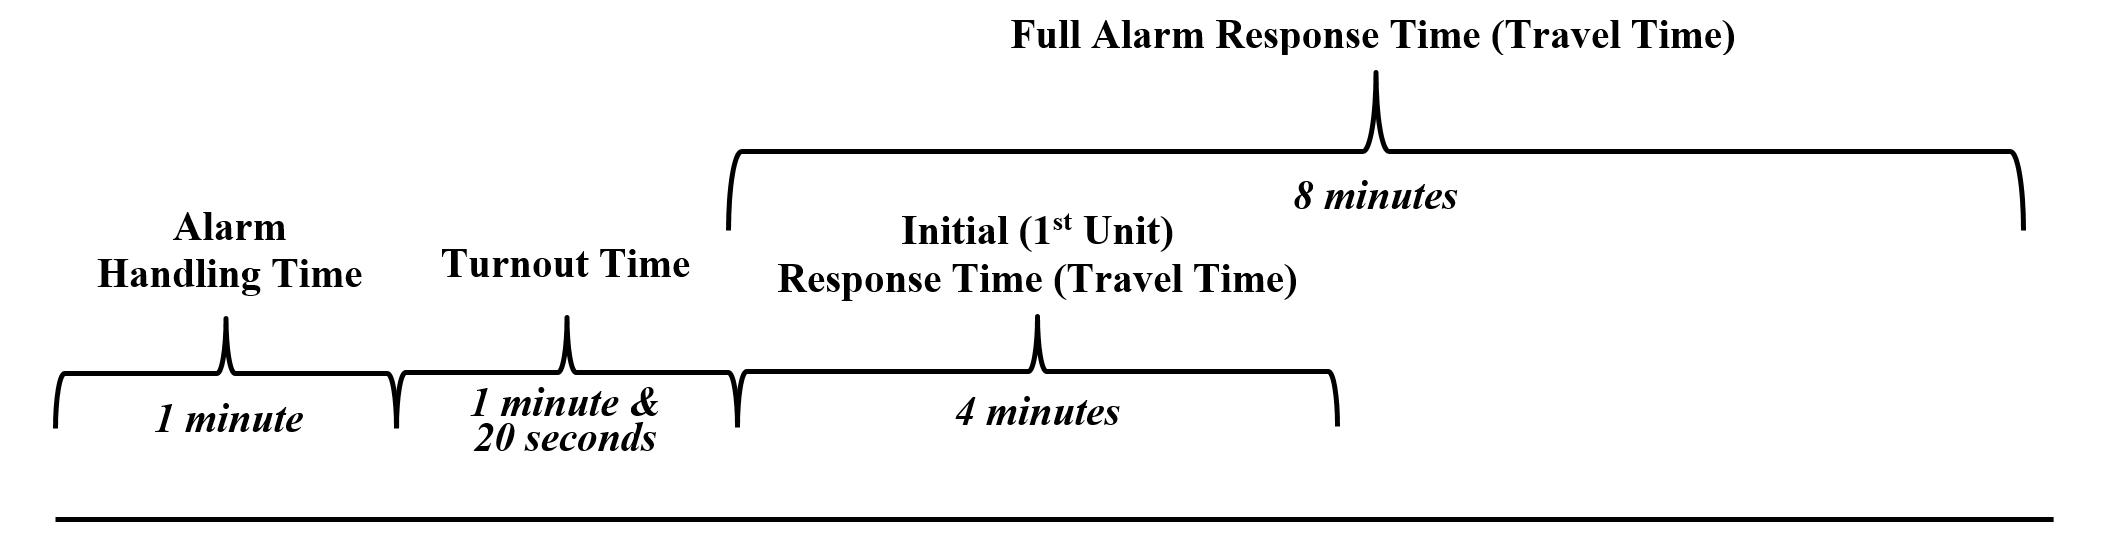
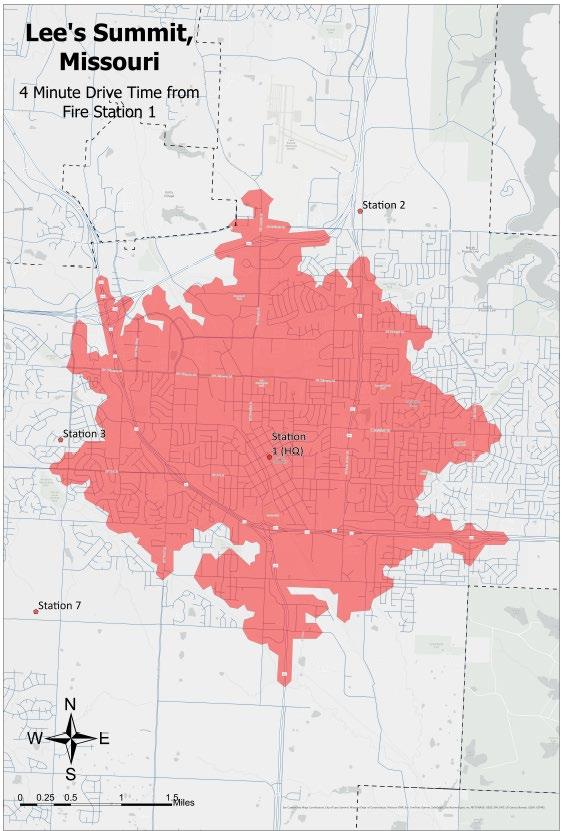
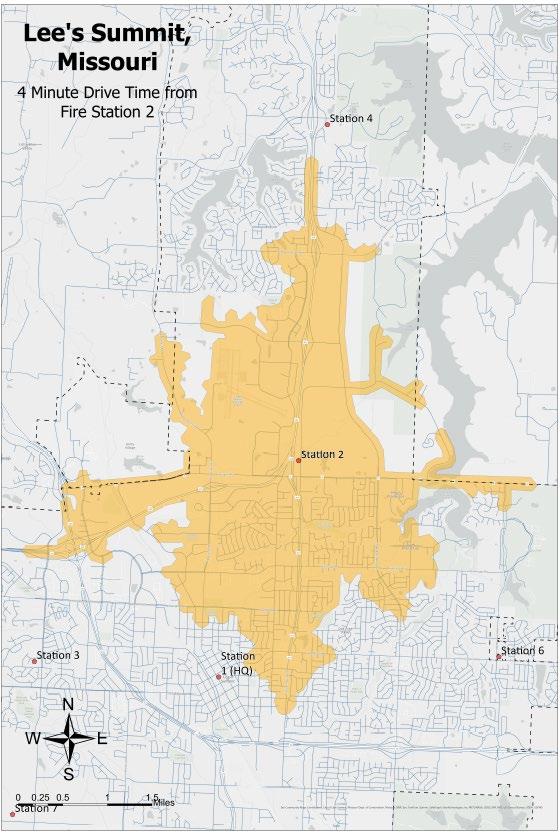
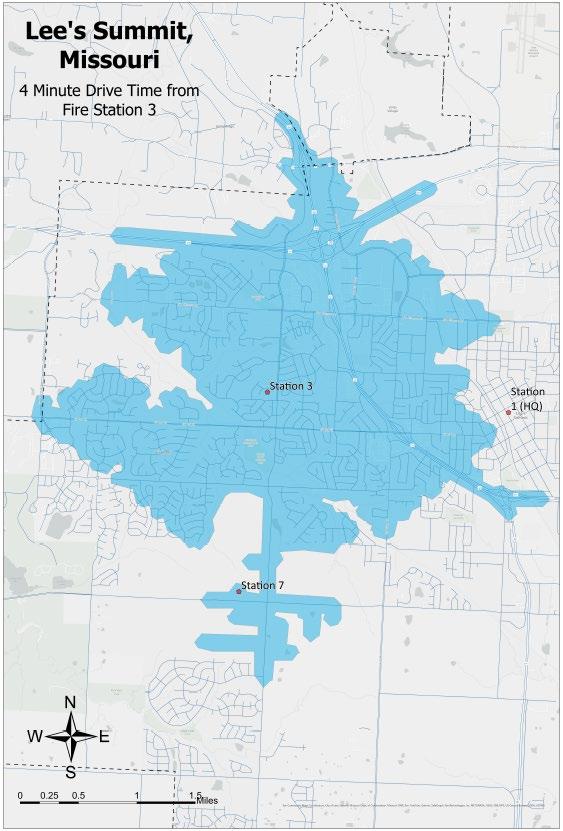
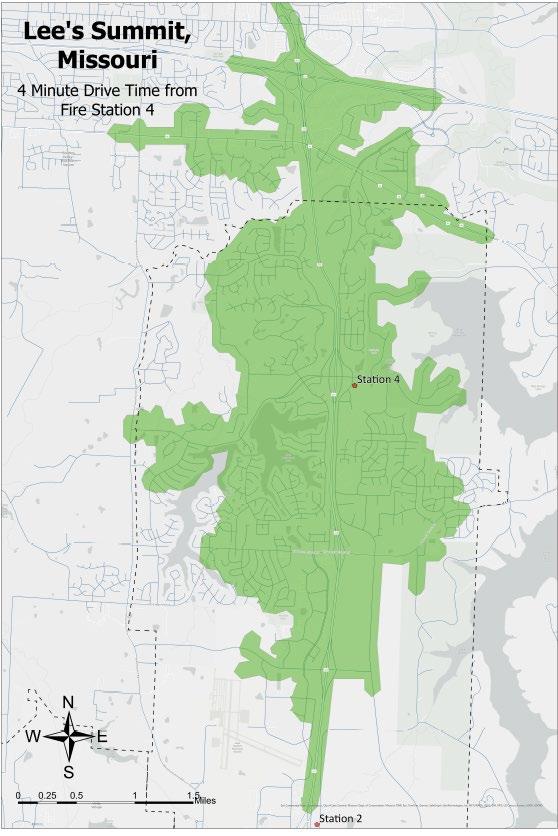
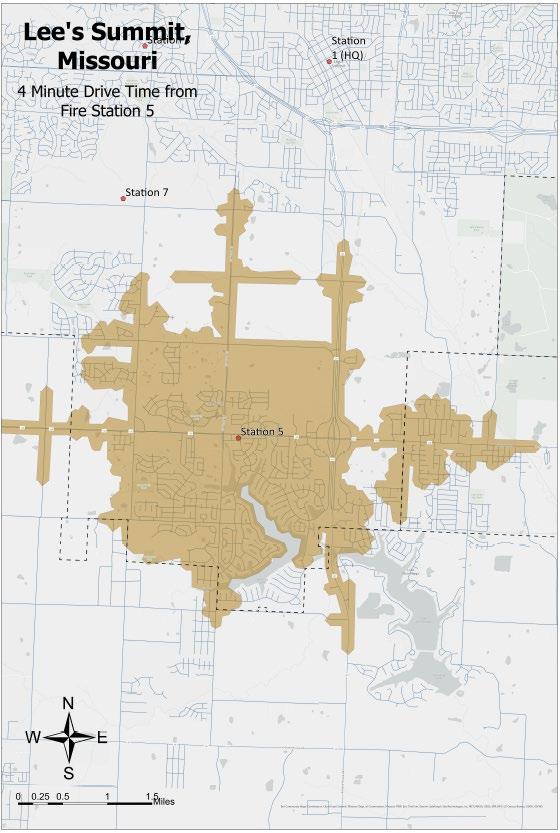
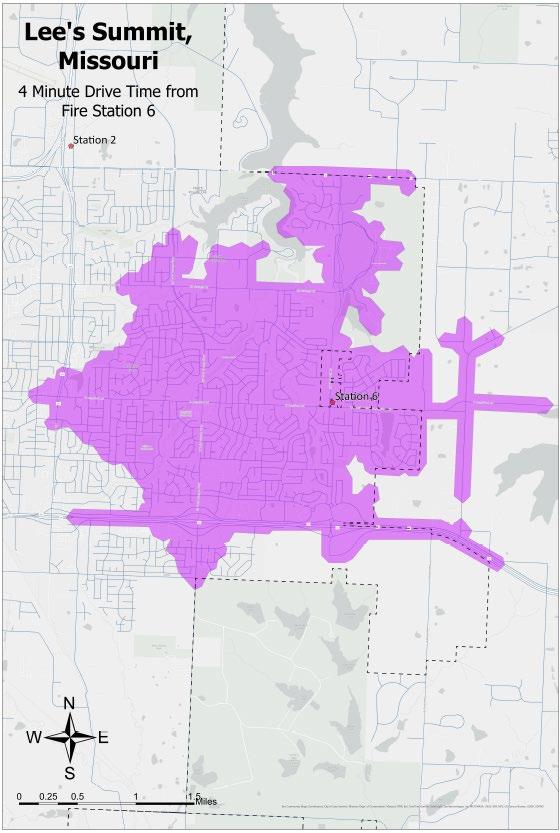
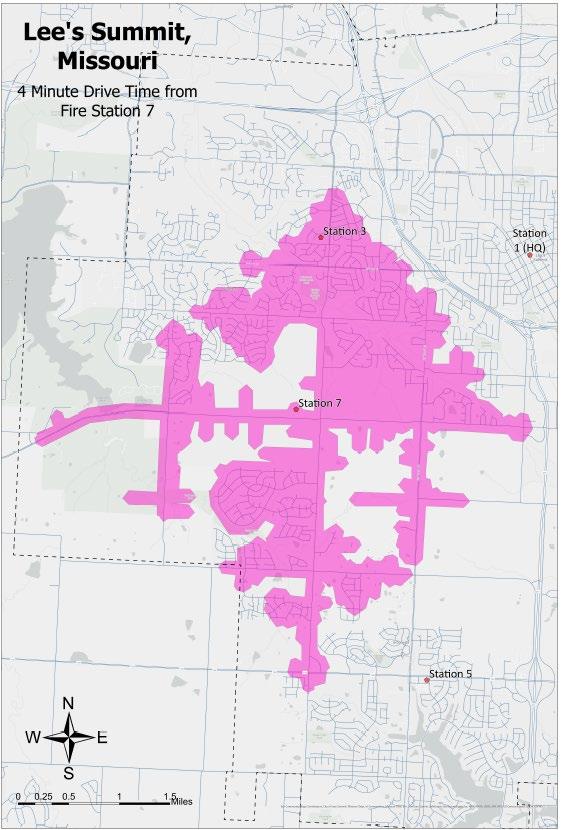
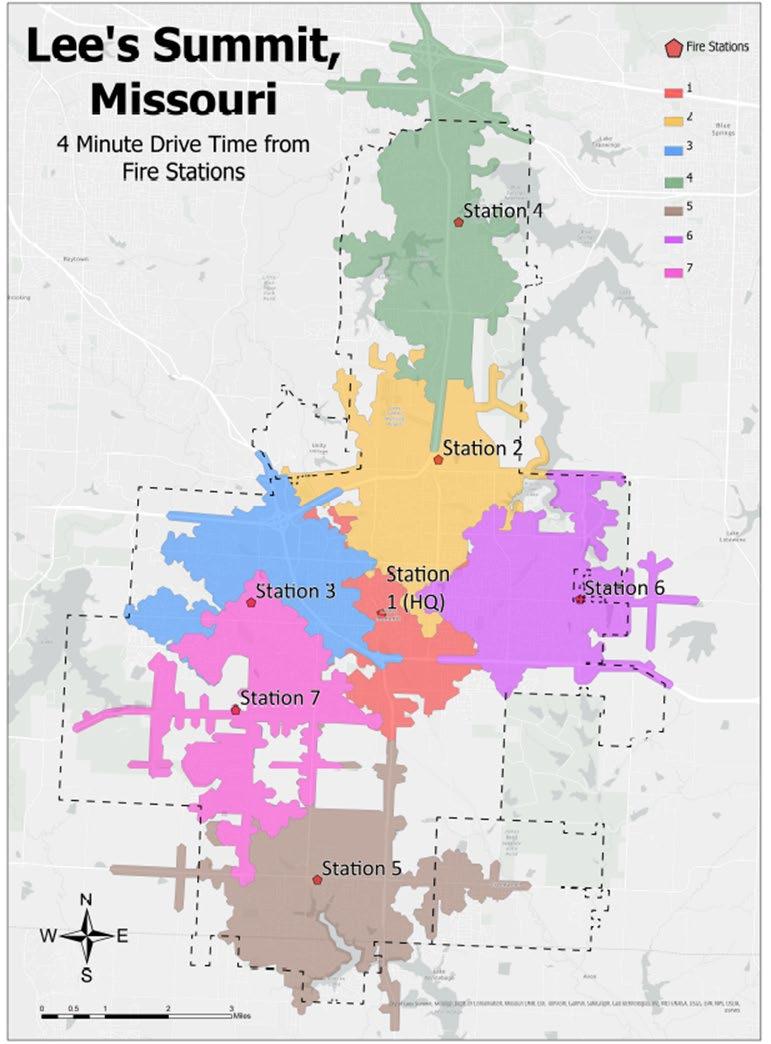
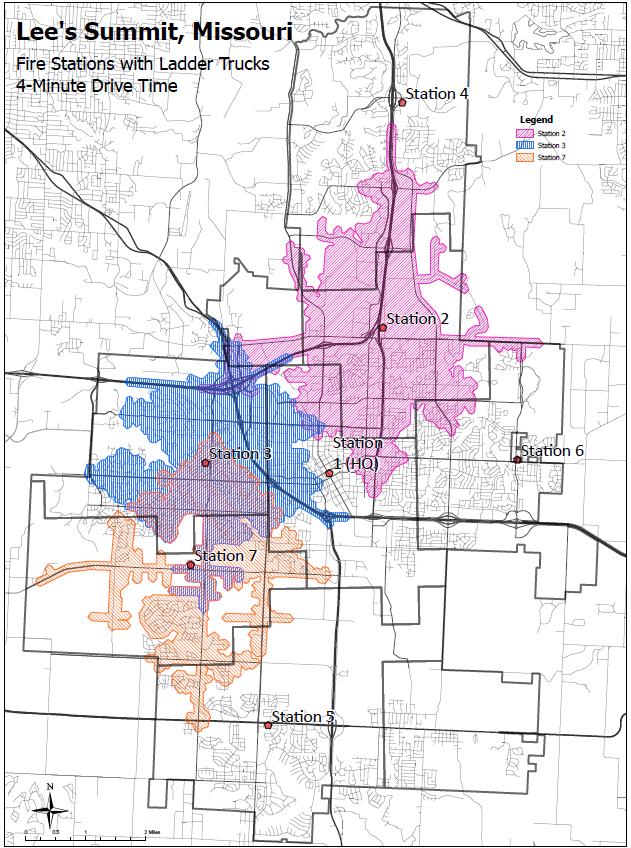
The fourth component collected as part of the total response time is the arrival of all the resources assigned to the incident, also known as the effective response force (ERF), which is referred to as concentration. This time begins when the first unit assigned is recorded en route until the last unit assigned arrives on-scene.
The same factors that affect distribution have an impact on concentration. Due to the department’s critical task analysis, there have been several changes made to ERF deployments in the development of this document. However, the following map indicates the department’s response performance challenges related to meeting the industry benchmarks for assembling an ERF as defined in NFPA 1710.
When responding to structure fires, the department must deploy from a minimum of four stations to a single location that is experiencing a fire event. The deployment for a structure fire in a single-family residence is three pumpers, one ladder truck, two med units, and two chief officers. Due to the distribution of fire stations in the city, the time it takes for all these apparatuses to arrive on scene exceeds adopted response time benchmarks.
The following maps show the travel capabilities within eight minutes from all current deployment locations, fire stations, and each ladder truck. This is the benchmark standard for the ERF at the 90th percentile of responses within urban density planning zones.
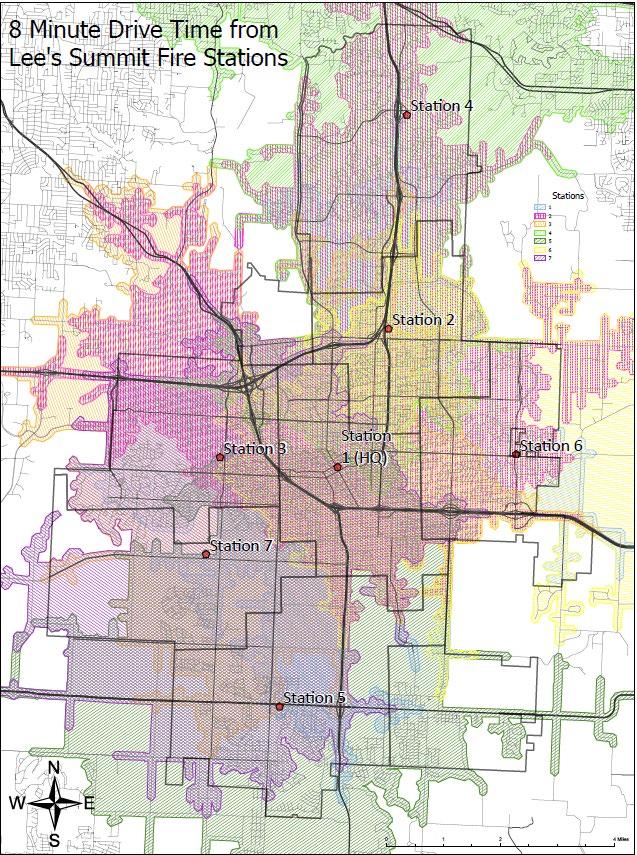
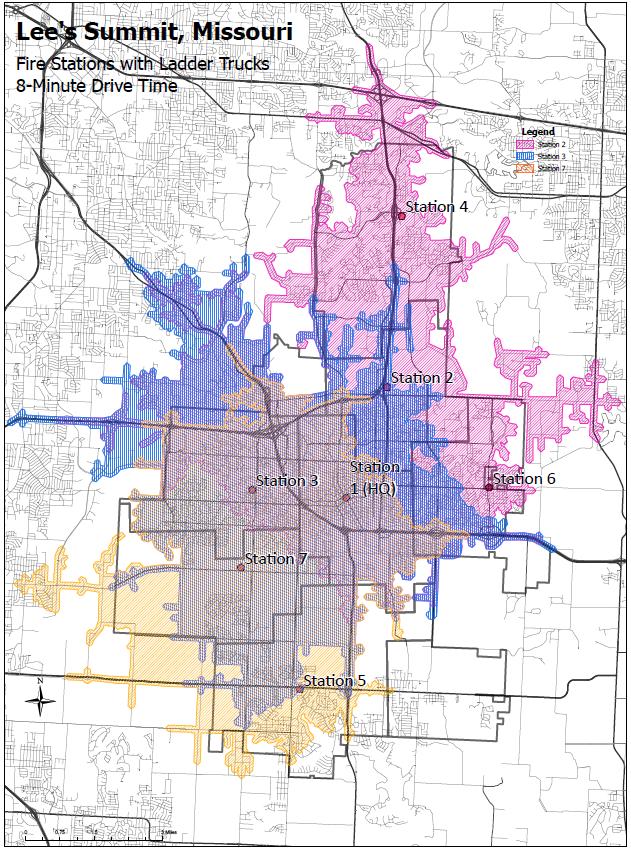
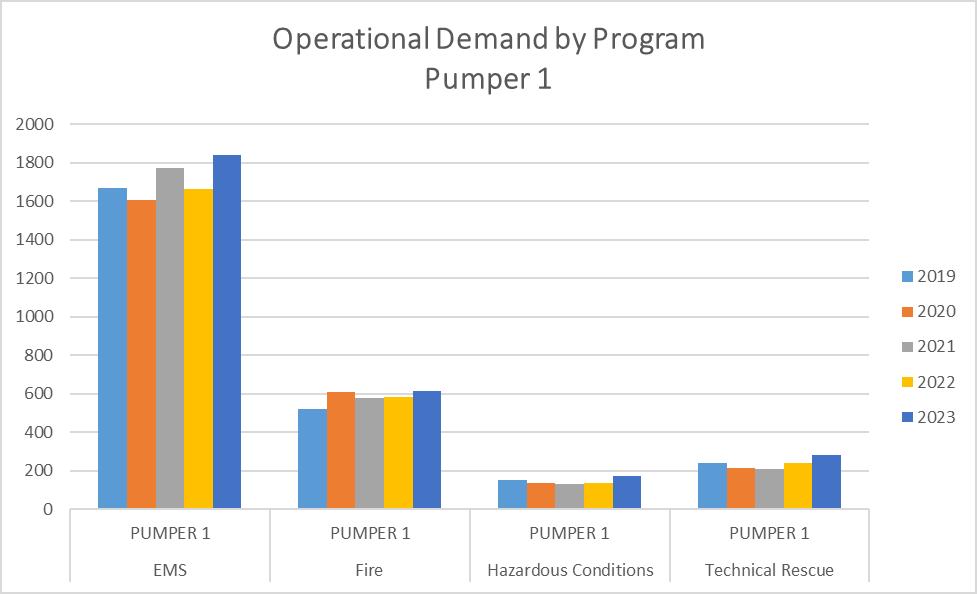
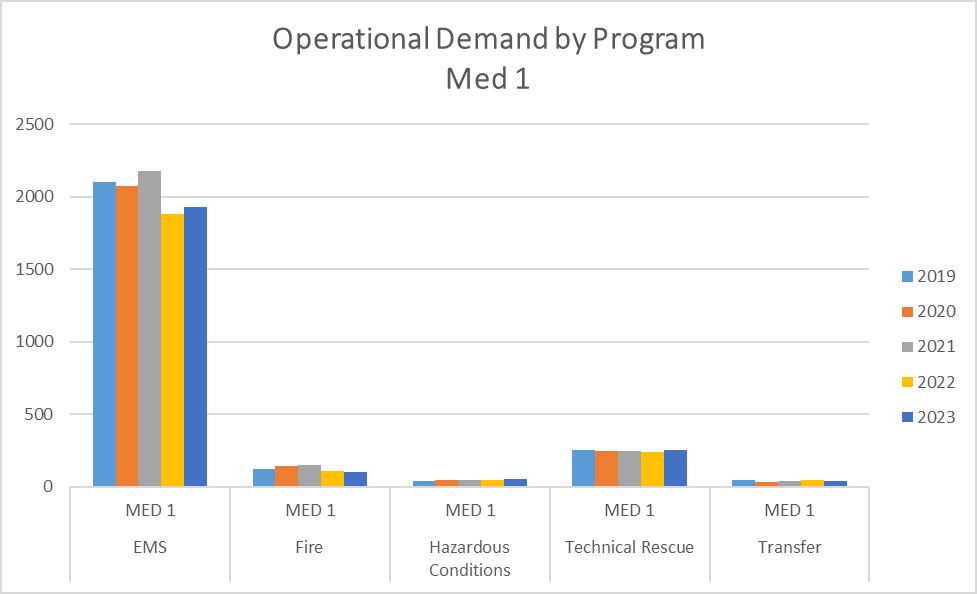
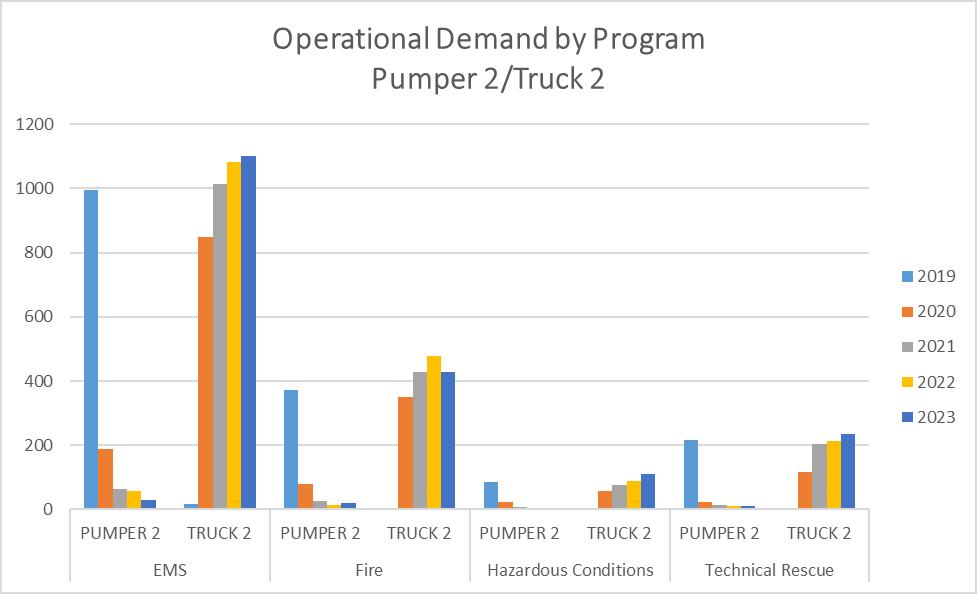
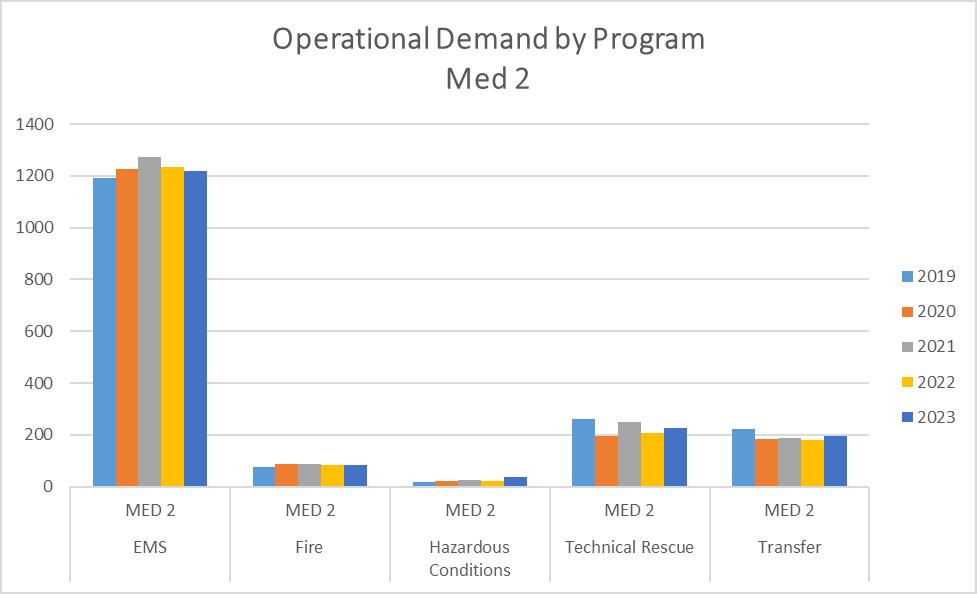
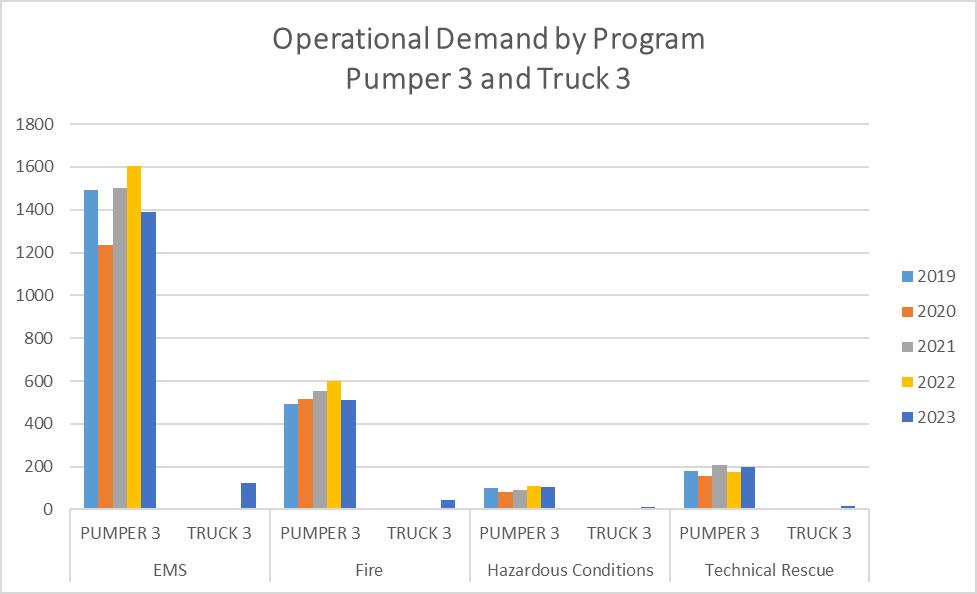
Figure 29: Operational Demand by Program - Pumper 3 and Truck 3 (2019-2023)
*Truck 3, an expansion ladder truck, went into service on November 11, 2023.
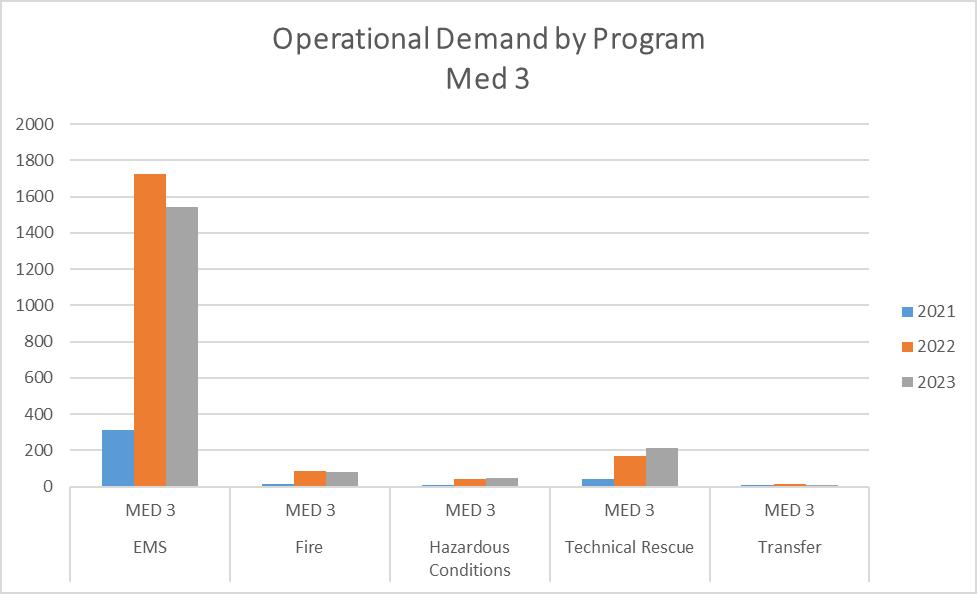
Figure 30: Operational Demand by Program - Med 3 (2021-2023)
*Med 7 was transferred to Station 3 and went into service as Med 3 on October 25, 2021.
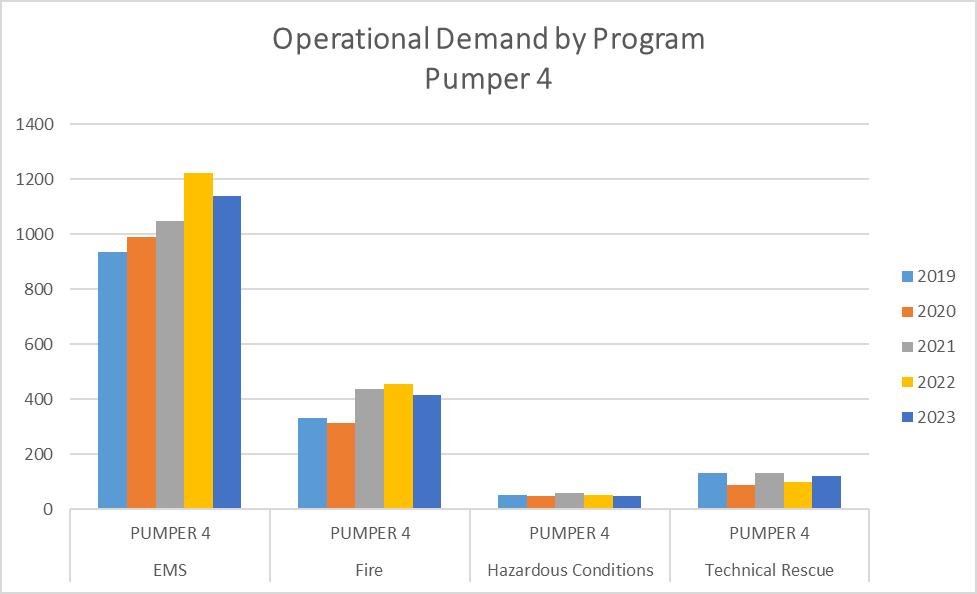
Program - Pumper 4 (2019-2023)
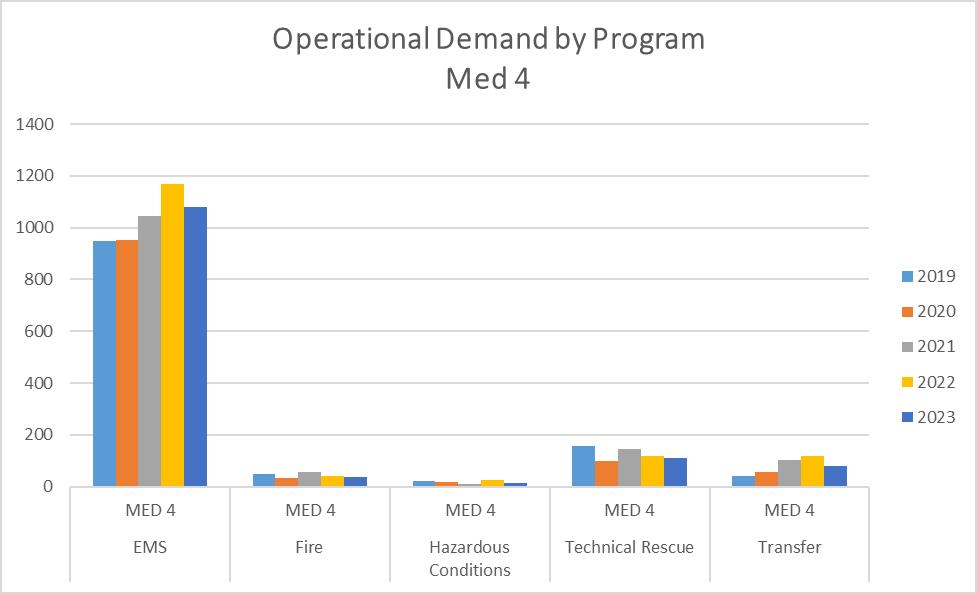
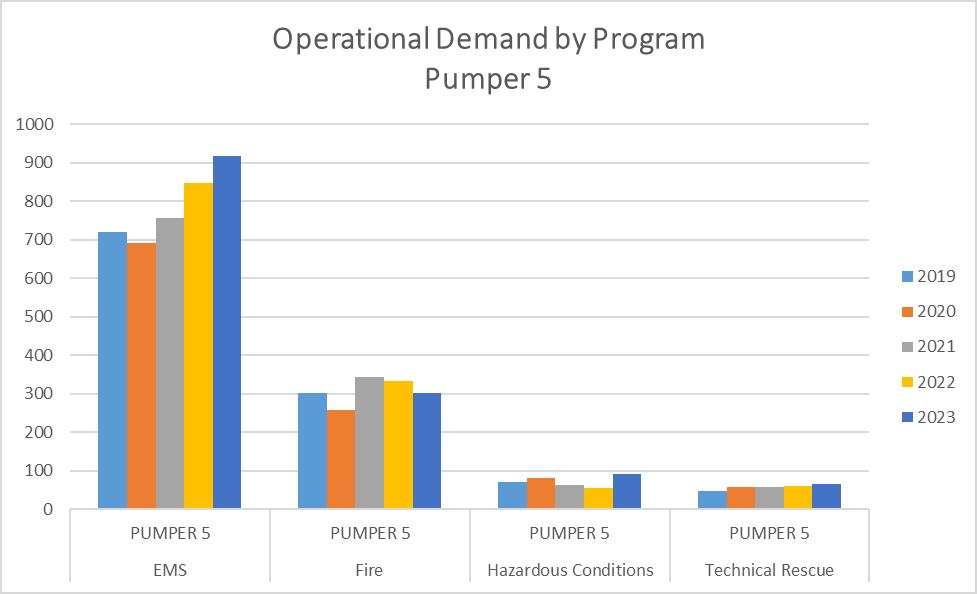
Program - Pumper 5 (2019-2023)
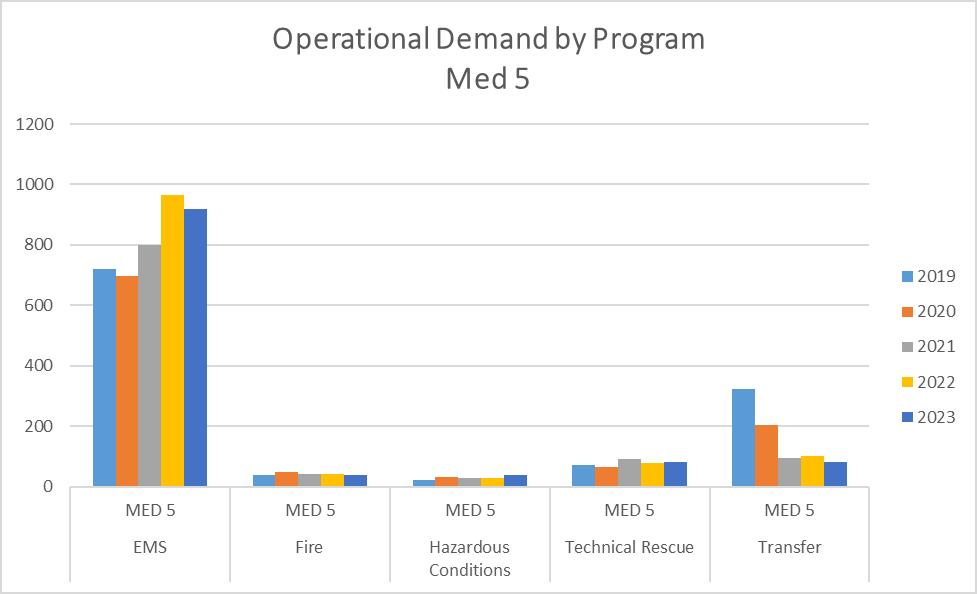
Program - Med 5 (2019-2023)
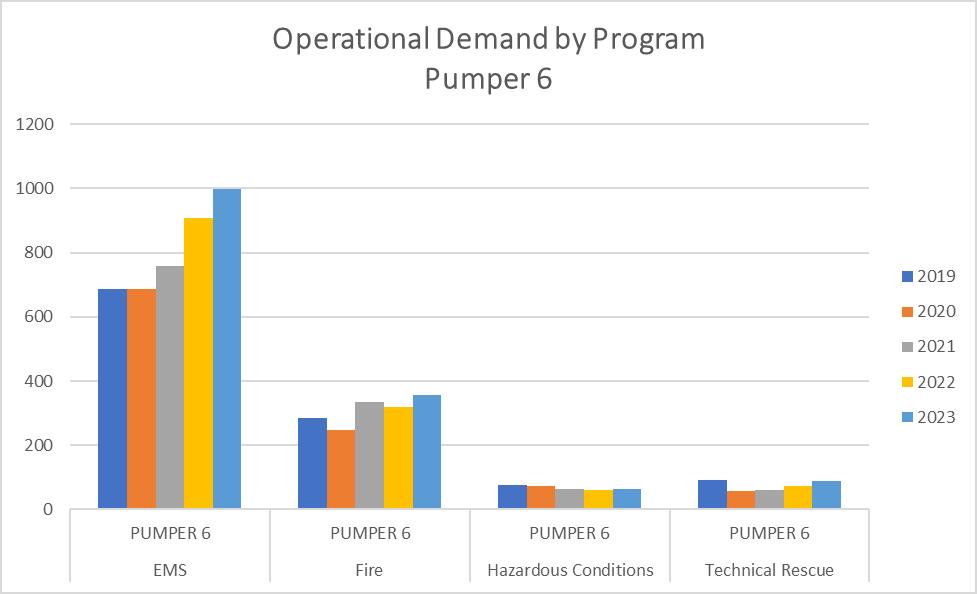
Program - Pumper 6 (2019-2023)
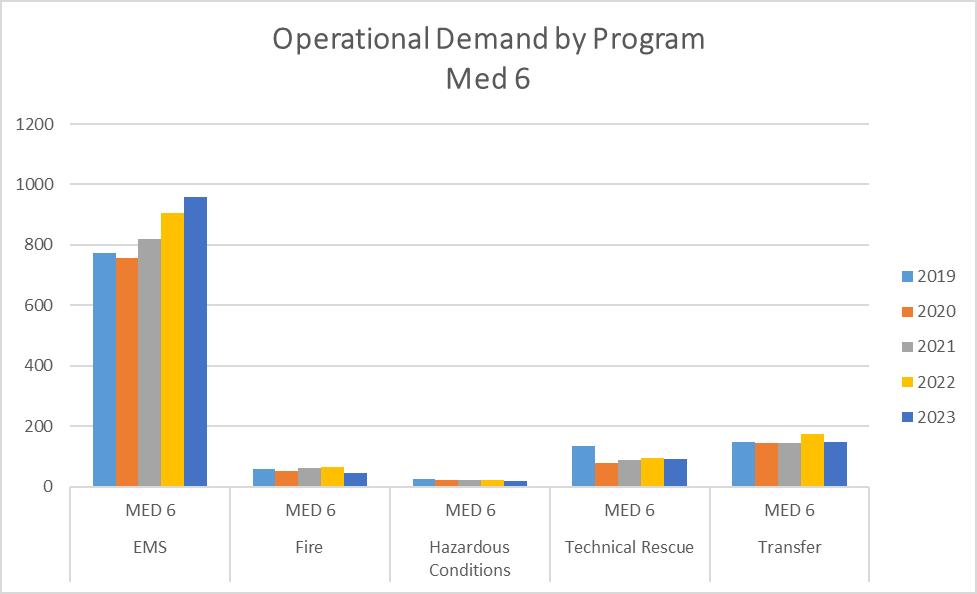
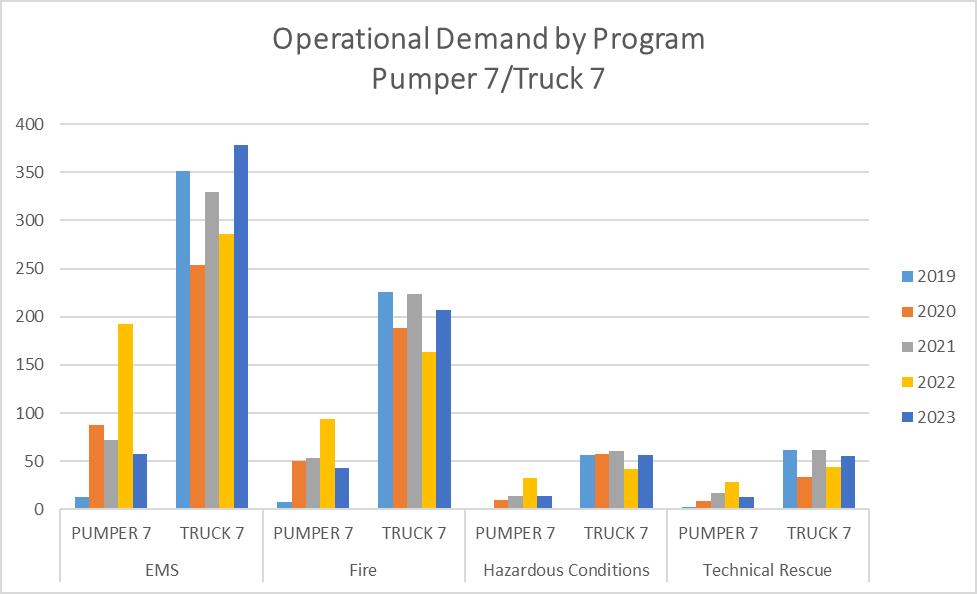
37: Operational Demand by Program - Pumper 7/Truck 7 (2019-2023)
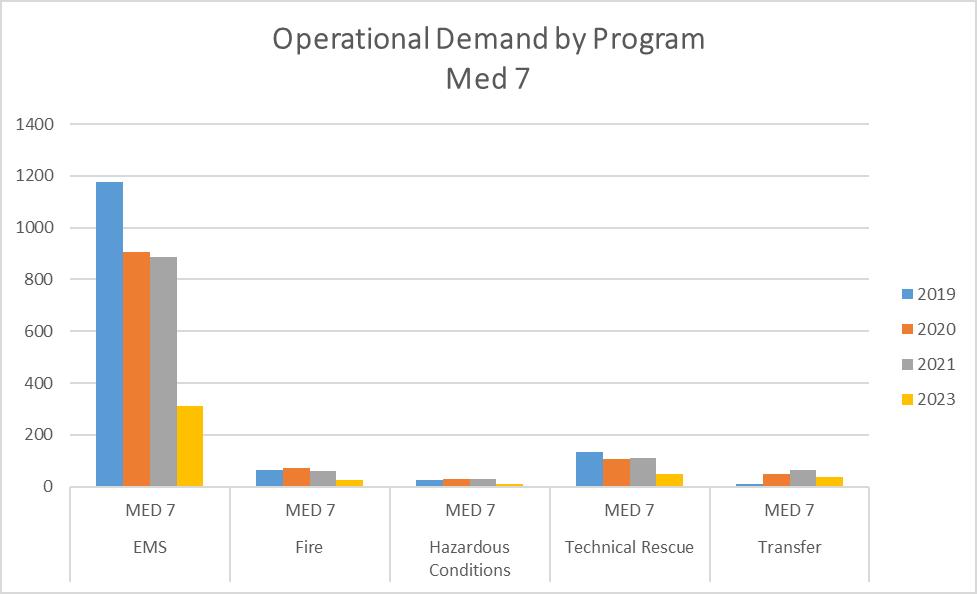
Figure 38: Operational Demand by Program - Med 7 (2019-2023)
*Med 7 was transferred to Station 3 and went into service as Med 3 on October 25, 2021. An expansion med unit was approved and placed into service at Med 7 on June 1, 2023.
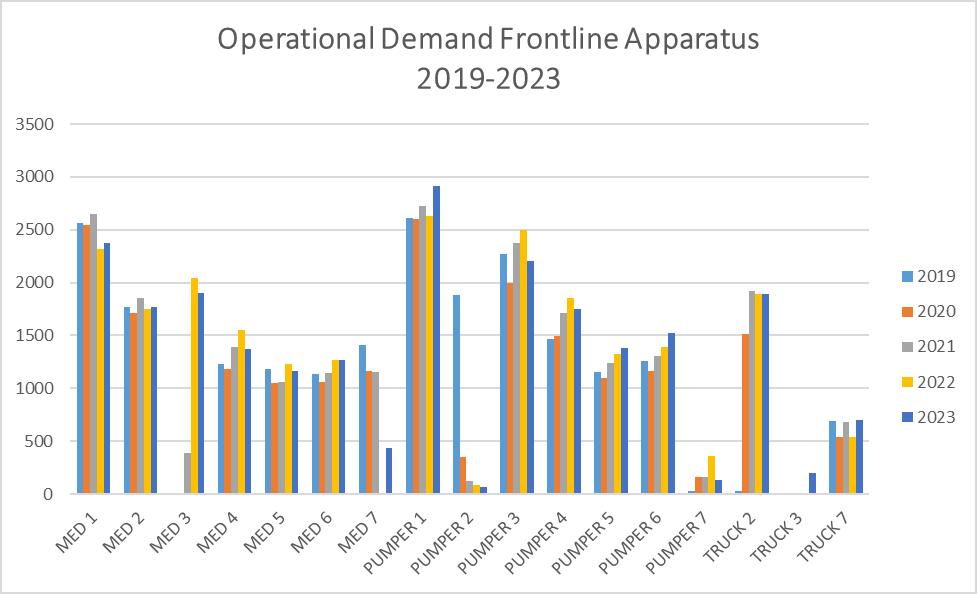
Reliability factors considered in the assessment of system performance include time, distance, availability of the appropriate resources, and the functionality of the CAD system to assign units based on AVL technology (fastest routable). Assessing the reliability of fire stations, accomplished through an evaluation of the ability of the station apparatus to respond to incidents within their district, provides insight into the capacity of the department to meet its mission.
Included in this assessment are incident volume, incident type, and the number and percentage of times there are simultaneous or overlapping incidents that require another district apparatus to respond. Every emergency service organization periodically experiences simultaneous or overlapping incidents, commonly referred to as surges. The resource management strategies available to manage surge capacity for Lee’s Summit are mutual aid responses, limited emergency recall of personnel to fill specific apparatus needs, or multi-major recalls for all off-duty personnel.
Several responsibilities have a direct impact on the reliability or availability of fire department resources, including, but not limited to, operational incidents, training, and administrative duties, prevention, education activities, fueling, and maintenance issues.
The following tables used five years of the department’s historical Records Management Systems (RMS) data, from 2019-2023, to quantify two values: the percentage of incidents that primary units responded to within their planning zone and the percentage of time primary units spent responding to emergency incidents within their zone and responding in other zones. The percentages do not necessarily reflect the percentage of time a unit was available within the city, but what percentage of the time they responded to incidents.

Planning Zone 1 has a pumper and a med unit assigned as primary response units and they both deploy from Station 1. The following table represents the percentage of times the primary units responded to incidents within Planning Zone 1.
Table 65: Primary Unit Response Percentages in Planning Zone 1 (2019-2023)
*Truck 3, an expansion ladder truck, went into service on November 11, 2023. It has not been in service long enough to see an impact on reliability in Planning Zone 1.
*Med 7 was transferred to Station 3 and went into service as Med 3 on October 25, 2021. An expansion med unit was approved and placed into service at Med 7 on June 1, 2023. Both of these changes had a direct impact on the reliability data for Planning Zone 1.
The percentage of time the primary units were committed to incidents within Planning Zone 1 and the percentage of time those units were committed to incidents outside of the zone are as follows:
Table 66: Unit Commitment Percentages In and Out of Planning Zone 1 (2019-2023)
Planning Zone 2 has a ladder truck and a med unit assigned as primary response units and they both deploy from Station 2. The following table represents the percentage of times the primary units responded to incidents with Planning Zone 2.
Table 67: Primary Unit Response Percentages in Planning Zone 2 (2019-2023)
The percentage of time the primary units were committed to incidents within Planning Zone 2 and the percentage of time those units were committed to incidents outside of the zone are as follows:
Table 68: Unit Commitment Percentages In and Out of Planning Zone 2 (2019-2023)
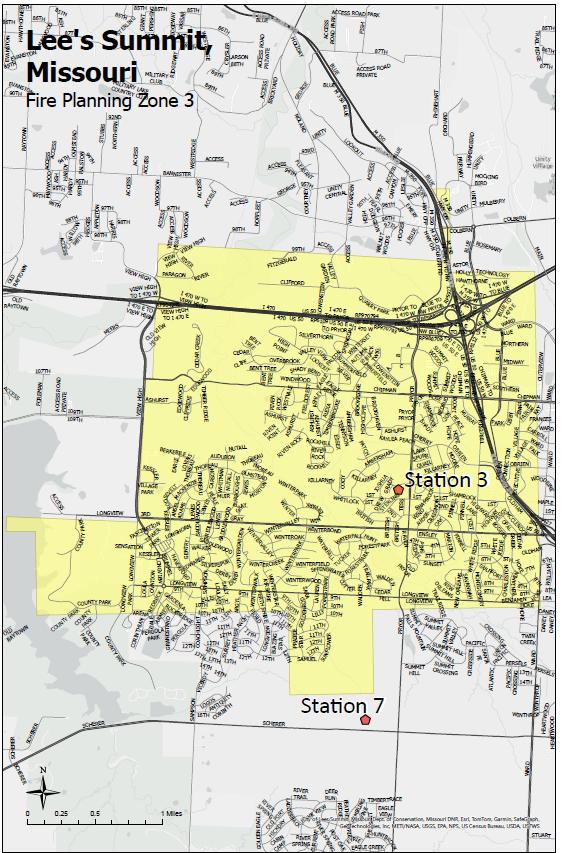
Planning Zone 3 has a pumper, ladder truck, and a med unit assigned as primary response units and they all deploy from Station 3. The following table represents the percentage of times the primary units responded to incidents with Planning Zone 3.
Table 69: Primary Unit Response Percentages in Planning Zone 3 (2019-2023)
*Truck 3, an expansion ladder truck, went into service on November 11, 2023. It has not been in service long enough to see an impact on reliability in Planning Zone 3.
*Med 7 was transferred to Station 3 and went into service as Med 3 on October 25, 2021. An expansion med unit was approved and placed into service at Med 7 on June 1, 2023. Both of these changes had a direct impact on the reliability data for Planning Zone 3.
The percentage of time the primary units were committed to incidents within Planning Zone 3 and the percentage of time those units were committed to incidents outside of the zone are as follows:
Table 70: Unit Commitment Percentages In and Out of Planning Zone 3 (2019-2023)
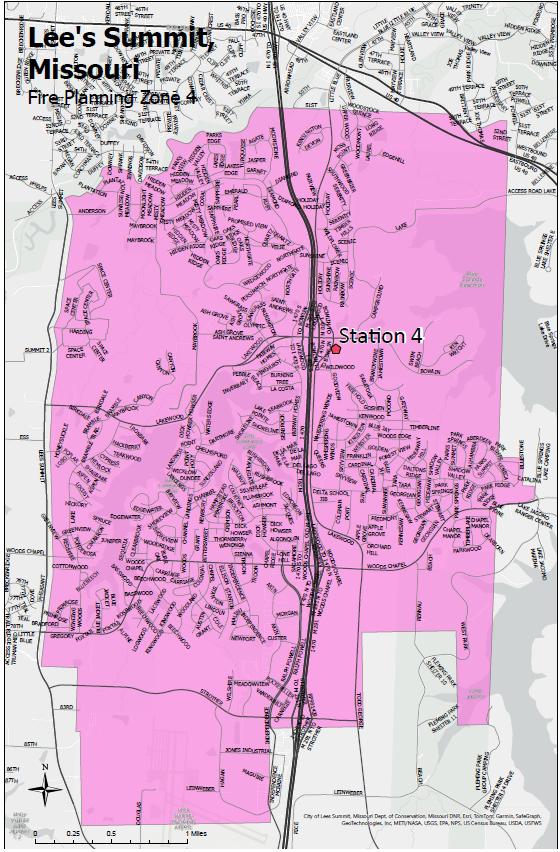
Planning Zone 4 has a pumper and a med unit assigned as primary response units and they both deploy from Station 4. The following table represents the percentage of times the primary units responded to incidents with Planning Zone 4.
Table 71: Primary Unit Response Percentages in Planning Zone 4 (2019-2023)
The percentage of time the primary units were committed to incidents within Planning Zone 4 and the percentage of time those units were committed to incidents outside of the zone are as follows:
Table 72: Unit Commitment Percentages In and Out of Planning Zone 4 (2019-2023)

Planning Zone 5 has a pumper and a med unit assigned as primary response units and they both deploy from Station 5. The following table represents the percentage of times the primary units responded to incidents with Planning Zone 5.
Table 73: Primary Unit Response Percentages in Planning Zone 5 (2019-2023)
The percentage of time the primary units were committed to incidents within Planning Zone 5 and the percentage of time those units were committed to incidents outside of the zone are as follows:
Table 74: Unit Commitment Percentages In and Out of Planning Zone 5 (2019-2023)

Planning Zone 6 has a pumper and a med unit assigned as primary response units and they both deploy from Station 6. The following table represents the percentage of times the primary units responded to incidents with Planning Zone 6.
Table 75: Primary Unit Response Percentages in Planning Zone 6 (2019-2023)
The percentage of time the primary units were committed to incidents within Planning Zone 6 and the percentage of time those units were committed to incidents outside of the zone are as follows:
Table 76: Unit Commitment Percentages In and Out of Planning Zone 6 (2019-2023)
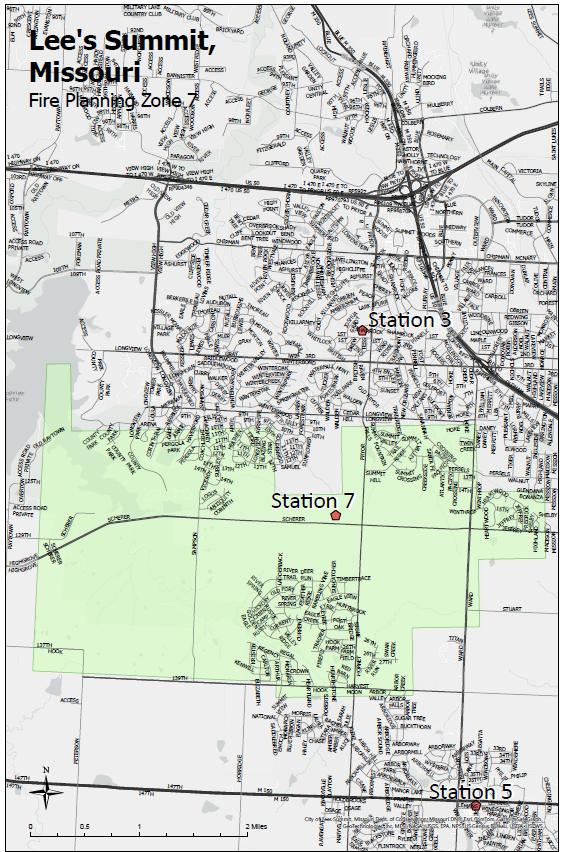
Planning Zone 7 has a ladder truck and a med unit assigned as primary response units and they both deploy from Station 7. The following table represents the percentage of times the primary units responded to incidents with Planning Zone 7.
*Truck 3, an expansion ladder truck, went into service on November 11, 2023. It has not been in service long enough to see an impact on reliability in Planning Zone 7.
*Med 7 was transferred to Station 3 and went into service as Med 3 on October 25, 2021. An expansion med unit was approved and placed into service at Med 7 on June 1, 2023. Both of these changes had a direct impact on the reliability data for Planning Zone 7.
The percentage of time the primary units were committed to incidents within Planning Zone 7 and the percentage of time those units were committed to incidents outside of the zone are as follows:
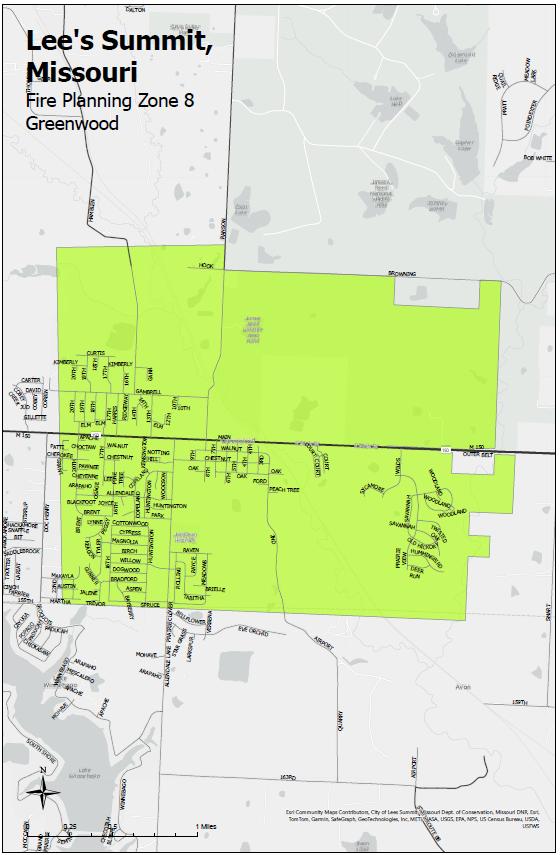
Planning Zone 8 includes the contract service of Greenwood. There is not a department fire station in this planning one. Primary response units deploy for surrounding stations. The following table represents the percentage of times that units responded to incidents with Planning Zone 8.
Table 79: Unit Response Percentages in Planning Zone 8 (2019-2023)
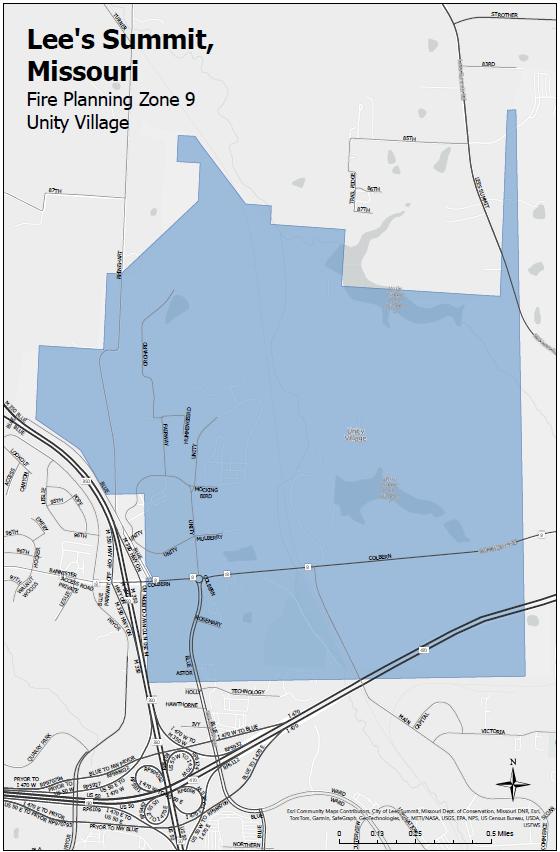
Planning Zone 9 includes the contract service of Unity Village. There is not a department fire station in this planning one. Primary response units deploy for surrounding stations. The following table represents the percentage of times that units responded to incidents with Planning Zone 9.
Table 80: Unit Response Percentages in Planning Zone 9 (2019-2023)
Alarm Handling Time
This is the first component collected as a value contributing to the total response time. Alarm handling time begins when a call is received within the fire department communications center or Public Safety Answering Point (PSAP) until the apparatus is notified to deploy to an incident location.
In the City of Lee’s Summit, the fire department communications center is a secondary PSAP, and the police department is the primary PSAP. Currently, there is no process in place to collect the handling time between the primary and secondary PSAP for each call. General call-handling information is available through the Mid-America Regional Council. Currently it is only providing the 90th percentile data for the PSAP as a whole and not broken down by program or risk level.
Turnout Time
This is the second component collected as a value contributing to the total response time. Turnout time begins with the station notification tone from the communications center and ends when each apparatus begins driving. It is recorded en-route via radio or in the mobile data terminal (MDT) of each unit.
Distribution Travel Time
This is the third component collected as part of the total response time. Distribution begins when the dispatched apparatus is recorded en route via radio or in the MDT and ends when the apparatus is recorded on the scene in the MDT or via radio. The distribution travel time is the travel time of the first arriving resource to an incident. Not all resources are considered equal, as not all apparatus dispatched can be considered associated with the distribution
data, specifically with the programs of fire, technical rescue, and hazardous conditions. As per guidance in the CFAI Standards of Cover 6th Ed., the first arriving unit documented in the response performance data cannot be a chief officer; rather, it is the first unit that can intercede in an emergency event.
Below are the rules for distribution data, specific to each service delivery program:
The first arriving unit must be a pumper, ladder truck, or grass rig. The first arriving unit documented in the response performance data cannot be a chief officer or med unit (ambulance). The reason for this distinction is that chief officers and med units can establish command, safety, and medical support but cannot directly bring the mitigating effort to the event.
A med unit, pumper, gator, or ladder truck can count as the first arriving unit in the service program. Any of these resources that are deployed except a chief officer count as the first arriving unit. The reason for this distinction is that chief officers can establish command, safety, and medical support but cannot directly bring the mitigating effort to the event.
The first arriving unit must be a pumper, ladder truck, or squad. The first arriving unit documented in the response performance data cannot be a chief officer or a med unit. The reason for this distinction is that chief officers and med units can establish command, safety, and medical support but cannot directly bring the mitigating effort to the event.
The first arriving unit must be a pumper or a ladder. The first arriving unit documented in the response performance data cannot be a chief officer or a med unit. The reason for this distinction is that chief officers and med units can establish command, safety, and medical support but cannot directly bring the mitigating effort to the event.
The fourth component collected as part of the total response time is the arrival of all the apparatus assigned to the incident, also known as the ERF, which is referred to as concentration. This time begins when the first unit is recorded as en route and ends when the last unit associated with the ERF is recorded on-scene.
The composition of the ERF is relative to the risk level and its critical task analysis, as documented in Standard Operating Guideline (SOG) 14.
The same factors that affect distribution have an impact on concentration. Prior to the accreditation model, planning processes were not focused on the ERF but on the arrival of the first unit. Current strategic planning involves elements of distribution, concentration, and reliability as considerations.
This is the total time from receiving the call to arriving on the scene with the first unit. It is calculated by adding several components of response performance. The sum of alarm handling, turn out, and travel time. This is tracked for the travel time of the first arriving uni.
Just as with distribution travel time, not all resources are considered equal for distribution total response time. Not all apparatus dispatched can be considered associated with the distribution data. The same rules for distribution data listed above apply to the calculation of distribution total response time.
This is the total time from receiving the call to arriving on the scene with the ERF. It is calculated by adding several components of response performance. The sum of alarm handling, turn out and travel time for the ERF.
Outlier values are defined in Policy 44, Response Performance Compliance. The department collects, interprets, and assesses all response time values to ensure compliance with emergency response performance goals. As a component of this process, the department has established outlier criteria that allow for the exclusion and review of data that falls outside of the department-defined time limits. This exclusion and review process has been established since response times exceeding these limits are considered errors in data and uncharacteristic of the department’s normal response threshold.
Time criteria and outlier limits for components of TRT
i. Handling
1. Lower limit: 00:00:00 (0 seconds)
2. Upper limit: 00:05:00 (5 minutes)
ii. Turnout
1. Lower limit: 00:00:00 (0 seconds)
2. Upper limit: 00:05:00 (5 minutes)
iii. Travel
1. Lower limit: 00:00:00 (0 seconds)
2. Upper limit: 00:25:00 (25 minutes)
iv. Response
1. Lower limit: 00:00:00 (0 seconds)
2. Upper limit: 00:35:00 (35 minutes)
CPSE determines that risk classifications and categories that had fewer than 10 incidents in a reporting period be excluded as those datasets are not statistically relevant.
Data Calculations
All data is aggregated by program type and risk level. As outlined in department Policy 44, Response and Performance Outcomes, the baseline performance tables reflect the emergency response data extracted from the department’s records management system. Each incident report is documented as an emergency or non-emergency response and whether the ERF arrived emergency or not. An incident is marked emergency if it is responded to with lights and sirens (emergency), by the first unit on the scene. An incident is marked as ERF arrived emergency if the assigned units required for the incident type responded with lights and sirens (emergency) for the entire response to the scene. The values documented in the performance tables are the performance at the 90th percentile. The department has adopted Definition 4, as described in Quality Improvement for the Fire and Emergency Services, Appendix C, as the
methodology for calculating the 90th percentile. This method uses the Microsoft Excel formula of =percentile.inc to calculate the linear interpolation.
Baseline Performance Tables – qualified data (2019 –2023)
The agency identified only one population qualifier for the urban service area. The urban identifier represents specific response time benchmarks based on population density. In 2016, the department adopted the strictest interpretation of NFPA 1710 by merging all responses, regardless of the population, into the urban response time benchmarks. This decision, influenced by the community expectations identified in the department’s 2013, 2018, and 2023 strategic plans, reflects the department’s commitment to the community.
**Not enough data points to make this data set statistically relevant.
**Not enough fire incidents qualified as High Modified Risk during 2019 – 2023 to make this data set statistically relevant. This was due to the change in critical tasking on commercial structure fires from 18 personnel to 21 personnel.
No incidents qualified as Fire – Maximum Risk during 2019 – 2023. No incidents qualified as Fire – Maximum Modified Risk during 2019 – 2023.
**Not enough data points to make this data set statistically relevant. Not enough incidents qualified as EMS – Maximum Risk during 2019 – 2023 to make this data set statistically relevant.
Not enough incidents qualified as Hazardous Conditions – High Risk during 2019 – 2023 to make this data set statistically relevant.
No incidents qualified as Hazardous Conditions – Maximum Risk during 2019 – 2023.
Not enough incidents qualified as Technical Rescue
Not enough incidents qualified as Technical Rescue – High Modified Risk during 2019 – 2023 to make this data set statistically relevant.
No incidents qualified as Technical Rescue – Maximum Risk during 2019 – 2023.
Benchmarking is a process for obtaining a measure or benchmark. The term benchmark refers to the process of comparing an organization’s performance to some defined standard. Simply put, benchmarks represent the desired performance.
Specific to emergency response time performance, the fire service has historically utilized the National Fire Protection Association (NFPA) standards as they define industry best practices. In 2015, the department and authority having jurisdiction (AHJ) adopted the response performance standards defined in NFPA 1710 as the benchmark for response performance.
For 90 percent of all fire suppression incidents, the total response time for the arrival of the first due unit, staffed with 2 firefighters and 1 officer, shall be 6 minutes and 24 seconds in all areas. The first due unit for all risk levels should be capable of providing 500 gallons of water and 1,500 gallons per minute (gpm) pumping capacity; initiating command; requesting additional resources; establishing a backup line, and advancing an attack line, each flowing a minimum of 150 gpm; establishing an uninterrupted water supply; containing the fire; rescuing at-risk victims; and performing salvage operations. These operations should be done in accordance with departmental standard operating guidelines while providing for the safety of responders and the public.
For 90 percent of all low risk fires, the total response time for the arrival of the effective response force (ERF), staffed with 2 firefighters and 1 officer, shall be 6 minutes and 24 seconds in all areas. The ERF should be capable of providing 500 gallons of water and 1,500 gallons per minute (gpm) pumping capacity; initiating command; requesting additional resources; establishing a backup line and advancing an attack line, each flowing a minimum of 150 gpm; establishing an uninterrupted water supply; containing the fire; rescuing at-risk victims; and performing salvage operations. These operations should be done in accordance with departmental standard operating guidelines while providing for the safety of responders and the public.
For 90 percent of all moderate risk fires, the total response time for the arrival of the ERF, staffed with 8 firefighters and officers, shall be 10 minutes and 24 seconds in all areas. The ERF should be capable of establishing command; providing an uninterrupted water supply; advancing an attack line and backup line for fire control; complying with Occupational Safety and Health Administration (OSHA) requirements of two-in and two-out; performing search and rescue; controlling utilities; and providing advanced life support (ALS) medical care and capable of transportation of a patient to the hospital. These operations should be done in accordance with departmental standard operating guidelines while providing for the safety of responders and the public.
For 90 percent of all moderate modified risk fires, the total response time for the arrival of the ERF, staffed with 11 firefighters and officers, shall be 10 minutes and 24 seconds in all areas. The ERF should be capable of establishing command; providing an uninterrupted water supply; advancing an attack line and a backup line for fire control; complying with OSHA requirements of two-in and two-out; completing forcible entry; searching and rescuing atrisk victims; ventilating the structure; controlling utilities; providing ALS medical care and capable of transportation of a patient(s) to the hospital; operating an aerial fire apparatus; and performing salvage and overhaul. These operations should be done in accordance with departmental standard operating guidelines while providing for the safety of responders and the public.
For 90 percent of all high risk fires, the total response time for the arrival of the ERF, staffed with 18 firefighters and officers, shall be 10 minutes and 24 seconds in all areas. The ERF should be capable of establishing command; appointing a site safety officer; establishing a rapid intervention crew; providing an uninterrupted water supply; advancing an attack line and a backup line for fire control; complying with OSHA requirements of two-in and twoout; completing forcible entry; searching and rescuing at-risk victims; ventilating the structure; controlling utilities; providing ALS medical care and capable of transportation of a patient(s) to the hospital; operating an aerial fire apparatus; and performing salvage and overhaul. These operations should be done in accordance with departmental standard operating guidelines while providing for the safety of responders and the public.
For 90 percent of all high modified risk fires, the total response time for the arrival of the ERF, staffed with 21 firefighters and officers, shall be 10 minutes and 24 seconds in all areas. The ERF should be capable of establishing command; appointing a site safety officer; establishing a rapid intervention crew; providing an uninterrupted water supply; advancing an attack line and a backup line for fire control; complying with OSHA requirements of two-in and two-out; completing forcible entry; searching and rescuing at-risk victims; ventilating the structure; controlling utilities; providing ALS medical care and capable of transportation of a patient(s) to the hospital; operating an aerial fire apparatus; and performing salvage and overhaul. These operations should be done in accordance with departmental standard operating guidelines while providing for the safety of responders and the public.
For 90 percent of all maximum risk fires, the total response time for the arrival of the ERF, staffed with 28 firefighters and officers, shall be 10 minutes and 24 seconds in all areas. The ERF should be capable of establishing command; appointing a site safety officer; establishing a rapid intervention crew, providing an uninterrupted water supply; advancing an attack line and a backup line for fire control; complying with OSHA two-in and two-out; completing forcible entry; searching and rescuing at-risk victims; ventilating the structure, controlling utilities; providing ALS medical care and capable of transporting multiple patients to the hospital; controlling utilities; and establishing two elevated streams into service from aerial ladders. These operations should be done in accordance with departmental standard operating guidelines while providing for the safety of responders and the public.
For 90 percent of all maximum modified risk fires, the total response time for the arrival of the ERF, staffed with 34 firefighters and officers, shall be 10 minutes and 24 seconds in all areas. The ERF should also be capable of establishing incident command; appointing an operations division officer; appointing a site safety officer; establishing a rapid intervention crew; providing an uninterrupted water supply; advancing an attack line and a backup line for fire control; complying with OSHA two-in and two-out; completing forcible entry; searching and rescuing at-risk victims; ventilating the structure, controlling utilities; providing ALS medical care and capable of transporting multiple patients to the hospital; controlling utilities; and establishing two elevated streams into service from aerial ladders.
These operations should be done in accordance with departmental standard operating guidelines while providing for the safety of responders and the public.
For 90 percent of all emergency medical services (EMS) responses, the total response time for the arrival of the first due unit staffed with 1 firefighter and 1 paramedic shall be 6 minutes and 4 seconds in all areas. The first due unit for all risk levels should be capable of initiating command; providing basic life support (BLS) tasks; performing a patient assessment; initiating oxygen therapy; monitoring blood glucose; applying an Automated External Defibrillator (AED); controlling bleeding and performing cardio-pulmonary resuscitation (CPR). These operations should be done in accordance with departmental standard operating guidelines while providing for the safety of responders and the public.
For advanced life support (ALS): Performing a patient assessment; performing advanced airway maneuvers; applying advanced airway adjuncts; operating a mechanical ventilator; performing and interpreting 4, 12, and 15 lead electrocardiograms; performing synchronized cardio-version; performing defibrillation; monitoring carbon dioxide waveforms; administering nasal, oral, mucosal, venous, sub-lingual, sub-cutaneous, intra-muscular, and intraosseous medication; performing drug dose calculations; monitoring body temperature; monitoring blood glucose; applying traction, rigid and semi-rigid splints; assessing blood pressure and pulse rate; establishing venous or intraosseous access; contacting all regional hospital emergency departments by radio; applying the LUCAS® compression device; and transporting a patient on a secured wheeled cot to a hospital. These operations should be done in accordance with departmental standard operating guidelines while providing for the safety of responders and the public.
For 90 percent of all low risk EMS response incidents, the total response time for the arrival of the ERF, staffed with 1 firefighter and 1 paramedic, shall be 6 minutes and 4 seconds in all areas. The ERF should be capable of establishing incident command; performing a patient assessment; performing advanced airway maneuvers; applying advanced airway adjuncts; operating a mechanical ventilator; performing and interpreting 4, 12, and 15 lead electrocardiograms; performing synchronized cardioversion; performing defibrillation; monitoring carbon dioxide waveforms; administering nasal, oral, mucosal, venous, sublingual, subcutaneous, intramuscular, and intraosseous medication; performing drug dose calculations; monitoring body temperature; monitoring blood glucose; applying traction, rigid and semi-rigid splints; assessing blood pressure and pulse rate; establishing venous or intraosseous access; contacting all regional hospital emergency departments by radio; applying the LUCAS® compression device; and transporting a patient on a secured wheeled cot to a hospital. These operations should be done in accordance with departmental standard operating guidelines while providing for the safety of responders and the public.
For 90 percent of all moderate risk EMS response incidents, the total response time for the arrival of the ERF, staffed with 3 firefighters, 1 paramedic and 1 officer, shall be 10 minutes and 4 seconds in all areas. The ERF should be capable of establishing incident command; performing a patient assessment; performing advanced airway maneuvers; applying advanced airway adjuncts; operating a mechanical ventilator; performing and interpreting 4, 12, and 15 lead
electrocardiograms; performing synchronized cardioversion; performing defibrillation; monitoring carbon dioxide waveforms; administering nasal, oral, mucosal, venous, sublingual, subcutaneous, intramuscular, and intraosseous medication; performing drug dose calculations; monitoring body temperature; monitoring blood glucose; applying traction, rigid and semi-rigid splints; assessing blood pressure and pulse rate; establishing venous or intraosseous access; contacting all regional hospital emergency departments by radio; applying the LUCAS® compression device; and transporting a patient on a secured wheeled cot to a hospital. These operations should be done in accordance with departmental standard operating guidelines while providing for the safety of responders and the public.
For 90 percent of all moderate modified risk EMS response incidents, the total response time for the arrival of the ERF, staffed with 3 firefighters, 1 paramedic, and 2 officers, shall be 10 minutes and 4 seconds in all areas. The ERF should be capable of establishing incident command; performing a patient assessment; performing advanced airway maneuvers; applying advanced airway adjuncts; operating a mechanical ventilator; performing and interpreting 4, 12, and 15 lead electrocardiograms; performing synchronized cardioversion; performing defibrillation; monitoring carbon dioxide waveforms; administering nasal, oral, mucosal, venous, sublingual, subcutaneous, intramuscular, and intraosseous medication; performing drug dose calculations; monitoring body temperature; monitoring blood glucose; applying traction, rigid and semi-rigid splints; assessing blood pressure and pulse rate; establishing venous or intraosseous access; contacting all regional hospital emergency departments by radio; applying the LUCAS® compression device; and transporting a patient on a secured wheeled cot to a hospital. These operations should be done in accordance with departmental standard operating guidelines while providing for the safety of responders and the public.
For 90 percent of all high risk EMS response incidents, the total response time for the arrival of the ERF, staffed with 7 firefighters, 3 paramedics and 3 officers, shall be 10 minutes and 4 seconds in all areas. The ERF should be capable of establishing incident command; establishing a safety officer; establishing a triage officer; establishing a transport officer; establishing a treatment officer; performing patient assessments; performing advanced airway maneuvers; applying advanced airway adjuncts; operating mechanical ventilators; performing and interpreting 4, 12, and 15 lead electrocardiograms; performing synchronized cardioversion; performing defibrillation; monitoring carbon dioxide waveforms; administering nasal, oral, mucosal, venous, sublingual, subcutaneous, intramuscular, and intraosseous medications; performing drug dose calculations; operating mechanical medication infusion pumps; monitoring body temperature; monitoring blood glucose; applying traction, rigid and semi-rigid splints; assessing blood pressure and pulse rates; establishing venous or intraosseous access; contacting all regional hospital emergency departments by radio; applying the LUCAS® compression device; and begin treatment and transport of patients to a hospital. These operations should be done in accordance with departmental standard operating guidelines while providing for the safety of responders and the public.
For 90 percent of all maximum risk EMS response incidents, the total response time for the arrival of the ERF, staffed with 11 firefighters, 5 paramedics, and 5 officers, shall be 10 minutes and 4 seconds in all areas. The ERF should be capable of establishing incident command; establishing a safety officer; establishing triage, treatment, and transport safety officers; performing patient assessments; performing advanced airway maneuvers; applying advanced airway adjuncts; operating mechanical ventilators; performing and interpreting 4, 12, and 15 lead electrocardiograms; performing synchronized cardioversion; performing defibrillation; monitoring carbon dioxide waveforms; administering nasal, oral, mucosal, venous, sublingual, subcutaneous, intramuscular, and intraosseous medications;
performing drug dose calculations; monitoring body temperature; monitoring blood glucose; applying traction, rigid and semi-rigid splints; assessing blood pressure and pulse rates; establishing venous or intraosseous access; contacting all regional hospital emergency departments by radio; applying the LUCAS® compression device; and begin treatment and transport for a patients to a hospital. These operations should be done in accordance with the departmental standard operating guidelines while providing for the safety of responders and the public.
For 90 percent of all technical rescue incidents, the total response time for the arrival of the first due unit, staffed with 2 firefighters and 1 officer, shall be 6 minutes and 24 seconds in all areas. The first-due unit should be capable of establishing command; sizing up to determine if a technical rescue response is required; requesting additional resources; and providing basic life support (BLS) to any victim without endangering response personnel in accordance with department standard operating guidelines.
For 90 percent of all low risk technical rescue incidents, the total response time for the arrival of the ERF, staffed with 2 firefighters and 1 officer, shall be 6 minutes and 24 seconds in all areas. The ERF should be capable of establishing command; sizing up to determine if a technical rescue response is required; requesting additional resources; force entry into a vehicle; and providing BLS care to a victim in accordance with department standard operating guidelines.
For 90 percent of all low modified risk technical rescue incidents, the total response time for the arrival of the ERF, staffed with 5 firefighters and officers, shall be 10 minutes and 24 seconds in all areas. The ERF should be capable of establishing command; sizing up to determine if a technical rescue response is required; requesting additional resources; force entry into a vehicle; and providing ALS care and transportation to a victim in accordance with department standard operating guidelines.
For 90 percent of all moderate risk technical rescue incidents, the total response time for the arrival of the ERF, staffed with 6 firefighters and officers, shall be 10 minutes and 24 seconds in all areas. The ERF should be capable of establishing command; sizing up to determine if a technical rescue response is required; requesting additional resources; force entry into a vehicle; and providing ALS care and transportation to a victim in accordance with department standard operating guidelines.
For 90 percent of all moderate modified risk technical rescue incidents, the total response time for the arrival of the ERF, staffed with 8 firefighters and officers, shall be 10 minutes and 24 seconds in all areas. The ERF should be capable of establishing incident command; establishing patient contact; staging and apparatus set up; providing technical expertise, knowledge, skills, and abilities during technical rescue incidents; and providing ALS medical care and transportation for victims in accordance with department standard operating guidelines.
For 90 percent of all high risk technical rescue incidents, the total response time for the arrival of the ERF, staffed with 11 firefighters and officers, shall be 10 minutes and 24 seconds in all areas. The ERF should be capable of establishing incident command; establishing patient contact; staging and apparatus set up; providing technical
expertise, knowledge, skills, and abilities during technical rescue incidents; and providing ALS medical care and transportation for victims in accordance with department standard operating guidelines.
For 90 percent of all high modified risk technical rescue incidents, the total response time for the arrival of the ERF, staffed with 12 firefighters and officers, shall be 10 minutes and 24 seconds in all areas. The ERF should be capable of establishing incident command; establishing patient contact; staging and apparatus set up; providing technical expertise, knowledge, skills, and abilities during technical rescue incidents; and providing ALS medical care and transportation for victims in accordance with department standard operating guidelines.
For 90 percent of all maximum risk technical rescue incidents, the total response time for the arrival of the ERF, staffed with 28 firefighters and officers, shall be 10 minutes and 24 seconds in all areas. The ERF should be capable of appointing a site safety officer; establishing incident command; establishing a rapid intervention crew; staging and apparatus set up; providing technical expertise, knowledge, skills, and abilities during technical rescue incidents involving a natural/human-made disaster or large building/structure collapse in accordance with department standard operating guidelines.
For 90 percent of all hazardous conditions response incidents, the total response time for the arrival of the first due unit, staffed with 2 firefighters and 1 officer, shall be 6 minutes and 24 seconds in all areas. The first due unit should be capable of establishing command; sizing up and assessing the situation to determine the presence of a potential hazardous material or explosive device; determining the need for additional resources; estimating the potential harm without intervention; and begin establishing a hot, warm, and cold zone. These operations should be done in accordance with departmental standard operating guidelines while providing for the safety of responders and the public.
For 90 percent of all low risk hazardous conditions response incidents, the total response time for the arrival of the ERF, staffed with 2 firefighters and 1 officer, shall be 6 minutes and 24 seconds in all areas. The ERF should be capable of establishing command; sizing up and assessing the situation to determine the presence of a potentially hazardous material; determining the need for additional resources; sizing up to determine if a specialized hazardous conditions response is required; estimating the potential harm without intervention; and begin establishing hot, warm, and cold zones. These operations should be done in accordance with department standard operating guidelines while providing for the safety of responders and the public.
For 90 percent of all moderate risk hazardous conditions response incidents, the total response time for the arrival of the ERF, staffed with 6 firefighters and officers, shall be 10 minutes and 24 seconds in all areas. The ERF should be capable of establishing command; sizing up and assessing the situation to determine the presence of a potentially hazardous material; determining the need for additional resources; sizing up to determine if a specialized hazardous conditions response is required; providing the equipment, technical expertise, knowledge, skills and abilities to mitigate a hazardous conditions incident; estimating the potential harm without intervention; and begin establishing
hot, warm, and cold zones. These operations should be done in accordance with department standard operating guidelines while providing for the safety of responders and the public.
For 90 percent of all moderate modified risk hazardous conditions response incidents, the total response time for the arrival of the ERF, staffed with 9 firefighters and officers, shall be 10 minutes and 24 seconds in all areas. The ERF should be capable of establishing command, providing the equipment, technical expertise, knowledge, skills, and abilities to mitigate a hazardous conditions incident in accordance with department standard operating guidelines while providing for the safety of responders and the public.
For 90 percent of all high risk hazardous conditions response incidents, the total response time for the arrival of the ERF, staffed with 13 firefighters and officers, shall be 10 minutes and 24 seconds in all areas. The ERF should be capable of establishing command, providing the equipment, technical expertise, knowledge, skills, and abilities to mitigate a hazardous conditions incident in accordance with department standard operating guidelines while providing for the safety of responders and the public.
For 90 percent of all maximum risk hazardous conditions response incidents, the total response time for the arrival of the ERF, staffed with 25 firefighters and officers, shall be 10 minutes and 24 seconds in all areas. The ERF should be capable of establishing command; appointing a site safety officer; appointing a HazMat group supervisor; providing the equipment, technical expertise, knowledge, skills, and abilities to mitigate a hazardous conditions incident in accordance with department standard operating guidelines while providing for the safety of responders and the public.
The following baseline statements, based on the qualified aggregated data from the previous five years of qualified data identified in the response performance tables, indicate LSFD’s current performance.
The department does not rely on the use of automatic aid. Still, it does rely on the use of mutual aid from neighboring fire departments to provide its effective response force complement of personnel when necessary. The department’s actual baseline service level performance from 2019 through 2023 is as follows:
For 90 percent of all low risk fires, the total response time for the arrival of the first due unit, staffed with 2 firefighters and 1officer, is 9 minutes and 6 seconds in all areas. The first due unit should be capable of providing 500 gallons of water and 1,500 gallons per minute (gpm) pumping capacity; initiating command; requesting additional resources; establishing a backup line, and advancing an attack line, each flowing a minimum of 150 gpm; establishing an uninterrupted water supply; containing the fire; rescuing at-risk victims; and performing salvage operations. These operations should be done in accordance with departmental standard operating guidelines while providing for the safety of responders and the public.
For 90 percent of all moderate risk fires, the total response time for the arrival of the first due unit, staffed with 8 firefighters and officers, is 8 minutes and 36 seconds in all areas. The first due unit should be capable of providing 500 gallons of water and 1,500 gallons per minute (gpm) pumping capacity; initiating command; requesting additional resources; establishing a backup line, and advancing an attack line, each flowing a minimum of 150 gpm; establishing an uninterrupted water supply; containing the fire; rescuing at-risk victims; and performing salvage operations. These operations should be done in accordance with departmental standard operating guidelines while providing for the safety of responders and the public.
For 90 percent of all moderate modified risk fires, the total response time for the arrival of the first due unit, staffed with 11 firefighters and officers, is 10 minutes and 02 seconds in all areas. The first due unit should be capable of providing 500 gallons of water and 1,500 gallons per minute (gpm) pumping capacity; initiating command; requesting additional resources; establishing a backup line, and advancing an attack line, each flowing a minimum of 150 gpm; establishing an uninterrupted water supply; containing the fire; rescuing at-risk victims; and performing salvage operations. These operations should be done in accordance with departmental standard operating guidelines while providing for the safety of responders and the public.
For 90 percent of all high risk fires, the total response time for the arrival of the first due unit, staffed with 18 firefighters and officers, is 8 minutes and 16 seconds in all areas. The first due unit should be capable of providing 500 gallons of water and 1,500 gallons per minute (gpm) pumping capacity; initiating command; requesting additional resources; establishing a backup line, and advancing an attack line, each flowing a minimum of 150 gpm; establishing an uninterrupted water supply; containing the fire; rescuing at-risk victims; and performing salvage operations. These operations should be done in accordance with departmental standard operating guidelines while providing for the safety of responders and the public.
For 90 percent of all high modified risk fires, the total response time for the arrival of the first due unit, staffed with 21 firefighters and officers, is 7 minutes and 48 seconds in all areas. The first due unit should be capable of providing 500 gallons of water and 1,500 gallons per minute (gpm) pumping capacity; initiating command; requesting additional resources; establishing a backup line, and advancing an attack line, each flowing a minimum of 150 gpm; establishing an uninterrupted water supply; containing the fire; rescuing at-risk victims; and performing salvage operations. These operations should be done in accordance with departmental standard operating guidelines while providing for the safety of responders and the public.
For 90 percent of all maximum risk fires, the total response time for the arrival of the ERF, staffed with 28 firefighters and officers, is undetermined, as there is not sufficient historical data at this level of risk to identify a baseline.
For 90 percent of all maximum modified risk fires, the total response time for the arrival of the ERF, staffed with 34 firefighters and officers, is undetermined, as there is not sufficient historical data at this level of risk to identify a baseline.
For 90 percent of all low risk fires, the total response time for the arrival of the ERF, staffed with 3 firefighters and officers, is 9 minutes and 06 seconds in all areas. The ERF should be capable of providing 500 gallons of water and 1,500 gallons per minute (gpm) pumping capacity; initiating command; requesting additional resources; establishing a back-up line and advancing an attack line, each flowing a minimum of 150 gpm; establishing an uninterrupted water supply; containing the fire; rescuing at-risk victims; and performing salvage operations. These operations should be done in accordance with departmental standard operating guidelines while providing for the safety of responders and the public.
For 90 percent of all moderate risk fires, the total response time for the arrival of the ERF, staffed with 8 firefighters and officers, is 11 minutes and 20 seconds in all areas. The ERF should be capable of establishing command; providing an uninterrupted water supply; advancing an attack line and backup line for fire control; complying with Occupational Safety and Health Administration (OSHA) requirements of two-in and two-out; performing search and rescue; controlling utilities; and providing advanced life support (ALS) medical care and capable of transportation of a patient to the hospital. These operations should be done in accordance with departmental standard operating guidelines while providing for the safety of responders and the public.
For 90 percent of all moderate modified risk fires, the total response time for the arrival of the ERF, staffed with 11 firefighters and officers, is undetermined, as there is not sufficient historical data at this level of risk to identify a baseline. For 90 percent of all high-risk fires, the total response time for the arrival of the ERF, staffed with 18 firefighters and officers, is 17 minutes and 48 seconds in all areas. The ERF should be capable of establishing command; appointing a site safety officer; establishing a rapid intervention crew; providing an uninterrupted water supply; advancing an attack line and a backup line for fire control; complying with OSHA requirements of two-in and two-out; completing forcible entry; searching and rescuing at-risk victims; ventilating the structure; controlling utilities; providing ALS medical care and capable of transportation of a patient(s) to the hospital; operating an aerial fire apparatus; and performing salvage and overhaul. These operations should be done in accordance with departmental standard operating guidelines while providing for the safety of responders and the public.
For 90 percent of all high modified risk fires, the total response time for the arrival of the ERF, staffed with 21 firefighters and officers, is undetermined, as there is not sufficient historical data at this level of risk to identify a baseline.
For 90 percent of all maximum risk fires, the total response time for the arrival of the ERF, staffed with 28 firefighters and officers, is undetermined, as there is not sufficient historical data at this level of risk to identify a baseline.
For 90 percent of all maximum modified risk fires, the total response time for the arrival of the ERF, staffed with 34 firefighters and officers, is undetermined, as there is not sufficient historical data at this level of risk to identify a baseline.
The department does not rely on the use of automatic aid. Still, it does rely on mutual aid from neighboring fire departments to provide its effective response force complement of personnel when necessary. The department’s actual baseline service level performance from 2019 through 2023 is as follows:
For 90 percent of all low risk EMS responses, the total response time for the arrival of the first-due unit, staffed with 1firefighter and 1 paramedic, is 7 minutes and 16 seconds in all areas. The first-due unit shall be capable of initiating command; providing ALS tasks; performing a patient assessment; performing advanced airway maneuvers; applying advanced airway adjuncts; operating a mechanical ventilator; performing and interpreting 4, 12, and 15 lead electrocardiograms; performing synchronized cardio-version; performing defibrillation; monitoring carbon dioxide waveforms; administering nasal, oral, mucosal, venous, sub-lingual, sub-cutaneous, intra-muscular, and intraosseous medication; performing drug dose calculations; monitoring body temperature; monitoring blood glucose; applying traction, rigid and semi-rigid splints; assessing blood pressure and pulse rate; establishing venous or intraosseous access; contacting all regional hospital emergency departments by radio; applying the LUCAS® compression device; and transporting a patient on a secured wheeled cot to a hospital. These operations should be done in accordance with departmental standard operating guidelines while providing for the safety of responders and the public.
For 90 percent of all moderate risk EMS responses, the total response time for the arrival of the first due unit, staffed with 1 firefighter and 1 paramedic, is 7 minutes and 45 seconds in all areas. The first due unit shall be capable of initiating command; providing ALS tasks; performing a patient assessment; performing advanced airway maneuvers; applying advanced airway adjuncts; operating a mechanical ventilator; performing and interpreting 4, 12, and 15 lead electro-cardiograms; performing synchronized cardio-version; performing defibrillation; monitoring carbon dioxide waveforms; administering nasal, oral, mucosal, venous, sub-lingual, sub-cutaneous, intra-muscular, and intraosseous medication; performing drug dose calculations; monitoring body temperature; monitoring blood glucose; applying traction, rigid and semi-rigid splints; assessing blood pressure and pulse rate; establishing venous or intraosseous access; contacting all regional hospital emergency departments by radio; applying the LUCAS® compression device; and transporting a patient on a secured wheeled cot to a hospital. These operations should be done in accordance with departmental standard operating guidelines while providing for the safety of responders and the public.
For 90 percent of all moderate modified risk EMS responses, the total response time for the arrival of the first-due unit, staffed with 1 firefighter and 1 paramedic, is 7 minutes and 27 seconds in all areas. The first due unit shall be capable of initiating command; providing ALS tasks; performing a patient assessment; performing advanced airway maneuvers; applying advanced airway adjuncts; operating a mechanical ventilator; performing and interpreting 4, 12, and 15 lead electro-cardiograms; performing synchronized cardio-version; performing defibrillation; monitoring carbon dioxide waveforms; administering nasal, oral, mucosal, venous, sub-lingual, sub-cutaneous, intra-muscular, and intraosseous medication; performing drug dose calculations; monitoring body temperature; monitoring blood glucose; applying traction, rigid and semi-rigid splints; assessing blood pressure and pulse rate; establishing venous or intraosseous access; contacting all regional hospital emergency departments by radio; applying the LUCAS® compression device; and transporting a patient on a secured wheeled cot to a hospital. These operations should be done in accordance with departmental standard operating guidelines while providing for the safety of responders and the public.
For 90 percent of all high risk EMS responses, the total response time for the arrival of the first-due unit, staffed with 1 firefighter and 1 paramedic, is 7 minutes and 04 seconds in all areas. The first due unit shall be capable of initiating command; providing ALS tasks; performing a patient assessment; performing advanced airway maneuvers; applying advanced airway adjuncts; operating a mechanical ventilator; performing and interpreting 4, 12, and 15 lead electrocardiograms; performing synchronized cardio-version; performing defibrillation; monitoring carbon dioxide waveforms; administering nasal, oral, mucosal, venous, sub-lingual, sub-cutaneous, intra-muscular, and intraosseous medication; performing drug dose calculations; monitoring body temperature; monitoring blood glucose; applying traction, rigid and semi-rigid splints; assessing blood pressure and pulse rate; establishing venous or intraosseous access; contacting all regional hospital emergency departments by radio; applying the LUCAS® compression device; and transporting a patient on a secured wheeled cot to a hospital. These operations should be done in accordance with departmental standard operating guidelines while providing for the safety of responders and the public.
For 90 percent of all maximum-risk EMS responses, the total response time for the arrival of the first-due unit, staffed with 1 firefighter and 1 paramedic, is undetermined, as there is not sufficient historical data at this level of risk to identify a baseline.
For 90 percent of all low risk EMS responses, the total response time for the arrival of the ERF, staffed with 1 firefighter and 1 paramedic, is 7 minutes and 16 seconds in all areas. The ERF should be capable of establishing incident command; performing a patient assessment; performing advanced airway maneuvers; applying advanced airway adjuncts; operating a mechanical ventilator; performing and interpreting 4, 12, and 15 lead electrocardiograms; performing synchronized cardioversion; performing defibrillation; monitoring carbon dioxide waveforms; administering nasal, oral, mucosal, venous, sublingual, subcutaneous, intramuscular, and intraosseous medication; performing drug dose calculations; monitoring body temperature; monitoring blood glucose; applying traction, rigid and semi-rigid splints; assessing blood pressure and pulse rate; establishing venous or intraosseous access; contacting all regional hospital emergency departments by radio; applying the LUCAS® compression device; and transporting a patient on a secured wheeled cot to a hospital. These operations should be done in accordance with departmental standard operating guidelines while providing for the safety of responders and the public.
For 90 percent of all moderate risk EMS response incidents, the total response time for the arrival of the ERF, staffed with 3 firefighters, 1 paramedic and 1 officer, is 9 minutes and 23 seconds in all areas. The ERF should be capable of establishing incident command; performing a patient assessment; performing advanced airway maneuvers; applying advanced airway adjuncts; operating a mechanical ventilator; performing and interpreting 4, 12, and 15 lead electrocardiograms; performing synchronized cardioversion; performing defibrillation; monitoring carbon dioxide waveforms; administering nasal, oral, mucosal, venous, sublingual, subcutaneous, intramuscular, and intraosseous medication; performing drug dose calculations; monitoring body temperature; monitoring blood glucose; applying traction, rigid and semi-rigid splints; assessing blood pressure and pulse rate; establishing venous or intraosseous access; contacting all regional hospital emergency departments by radio; applying the LUCAS® compression device; and transporting a patient on a secured wheeled cot to a hospital. These operations should be done in accordance with departmental standard operating guidelines while providing for the safety of responders and the public.
For 90 percent of all moderate modified risk EMS response incidents, the total response time for the arrival of the ERF, staffed with 3 firefighters, 1 paramedic and 2 officers, is 13 minutes and 06 seconds in all areas. The ERF should be capable of establishing incident command; performing a patient assessment; performing advanced airway maneuvers; applying advanced airway adjuncts; operating a mechanical ventilator; performing and interpreting 4, 12, and 15 lead electrocardiograms; performing synchronized cardioversion; performing defibrillation; monitoring carbon dioxide waveforms; administering nasal, oral, mucosal, venous, sublingual, subcutaneous, intramuscular, and intraosseous medication; performing drug dose calculations; monitoring body temperature; monitoring blood glucose; applying traction, rigid and semi-rigid splints; assessing blood pressure and pulse rate; establishing venous or intraosseous access; contacting all regional hospital emergency departments by radio; applying the LUCAS® compression device; and transporting a patient on a secured wheeled cot to a hospital. These operations should be done in accordance with departmental standard operating guidelines while providing for the safety of responders and the public.
For 90 percent of all high risk EMS response incidents, the total response time for the arrival of the ERF, staffed with 7 firefighters, 3 paramedics, and 3 officers, is undetermined, as there is not sufficient historical data at this level of risk to identify a baseline.
For 90 percent of all maximum risk EMS response incidents, the total response time for the arrival of the ERF, staffed with 21 firefighters and officers, is undetermined, as there is not sufficient historical data at this level of risk to identify a baseline.
The department does not rely on the use of automatic aid, but it does rely on mutual aid from neighboring fire departments to provide its effective response force complement of personnel when necessary. The department’s actual baseline service level performance from 2019 through 2023 is as follows:
For 90 percent of all low risk hazardous conditions response incidents, the total response time for the arrival of the first-due unit, staffed with 2 firefighters and 1 officer, is 9 minutes and 54 seconds in all areas. The first due unit should be capable of establishing command; sizing up and assessing the situation to determine the presence of a
potential hazardous material or explosive device; determining the need for additional resources; estimating the potential harm without intervention; and begin establishing a hot, warm, and cold zone. These operations should be done in accordance with departmental standard operating guidelines while providing for the safety of responders and the public.
For 90 percent of all moderate risk hazardous conditions response incidents, the total response time for the arrival of the first-due unit, staffed with 2 firefighters and 1 officer, is 8 minutes and 17 seconds in all areas. The first due unit should be capable of establishing command; sizing up and assessing the situation to determine the presence of a potential hazardous material or explosive device; determining the need for additional resources; estimating the potential harm without intervention; and begin establishing a hot, warm, and cold zone. These operations should be done in accordance with departmental standard operating guidelines while providing for the safety of responders and the public.
For 90 percent of all moderate modified-risk hazardous conditions response incidents, the total response time for the arrival of the first due unit, staffed with 2 firefighters and 1 officer, is 7 minutes and 45 seconds in all areas. The first due unit should be capable of establishing command; sizing up and assessing the situation to determine the presence of a potential hazardous material or explosive device; determining the need for additional resources; estimating the potential harm without intervention; and begin establishing a hot, warm, and cold zone. These operations should be done in accordance with departmental standard operating guidelines while providing for the safety of responders and the public.
For 90 percent of all high risk hazardous conditions response incidents, the total response time for the arrival of the first-due unit, staffed with 2 firefighters and 1 officer, is 6 minutes and 18 seconds, as there is not sufficient historical data at this level of risk to identify a baseline.
For 90 percent of all maximum risk hazardous materials response incidents, the total response time for the arrival of the first-due unit, staffed with 2 firefighters and 1 officer, is undetermined, as there is not sufficient historical data at this level of risk to identify a baseline.
For 90 percent of all low risk hazardous conditions response incidents, the total response time for the arrival of the ERF, staffed with 2 firefighters and 1officer, is 9 minutes and 54 seconds in all areas. The ERF should be capable of establishing command; sizing up and assessing the situation to determine the presence of a potentially hazardous material; determining the need for additional resources; sizing up to determine if a specialized hazardous conditions response is required; estimating the potential harm without intervention; and begin establishing hot, warm, and cold zones. These operations should be done in accordance with department standard operating guidelines while providing for the safety of responders and the public.
For 90 percent of all moderate risk hazardous conditions response incidents, the total response time for the arrival of the ERF, staffed with 6 firefighters and officers, is 11 minutes and 05 seconds in all areas. The ERF should be capable of establishing command; sizing up and assessing the situation to determine the presence of a potentially hazardous material; determining the need for additional resources; sizing up to determine if a specialized hazardous conditions response is required; providing the equipment, technical expertise, knowledge, skills and abilities to mitigate a
hazardous conditions incident; estimating the potential harm without intervention; and begin establishing hot, warm, and cold zones. These operations should be done in accordance with department standard operating guidelines while providing for the safety of responders and the public.
For 90 percent of all moderate modified risk hazardous conditions response incidents, the total response time for the arrival of the ERF, staffed with 9 firefighters and officers, is 11 minutes and 01 seconds in all areas. The ERF should be capable of establishing command, providing the equipment, technical expertise, knowledge, skills, and abilities to mitigate a hazardous conditions incident in accordance with department standard operating guidelines while providing for the safety of responders and the public.
For 90 percent of all high risk hazardous conditions response incidents, the total response time for the arrival of the ERF, staffed with 13 firefighters and officers, is undetermined, as there is not sufficient historical data at this level of risk to identify a baseline.
For 90 percent of all maximum risk hazardous conditions response incidents, the total response time for the arrival of the ERF, staffed with 25 firefighters and officers, including the hazardous materials response team, is undetermined, as there is not sufficient historical data at this level of risk to identify a baseline.
The department does not rely on the use of automatic aid. It does rely on mutual aid from neighboring fire departments to provide its effective response force complement of personnel when necessary. The department’s actual qualified baseline service level performance from 2019 through 2023 is as follows:
For 90 percent of all low risk technical rescue incidents, the total response time for the arrival of the first due unit, staffed with 2 firefighters and 1 officer, is 8 minutes and 57 seconds in all areas. The first-due unit should be capable of establishing command; sizing up to determine if a technical rescue response is required; requesting additional resources; and providing basic life support (BLS) to any victim without endangering response personnel in accordance with department standard operating guidelines.
For 90 percent of all low modified risk technical rescue incidents, the total response time for the arrival of the first due unit, staffed with 2 firefighters and 1 officer, is 9 minutes and 09 seconds in all areas. The first-due unit should be capable of establishing command; sizing up to determine if a technical rescue response is required; requesting additional resources; and providing basic life support (BLS) to any victim without endangering response personnel in accordance with department standard operating guidelines.
For 90 percent of all moderate risk technical rescue incidents, the total response time for the arrival of the first due unit, staffed with 2 firefighters and 1 officer, is 8 minutes and 33 seconds in all areas. The first-due unit should be capable of establishing command; sizing up to determine if a technical rescue response is required; requesting additional resources; and providing basic life support (BLS) to any victim without endangering response personnel in accordance with department standard operating guidelines.
For 90 percent of all moderate modified risk technical rescue incidents, the total response time for the arrival of the first due unit, staffed with 2 firefighters and 1 officer, is undetermined, as there is not sufficient historical data at this level of risk to identify a baseline.
For 90 percent of all high risk technical rescue incidents, the total response time for the arrival of the first due unit, staffed with 2 firefighters and 1 officer, is 7 minutes and 27 seconds. The first-due unit should be capable of establishing command; sizing up to determine if a technical rescue response is required; requesting additional resources; and providing basic life support (BLS) to any victim without endangering response personnel in accordance with department standard operating guidelines.
For 90 percent of all high modified risk technical rescue incidents, the total response time for the arrival of the first due unit, staffed with 2 firefighters and 1 officer, is undetermined, as there is not sufficient historical data at this level of risk to identify a baseline.
For 90 percent of all maximum risk technical rescue incidents, the total response time for the arrival of the first due unit, staffed with 2 firefighters and 1 officer, is undetermined, as there is not sufficient historical data at this level of risk to identify a baseline.
For 90 percent of all low risk technical rescue incidents, the total response time for the arrival of the ERF, staffed with 2 firefighters and 1 officer, is 8 minutes and 57 seconds in all areas. The ERF should be capable of establishing command; sizing up to determine if a technical rescue response is required; requesting additional resources; force entry into a vehicle; and providing BLS care to a victim in accordance with department standard operating guidelines.
For 90 percent of all low modified risk technical rescue incidents, the total response time for the arrival of the ERF, staffed with 5 firefighters and officers, is 10 minutes and 36 seconds in all areas. The ERF should be capable of establishing command; sizing up to determine if a technical rescue response is required; requesting additional resources; force entry into a vehicle; and providing ALS care and transportation to a victim in accordance with department standard operating guidelines.
For 90 percent of all moderate risk technical rescue incidents, the total response time for the arrival of the ERF, staffed with 6 firefighters and officers, is 10 minutes and 13 seconds in all areas. The ERF should be capable of establishing command; sizing up to determine if a technical rescue response is required; requesting additional resources; force entry into a vehicle; and providing ALS care and transportation to a victim in accordance with department standard operating guidelines.
For 90 percent of all moderate modified risk technical rescue incidents, the total response time for the arrival of the ERF, staffed with 8 firefighters and officers, is undetermined, as there is not sufficient historical data at this level of risk to identify a baseline.
For 90 percent of all high risk technical rescue incidents, the total response time for the arrival of the ERF, staffed with 11 firefighters and officers, is 15 minutes and 36 seconds in all areas. The ERF should be capable of establishing incident command; establishing patient contact; staging and apparatus set up; providing technical expertise, knowledge, skills, and abilities during technical rescue incidents; and providing ALS medical care and transportation for victims in accordance with department standard operating guidelines.
For 90 percent of all high modified risk technical rescue incidents, the total response time for the arrival of the ERF, staffed with 12 firefighters and officers, is undetermined, as there is not sufficient historical data at this level of risk to identify a baseline.
For 90 percent of all maximum risk technical rescue incidents, the total response time for the arrival of the ERF, staffed with 28 firefighters and officers, is undetermined, as there is not sufficient historical data at this level of risk to identify a baseline. Performance
enough incidents qualified as moderate
No
2019-2023 Low Risk Hazardous Conditions Response Times
1st/ERF Urban/RuralBaselineBenchmarkGap
1st Due Urban 9:546:24 03:30 n=129
ERFUrban 9:546:24 03:30 n=129
2019-2023 Moderate Risk Hazardous Conditions Response Times
1st/ERF Urban/RuralBaselineBenchmarkGap
1st Due Urban 8:176:24 01:53 n=255
ERFUrban 11:0510:24 00:41 n=211
2019-2023 Moderate Modified Risk Hazardous Conditions Response Times
1st/ERF Urban/RuralBaselineBenchmarkGap
1st Due Urban 7:456:24 01:21 n=228
ERFUrban 11:0110:24 00:37 n=219
*Not enough incidents qualified as high risk hazardous conditions during 2019-2023 to make this data set statistically relevant.
No maximum risk hazardous conditions responses in 2019-2023.
n=78
8:576:24 02:33 n=78
*Not enough incidents qualified as moderate modified risk technical rescue during 2019-2023 to make this data set statistically relevant. 1st/ERF Urban/RuralBaselineBenchmarkGap 1st Due
15:3610:24 05:12 n=59
*Not enough incidents qualified as high modified technical rescue during 2019-2023 to make this data set statistically relevant.
No incidents qualified as maximum risk technical rescue in 2019-2023.
By design, this report functions as a planning tool for the department and city leaders. By identifying response performance gaps, this document will aid in the planning and decision-making process for future growth. Through analyzing the community risk, demographics and response performance data, the department has again been able to identify strengths, weaknesses, opportunities, and threats to providing the best service to the citizens and visitors to Lee’s Summit.
Historical response performance data accurately measures the distribution and concentration-response capabilities for the community. The current placement of department resources reflects a historical focus on distribution, or the first arriving unit, rather than concentration, which represents the arrival of an effective response force. This level of response performance analysis, tracked since the department began complying with the accreditation model in 2013, has consistently identified challenges in both distribution and concentration travel time across emergency service programs.
In 2019, the citizens of Lee’s Summit approved a $19.5 million initiative to improve the police, fire, and city infrastructure. Part of $12 million was allocated for the relocation of Station 4 from its previous location at 404 NE Woods Chapel Rd. Station 4 moved north in early 2024 to its new location at 5031 NE Lakewood Way. Part of this was to address some of the areas that had the greatest response times in the northernmost district, especially in the areas of Moss Point Drive, NE Anderson Drive, and the northern Maybrook Drive area.
The remaining part of the 12 million dollars was used to address the southernmost district and Station 5. With the areas in the western part of the city currently under development, Station 5 was relocated from its previous location of 3650 SW Windemere Drive. It has been moved farther west to its new location at 801 M Highway 150. Along with the expanding development, it will address the areas in the Kensington Farms area and the south side of the Raintree neighborhood.
The department recognizes it still has areas that have gaps, some of the areas are listed below.
• The south M-291 corridor - this area includes US 50 Highway on the north, Ranson Road to the east, Hook Road on the south, and Jefferson Street as a border on the west.
• The western portion of the city located north and south of the I-470 corridor.
• Certain areas within Unity Village and Greenwood.
• As the city develops to the southwest, the area south of Scherer Parkway and west of Pryor Road will need to be evaluated.
A travel time analysis determined areas of the community that the department could reach in the four-minute standard recommended by NFPA 1710.
Map 58: Four-Minute Drive Time from All Fire Stations
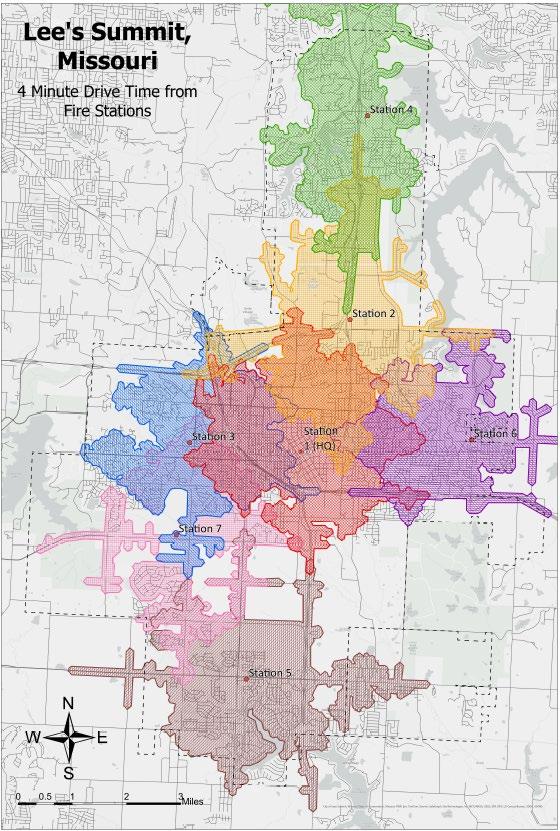
Additional travel time studies were conducted against travel times of eight minutes for the arrival of the multiple resources needed on an incident, defined in this document as the ERF.
Map 59: Eight-Minute Drive Time from All Fire Stations
Additional travel time studies were conducted against travel times of eight minutes for the arrival of the ladder truck resources needed on specific incident types and risk levels as defined in this document.
Travel time performance gaps were identified throughout the city, affecting both the four-minute distribution travel time and the eight-minute concentration travel time.
Recently the citizens of Lee’s Summit passed a No Tax Increase bond issue that will allow for the building of Station 8 in the northern part of the city by the airport. Travel time studies were conducted to see what impact the new station could have on drive time and coverage within the city. As anticipated, the addition of the station will provide resiliency in the northern part of the city, allowing apparatus to reach more incidents within a four-minute first unit drive time and an eight-minute drive time for ERF.
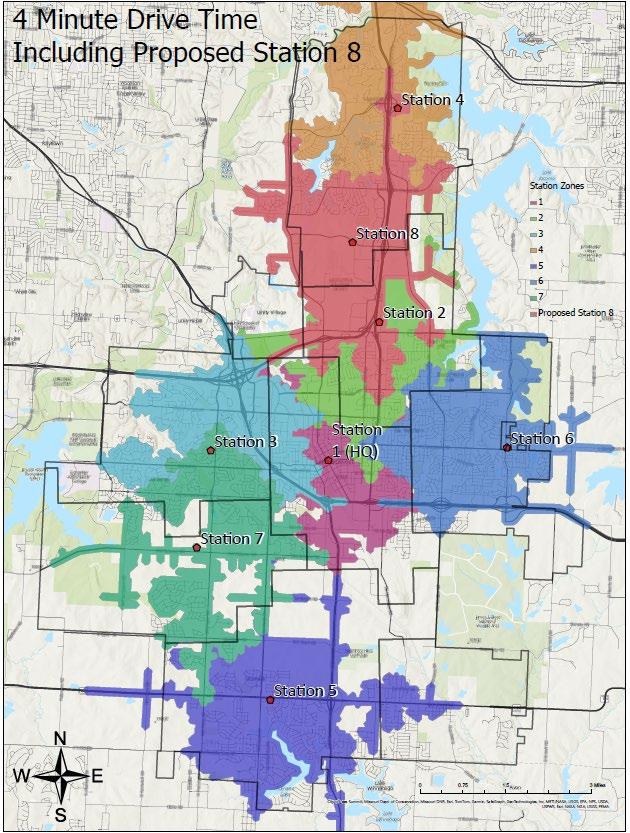
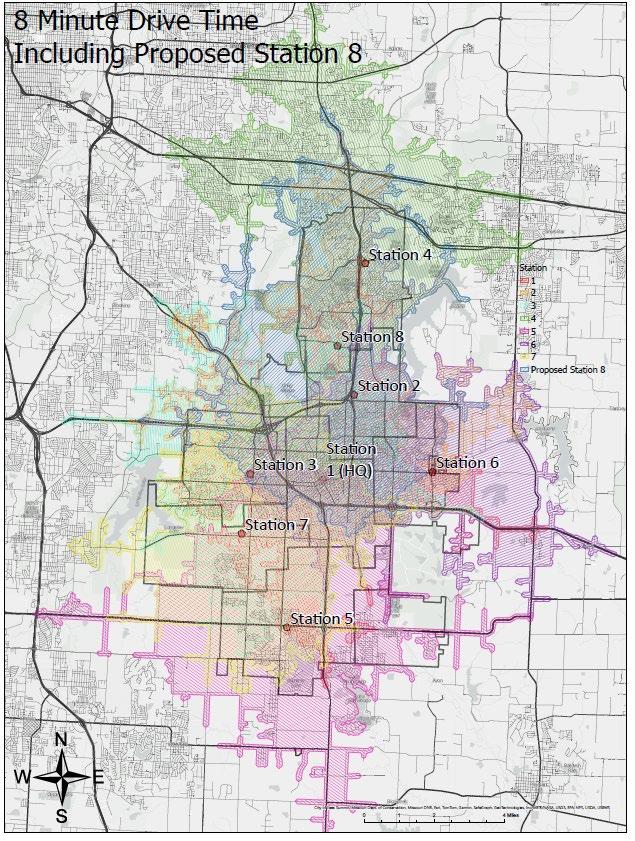
Immediate (within 12 months) Recommendations:
1. The department should work collaboratively with other city resources to support the research, evaluation, and application process for grant funds that could potentially offset the costs associated with departmental expansion and continuous improvement strategies.
2. Conduct a comprehensive strategic planning evaluation for the new Station 8 location.
3. Establish a workgroup to evaluate response data, identify trends, and suggest recommendations. Special focus on turnout times and where the department is not meeting response benchmarks.
4. Evaluate ProQA data for Communication Center dispatch times.
5. Evaluate staffing and deployment of specialty resources (ex., HazMat, Tech Rescue, Drone, etc.).
6. Closely monitor current/upcoming development projects (ex. Property Reserve Inc (PRI) land, airport expansion, and development along Colbern and Douglas).
7. Evaluate qualifications needed for all Fire Department teams. These teams include HazMat, Pub Ed, Tech Rescue, Tac Medic, Drone, Peer Support, Peer Fitness, and FIU.
8. Investigate available technology to assist in the compliance monitoring process and data analysis needed for accreditation and strategic planning. Also, investigate available technology to assist in the emergency management tracking process and functionality of the Emergency Operations Center (EOC).
9. Continue to research and implement available information-sharing technologies. These efforts will enhance department operations and improve its ability to serve and communicate with the public.
Near Term (within 2-5 years) recommendations:
1. Continue to evaluate the Communications Center to ensure proper staffing levels to enhance operational effectiveness, safety, and efficiency.
2. Evaluate staffing levels for the Emergency Management Division to manage the EOC and Region A operations and plans for the needs of the community.
3. Increase staffing levels in administration to efficiently and effectively manage departmental operations and plan for the needs of the community. When funding allows, add administration staffing consistent with the span of control recommendations of one administrator managing between three to seven operational personnel.
4. Begin design and construction of an additional station (Station 8) at the airport location.
5. Create and evaluate emergency management processes, training opportunities, and documentation.
6. Evaluate training capabilities and resources for future enhancements.
7. Monitor the call volume and response times from all stations, and if warranted, consider additional staffed resources. Additional resources could assist with reliability issues identified within high demand zones and the rest of the community.
8. Ensure ladder trucks are stationed in the best position to respond most efficiently to tactical-related risk structures throughout the city.
9. Actively participate in the comprehensive planning processes for the city. Ensure that all development planning includes input and recommendations from fire personnel related to fire protection for the city.
10. Evaluate the Behavioral Health program and identify any additional needed resources.
11. Assess the opportunities to collect call-handling data between the primary PSAP and secondary PSAP for each incident.
12. Evaluate minimum staffing on all apparatus. Increasing staffing on apparatus would allow the ERF to arrive sooner with fewer physical resources to transport personnel to high-risk incidents.
1. Evaluate the opportunity for a different deployment model/prioritization of calls within the CAD system based on EMD and EFD determinations.
2. Evaluate opportunities to construct additional stations based on response time data. Develop plans to address the travel time issues identified for coverage areas that currently exceed NFPA 1710 response time recommendations. Strategically plan, using creative deployment concepts and progressive strategies to minimize the impact of elongated response times to the community.
3. Continue to evaluate changes in technology and improvements in Computer Aided Dispatch (CAD), Records Management System (RMS), data analytics software, and Emergency Management software.
The department will be following the Commission on Fire Accreditation International (CFAI) model for performance compliance as identified in the current CFAI Standards of Cover Edition. In the department guiding document, Policy 44, the department has adopted a performance compliance plan that addresses how, by whom, and how often the process will be evaluated.
Establish and Review Performance Measures
Make Adjustments and Repeat Process
Validate Compliance
Evaluate Performance Develop Compliance Strategies Communicate Expectations to the Organization
Phase 1.
Establish or Review Performance Measures:
• Identify what performance measures will be monitored and how often they will be reviewed internally and externally.
Phase 2.
Evaluate Performance:
• Evaluate performance as part of an ongoing quality assurance program to ensure organizational compliance against the performance measures.
Phase 3.
Develop Compliance Strategies:
• Immediate action items to close the gaps in particular areas.
• Resources that can be/should be reallocated.
• Alternative methods to provide service at the desired level.
• Budget estimates as necessary while considering the cost and benefit.
• Maximization of existing resources.
• Develop a plan of action.
Phase 4.
Communicate Expectations to the Organization:
• Provide appropriate levels of training/direction for all affected personnel.
• Explain the method of measuring compliance with personnel who are expected to perform the services.
• Provide feedback mechanisms.
• Communicate consequences for noncompliance.
• Empower personnel within the organization to identify the need to modify processes as necessary to comply should there be a conflict with new methods.
Phase 5.
Validate Compliance:
• Develop and deploy verification tools and/or techniques that can be used by the organization on an ongoing basis to verify compliance with the measures.
• Review of the performance by apparatus, company, and overall performance.
• Review of critical tasking through the post-incident analysis process.
Phase 6.
Make Adjustments and Repeat the Process:
• It is necessary to review changes to ensure service levels have been maintained or improved.
• Adjustments will be made as the need arises on a continuous basis.
The compliance team is made up of the accreditation manager, data analyst, and members of the Emergency Response Performance and Outcomes (ERPO) Committee.
To ensure the agency is meeting or exceeding current service level objectives, monthly monitoring of service level baselines must be conducted. Included in the review shall be a summary of the results of the service level objectives consisting of:
- Primary PSAP data from MARC
- Call processing times for all emergency incidents
- Department-wide turn-out times
- Operational demand by program
- Operational demand by apparatus
- Mutual Aid
A gap analysis will be performed of current results with previous results and calculations of the difference between time periods. Turnout times by shift, company, and apparatus will be reviewed.
The final report will be presented to the Fire Executive Team prior to the conclusion of the following month (typically within the first fifteen days). This report should be reviewed monthly at the fire department staff meeting and shared with the labor group in monthly labor/management meetings.
A report is developed monthly and presented to the Public Safety Advisory Board (PSAB), which is an appointed board by the City Council and made up of Lee’s Summit residents. A city council member is assigned as a liaison to the board. The report contains demand by dispatch type, EMS contacts and transports, communications center activity, incident comparison, and demand by station.
To ensure the agency is meeting current service level objectives, quarterly monitoring of service level baselines must be conducted on a regular basis. Included in the review shall be a summary of the results of the service level objectives consisting of:
- Turn-out times by shift, company, and apparatus
- Operational program demand
- Operational program demand by accreditation planning zone
- Outcomes by program
A gap analysis will be performed of current results with previous results and calculations of the difference in results between time periods.
The final report should be presented to the Fire Executive Team each quarter prior to the conclusion of the following month (typically within the first fifteen days).
This report should be reviewed quarterly at the fire department staff meeting and labor/management meeting.
To ensure the agency is meeting current service level objectives, monitoring of service level baselines must be conducted on a regular basis. The compliance team will review service level baselines on an annual basis. Included in the review shall be a summary of the results of the service level objectives consisting of:
- Response performance report for all programs and risk levels (full performance tables)
- Call processing, turnout, distribution, and concentration
- Turn-out times by shift, company, and apparatus
- Operational program demand
- Operational program demand by accreditation planning zone
- Operational demand by apparatus
- Outcomes by program
- Mutual Aid
A gap analysis will be performed of the results with the previous year’s results and calculations of differences in results between years.
In addition to the review of service level objectives, the compliance team will review the response demands within each zone and the identified risks within. The compliance team will determine if there have been any changes within a planning zone, changes to service demands, or changes in standards or operations that impact the service level objectives or the SOC document. These reviews will be conducted on an annual basis.
To aid in the presentation of this information, the compliance team will work as a group to assist department administration in the interpretation of data and considerations for improvement towards closing the gap between the benchmark goal and the baseline performance. The final report will be presented to the Fire Executive Team annually. This report will be reviewed annually at the fire department staff meeting and labor/management meeting to provide awareness of emergency response performance gaps.
Program appraisals are core competencies in the Commission on Fire Accreditation International (CFAI) model and will be appraised annually, at a minimum. Each program leader will appraise their assigned program and provide a detailed assessment of the department-approved template. Appraisals will be reviewed and finalized by the Accreditation Manager and submitted to the Fire Executive team for review and follow-up.
The SOC document will be completely rewritten every five years to match accreditation cycles. Prior to the fourth year in each accreditation cycle, a SOC team will be established for the development and writing of the next SOC. The next edition of the Lee’s Summit Fire Department’s SOC will be published no later than the year 2030.
The value of an effective and accurate performance evaluation for the organization and the community cannot be overstated. The department continually strives to achieve the benchmark goals established by the community, which requires a significant amount of evaluation. The performance areas currently under evaluation will expand as the department begins to measure specific program and community outcomes in addition to the service level baselines outlined in Policy 44.
Whenever possible, new outcome measurements are developed and evaluated once the tracking methodology can be established and documented. All new service delivery measurements and outcomes will be included in the compliance team meetings, at which point the committee can work to develop improvement strategies for departmental data collection processes and, ultimately, the outcomes they measure.
A report is developed monthly and presented to the Public Safety Advisory Board (PSAB), which is an appointed board by the City Council and made up of Lee’s Summit residents. A city council member is assigned as a liaison to the board. The report contains demand by dispatch type, EMS contacts and transports, communications center activity, incident comparison, and demand by station.
An annual compliance report will be generated and submitted to the Commission on Fire Accreditation International (CFAI) for review.
In compliance with CFAI performance indicators 2D.8 and 2D.9, the fire chief and the accreditation manager will deliver an annual report to the authority having jurisdiction (AHJ). This report will serve to notify the AHJ of any gaps in the operational capabilities and capacity of its current delivery system to mitigate the identified risks within its service area (2D.8) and of any gaps between current capabilities, capacity, and the level of service approved by the AHJ (2D.9).
The compliance team and Fire Executive Team will assess the department’s current deployment strategies for all emergency service operations against the community risks that are within its response area. Whenever deficiencies and/or inefficiencies appear, the compliance team will report them to the fire chief and work to develop strategies that address the performance gaps, which will improve the safety and quality of the service provided to the community. These performance evaluations, promulgated in Policy 44, will occur whenever gaps are identified.
Any inadequacies or negative trends that limit the service delivery capabilities of the organization will be reported to the AHJ and the community at least annually.