Creative Sector Economic Impact Assessment
October 2025
Prepared for:

Prepared by:

October 2025
Prepared for:
Prepared by:
Nordicity was engaged to provide an updated assessment of the economic and social contributions of Kelowna’s creative sector, building on the City’s earlier studies in 2010 and 2019. The creative sector encompasses arts and cultural organizations, creative industries, and related service providers that generate cultural content, deliver creative services, and support cultural participation.
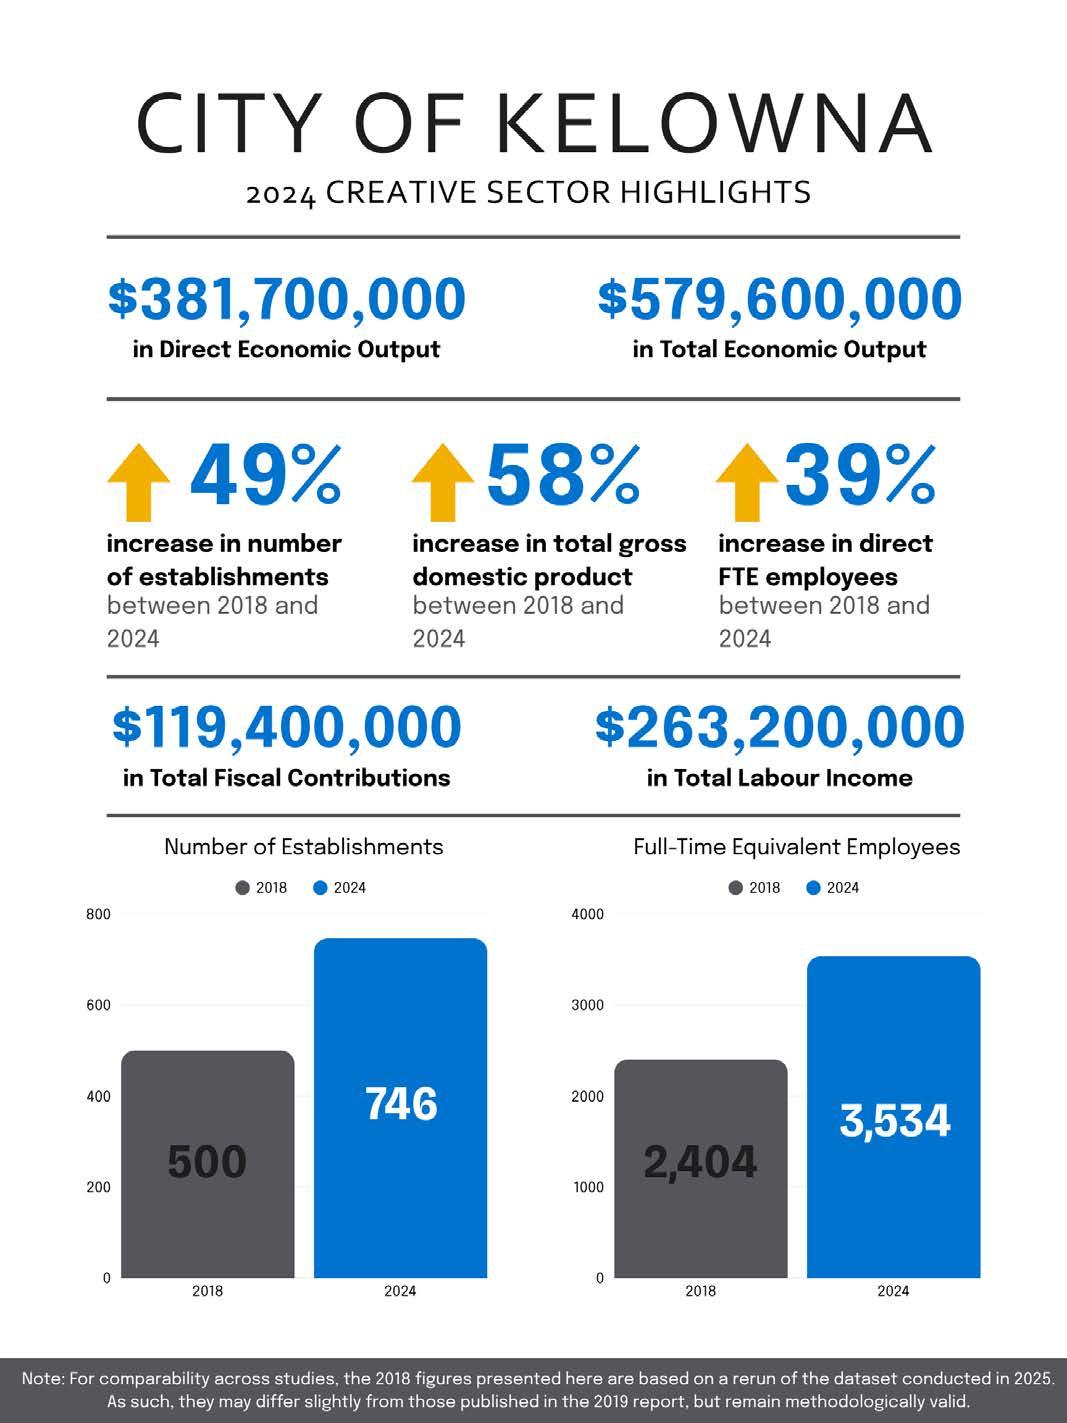
As shown by the statistics on the next page, the sector has expanded significantly since 2018. In 2024, Kelowna’s creative sector generated $579.6 million in total GDP, including $381.7 million directly from creative activity and a further $197.9 through indirect and induced effects. The sector supported more than 3,500 full-time equivalent jobs and $263.2 million in labour income, while generat ing $119.4 million in fiscal contributions to federal, provincial, and local governments.
Across the sub-sectors, film and new media sub-sector stands out as the largest contributor to direct economic activity, more than doubling its GDP impact since 2018. Performing arts nearly doubled its GDP and increased employment by 75%, while visual arts and arts instruction also grew strongly. In contrast, events and festivals and literary arts contracted over the same period.
Kelowna and the broader Okanagan region benefit from a highly engaged cultural consumer base. Nearly half (46.4%) of households in Kelowna fall into consumer groups with elevated interest in cultural participation. The audience include younger families with high attendance at cultural fairs, cinemas, and community theatres, as well as senior residents with both the time and resources to support local arts organizations and events. Overall, these audience groups in Kelowna show a strong preference for accessible, lower-cost, community-based experiences that offer meaningful social and cultural engagement within their community.
Arts and culture also contribute to Kelowna’s tourism economy by extending the season beyond summer peaks and diversifying the visitor experience. While cultural tourism data is difficult to separate from overall tourism statistics, broader research indicates that cultural tourists often stay longer and spend more per visit. This overall trend suggests strong untapped potential for growing Kelowna’s cultural tourism offering.
Beyond its economic footprint, the creative sector is central to Kelowna’s community well-being. This sector plays a vital role in fostering connection and creativity
At the same time, the sector faces growing pressures. Volunteerism remains a cornerstone of Kelowna’s cultural ecosystem, yet early signs of decline since 2023 have emerged, echoing broader national trends in reduced volunteer engagement. Cultural organizations increasingly face the challenge of “doing more with less” as they balance rising community demand with fewer donors and a shrinking volunteer base.
The sector continues to be a driver of social inclusion, equity, and reconciliation. Public art in Kelowna offers a way to honor Indigenous perspectives and pay respect to the rich cultural heritage of the Okanagan people. Through public art, inclusive programming, and the amplification of diverse voices, the creative sector creates accessible spaces for connection, learning, and expression. These efforts not only enrich Kelowna’s cultural fabric but also build bridges across communities, ensuring the sector remains both economically impactful and socially meaningful.
Kelowna’s creative sector is a vital contributor to the city and region’s economic resilience, cultural vibrancy, and community well- being. As noted in the 2010 report, The Creative Sector in Kelowna, British Columbia: an economic impact assessment, 1 and the 2019 report, Kelowna Creative Sector Economic Impact Assessment, 2 the sector plays a critical role in driving GDP, attracting a skilled workforce, and supporting tourism.
The City of Kelowna has demonstrated a long-standing commitment to understanding and supporting the value of its creative sector. Building on the foundational work of the 2010 and 2019 Economic Impact Assessments (EIAs), the City engaged Nordicity to quantify and analyze the sector’s current economic contribution. These previous studies helped establish critical benchmarks for sector development and have supported cultural planning and advocacy efforts over time. This 2025 update, based on 2024 data, aims to build on previous data and provide a timely and evidence- based document to inform strategic decisions related to cultural investment, community partnerships, and the development of Kelowna’s next Cultural Plan.
Since the last EIA was completed, the creative sector has undergone significant transformation, shaped by evolving audience behaviours, changing cultural funding patterns, and the lingering effects of the COVID-19 pandemic. At the same time, Kelowna continues to experience strong growth in areas such as creative entrepreneurship, cultural tourism, and placemaking initiatives. These shifts underscore the importance of revisiting the sector’s impact to ensure that local planning priorities remain responsive and future-proof.
The purpose of this 2025 Creative Sector Economic Impact Assessment is to provide a data-driven, evidence- based picture of the current scale and value of Kelowna’s creative sector. Specifically, this study aims to:
Quantify the direct, indirect, and induced economic impacts generated by creative sector activities within the city, including GDP, employment, and labour income.
Highlight the profile of Kelowna’s creative sector, including the types of establishments and sub-sectors represented.
Explore the intersection of culture and tourism, as well as the social benefits of the creative sector in Kelowna.
Both the 2019 and 2010 reports observed that while the term “arts and culture” is fairly inclusive, it is sometimes interpreted too narrowly – excluding, for example, commercial creative industries as well as service and material providers, all of which play essential roles in the ecosystem. To address this limitation, those studies adopted the broader term “ creative sector,” and this 2025 update does the same.
In this report, the creative sector encompasses arts and cultural organizations, creative industries, and related service providers that generate cultural content, deliver creative services, and/or support cultural participation. Sub-sectors are further defined and characterized in the Creative Sector Profile section of this report.
1 The Creative Sector in Kelowna, British Columbia: an economic impact assessment. Bernard Momer. The University of British Columbia Okanagan. March 2010.
2 Kelowna Creative Sector Economic Impact Assessment. July 2019. Prepared by Vann Struth Consulting Group Inc
This study updates the 2019 Economic Impact Study of Kelowna’s creative sector by providing 2024 estimates of the sector’s size and associated economic activity. For clarity, the 2019 study was based on the 2018 data, and likewise, this 2025 study is based on the 2024 data.
The scope is limited to the geographic boundaries of Kelowna, with provincial-level data used only in limited circumstances. For example, British Columbia wages were used when city-level detail was unavailable.
The sector definition remains consistent with the 2019 study, grounded in the same set of creative industry classifications. These classifications have been updated to align with the latest version of the North American Industry Classification System (NAICS). 3 While the prior study supplemented its analysis with survey data to proxy for hard-to-observe economic activity, this 2025 iteration uses a more conservative approach: estimates are based strictly on publicly available data tables from Statistics Canada, with no additional primary data collection. This approach allows for a more consistent and replicable measurement of activity over time.
The MyEIA Model™ (Nordicity’s proprietary economic impact assessment tool) was used to calculate direct, indirect, and induced economic impacts. Direct output and employment values were derived from Statistics Canada datasets and paired with average wage estimates by occupation. To support consistency and replicability over time, this study relies primarily on national statistical tables, with only limited use of local organizational or administrative data
This analysis defines the creative sector using the North American Industry Classification System (NAICS), the standard framework for organizing industries in Canada and across North America and the National Occupational Classification (NOC). NAICS is a hierarchical system that groups economic activity into sectors (2-digit codes), subsectors (3-digit), industry groups (4-digit), and specific industries (5- and 6-digit codes). As of this study, all NAICS assignments reflect the 2019 version published by Sta tistics Canada.
To reflect the cross-sector nature of creative activity, this study applies the creative sector definition at the most granular level appropriate. In some cases, entire industry groups are included (e.g., 7111 – Performing Arts Companies), while in others, only specific 6-digit industries are relevant (e.g., 453920 – Art Dealers, 459140 – Musical instrument and supplies retailers), even if broader parent categories (45 – Retail Trade) are not. This selective approach ensures the inclusion of core creative activity without inflating totals by incorporating non-related industries.
NOC codes were used to estimate total employment within each creative industry. While NAICS provides a structural view of output and revenue by industry, NOC enables a more detailed understanding of the specific occupations within those industries. For each NAICS industry included in the analysis, the associated NOC codes were mapped and paired with average employment counts and wage data. This approach provides a more accurate estimate of the number of creative workers in Kelowna and supports the calculation of total wage impacts across the sector.
3 North American Industry Classification System (NAICS). NAICS 2022 Version 1.0
Economic impact estimates in this study were generated using Nordicity’s proprietary MyEIA Model™, a modeling platform that applies Statistics Canada multipliers to estimate the direct, indirect, and induced effects of economic activity across several dimensions. MyEIA was selected for its alignment with public data sources and its capacity to model multiple forms of impact using a transparent, replicable framework.
The model produces estimates across three channels of impact:
Direct: Economic activity within creative sector firms.
Indirect: Supply chain activity generated by purchases from creative firms.
Induced: Household spending supported by the wages of those employed directly and indirectly.
Each of these channels is quantified across several outcome dimensions:
Full-Time Equivalents (FTEs)
Cost of Labour
Gross Domestic Product (GDP) Contribution
Tax Revenues
Inputs to the model were derived from Statistics Canada tables and included average wages by occupation, employment counts by NAICS–NOC combinations, and aggregate labour cost estimates. Employment counts were calculated using establishment size categories (e.g. 1–4, 5–9, 10–19 employees), with the median value of each bucket used to generate total employment inputs. These employment inputs were batched and matched to the corresponding creative sector codes to estimate total activity.


Nordicity’s MyEIA Model is a customized economic impact analysis tool that utilizes Statistics Canada’s Input-Output tables, along with other economic data (e.g., industry wages) to estimate how increased expenditures in any industry translate into additional employment, labour income, and GDP. The MyEIA Model also provides estimates of the additional federal, provincial, and local tax revenue generated by any additional economic activity.
The customized nature of MyEIA Model means that it can provide reliable estimates for any industry, even if the industry is not among the industries that comprise Statistics Canada’s Input-Output tables. With detailed data on expenditures within an industry or any type of economic shock, the MyEIA Model can generate estimates of direct, indirect, and induced impacts.
The MyEIA Model uses an inverse Leontief matrix based on Stats Canada Input-Output tables to derive estimates of the indirect impact generated by purchases of goods and services. The model uses Type II impact ratios published by Statistics Canada to derive induced impacts.
Cultural Output: The total value of goods and services produced by creative sector organizations and individuals. This includes artistic performances, media content, creative services, and cultural products generated for public consumption or sale.
Gross Domestic Product (GDP) / Value Added: The value of cultural output minus the cost of intermediate goods and services used to produce it. This represents the net economic contribution of the creative sector to the broader economy and is equivalent to “value added” in input-output modeling.
Labour Income: The total earnings received by individuals working in the creative sector, including salaries, wages, and freelance or contract fees. This captures compensation for labour but excludes business profits or capital returns.
Direct Economic Impact: The output, employment, GDP, and labour income generated directly by creative sector activity that is, by artists, creative workers, and cultural organizations producing goods or services.
Indirect Economic Impact: The economic activity generated when creative organizations purchase goods and services from suppliers in other industries (e.g., printing, technical equipment, accounting). These upstream supply chain transactions support employment and output outside the creative sector.
Induced Economic Impact: The broader economic ripple effects that result when workers in the creative sector (or in its supplier industries) spend their earnings on goods and services – such as groceries, housing, and transportation. These expenditures support additional employment and GDP throughout the local economy.
Total Economic Impact: The sum of direct, indirect, and induced impacts. This represents the full economic footprint of the creative sector, including both sector-specific activity and broader downstream effects.
Key Assumptions
Employment Estimation: Employment counts were derived using Statistics Canada business count data by industry and firm size. For each establishment, employment was estimated based on the midpoint of its reported employee-size bucket, rounded down (e.g., businesses reporting 1–4 employees were assigned a value of 2). This approach was applied individually to each establishment across all relevant NAICS codes. Non-employer businesses (with zero employees) were assigned a value of 1 to reflect sole proprietors actively operating in the sector.
Wages: Weekly average wages by occupation (sourced from Statistics Canada Table 14- 10-0204-01) were scaled up to estimate annual labour costs per FTE. A 52-week multiplier was applied, assuming full-year employment across all included occupations. No adjustments were made for part-time or seasonal employment; this approach is consistent with the use of FTE-based modeling in the MyEIA platform.
GDP Ratios: Direct GDP contributions were estimated using provincial-level GDP-to-labour cost ratios for each included industry. These ratios convert total labour compensation into value-added output. Importantly, this approach was applied only to the direct output estimates; indirect and induced GDP impacts were calculated separately using Statistics Canada’s symmetric input-output (SIO) model.
Input-Output Modeling: Indirect and induced impacts were estimated using BC-specific symmetric input-output tables from Statistics Canada. While the MyEIA platform is based on national input-output models, this analysis uses adjusted multipliers to better reflect the structure of British Columbia’s economy and the specific characteristics of the creative sector. These adjustments were applied consistently across all non-direct impacts to improve the accuracy of GDP and output estimates.
These estimates are subject to some limitations. Employment estimates based on size ranges and wage data reflect standardized assumptions and may not capture the full diversity of employment arrangements in the creative sector, particularly among freelancers or contract-based roles. While input-output models offer a well-established framework for estimating broader economic effects, they represent static relationships and generalized spending patterns and may not fully capture the localized dynamics, or informal activities present within Kelowna’s creative economy.
For simplicity, the creative sector has been summarized into five broad categories (2-Digit NAICS) drawn from more detailed industry classifications (5-Digit NAICS). For instance, information and cultural industries encompass activities such as publishing and recording, while arts, entertainment and recreation include performing arts groups and cultural venues. This aggregation allows for a big picture view of the sector’s overall composition and growth.
The number of creative sector establishments in Kelowna expanded significantly between 2018 and 2024, increasing by nearly 50% overall. Growth occurred across all subsectors, but the most striking increase came from information and cultural industries, which nearly tripled in size over the period. This subsector, which encompasses publishers, distributors, and recording studios saw the highest growth since 2018.
Based on the 2018 and 2024 analysis, the distribution of establishments across the creative sector shows that most of the growth between 2018 and 2024 was concentrated among self-employed businesses. Arts and entertainment, along with professional, scientific, and technical services, were the largest contributors to this increase, reflecting the prevalence of independent artists in these fields. Overall, the sector remains dominated by self-employed artists, a characteristic that will be explored further in the next section.
2024 Arts, entertainment and recreation
2018 Arts, entertainment and recreation
2024 Professional, scientific and technical services 2018
2018 Professional, scientific and technical services
2024 Information and cultural industries
2018 Information and cultural industries
While the creative sector has grown overall across both self-employed and employer-based establishments, the patterns vary by subsector. Establishments that fall under trades such as musical instrument shops and art dealers experienced a decline in employer- based establishments, with overall growth driven primarily by sole proprietors. Similarly, educational services saw a reduction in organizations like fine arts and music schools, offset by modest gains among self-employed operators. This finding points to a potential shift in appetite toward private tutors and music teachers as opposed to formal institutions. Despite these changes, the sector recorded steady expansion, with especially strong growth among selfemployed establishments since 2018.
Table 2: Establishment Type Growth Between 2018 and 2024
entertainment and recreation (Live theatres, Sports stadiums, Independent actors, independent writers, History museums, etc.)
The rate of self-employment in Kelowna’s creative sector has risen notably since 2018, reflecting not just a change in the number of establishments but also in the estimated number of occupations. These estimates are based on the distribution of employer sizes within NAICS data rather than full-time equivalent counts, and they reveal that shifts in establishment
patterns are mirrored in the workforce itself. For example, trades also saw the largest increase in self-employment, with nearly half of workers now operating independently. Overall, the creative workforce in Kelowna is increasingly characterized by independent workers and artists
Creative Industries (2-Digit NAICS Sectors)
(Musical Instrument retailers, Print and picture frame retailers, etc.)
Information and cultural industries (Art dealers, Music publishers, Record production and distribution, etc.)
Professional, scientific and technical services (Interior design services, Graphic design services, etc.)
Educational services (Fine art schools, etc.)
Arts, entertainment and recreation (Live theatres, Sports stadiums, Independent actors, independent writers, History museums, etc.)
Total Average of Occupations Above
NOTE: 2018 FIGURES ARE RE-ESTIMATES USING CURRENT METHODS AND NOT DIRECTLY COMPARABLE TO THE 2019 REPORT.
Overall, Kelowna’s creative sector has expanded rapidly since 2018, with the number of establishments growing by nearly half, and self-employed businesses driving much of this increase. Information and cultural industries, including publishers, distributors, and recording studios, have been the fastest-growing subsector, while trades and educational services show signs of restructuring toward smaller and more independent operators. The rise in self-employment is evident not only in the establishment data but also in the estimated number of occupations, reinforcing the sector’s strong entrepreneurial orientation. These trends highlight a local creative economy that is both growing in scale and evolving in structure, shaped increasingly by independent practitioners and small enterprises.
This section demonstrates the scale and growth of the creative sector’s economic contribution by:
Summarizing the economic impact (including total GDP, employment, labour income, and tax contributions with direct, indirect, and induced impacts)
Breaking down these results across sub-sectors to show their relative size and growth.
Highlighting the sector’s evolution by presenting employment (FTE) impact for each sub-sector along with their induced and indirect impacts.
Based on MyEIA and the data provided by Statistics Canada, the estimated total economic output of creative sector is outlined in Table 4.
Table 4: Total Economic Output of Creative Sector, 2024
In 2024, Kelowna’s creative sector generated an estimated $579.6 million in total GDP, with $381.7 million stemming directly from sector activity, and a further $197.9 million through indirect and induced impacts. The creative sector supported more than 3,500 full-time equivalent jobs The sector also contributes significantly to government revenues, generating an estimated $119.4 million in tax impacts in 2024. This included $70.1 million to the federal government and $49.4 million to the provincial and local levels combined. Personal income taxes were the largest component, accounting for more than $55.5 million, while corporate income taxes contributed $24.9 million. Sales taxes added a further $33.0 million, and local property taxes and fees provided just over $6.0 million.
To provide continuity with the 2019 study, the direct impacts of Kelowna’s creative sub- sectors were re-estimated using the same methodology applied in 2024. While the subsectors are aligned as closely as possible to those in the previous 2019 report, they should not be viewed as strictly comparable due to differences in data sources and methods. Instead, the 2018
figures presented here were recalculated to establish a consistent baseline against which to assess change over time. This approach ensures that the growth observed across sub-sectors reflects an accurate comparison, rather than variations in measurement.
Across the sub-sectors, the three largest in 2024 are film and new media, commercial arts, and performing arts. Film and new media represents the largest sub-sector, generating $188.6 million in GDP and $227.5 million in economic output, accounting for nearly half of Kelowna’s total creative economy. Commercial arts and performing arts follow, each contributing roughly $55 million in GDP and $65 million in economic output, underscoring Kelowna’s strength in both creative production and live performance.
Direct employment results show clear growth in several sub-sectors since 2018, particularly in performing arts, which expanded by 75%, and visual arts, which rose by 46% Art galleries and dealers also posted strong relative gains, while areas such as events and festivals and literary arts experienced declines. 4 Overall, the trends point to robust expansion in performance- driven and visual fields, even as other parts of the creative sector have contracted or stabilized.
4 The 2018 figures have been re-run using the current methodology to provide a consistent baseline, which means the numbers differ from those published in the previous report.
Table 6: Kelowna Creative Sector Direct FTE Growth, 2018, 2024
As shown below, when indirect and induced effects are considered, the employment contribution of Kelowna’s creative sector expands significantly, reaching an estimated 3,534 FTEs in 2024 compared with 2,404 in 2018 Full breakdowns for labour income and GDP by sub-sector are provided in Appendix B.
Table 7: Economic Impact of Full-Time Equivalents by Creative Sub-Sector Breakdown
NOTE: 2018 FIGURES ARE RE-ESTIMATES USING CURRENT METHODS AND NOT DIRECTLY COMPARABLE TO THE 2019 REPORT
Overall, Kelowna’s creative sector has expanded rapidly since 2018, with establishments growing by nearly 50%, led by information and cultural industries, and with a marked shift toward self- employment. The sector is both expanding in scale and evolving structurally, with growth concentrated in performance- driven and digital activities and a rising share of independent practitioners.
Beyond its economic contributions, Kelowna’s creative sector plays an increasingly important role in shaping the region’s community engagement, tourism offering, and economic value This section highlights who is participating in Kelowna’s cultural activities, where they engage with arts and culture, and how culture contributes to the tourism economy and the region’s social fabric.
Kelowna and the broader Okanagan region boast a highly engaged base of cultural consumers. According to Environics PRIZM data, 5 nearly half (46.4%) of Kelowna households fall into just five key consumer segments, each showing elevated interest in cultural experiences. For instance:
About 11.4% of Kelowna’s households are younger singles and families with high participation rates in fairs, cinemas, community theatre productions, craft shows, and music festivals. This group of is also highly engaged with online media and gaming.
Another 10.0% of Kelowna’s households are older and middle-aged residents, who have both the time and financial resources to support and attend local arts events, such as theatre and art galleries.
Nearly 9.0% of households are middle-aged families in suburban neighbourhoods, with participation that leans toward community-based sports and recreational activities but also includes interest in local cultural events.
Around 8.3% of households are growing families with school-aged children, who balance household commitments with cultural and recreational activities, often seeking affordable, family-oriented experiences.
About 8.0% of households are younger, lower-income singles and families, many in rental housing, who show interest in accessible, lower-cost cultural and leisure activities such as craft shows and video arcades.
Similarly, in the broader region (267,710 households), residents display similar patterns of engagement, with a large share of households participating in traditional media, community theatre, craft shows, and music festivals.
Overall, key consumers in Kelowna and Okanagan region value lower-cost, community-based experiences that offer meaningful social and cultural engagement within their community Their participation in live, local cultural offerings reflects a strong foundation for growth in Kelowna’s locally produced creative sector.
Behavioural data reinforces the demand for live, community-oriented cultural participation. When benchmarked against the BC average, Kelowna residents demonstrate higher-than-average attendance across a wide range of arts and culture activities such as wine festivals, concerts, community theatres According to the Environics leisure attendance report, 6 each activity is shown both as a percentage of households that participate and as an index comparing Kelowna’s participation to the BC average (with 100 representing the provincial average; scores above 100 indicate Kelowna residents are more likely to attend).
Kelowna residents show a preference for the following:
Beer/food/wine festivals: 12.9% (index 126)
Concerts at casinos: 11.8% (index 123)
Theatre at community theatres: 21.6% (index 117)
5 Environics. Demographics Executive Summary. PRIZM Profile. Top Segments. Trade Area: Kelowna, BC.2024
6 Environics. Behavioural. Sports & leisure overview. Trade Area: Kelowna. BC. 2024
Concerts at theatres/halls: 35.8% (index 114)
Regional behavioural data for the broader Okanagan area reflects similar patterns, with residents also showing aboveaverage participation in food/wine shows (index 162), comedy clubs/shows (index 132), and speciality movie theatre (index 118)
These participation patterns point to a strong cultural affinity among residents for community-based and locally rooted experiences. From theatre and concerts to festivals and heritage attractions, these activities reflect not only personal preferences but also a broader sense of connection to Kelowna and the Okanagan’s unique cultural offerings. The popularity of events tied closely to local cultural identity underscores the region’s social cohesion, sense of place, and a recognition of shared creative expressions within a community The attendance patterns of Kelowna and Okanagan residents reinforce the importance of community- driven arts and cultural programming in fostering belonging and enhancing quality of life.
While family vacations, sightseeing, and winery touring remain key draws for visitors to Kelowna, 7 arts and culture festivals and events provide distinct value by helping extend visitation beyond the summer season and diversifying the local experience. As noted in the 2022 report, Economic Impact of the Tourism in the Greater Kelowna Area, 8 the greater Kelowna area features a wide array of outdoor attractions, recreation, arts, and entertainment offerings available to visitors yearround.
Although the primary reasons for travel to Kelowna continue to be visiting family or engaging in agricultural and wineryrelated experiences, many visitors also integrate cultural activities into their itineraries. Industry studies show that cultural tourists often travel in larger parties, stay longer, and spend more per capita than non-cultural tourists 9 While Kelowna-specific data on cultural tourist spending is limited, these broader findings suggest strong potential for arts and culture to contribute to the region’s tourism economy.
As to the employment impact, visitor activities in Kelowna directly supported approximately 8,750 jobs, earning $373 million in direct wages and salaries. The overall tourism sector contributed $719 million in direct GDP and $1.6 billion in direct output in BC. 10 Arts, culture, and entertainment activities, including festivals, theatres, galleries, and museums, accounted for 198 direct jobs, making up 2% of tourism employment. Although this figure is modest compared to sectors like accommodations (1,760 jobs) or food and beverage (1,654 jobs), the unique role of cultural offerings lies in their capacity to drive visitation during shoulder seasons and enhance destination appeal
Arts and culture contribute meaningfully to Kelowna’s tourism economy by attracting visitors, supporting jobs, and extending the tourism season beyond peak summer months. While currently a smaller slice of the total tourism pie in terms of direct jobs, cultural tourism provides qualitative value: enhancing the city’s brand, increasing tourist satisfaction, and offering community-based, authentic experiences that distinguish Kelowna from other destinations
Community Engagement and Volunteerism
7 Tourism Kelowna. 2024 Facts and Figures.
8 2022 Economic Impact of Tourism in the Greater Kelowna Area. Prepared for Tourism Kelowna. December 2018, 2023
9 Travel Manitoba. Manitoba Arts Council. The Size, Value and Economic Impact of Arts and Culture Tourism in Manitoba by FORUM Research.
10 2022 Economic Impact of Tourism in the Greater Kelowna Area. InterVISTAS. December 18, 2023.
Volunteerism continues to play a critical and often underrecognized role in supporting the creative sector. As highlighted in the 2019 Kelowna Creative Sector Economic Impact Assessment, volunteers contributed over 380,000 hours to Kelowna’s creative sector in 2018, with the majority of these efforts focused on events and festivals. The study also noted that approximately half of organizations in arts education, cultural facilities, performing arts, and service/materials providers were supported by volunteers to deliver programs and maintain operations.
Recent national data points to a downward trend in volunteer engagement. According to 2023 Survey of Giving, Volunteering, and Participating findings, 11 the percentage of Canadians volunteering for nonprofits and charities dropped from 41% in 2018 to 32% in 2023, with total volunteer hours declining by over 25% (from 1.7 billion to 1.2 billion hours). This reduction is equivalent to a loss of roughly 451,000 full-time jobs. The impacts of the COVID-19 pandemic, long-term demographic shifts, and reduced institutional volunteering have all contributed to this contraction.
While national volunteerism rates have declined significantly, local data suggests that volunteer contributions to the creative sector in Kelowna remain stable and valuable. Volunteer engagement fluctuated during the pandemic, and yet participation rebounded in the years that followed. From 2020 to 2023, both the number of volunteers and total hours increased, demonstrating the sector’s continued reliance on community support. However, early signs of a downturn since 2023 have emerged, with City funded organizations reporting recent declines in volunteerism. This trend may reflect broader sector challenges and deserves further study
$800,000.00
$700,000.00
$600,000.00
$500,000.00
$400,000.00
$300,000.00
$200,000.00
$100,000.00
Value of volunteers (CAD) Volunteer hours total (hours) Number of volunteers in the community (persons)
Overall, these figures underscore the sector’s growing pressure to “do more with less.” As cultural organizations face rising demand for community- driven activities, fewer donors, and a shrinking volunteer base, they must continue to adapt in order to balance operational needs with community engagement goals
Public art contributes to the social fabric of Kelowna by creating accessible, inclusive, and welcoming spaces that foster community connection. As highlighted in the City’s 2020–2025 Cultural Plan, culture as a whole plays a key role in improving 11 Statistics Canada. Survey Imagine Canada
quality of life, enhancing community safety, reducing social exclusion, and supporting meaningful relationships. 12 Within this context, the City’s Public Art Program is designed to make creative expression visible and accessible in shared spaces, ensuring that residents and visitors alike can engage with culture on a daily basis 13
Public art also acts as a platform for equity and inclusion, offering opportunities to reflect diverse voices and perspectives in the community. 14 By commissioning works that represent a range of cultural identities and lived experiences, Kelowna signals a commitment to representation and belonging, ensuring that all residents can see themselves reflected in the city’s cultural landscape.
Public art in Kelowna offers a way to honour Indigenous perspectives and pay respect to the rich cultural heritage of the Okanagan people. Embedding Indigenous narratives, histories, and aesthetics into the built environment creates opportunities for reconciliation, cultural understanding, and deeper recognition of place. 15 These works not only enrich Kelowna’s cultural identity but also provide residents and visitors with pathways to engage with the city’s history in respectful and meaningful ways.
Beyond its economic contributions, Kelowna’s creative sector plays an essential role in fostering social well- being and community vitality. Arts and culture bring people together, strengthen social ties, and cultivate a sense of belonging. Nordicity’s Central Okanagan Music Strategy highlights how creative activity contributes to building inclusive, vibrant communities by offering shared experiences that enhance social cohesion and collective identity. 16
The sector also supports equity and access by reducing barriers to participation and ensuring that diverse communities see themselves represented in the cultural landscape. 17 A healthy creative ecosystem celebrates a wide range of genres, traditions, and cultural expressions, enabling residents to connect with their heritage and fostering intercultural understanding.
These social benefits extend beyond audiences and participants to the community at large. By creating inclusive spaces for connection, learning, and expression, the creative sector enhances quality of life, promotes civic pride, and reinforces Kelowna’s identity as a welcoming and dynamic city. 18
While developing strategic recommendations was beyond the scope of this impact assessment, the study highlighted several areas that could warrant further consideration to strengthen the creative sector’s development in Kelowna.
12 2020-2025 Kelowna Cultural Plan. https://www.kelowna.ca/sites/files/1/docs/kelowna_2020-2025_cultural_plan__page_by_page_-_compressed_low_res_-_for_website.pdf
13 Call to Artists, City of Kelowna Public Art. https://www.kelowna.ca/sites/files/1/docs/related/2025.07.16_rprc_eoi_4.3_f.pdf?
14 2018 Art in Public Places Policy. City of Victoria. https://www.victoria.ca/media/file/public-art-policyepdf
15 Smetzer, Megan A. 2024. "Replacing Settler Spaces: The Transformational Power of Indigenous Public Art" Arts 13, no. 2: 60. https://doi.org/10.3390/arts13020060
16 Central Okanagan Music Strategy by Nordicity. September 2021. https://creativeokanagan.com/wpcontent/uploads/2024/01/COMS-Report-Final-web.pdf
17 Enabling British Columbia’s Creative Sector. CreativeBC. 2022. https://cabe.ca/wp-content/uploads/2022/04/APEBCWebinar-Enabling-BCs-Creative-Sector.pdf
18 Arts and Heritage in Canada: Access and Availability Survey 2012. November 30, 2012. https://canadacouncil.ca/research/research-library/2012/11/arts-and-heritage-in-canada
Supporting creative entrepreneurs: With a growing share of individual artists (businesses without employees), there may be opportunities to strengthen supports for creative entrepreneurs – for example, through artist studios, shared spaces, micro-grants, or training programs.
Enhancing data collection on cultural tourism: More regular and targeted data collection on cultural tourism, including visitor profiles, motivations, spending patterns, and the impacts of festivals and events, would help better capture the sector’s role in tourism and inform policy and advocacy.
Sustaining volunteerism and operational capacity: Given national declines in volunteering and local fluctuations, strategies to engage and retain volunteers will be important for sustaining the capacity of arts and culture organizations. This support could include city-wide volunteer campaigns, recognition initiatives, or shared volunteer pools across organizations.
Advancing reconciliation and Indigenous cultural expression: Strengthening the presence of Indigenous voices and perspectives across cultural planning, funding, and programming would reinforce respect for the rich heritage of the syilx/Okanagan people.
Embedding diversity, equity, inclusion, accessibility, and reconciliation (DEIAR) across cultural planning and cross-sectoral initiatives: Continued emphasis on DEIAR in cultural planning and funding would help ensure that the sector reflects and serves the diversity of Kelowna’s population.

Nordicity (www.nordicity.com) is an international leader in developing methodologies to evaluate the economic, social, and cultural contributions of arts and cultural activity. Through a broad network of associates and global projects, Nordicity has advanced approaches to measuring the impacts of the creative and cultural sectors, while supporting strategy development at municipal, regional, and national levels. We provide evidence-based recommendations that strengthen cultural and creative industries, broaden audience reach, attract investment, and enhance cultural vitality through informed planning and policy.
Nordicity Team
Carly Frey | Partner: Project Director
Dustin Chodorowicz, CFA | Partner: Chief Economist & Project Advisor
Joy Pan | Consultant: Project Manager & Research Lead

Ryan Lee | Senior Analyst: Analysis Lead