2023 - 2032


2023 - 2032
The 10-Year Capital Plan (the Capital Plan) forecasts infrastructure investment for 2023 – 2032. The Capital Plan anticipates current and future cost pressures, stretches the limits of revenues by source, and makes the necessary decisions to put in place essential infrastructure to support a future Kelowna.
Rapid growth, renewal of aging infrastructure, COVID recovery, inflation and rising interest rates are challenges facing the Capital Plan. In response, the City of Kelowna (the City) is:
• Listening to Council and prioritizing investment where and when it is most needed.

• Exploring alternative funding through partnerships and grants


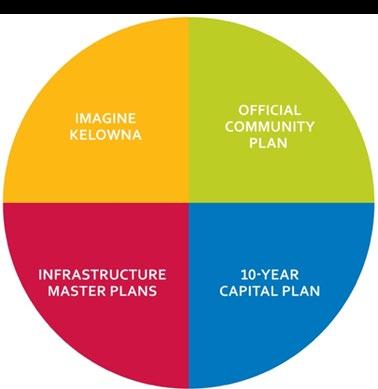
• Taking a long-term planning approach through infrastructure master plans that align with the City’s Official Community Plan and Imagine Kelowna.
• Investing in asset management to keep the City’s existing infrastructure assets in a state of good repair.
• Requiring new infrastructure be built to the very best design standards
This approach ensures high-quality long-lasting infrastructure that current and future generations can enjoy.
In the next 10-years, the City plans to invest $2.05 billion in infrastructure to support growth, improve services and renew existing assets. Overall, the City’s infrastructure investment has increased $418 million from the previous plan across the 12 capital cost centres. 70% of total infrastructure investment is in Parks, Buildings, Transportation and Airport.
The Capital Plan has identified several infrastructure projects that do not have sufficient funding. This funding shortfall, or Infrastructure Deficit, has remained relatively constant at $605 million compared to last year’s plan. It is worth noting that many of these projects would not proceed without significant external funding from grants or partnerships; therefore, the infrastructure deficit is a conservative estimate. Regardless, the infrastructure deficit remains a significant challenge to fully fund and the City is actively exploring opportunities to fund components of it
Despite these challenges, the City continues to deliver world-class infrastructure and services. Many capital projects continue to be completed; delivering on Council priorities and meeting the needs of the community.
80%


32% External Funding DCCs, partnerships & grants
70% investment in Parks, Buildings, Airport & Transportation
citizens satisfaction in level & quality of City services
$2.05 Billion investment in new, upgraded & renewed public infrastructure

We acknowledge that our community is located on the traditional, ancestral, and unceded territory of the syilx/Okanagan people.
The 10-Year Capital Plan (the Capital Plan) is part of the City of Kelowna’s rigorous capital planning process. It aligns with Council priorities, Imagine Kelowna and the Official Community Plan and provides the framework for long-term planning and fiscal management. It is updated annually to respond to evolving community needs, maintain alignment with Council priorities and adapt to external factors like the pandemic, rapidly rising inflation, shortage of contractors and supply chain challenges. The Capital Plan allows the City of Kelowna (the City) to look ahead and answer four fundamental questions:
1. “What do we need?”
2. “Why do we need it?”
3. “How are we going to pay for it?”
4. “How much will it cost to operate and maintain?”
Answering these questions allows the City to anticipate current and future cost pressures, stretch the limits of revenues by source, and make the necessary decisions to put in place essential infrastructure to support a future Kelowna. By doing so, this plan will help maximize infrastructure investment in the community where and when it is most needed.
The Capital Plan contains infrastructure projects and programs for all 12 capital cost centres for the 10years from 2023-2032. Several documents have been used in its preparation. These include:
• Council priorities 2023 – 2026
• Imagine Kelowna
• 2040 Official Community Plan
• 2040 Transportation Master Plan
• 20 – Year Servicing Plan & Financing Strategy
• Principles & Strategies for Financial Strength & Stability
• Infrastructure Master Plans and Asset Management Plans

• 2045 Airport Master Plan and Airport 10-Year Capital Plan
• 10-Year Capital Plan 2022 – 2031 (last year’s plan)
Guided by Council and Corporate Priorities, capital investment will focus on the following areas:
• Transportation & mobility infrastructure making it easier for people to get around by vehicle, transit, cycling and walking.
• Community amenities, like recreation centres and public spaces, to keep pace with Kelowna’s population growth and the evolving needs of residents.
• Parks acquisition and development.
• Airport development aligned with post-pandemic passenger forecasts.
• Flood protection infrastructure to protect the community against the effects of climate change and flooding.
• Renewal of critical infrastructure.
Rapid Growth. Kelowna continues to be one of the fastest growing cities in Canada. It’s rapidly evolving, its economy is diversifying, neighbourhoods are changing, and people are choosing new ways to get around. By 2040, Kelowna is expected to be home to another 50,000 people. This transition is exciting, bringing new energy, amenities, employment, and educational opportunities. Signs indicate this pace will continue.
Rapid growth puts pressure on the capital program as demands increase for more infrastructure to support growth. That is why this Capital Plan focuses 72% of investment on infrastructure to support growth and improve services.
Renewal of Aging Assets. In this era of rapid growth and change, there are complex choices to be made. The City must find a balance between funding to support growth and improve services and funding to support renewal of existing infrastructure to maintain services. These choices are rarely easy and often involve making difficult trade-offs.
The City has a robust asset management program that tracks the age and condition of City owned assets (i.e. civic buildings, roads, bridges, sewer, water infrastructure, etc.). Some of these assets are nearing the end of their service life and will need to be renewed to maintain service levels. The City will invest 28% of the Capital Plan in asset renewal. This will need to increase in the future as assets age and their condition deteriorates
Inflation & Borrowing Costs There are many factors influencing the Capital Plan that are beyond the City’s control. These include labour shortages, supply chain challenges, inflation, and rising interest rates In the past two years, the City has experienced infrastructure construction costs increase by approximately 40%. Interest rates have also increased significantly during this time period. This places pressure on the capital program as several large capital projects are funded through borrowing. There are signs that inflation may be easing, but time will tell if costs decrease from these historic highs.
The current policy of debt repayment is to not exceed 8% of the taxation demand for supported debt and 15% of City-owned source revenues. Debt servicing, as a percentage of taxation demand, is anticipated to remain below these limits.
COVID-19 Recovery. The financial impacts related to the COVID-19 pandemic are still being felt. Payas-you-go (PAYG) capital funding decreased at the beginning of the pandemic as a measure to mitigate funding uncertainty. There is a concentrated effort to return the PAYG funding to pre-pandemic levels by 2030. Future PAYG decreases will impede this recovery.
PAY AS YOU GO CAPITAL Pre-pandemic
PAY AS YOU GO CAPITAL incl. COVID-19 impacts in 2020
The City is taking a proactive approach to address these complex issues.
Listening to Council. This is the first Capital Plan update for the newly elected members of Council. More time has been dedicated to informing Council about the Capital Plan, process used to develop it and to hear from them about what is important to the community. This has helped shape this year’s Capital Plan.
Alternative Funding through Partnerships, Grants & Advocacy The City continues to review alternative funding options and partnerships to help fund the capital program and reduce the infrastructure deficit. Beginning in 2022, the Driving Municipal Revenue initiative aims to identify the use of innovative tools, approaches, and opportunities to generate non-taxation municipal revenue growth. A Council presentation outlining the process, potential revenue impacts and implementation timelines will occur in Fall 2023.
The City actively pursues grants to reduce municipal taxation and to leverage City funding for infrastructure and services. These grants from the federal and provincial governments further Council, corporate and community priorities. In 2022, the City received $27 million in grants and managed $67 million in grant contracts.
The City’s Intergovernmental Relations program focuses on advocacy through the strategic development of relationships with senior levels of government to advance investments and policy changes that supports Council’s priorities and City projects. Through advocacy, the City ensures priority infrastructure projects and program initiatives are consistently and proactively in front of provincial and federal ministers and their staff. As one of Canada’s fastest growing communities, advocacy work includes positioning Kelowna as a leading municipality and a strong partner for senior governments to invest in.
Planning for the Future. The Capital Plan is supported by a foundation of good planning, including:
• Official Community Plan The recently endorsed 2040 OCP optimizes infrastructure investment through more compact development where services can be more efficiently used by a greater percentage of the community population.
• Transportation Master Plan. The 2040 TMP works with the OCP to support growth, and help residents make more efficient and sustainable transportation choices through the development of reliable transit, improved road connections, comfortable bicycle routes and walkable neighbourhoods.
• Parks Master Plan (in-progress). This Master Plan will establish priorities between five park types: city-wide, recreation, community, neighbourhood and linear. As well as identify needs of different stakeholder groups and create a plan for future park development and renewal moving forward.
• Buildings Master Plan (in progress). This Master Plan will create a vision and model to assess both infrastructure renewal and new construction to match growth, assess provision and distribution of built services and amenities across the City as well as prioritize needs between the different building types.
Asset Management & Data Driven Decisions. The City owns and operates $5 billion in infrastructure assets. Efficient operation and timely renewal are critical to continued service delivery and financial sustainability. The City has advanced its asset management program and is considered one of the leaders in BC. Recent implementation of the computerized asset management system (Cityworks) will support program-based budgeting through data driven decisions and inform infrastructure planning, improve operational efficiency, and extend asset service life. Small improvements make a big financial impact when you own and operate $5 billion in infrastructure.
Updating Infrastructure Standards. It is important the new infrastructure the City is building today is high quality, long lasting and state-of-art. That is why the City actively reviews design and construction standards. The Subdivision and Servicing Bylaw sets out these standards and the City employs a working group that continually reviews and updates infrastructure standards in consultation with key stakeholders and the community.
This Capital Plan forecasts $2.05 billion in infrastructure investment to accommodate growth, enhance services, and renew existing assets.
Infrastructure required to support growth accounts for $1.06 billion (52%) of total investment and new infrastructure to support enhanced or improved services accounts for $404 million (20%). There is approximately $584 million (28%) allocated to renew existing infrastructure to maintain existing services.
The Capital Plan forecasts $1.46 billion in infrastructure to accommodate growth and improve services to the community. This infrastructure will require additional funding to operate and maintain.
Renewal of existing infrastructure is assumed to have no additional operational impacts because budgets are already in place to support.
The Capital Plan forecasts $2.05 billion of capital investment across 12 cost centres.
• Transportation, Parks and Buildings cost centres account for 52% of overall investment to deliver on Council Priorities, invest in infrastructure renewal and meet community expectations.
• Water, Wastewater, Storm Drainage and Solid Waste is 23% to meet regulatory requirements.
• Airport is 18% to align with postpandemic passenger forecasts and to meet regulatory travel requirements.
• The remaining 6% supports Fire, Vehicles, Information Services and Real Estate &Parking.
Overall, the City’s infrastructure investment in funded projects (P1) has increased $418 million from the previous plan across 12 capital cost centres. The following table shows the City’s total investment for funded projects in each cost centre in this Capital Plan compared to the previous plan.

Real Estate & Parking. Investment focuses on strategic land acquisition and providing state-of-the-art, well-maintained parking facilities. Overall, investment in Real Estate & Parking infrastructure is $46 million with large investment in:
• General Land acquisition, and
• Parking Infrastructure including Electric Vehicles infrastructure.
Buildings. This is the largest investment area with total investment forecast at $416 million. There are big investment plans to expand recreational, cultural, and protective services facilities to support a growing community. Big projects include:
• PRC Redevelopment - $242 million
• CNC Expansion - $41 million
• Community Activity Centres - Construction - $36 million
• Critical & Core Building Renewal - $29.4 million
• North Glenmore Fire Hall - $14.3 million
• City Hall – Envelop Renewal - $12.2 million
• Capital Opportunities & Partnerships Fund - $9.5 million
• Park Washroom Renewal - $7.6 million
Buildings Investment ($ millions)
Parks & Recreation Buildings
Community & Cultural Buildings
Building Renewal, Rehabilitation & Infrastructure Upgrades
Civic/Protective Service Buildings
Transportation & Public Works Buildings
Capital Opportunities & Partnerships
Parks. In the next 10-years, the City plans to invest $288 million in parks creating vibrant, animated spaces for the community to connect, enjoy and experience. The recently completed Waterfront Park, is a great example. Other big Park projects in the next 10-years include:
• Parkland Acquisition - $156.7 million
• Glenmore Recreation – Future Phases - $23.6 million
• Kerry Park Future Phases - $10 million
• Casorso Park - $8.2 million
• City Park Playground Expansion - $8.2 million
• Bluebird Beach Park - $5.4 million
• DeHart Park - $4.9 million
• Capital Opportunities & Partnerships Fund - $4.5 million
• Neighbourhood Parks – 1 per year - $2 million/park
Transportation The City continues investing in infrastructure to make it easier for people to get around by vehicle, transit, cycling and walking Total investment in Transportation infrastructure has increased to $373 million making it the second largest investment area Key changes to the Capital Plan are due to the reprioritization caused by 40% construction inflation experienced in the past two years with some projects moving to P2. To partially offset inflation and to respond to Council’s transportation improvement priority, an additional $66 million in funding was added for transportation projects. Notable projects include:
• Road Renewal Program - $58.1 million
• Burtch Rd Extension (Glenmore – Benvoulin) - $34.5 million
• Hollywood Rd Extension (Sexsmith – John Hindle) - $18.4 million
• Sutherland Rd (Mill Creek – Spall) - $16 million
• Major Intersection Capacity Improvements - $14.2 million
• KLO Bridge Replacement - $11.4 million
• Frost Rd Ext. to Chute Lake - $5.3 million
• Bertram, Rail Trail – Greenway, Glenmore, Leon Lawrence ATCs
• Park/Ride; OC Exchange
Solid Waste. Efficient and effective daily operations and long-range capital planning ensures the Glenmore Landfill will continue to serve Kelowna and surrounding communities well into the future. That is why $73 million worth of capital investment is planned in the next 10 years to ensure the site is futureready and there are continued plans to:
• Expand the landfill footprint.
• Manage the Stockpile and Reprocessing Areas
• Implement a new stormwater management program
Storm Drainage. Investment in drainage infrastructure will utilize natural and engineered solutions to improve resiliency, flood mitigation and water quality which are increasingly important in the face of a changing climate. Recent capital investment to improve Mill Creek capacity and divert more flow to Mission Creek through an upgraded diversion structure prevented Mill Creek from spilling its banks during the heavy rains last year. To keep going with this critical work, Storm Drainage plans to invest $44 million in the next 10 years.
• Mill Creek Flood protection is the largest project at $30 million
• Renewal of aging drainage infrastructure
Information Services. Information services is a small but important investment area as the City continues its digital-first transformation. To get there, investment of $12 million is planned in the next 10 years. As the City embraces more cloud-based technology, the focus is on:
• Major systems projects to eliminate legacy systems
• Refreshing the user-experience by streamlining the access to information.
• Enabling staff to be more mobile by purchasing hardware that allows for greater flexibility.
Vehicle or Mobile Equipment. This cost centre funds all the City’s vehicles and equipment except for fire trucks and equipment. The City maintains a reliable, sustainable fleet and continues to modernize it by going Green to reduce GHGs by purchasing EV, hybrid or hydrogen vehicles where available. The $53 million capital investment will go towards:
• Replacing aging vehicles and adding to the fleet to accommodate growth.
Fire. The well-established capital program at the Fire Department ensures fire trucks, equipment and communication systems remain up-to-date in order to keep firefighters and the community safe. It is a relatively small capital program as most costs are operational and fire stations are accounted for in the Buildings cost centre. Investment in the Fire cost centre is forecasted at $14 million. Big projects include:
• Vehicle/Equipment Renewal - $8.6 million
• Communication Systems - $3 million
• New Fire trucks and equipment to support growth - $2 million
Airport. Anticipated investment in infrastructure and equipment over the next 10 years of $371 million to ensure additional air service can be accepted to support the regional economy continued growth. The Airport’s 10-year Capital Plan will continue to be updated while developing the 2024 Preliminary Budget and a further update will be provided in the fall. Significant projects over the next 10 years include:
• Airport Terminal Building Expansion - $150.6 million
• Airside Pavement Rehabilitation and Expansion - $80.3 million
• Airport Airside Equipment - $14.3 million
• Airport Combined Operations Building - $17 million
• Airport Car Rental Quick Turn Around Facility - $10.5 million
Water. Infrastructure investment is forecasted at $147 million that focuses on delivering high-quality drinking water and reliable irrigation water to all City customers. This is evident in projects like the recently completed Water Integration Project in the city’s southeast. In the next 10 years, infrastructure to:
• Support growth - $97 million
• Renew existing infrastructure - $34 million.
Wastewater. The City treats close to 40 million litres of wastewater from homes, businesses, and industry each day. With the community’s expected growth, this volume will continue to increase. The focus is to ensure environmental stewardship, community preparedness and resiliency while meeting regulatory requirements. That is why the City plans to invest $211 million in the next 10 years Major investment includes:
• Infrastructure to support growth and renewal of aging assets.
• Addition of a new Biosolids Digestion facilities - $77 million
• Septic removal projects to provide wastewater service to the remaining areas of the City that are still on aging septic systems.
Infrastructure investment decisions consider asset lifecycle costs which includes both capital and operating expenses. Municipal infrastructure is designed to last a long time, varying from 20 – 100 years, and the operating expense can amount to 70 - 80% of the lifecycle cost, which is why it is important to consider operational impacts when making capital investment decisions.
The Capital Plan forecasts $1.46 billion in infrastructure to accommodate growth and improve services to the community. This new and growth-related infrastructure will require additional funding to operate and maintain. The operational impacts for the General Fund and Utilities will require approximately $16.20 million and $20.38 million respectively of additional annual funding by 2032. The General Fund cost centres will be primarily funded by taxation while Utilities and Solid Waste will be accounted for in their respective utility funding models.
Renewal of existing infrastructure is assumed to have no operational impacts because operational budgets are currently in place to support existing infrastructure.
Information for Airport and Fire cost centres not included.
Funding for the Capital Plan comes from 10 sources totaling $2.05 billion. Approximately 32% of funding is from external sources such as Development Cost Charges, Grants, Community Works Fund, and Developer and Other Contributions. City funding sources such as General Taxation, Infrastructure Levy, Reserves, Borrowing and Utilities are approximately 68%.
The City’s capital program has increased to keep pace with the demands of a growing community while at the same time relying less on taxation as a primary funding source. At $196 million over the next 10 years, General Taxation contributes 10% of the capital investment. Grants, user fees, reserves, and borrowing makeup a larger share of the funding for the capital program. The capital plan from seven years ago was $848 million and funded 18% from taxation whereas today the Capital Plan is $2.05 billion and funded 10% from taxation.
The Infrastructure Levy (IL) was approved by Council in 2019 with an increase occurring in the 2020 budget, and ongoing thereafter. Initially the IL was not indexed with inflation, however, it is as of 2023
($ millions).
Reserve funds are used to fund infrastructure to prevent large fluctuations in annual general taxation requirements.
• Municipal Works. This reserve was established in 2015 and will fund $21 million worth of Buildings renewal projects in the next 10 years.
• Community Works. This reserve, funded from Canada Community – Building Fund (formerly known as Gas Tax), accounts for $75 million.
• Other Reserves Significant funding sources include user fees from the Airport ($300 million) and Solid Waste reserves ($73 million) with the remaining amount from general fund reserves for a total of $557 million.
Development cost charge (DCC) funding accounts for $497 million (24%) of all capital investment. The timing of DCC projects must coincide with the availability of DCC revenues. Should revenue not be realized due to slower growth, the timing of DCC projects may be adjusted.
Utilities
Utilities’ funding sources are primarily from user fees collected for services such as Water and Wastewater. Approximately $192 million will be re-invested in projects that directly benefit the respective services where fees were collected.
Debenture borrowing of $370 million (18%) is required to fund significant buildings projects. The debt analysis only reports on debt according to the General Fund and the taxation impact of these borrows.
The Capital Plan only uses confirmed grants as part of the financial strategy. This is consistent with the City’s Financial Principles and Strategies. As grants become available this will reduce reliance on taxation and other funding sources. A total of $34 million (2%) is budgeted in the Capital Plan to be funded from project specific grants and $15.6 million of City directed provincial/federal grant programs
Developer & Other Contributions
Developer and Other Contributions provide $48 million (2%) towards capital projects in this Capital Plan
Table 7 Developer, Community, & Other Contributions ($ millions).
Infrastructure projects that are lower priority and not fully funded are deemed Priority 2 (P2) projects. The P2 forecast for the next 10-years increased to $794 million.
P2 projects to support growth accounts for $313 million (39%) and new infrastructure to support enhanced or improved services accounts for $250 million (32%). There is approximately $231 million (29%) for renewal of existing infrastructure to maintain existing services. Without increased funding these projects remain unfunded and contribute to the Infrastructure Deficit.
The Capital Plan forecasts $794 million of unfunded infrastructure investment across nine cost centres. Buildings, Parks and Transportation account for 86% of the unfunded projects in the Capital Plan.
The Infrastructure Deficit (ID) measures the City’s share of funding for all P2 projects net of funding from external sources including DCCs, grants, utilities and/or partnerships. Currently, the ID is estimated at $605 million.
It is worth noting that many of these projects would not proceed without significant external funding from grants or partnerships, so the this is a conservative estimate that will be further refined in future iterations of the Capital Plan.
The ID has remained relatively constant compared to last year’s plan but has increased from what it was a couple of years ago. This is primarily a result of construction inflation that has increased the value of the P2 projects but has also caused some P1 project to move to P2 due to inflation eroding the spending power of existing funding.
The City has taken significant actions to understand, assess and reduce the ID in areas where it has a greater degree of influence. To increase revenue available to complete projects in the Capital Plan in the next 10 years, the City has implemented:
• The Infrastructure Levy was introduced in 2019 and indexed to CPI as of 2023. This action means the levy will not lose value with time. It will contribute $58 million in additional revenue in the next ten years
• A new Park Development Cost Charge was introduced in 2020 and contributes $70 million
• A Storm Drainage DCC was added in 2022 and projected to add $5 million.
This is a combined total of $133 million in new revenue for capital. Numerous opportunities exist to fund components of the ID. These will be explored and presented to Council in the future
The renewal component of the ID is estimated at $231 million. This will be the focus of near-term funding strategy to ensure the City is adequately funding renewal of existing infrastructure to maintain service delivery.
*Other includes DCC’s, Grants, Utilities and Partnerships.
The total value of P2 projects have increased by $50 million to $794 million in this Capital Plan compared to the previous plan. The main driver for the increase is inflation in construction costs
Real Estate and Parking Unfunded major projects include:
• New Parkades - Design and Construction - $40.6 million
Buildings Unfunded major projects include:
• Kelowna Community Theatre - Replacement - $108 million
• City Yards - Replacement Construction - $86 million
• General Building Infrastructure Renewal - $81 million
• Kelowna Museum - Replacement Construction - $80 million
• Community Activity Centres, Daycare - $20 million
• Prospera Place – Renovations - $18 million
• Memorial Arena - Adaptive Reuse - $11 million
Parks. Unfunded major projects include:
• Sutherland Bay Park – Expansion - $18.4 million
• Irrigation Renewal - $12.6 million
• Boat Launch - Land Acquisition and Facility - $12.6 million.
Transportation. Unfunded major projects include:
• Road Renewal Program - $19 million
• Orchard Park Exchange - $16.8 million
• Abbott DCC (Rose - Gyro), ATC - $11.6 million
Storm Drainage Unfunded major projects include:
• Mill Creek Flood Protection - $6.6 million
• Central Area Basin Projects - $2 million
Information Services. Unfunded major projects include:
• Front Office Equipment - $1.5 million
• Major Systems Project - $700 thousand
Water. Unfunded major projects include:
• Mission Creek South Connector - $13.2 million
• Minor Interconnections- $3 million
Wastewater. Unfunded major projects include:
• Wastewater New Treatment Process - $10 million
• Sanitary Trunk Clement to Bernard - $6 million


For a summary of changes between the previous plan and this Plan, follow this link: Change Summary