City of Kalamunda Annual Report

2021-2022

Kaya � We respectfully acknowledge the Traditional Owners, the Whadjuk Noongar People as the Custodians of this land� We also pay respect to all Aboriginal community Elders, past, present and future who have and continue to reside in the area and have been an integral part of the history of this region

Priority 2: Kalamunda Clean and Green
24 2 1 To protect and enhance the environmental values of the City 24 2
2 To achieve environmental sustainability through effective natural resource management
31 2
3 To reduce the amount of waste produced and increase the amount of reuse and recycling of waste
4 To ensure contaminated sites are safe
34
33 2
Priority 3: Kalamunda Develops 35 3 1 To plan for sustainable population growth 35
2 To connect community to key centres of activity, employment and quality amenities
3 To develop and enhance the City’s economy
4 To be recognised as a preferred tourism destination
50
Priority 4: Kalamunda Leads 52
1 To provide leadership through transparent governance 52
2 To proactively engage and partner for the benefit of community
Statement by Chief Executive Officer 60
Independent Auditor’s Report 61
Statement of Comprehensive Income by Nature or Type
Statement of Financial Position
I am pleased to present the City’s Annual Report for 2021/2022 � T he year started with a plan, as the City launched its new Strategic Community Plan in June 2021 T he plan, titled Kalamunda Advancing, details the City’s long term, overarching strategy and sets out the community’s aspirations and priorities for the future, supported by a budget that facilitates the delivery of services and infrastructure to the community in a financially sustainable manner�


Throughout the year, significant strides have already been made in delivering the Strategic Community Plan
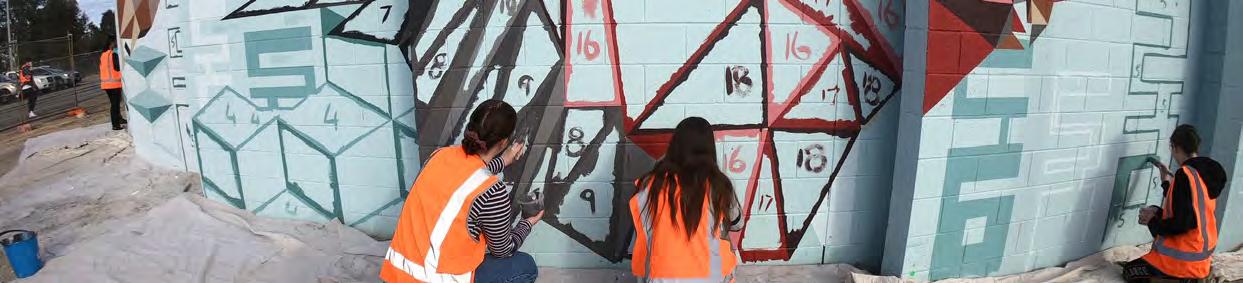
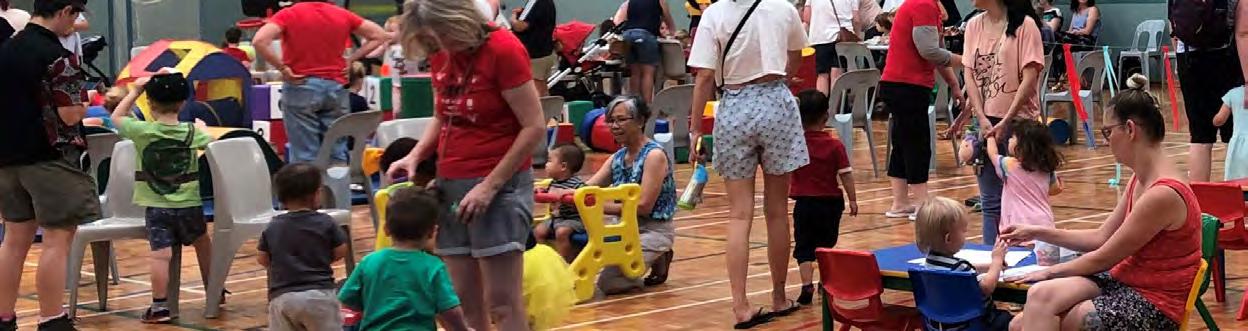
The City continued its mission to provide high quality and accessible recreational and social spaces and facilities for the community, with several capital works projects being undertaken including the Kalamunda Central Mall redevelopment, a major renewal of the lake in Stirk Park, Kalamunda being completed in preparation for the planned construction of the new Playground and Skate Park to commence in 2022/2023, and the completion of an intergenerational naturebased play and quiet gathering space in Gladys Newton Park in High Wycombe�
�
In September 2021, Council adopted the Kalamunda Social Inclusion Plan (2021-2025) to support agefriendly inclusion and accessibility across the City of Kalamunda, and we continued to empower, support and engage all of the community through a range of initiatives including the development of the draft Youth Plan (2023-2028)
I am delighted to see visitors returning to the many cultural experiences our City has on offer after the pandemic, including the Kalamunda Performing Arts Centre, the Zig Zag Gallery, our libraries and, of course, all the wonderful events we have supported
Throughout the 2021/2022 Financial Year, the City of Kalamunda continued to protect and enhance the environmental values of the City through the implementation of the Local Environment Strategy, and the development of the Urban Forest Strategy and the Local Biodiversity Strategy�
Some key objectives achieved in this period include the drafting of the City of Kalamunda Climate Change Action Plan, the continuation of the City’s Waterwise Council status for 2021/22, and the completion of the City of Kalamunda Waste Avoidance & Resource Recovery Plan
Highlights from this year include the over 13,000 seedlings given away to residents during the Plants for Residents event, and the WALGA Street Trees initiative increasing shade by nearly 54,000 square meters �
This year, the City continued to support Economic growth through the implementation of the Economic Development Strategy, and key projects such as the
redevelopment of the Central Mall in Kalamunda
�
The City also continued its mission to be recognised as a preferred tourism destination, nurturing key partnerships with nearby local governments and continuing to deliver the Experience Perth Hills brand through a new website�

The City’s Planning and Building teams continued to process a phenomenal amount of permit approvals throughout the 2021/2022 Financial Year, with numbers lower than the peak that was seen during the 2020/2021 Financial Year, but nonetheless on par with earlier periods
Overall it has been another successful year and I thank the Council and the staff for the efforts they have contributed throughout the year�
Rhonda Hardy City of Kalamunda CEO
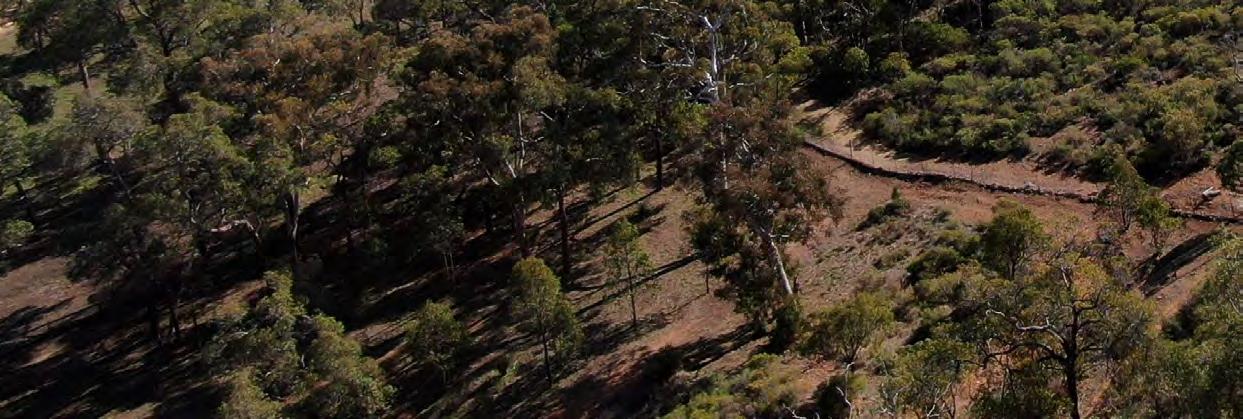
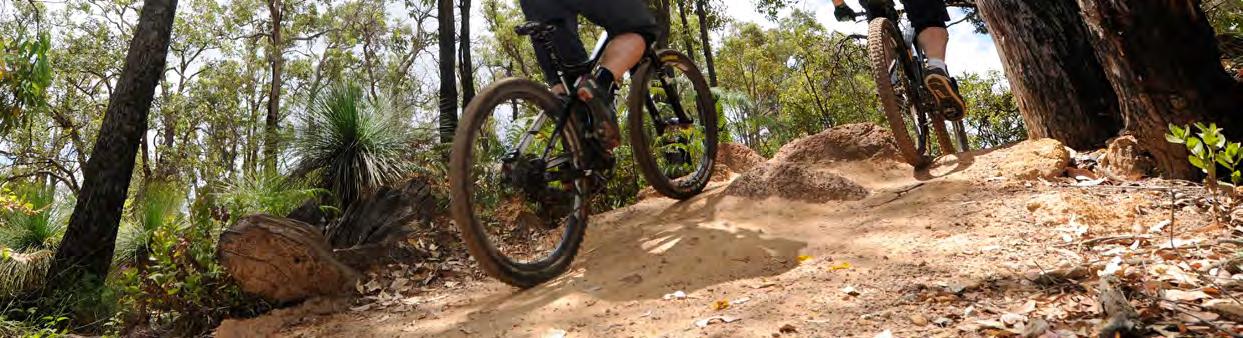
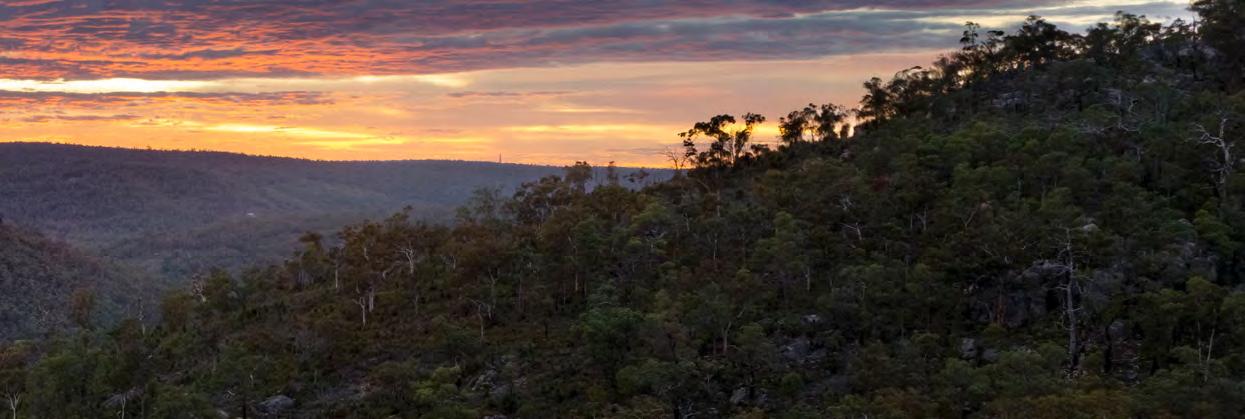
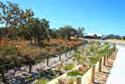
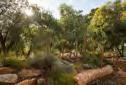
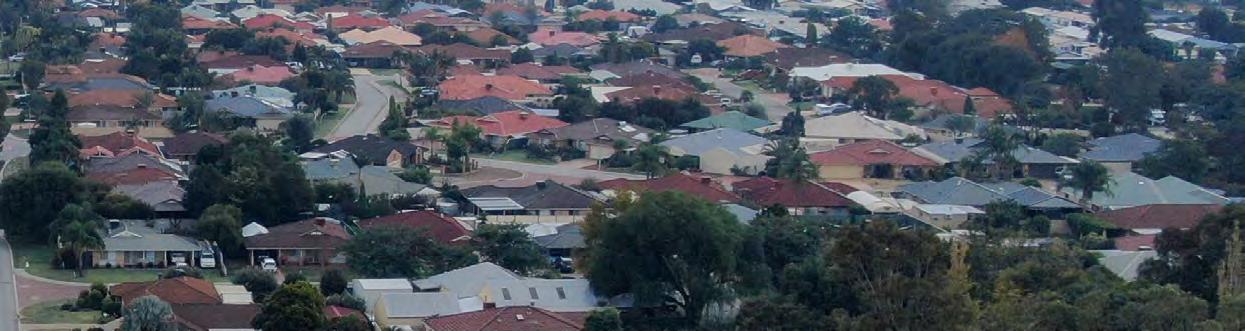
The City of Kalamunda is approximately 24 kilometres (under 30 minute drive) from Perth’s CBD, located in the foothills of Perth’s eastern suburbs and part of the Darling Ranges � T he area features natural bushland, amazing views and beautiful countryside� With a long history, proud artistic identity, fresh produce, and an abundance of recreational opportunities such as bush walks and mountain bike trails, the City of Kalamunda offers a unique lifestyle for its residents
�
Geographically, the City is made up of three distinct areas:
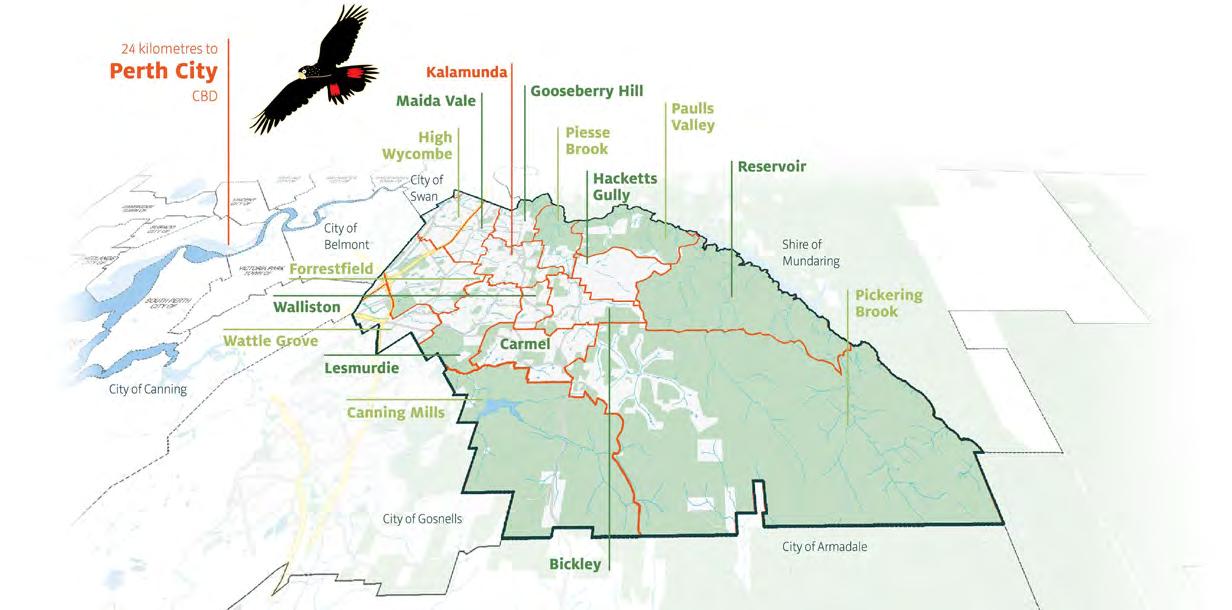
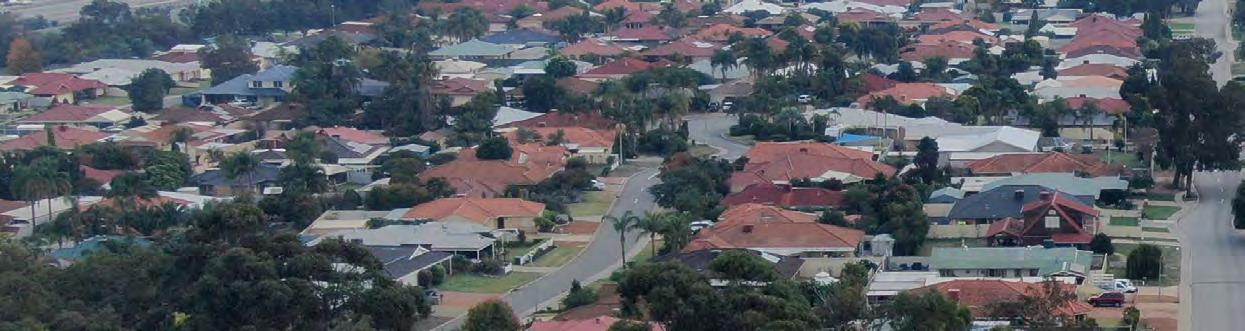
» The Foothills/Plains: Forrestfield, High Wycombe, Maida Vale and Wattle Grove
» The Escarpment: Lesmurdie, Kalamunda and Gooseberry Hill


» The Eastern Rural Districts: Walliston, Bickley, Carmel, Pickering Brook, Piesse Brook, Paulls Valley, Hacketts Gully and Canning Mills
The name Kalamunda comes from local Aboriginal words Cala (home or fire ) and Munnda (forest – also associated with Munday – the fire of Munday) T he City of Kalamunda is located in Perth’s south-eastern suburbs, about 24 kilometres from the Perth CBD� T he City of Kalamunda is bounded by the City of Swan in the north, the Shire of Mundaring in the east, the Cities of Armadale and Gosnells in the south, and the Cities of Canning and Belmont in the west
�

Thomas (2021/2025) 20 11 6 2 19
O'Connor (2021/2025) 20 10 6 2 18 Bilich (2019/2023) 20 9 6 2 17
Cannon (2019/2023) 20 10 4 0 14 Cooper (2021/2025) 20 11 6 2 19 Giardina (2019/2023) 20 11 6 3 20
O'Donnell (2019/2023) 20 11 6 2 19 Sewell (2019/2023) 20 11 6 2 19
Stallard (2021/2025) 20 11 6 2 19 Ritchie (2019/2023) 20 11 6 3 20
Miskiewicz (2021/2025) 12 7 2 1 10 Osenton (2021/2025) 12 7 2 2 11 Boyd (2017/2021) 9 4 4 1 9 Blair (2017/2021) 9 4 4 1 9
OCM Ordinary Council Meeting
SCM Special Council Meeting
A&R Audit and Risk


» The City ended the Financial Year with $6 2 5 million in Operating Revenue
» In comparison with 2020/2021, revenue increased by 6%

» Revenue from Rates increased by 4 1% overall
» Oper ating Grants, Subsidies and Reimbursements increased by $1 1 million T he variance is mainly due to the early receipt of Financial Assistance grant of $2 1 million in 2021/2022
» Interest earnings decreased by $0 1 million due to the lower interest rates offered in the market during the year
» The City ended the Financial Year with $6 8 million in Operating Expenditure
» Oper ating expenditure increased by 10% or $6 � 3 million compared to 2020/2021
» Materials and contract costs increased by $3 million� T he variance is mainly due to the increased expenditure in various assets maintenance categories and consultancy and contractor costs for various non-recurrent projects planned under the development and traffic engineering sections
» Other expenditure increased by $2 5 million The increase was mainly due to the Forrestfield Industrial Area Scheme stage 1 land acquisition costs for road projects in 2021/2022 and Classification of IT Intangible assets to Software as a Service category�
Employee costs 24,892,251 25,962,72525,170,251 Materials and contracts 20,233,774 22,885,136 23,253,381 Utility charges 1,965,822 2,017,443 1,990,010
Depreciation on non-current assets 13,385,719 11,858,661 13,764,916
Interest expenses 266,981 282,193 275,577 Insurance expenses 605,809 636,026 677,822
Other expenditure 308,286 1,156,700 2,847,113 Total 61,658,642 64,798,884 67,979,070
Table 2. Operating Expenses Comparisons by Nature or Type comparison 2020/2021 to 2021/2022
Non-operating grants decreased by $1 1 million The variance is mainly due to the reduction in funding received for construction of the Kalamunda Community Centre� T he project was completed in early 2021/2022
�
The City continues to strengthen its financial position with a surplus of $5 1 million for the year as a Net Result
» The value of the investment in Associate Eastern Metropolitan Regional Council increased by $0� 8 million� » Capital expenditure during the year amounted to $21 million� » As set classes invested in during the year were as follows:

» The value of the Property, Plant & Equipment and Infrastructure assets increased by $9 million mainly due to the new additions during 2021/2022 �
In 2021/2022 the City continued to deliver on key strategies adopted by the Council and maintains a high level of services across all programs, while ensuring an increased focus on roads and associated infrastructure as well as renewing assets at sustainable levels
The Inclusive Kalamunda Social Inclusion Plan (20212025) incorporates initiatives supporting age-friendly communities, inclusion and accessibility across the City of Kalamunda and was adopted by Council in September 2021
The Disability and Carers Advisory Committee (DACAC), consisting of five community members and two representative service organisations, meet quarterly providing advice and guidance to Council on improving access and inclusion for people with disabilities in the City Successes include the negotiating of the opening of the Aldi Kalamunda doors from Mead St to ensure accessibility for all, as well as initiating a Footpath Awareness campaign� T his campaign received
a Commendation Award at the Most Accessible Community of WA Awards
�
To celebrate International Day of People with Disability, the City hosted a staff disability awareness training, featuring guest speakers from Building Friendships to learn about and celebrate diversity and inclusion Five guests spoke about their life and experience living with a disability to raise awareness � T he City of Kalamunda also promoted community inclusion considerations through the development of an ‘Accessible Events Guide’ and ‘Accessible Business Guide’ with support from the DACAC Committee, distributed to local businesses through the Kalamunda Chamber of Commerce
The City continues to work in partnership with seniors, volunteers, community groups and businesses to offer a range of services and activities throughout the community� Services include podiatry, hairdressing, computer courses, and the very popular Seniors Coffee Lounge at the Woodlupine Family and Community Centre� New volunteers are always welcome�
Seniors were offered the opportunity to attend free information sessions along with a range of events throughout the year including:
» Advance Care Planning Workshop with Palliative Care WA
» Es tate Planning Workshop with simplyEstate and Fourlion Legal
» Positive Ageing Workshop at Hartfield Park
» Tech Savvy Seniors Sessions
» Outdoors October » Supported programs with the Darling Range Hub » Seniors Week » Ageing Well Festival
1.1 To be a community that advocates, facilitates, and provides quality lifestyle choices
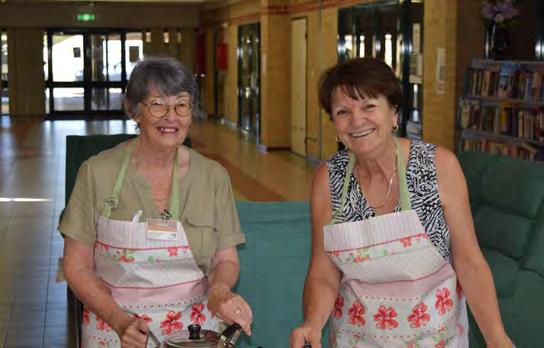
1.1.1 Ensure the entire community has access to information, facilities and servicesWoodlupine Coffee Lounge Volunteers
The City of Kalamunda received grant funding from Carers WA to host a Carers Wellbeing Walk followed by a Picnic Lunch to celebrate and thank the unpaid Carers in our community� T his free event was held at Stirk Park, with a walk through the Railway Heritage Trail� It was a great way to connect the Carers in our community to each other� A lovely example being one Carer dropping off a wheelchair to another Carer they had met at the picnic, as the existing wheelchair they had was not suitable
The Youth Plan identifies the youth interests, issues and aspirations of the local community and establishes priorities and strategies to guide the City over the next five years in its provision of youth services � T he team delivered a 9-month-long consultation for the new Youth Plan to understand the current trends, interests and needs of the youth living in our community T he consultation survey received 329 submissions, and social media received over 3000 engagements Consultation also occurred at numerous community events, schools, and shopping centres throughout both the Hills and Foothills
�
This year the Youth Services team has delivered an extensive program of free activities and events for young people primarily aged 12–25 years A few of the highlights included:
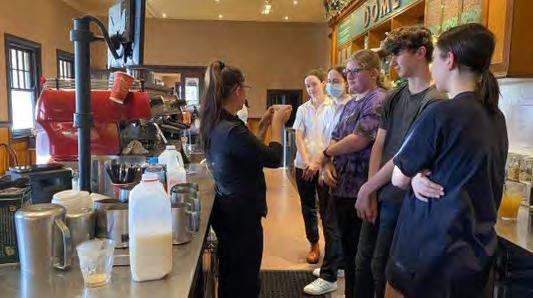
Taught by one of Dome Kalamunda’s managers (who started out as a participant in the program back in 2017), participants learn the tricks of the making coffee as well as experiencing the inner workings of a functioning café T he two-hour workshops were held each school term, free of charge In 2021 the City of Kalamunda introduced both ‘Open Sessions’ for residents (aged 25+) as well as supported sessions for
The Young Artist Awards ‘Our Stories’ exhibition showcased local young people’s connection to place, ancestry, culture, and life experiences � T he exhibition displayed 15 young up-and-coming artists between the ages of 10 and 25, as well as local Western Australian Music Song of the Year award finalist Anna Schneider performing on opening night � T he opening night also featured the launch of the Intergenerational Community Anthology, a collection of short stories, poems, and art from the 2020 Young Creatives Kalamunda program
This popular Kalamunda Water Park event saw almost 300 students and families join the end-of-year celebrations � Discounted entry was on offer for all
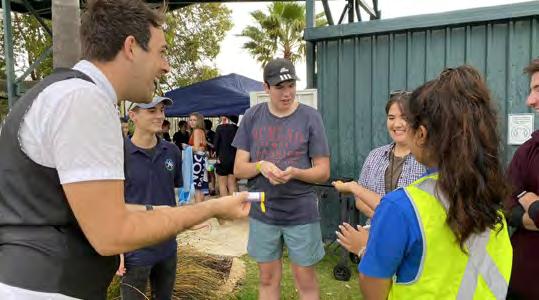
young people, with a free sausage sizzle, live youth musicians and pool inflatables for the attendees to enjoy�
The youth team welcomed the ninth Youth & Community Assistant � This is an annual initiative which provides an entry-level employment opportunity for one local young adult to gain work experience in youth and community services in a local government context � T his opportunity continues to provide an invaluable experience for young people, as well as a direct connection for the City to the youth community
All primary and secondary schools located within
the City of Kalamunda were invited to nominate a student from their school to receive the annual City of Kalamunda Student Citizenship Award� T he award is part of the Community Funding Program and provides the nominated student, who demonstrates active citizenship, with a certificate and a book voucher to the value of $40
The City of Kalamunda provided financial and in-kind support to a large number of community organisations to assist them in achieving their goals and visions, assisting the City of Kalamunda to empower, support and engage all of the community
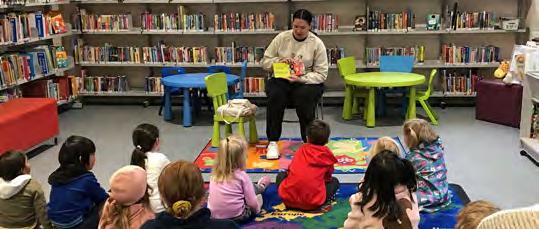
The Library Service conducted 14 regular weekly programs and a variety of events throughout the year including author talks, craft and sustainability workshops, health and wellbeing sessions � We partnered with 46 external groups including local schools, service providers, arts organisations and State Government departments to deliver a range of services such as technical support, information sessions and outreach� A highlight was the ServiceWA support sessions (supported through a State Government grant) that were in high demand at all libraries during January and February 2022�
New initiatives for 2021/2022 included:
» Online Storytime sessions to reach out to families unable to attend children’s programs in person� Grant funding from the Australian Library and Information Association supported the engagement of a local Noongar storyteller for online storytime sessions �
» The Reconciliation – Connecting Community art project at High Wycombe Library� First Nations artist Sammy Wyborn facilitated a community art project that captures local nature, First Nations culture and the multiculturalism of our community
» Collaborations to host Noongar Culture and Citizen Science sessions at each of the libraries
» Reinstatement of weekly local history posts on the libraries’ Facebook page
Feedback from patrons: “I did the [library] workshops on kokedama and beeswax wraps � I c an make my own gifts now!” (Attendee at the Forrestfield Library
workshops in December 2021 and June 2022)�
“ Thank you so much for arranging the gorgeous operatic experience …the setting was great, it was fun to learn about different operas �” (Attendee at the Kalamunda Library / WA Opera event in January 2022)
“I attended a personal safety event (self defence class) at Forrestfield Library and it was fantastic I really love how you host such a variety of event types �” (Attendee at the Self Defence workshop at Forrestfield Library in May 2022)�
“T he events I attended (Winning Resumes) made me take positive action�” (Attendee at the Careers workshop at High Wycombe Library in February 2022)
T he Centre is available to all community groups to hire, with the Learning Centre having low cost classes operating Monday to Fridays during school term� K alamunda Community Learning Centre is one of the largest centres in Western Australia today and continues to operate on the strong volunteer ethos on which it started In 2022 98 courses were on offer, with prices kept extremely low ensuring all members of the community can afford to attend through the City’s support � A semester fee commences from $35 - $70 for classes
�
Careers Week
Youth Services hosted a virtual Vision Board session for students to put their future goals and aspirations onto a tangible document for motivation during their studies � YouTube videos providing an insight into a ‘Day in the Life’ of Local Government roles were also shared� T hese videos can be viewed on Instagram @ kalayouthservices, Facebook @cityofkalamundayouth, and YouTube @cityofkalamunda �
The City of Kalamunda continued to provide a subsidy to the Kalamunda Community Learning Centre for the hire of the community centre K alamunda Community Learning Centre is a not for profit organisation offering a wide range of courses each semester� In 2021, the new Kalamunda Community Centre and new home for Kalamunda Community Learning Centre opened its doors with over 600 members enrolling in 84 classes �
The City of Kalamunda organised educational talks as part of a ‘library series’ covering the topics of Fungi, Native WA Wildlife and the Six Noongar Seasons � T he libraries were an excellent resource to utilise, with each library embracing the topics and assisting with promotion� Each talk was planned to be held at a different library and at a different time, to capture different audiences
» 3 Fungi Talks – one at each library: Kalamunda, High Wycombe and Forrestfield to a total of 56 people
» 3 Kanyana Talks – one at High Wycombe Library and two at Lesmurdie Library to approximately 50 people
» 3 Cultural Awareness and Six Noongar Seasons – one at each library: Kalamunda, High Wycombe and
Forrestfield to approximately 55 people�
Due to the popularity of the Fungi talks, as well as the need to see Fungi in the bush, two fungi walks were held for the talk participants One was held at Jorgensen Park, Kalamunda and the other at Federation Gardens, Forrestfield with a total of 53 people attending � In addition to the library series, other educational presentations were delivered to the community� On 9 October 2021� A ‘ Birds in your backyard’ workshop was held at Jack Healey Centre, in collaboration with Birdlife Australia, with a total of 20 participants � Also, the Green Dreams Photo Competition was organised T he goal of the competition was for young people to share their vision for a more sustainable future T here were 6 age category winners overall�
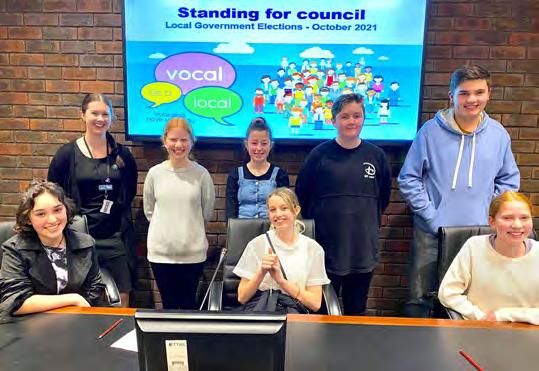
Members of Youth Action Kalamunda received the opportunity to participate in a mock council meeting for prospective council members Running from an agenda, the team confidently asked pointed questions about the process of becoming a councillor and City of
�
The City of Kalamunda, with support from the City’s People Services department, hosted an Employment 101 workshop, offering advice on employability and interview skills training for local high school students �
The City’s Community Safety team is committed to providing a positive customer experience for all the community� T he Community Safety Team consist of Rangers Services, Bush Fire Compliance and Emergency Management
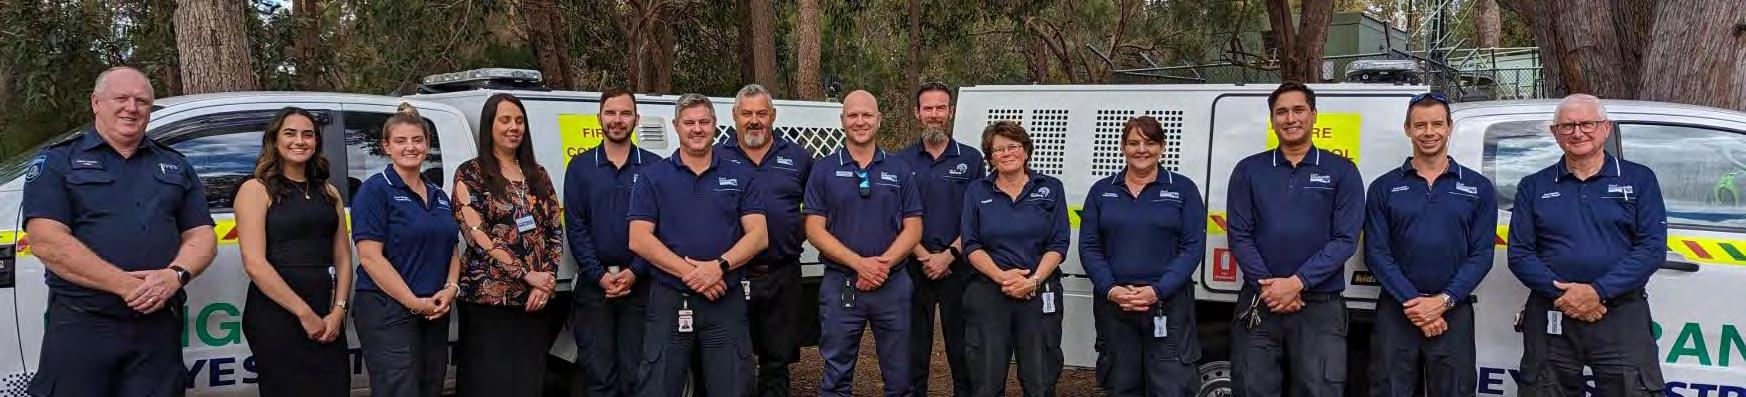
�
The Rangers are responsible for creating a safer community through the provision of the following services; parking, dog and cat control, animal registration, litter and illegal dumping, abandoned and off-road vehicles, fire compliance, issuing fire permits, and managing the CCTV network administration, which provides data to Western Australian Police as required, during the year 35 requests were received by the City
Some of the other functions and responsibilities of the Rangers are responding to City building alarms, assisting WAPOL for the purpose of animal control, providing access and opening, closing gates on request, attending to community education events, and attending court in order to provide evidence if required
Kalamunda community specific questions � Two of the older participants said after the experience they are now interested in becoming councillors1.2 To provide safe and healthy environments for community to enjoyPerth Hills Preparedness Project
» Rangers addressed over 1,331 parking related matters
» Dealt with 3,589 dog and 427 cat related matters
» Investigated over 139 dog attacks
» At tended over 1331 Routine patrols
» Is sued over 2,038 Caution / Infringement Notices
» Currently there are 9,414 dogs and 2,346 Cats registered within the City
» The City currently has 23 Declared Dangerous Dogs residing within the area
» Community Safety team had 9 compliance matters listed for prosecution; 6 of those matters have successfully concluded with 3 matters still ongoing
Community Safety and Crime Prevention Committee
Council resolved in June 2022 to withdraw the Community Safety and Crime Prevention Committee� T he Committee held one meeting in August 2021� F ollowing that the Committee failed to receive the required number of community members After consultation with Forrestfield Police in was agreed to withdraw the committee Actions relating to community safety and crime prevention will be included in the next Local Public Health Plan to be called the Community Health & Safety Plan�
pre-fire season walkthroughs with landowners on their properties and Rural Urban Interface exercise� T hese face-to-face events were supported by Social Media messaging and printed advertisements in the local newspapers
The Fire Compliance team performed routine inspections of private premises within the City with High, Very High, or Extreme fire ratings between 1 November 2021 and 31 March 2022 to execute the season’s Fire Hazard Inspection Plan� A post-season report detailing the program’s results and suggested changes for the next Fire Hazard Inspection Plan for 2022/2023 was also prepared for Council consideration
» FCOs conducted 3777 property inspections �
» Compliant outcomes at the time of assessment were a 5% improvement on the previous year�
» 73% of properties were marked as compliant at season end�
» 812 work orders were issued during the new season�
» 82% of properties were marked as compliant at the follow up assessment
» 12 3 permits were issued across the restricted burning period
» 53 illegal burns were reported and dealt with by City Fire Officers, an increase of 13 from last season
The Local Emergency Management Committee (LEMC) continues to meet quarterly� T he LEMC has met all its requirements and continues to work towards community preparedness making a more resilient community
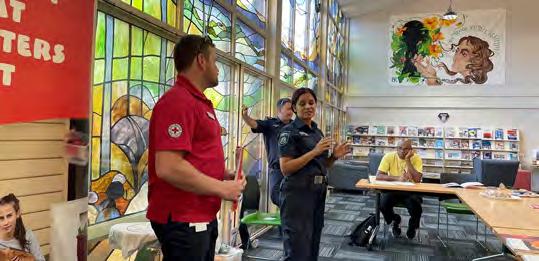
The City also continued its partnership with the Red Cross in delivering the Perth Hills Preparedness Project � T he project involved the delivery of key Red Cross programs such as the Pillowcase program and RediPlan across the Perth Hills including Cities of Kalamunda, Swan and Shire of Mundaring
�
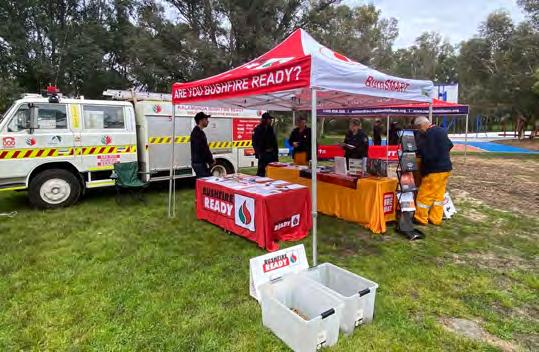
Bushfires continue to be an extremely serious threat to the City� Fire Control Officers (FCO) attend a variety of community educational activities to help the residents become more mentally and physically ready for bushfires A few of those activities have included the yearly Burn Smart Demonstration, Street Meets,
The Bush Fire Advisory Committee (BFAC) provides advice and recommendations on policy and matters relating to bush fire prevention, control and extinguishment and matters associated with the Kalamunda Volunteer Bush Fire Brigade T he City’s Volunteer emergency organisations continued to
provide exemplary service and commitment to the community:
» The Kalamunda Volunteer Bush Fire Brigade committed 10,155 hours of volunteer time
» The Kalamunda State Emergency Service unit committed 2,417 hours of volunteer time responding to incident
in the City’s COVID response, however with COVID easing the team has been able to refocus on delivering core duties and taking opportunities to complete community education when they arise
T his year the team began participating in the Light Industry Program T his program is an education-based program organised by the Department of Water and Environmental Regulation (DWER)� T he program involves Environmental Health Officers and DWER Industry Inspectors conducting joint inspections of industrial premises to educate business owners about minimising pollution caused by their businesses
�
The City continues to provide a high-quality environmental health service to the community It is the City’s responsibility to promote and protect the public health of all residents and visitors � Regular duties include approval of applications and risk assessments in a broad range of areas including food premises, public buildings, skin penetration, on-site wastewater disposal, water sampling, noise monitoring, pest management, nuisance control and public safety
This year:
» 602 food safety assessments completed
» 38 1 health service requests investigated
» 70 on-site wastewater applications received
» 270 internal building and planning referrals received health advice
T he Environmental Health team was heavily involved
T he team continued their exciting and innovative work in the mosquito management space T he popular microbat program which is a collaboration between the City and the Forrestfield Men’s Shed continued� T his program involves the Men’s Shed preparing bat boxes and the City providing a platform to help provide the bat boxes to residents � Community education is also a key piece of the work undertaken in mosquito control with multiple workshops conducted within local schools to educate students about mosquitoes and how to control their populations
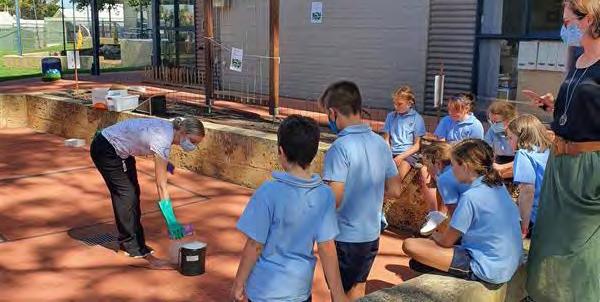
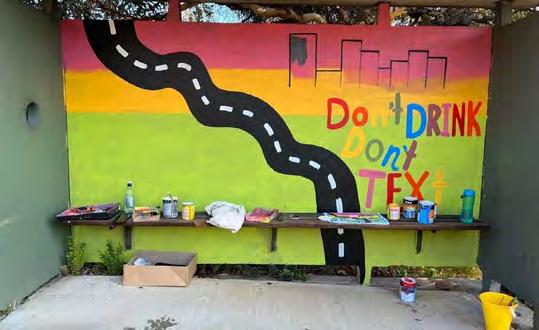
The City’s 12 month program of road safety awareness finished in March 2022, and the work led to an Honourable Mention in the National Awards for Local Government � Funded mainly by the Commonwealth, the focus of the program was informing and engaging with the community in better road safety behaviours through social media and advertising � T he City also engaged with local schools, with students submitting hundreds of art pieces around the theme of road safety T he best pieces were then painted onto local bus shelters which you can see on Berkshire Road (north of Hawtin Road), Kalamunda Road (near Gray Road), Newburn Road (near High Wycombe Primary
The City submitted for State Black Spot funding early in the 2020/21 year for safety improvements along the western end of Canning Mills Road� T his work will be delivered in 2022/23
�
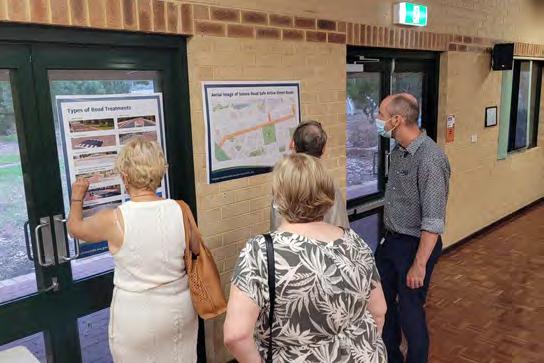
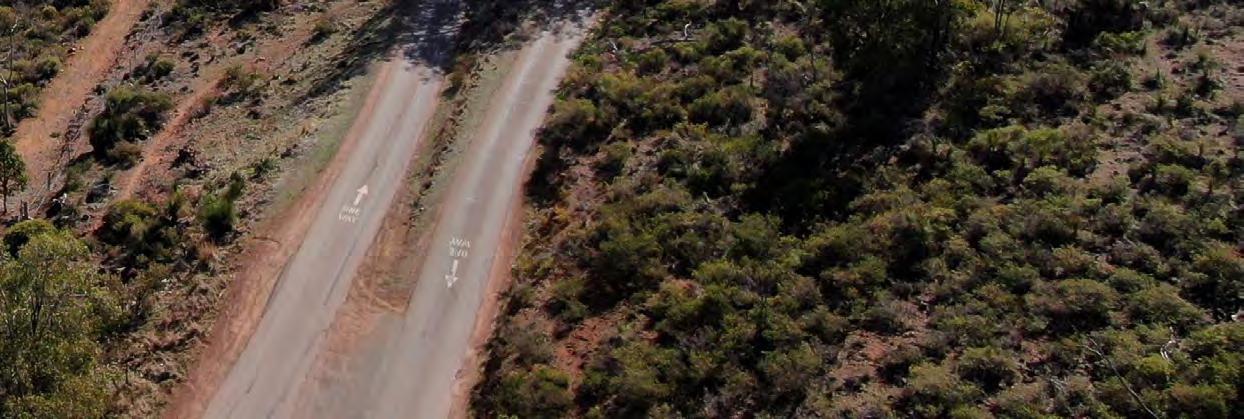
Continuing the implementation of the Bicycle Plan, the City has sought further funding through the WA Bike Network Program delivered by the Department of Transport In 2021/2022this involved community engagement and designs for Safe Active Streets in Sussex Road Forrestfield and Kiandra Way High Wycombe�
S afe Active Streets are streets that have been designed to slow traffic to an operating speed of 30 km/hr or less, while providing an environment where people on bikes can safely share the lanes with traffic T hese two roads were identified as viable for this type of improvement as they are off the main thoroughfares (of Hale Road and Newburn Road respectively), already have local traffic, residential environments, and connect to schools and large recreational areas � Community consultation was very positive, and the City has accepted the many concerns around ensuring that
�
Due to general funding constraints, the City will not be able to proceed to construction on these projects until 2024/25 at the earliest We thank the people that took time to contribute their ideas and thoughts on the project
The City developed and submitted designs and a funding application for a section of Kalamunda Road, High Wycombe in May 2022 to Main Roads � If successful, the City will then be proceeding to detailed design and service relocations in 2023/2024 and construction in 2024/2025
T he project arose from the Kalamunda Road Functional Review and Upgrade Plan, with community consultation undertaken in 2019� T he plan is to provide a “main street” environment for Kalamunda Road from Roe Highway to Abernethy Road� T his includes retaining the one lane each way and having improved streetscapes and cycling and pedestrian facilities � T he Hawkevale Road intersection will be upgraded to a roundabout that also connects to Range Court During 2023/2024 residents will be consulted on the project to help inform the design
The Community Health and Wellbeing Plan 2018 – 2022 is the City’s plan for improving the health and wellbeing of the community� Highlights for the 2021/2022 year include:
» Smoke free event in partnership with East Metro Health Service at Kalamunda Shopping Centre;
» Dis seminated information by providing flyers and posters for the COVID-19 safety measures and vaccination information in our community centres and facilities;
» Further promotion and education on the City’s microbat program and presentations at Kanyana wildlife park
�
» Food sensations, 4-week free cooking class at Forrestfield Library
» Asbestos awareness stall at Bunnings
» Public Health Advocacy Institute of Western Australia Commendable award for COVID innovation grants for children’s mental health
» Undertook review of current local public health data to inform next public health plan
» Continue to support the Perth Hills Wellbeing Alliance
» Received funding from Healthway to support healthy eating with the canteens at Ray Owen Sports and Kalamunda water park
The theme of the state-wide Youth Week celebration in 2022 was ‘Courage to Change’ Inspired by the theme,
Youth Services delivered an Eco Festival series, hosting 17 different activities for the community including a local creatures science session, Kanyana Wildlife Rehabilitation Centre tours, a photography walk with ‘Birds of the Perth Hills’ author Talitha Huston, a cultural walk with Uncle Neville Collard, reserve clean up, themed story time sessions, and more T his program was supported by the Department of Communities through the Youth Week WA Grants Program
�
In an ongoing partnership with local business, The Clip Joint, the City of Kalamunda supports the ‘Find a Fairy Kalamunda’ Fairy Door Trail by designing and updating the free trail map and clue map, available on the City’s website, the Clip Joint and the Perth Hills Visitors Centre�
The two walking groups in the City have seen a rise in numbers attending the walks as they continue to provide an opportunity for participants to socialise whilst looking after their physical and mental health
The City of Kalamunda was again successful in distributing KidSport funding from the Department of Local Government, Sport and Cultural Industries
(DLGSCI) for the 2021/2022 financial year to support junior participation in active sport and recreation clubs � T here were 699 vouchers processed for 554 kids across clubs located within the City
The City completed a major redevelopment of the lake in Stirk Park � T his redevelopment increased the holding capacity of the lake for stormwater flows into Stirk Park whilst properly managing the discharge of stormwater from the lake into the overall drainage network �
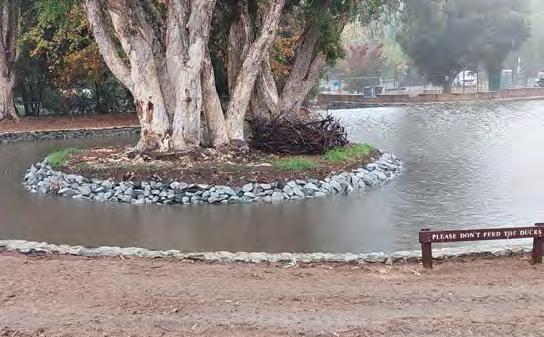
Key features of this project were preserving and enhancing the area around a significant tree and finding a new home for the resident turtles before construction works commenced Our local ducks decided to wait and see and have been seen with their new ducklings paddling away�
New plant and grass beds will assist in water quality as well as erosion control�
These works were undertaken in preparation of the planned construction of the new Playground and Skate Park to commence in 2022/2023
space where aged care residents and their families can enjoy the open space as well as providing our nearby families much needed play equipment
The Perth Hills Loop Trail, Stage 1 continues to be very popular with cyclists and walkers providing greater opportunities to explore the Kalamunda region
� T he City is continuing its discussions with external stakeholders to help understand the opportunities and constraints that will need to be considered for the next stages of the loop development, being the links between the Camel Farm and Kalamunda township, and the Camel Farm and Pickering Brook � Kalamunda Water Park
Kalamunda Water Park is managed by Belgravia Leisure in partnership with the City of Kalamunda T he 2021/2022 summer season successfully began in November and was again impacted by COVID� Attendances for the season were 41,788 persons � T he facility continues to provide for the community, schools, and local swimming clubs �
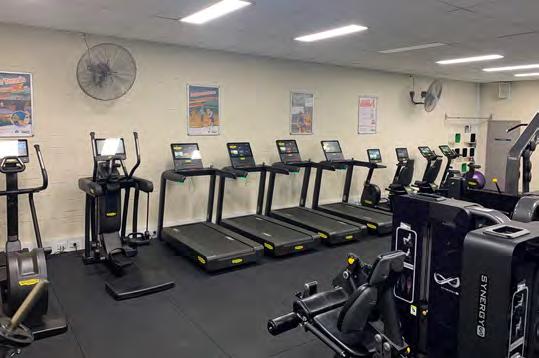
The City’s recreation facilities continue to offer a wide range of high-quality programs and social opportunities across the four main facilities � T hese include a well-equipped gym, group fitness and wellness classes, school holiday programs, sporting competitions, junior programs (including the increasingly popular Kindy Gym), and Active Seniors classes
This project was initiated to provide the community with a new nature based play and quiet gathering space in the growing suburb of High Wycombe� Funding was provided as a joint initiative of the State Government, City of Kalamunda and Hall & Prior – operators of the adjacent Karingal Green aged care facility This playground provides a unique intergenerational
Despite the continued impact of COVID in the community, attendances through the Recreation Centres were able to get back to previous levels from 2018/2019� A number of new initiatives were also introduced this year including Monday night social Volleyball, social Pickleball, an additional Monday Kindy Gym session, new cardio equipment, and a facelift for the gym
New equipment at the Hartfield Park Recreation Centre
The School Holiday programs continue to be popular with the Kids Cooking Club classes always proving to be a success T his year, the sport-based junior programs (volleyball & soccer in particular) were also in high demand, continuing to be popular within the
At tendances for the Recreation Centres in the 2021/2022 financial year were:
» Hartfield Park Recreation Centre – 107,555 including 256 Gym members
» High Wycombe Recreation Centre – 34,267
» Maida Vale Netball Centre (360 classes) - 344
» Ray Owen Sports Centre (Live Active classes) – 228
The ability to host events at the Centres was again impacted by COVID however some events highlighting some of what is on offer at the Recreation Centres went ahead including:
» Positive Ageing Workshop in September
» Annual Christmas Juniors event in December
The City of Kalamunda’s Youth Services team facilitates the Kalamunda Youth Advisory Committee for young people aged 12 – 20 who have a connection to the City� T he YAK acts as a voice for young people to propose, plan, and deliver youth events and programs in their local community, as well as advocate for youth within Council
The City of Kalamunda continues to be an active facilitator and administration support provider for the Zig Zag Early Years Partnership Highlights for the
year include a series of pop-up play days such as a Scitech Discovery Pop Up Play, Teddy Bears Picnic, and the re-release of the updated Parent Directory� T he City continues to support the presence of three Child Health Nurses in Kalamunda, High Wycombe, and Forrestfield
�
The City facilitated two, free networking forums for local sporting club presidents this year� Both forums had engaging presenters that focused on leadership, the importance of culture and how to manage different personality types � T he City received very positive feedback and the clubs were thankful for
1.3 To support the active participation of local communities
1.3.1 Support local communities to connect, grow and shape the future of Kalamunda
the
�
In 2021/2022 the City’s Community Funding Program re-opened again after the previous year’s COVID Relief Funding Innovation Grants Program
�
The Community Funding Program provided funding support to local sporting clubs and community groups to provide them with assistance and support to continue to run effective and efficient clubs � T his year 20 local groups were successful with a total of $18,000 provided to groups and clubs within the community
The Kalamunda Sports Star Funding Program also reopened now junior athletes are able to travel interstate and nationally to compete in their chosen sports
� In
2021/22, 17 local junior applicants were successful with a total of $4,150 funded
�
The Strategic Sport and Recreation Committee (SSRC) reconvened in 21/22 following a break the previous year due to the impact of COVID� T he Committee is in place to assess and prioritise Capital Grant applications received from local sporting and recreational groups
� T he Committee made its final recommendations to Council as part of the budget setting process
�
T he following SSRC project from the 2019/20 financial year was completed in 2022:
» Kalamunda/Lesmurdie Little Athletics Storage Area and First Aid Room
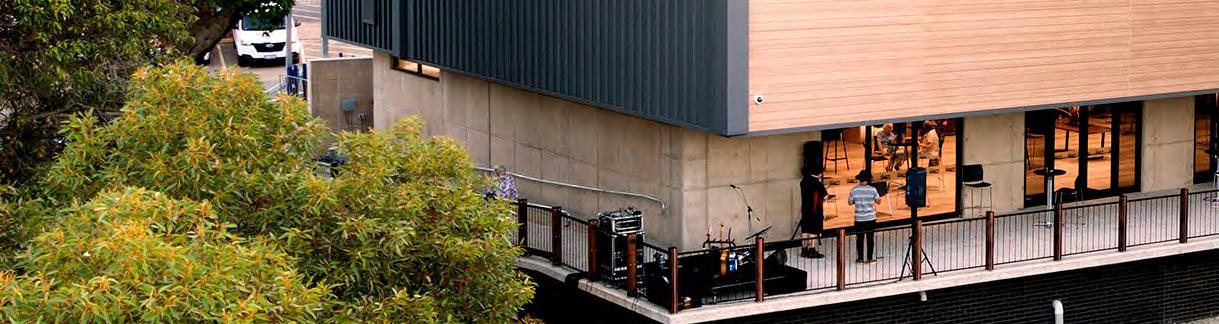
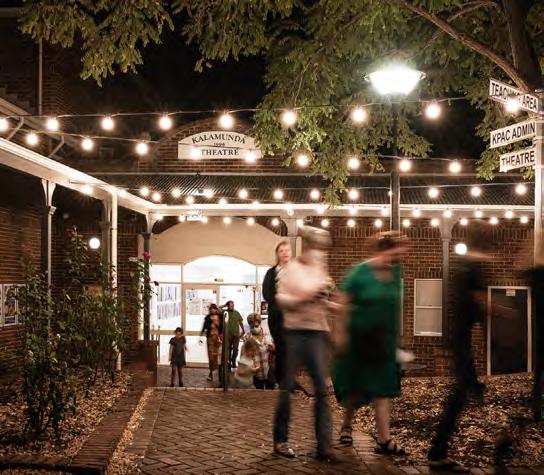
The Kalamunda Performing Arts Centre (KPAC), is the City’s multi-use performing arts centre, comprising of a 257- seat proscenium arch theatre, black box theatre space, Agricultural Hall, and historic Lesser Hall� T his multipurpose arts venue continues to be one of the premier attractions for locals and visitors alike, delivering a range of exciting and engaging performances throughout the year�
K PAC was impacted by COVID-19 restrictions and lockdowns in late 2021 which saw four featured shows cancelled, however by early 2022, KPAC was back in full swing and began to see a steady return in patrons to the venue� In 2021/2022 KPAC welcomed a total of over 42,500 patrons through the door�
K PAC also continues to attract a wide range of venue hires and bookings, from both the local community
as well as traveling intra and interstate performers, events, and bookings such as:
» Comedian, Ross Noble
» The WA Collectors Fair
» The Australian Electoral Commission
» Community performances
» School Musicals
» Multicultural events
In addition to KPAC feature shows and venue hires, Morning Music, continues to be a well patroned event with returning regulars and new audiences alike� Held on the first Wednesday morning of every month, a social morning tea followed by a concert continues to receive positive reviews and toe tapping from the regular visiting patrons
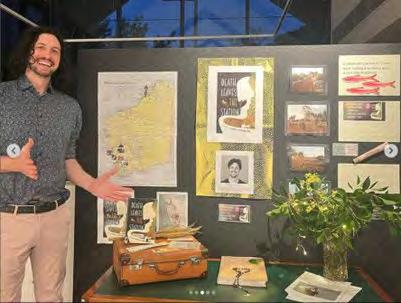
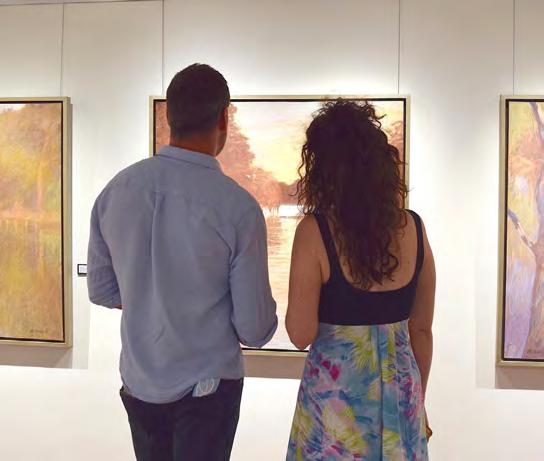
In the 2021/2022 year, the Zig Zag Gallery hosted 15 exhibitions and generated over $25,000 worth of art sales � A s the Gallery continues to build its relationships with Perth artists and our local community, the gallery also hosted several artists talks and artists in residencies, where the public were encouraged to come into the Gallery, and learn more about the artist, their subject matter, their techniques and more� Included in the 15 exhibitions for the 2021/2022financial year the City held four community-based art exhibitions - annual Lions Awards, NAIDOC Exhibition and Seniors Exhibitions and the Kalamunda Youth Art Awards � T hese exhibitions continue to be a great way to bring audiences into the gallery and celebrate our local diverse community here in Kalamunda
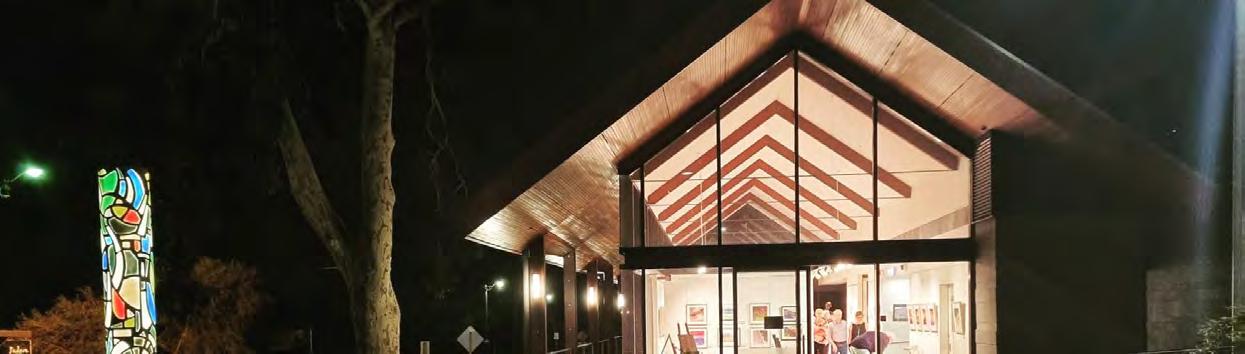
The Zig Zag Gallery continues to be a much-loved venue in Kalamunda hosting a wide variety of exhibitions from community based, emerging and established artists from both the Kalamunda and the wider Perth Region
�
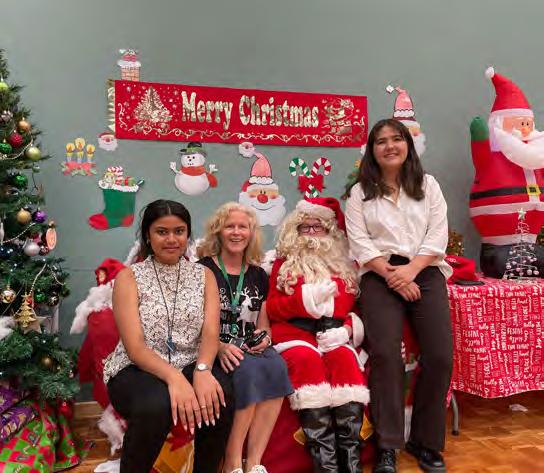
To celebrate the festive season, the Community Services team collaborated with Hartfield Park Recreation Centre to deliver a fun Christmas craft morning where 254 attendees across multiple age groups got together to create their own Christmas crafts
 “Crooked Water” exhibition by artist Ellis Pearson
City staff pictured with Santa Claus at the Intergenerational Christmas Crafts event
“Crooked Water” exhibition by artist Ellis Pearson
City staff pictured with Santa Claus at the Intergenerational Christmas Crafts event
Throughout the 2021/2022 Financial Year, the City of Kalamunda continued to implement the Local Environment Strategy�
the drafting of the City of Kalamunda Climate Change Action Plan, the adoption of two Local Planning Policies to guide future Public Open Space development and protect the environmental value of our waterways, the continuation of the City’s Waterwise Council status for 2021/22, the development of six catchment management plans to inform surface water management throughout the City, the completion of the City of Kalamunda Waste Avoidance & Resource Recovery Plan, and the drafting of a Local Biodiversity Strategy which is currently under review
Some key objectives achieved in this period include
Highlights from this year include the over 13,000 seedlings given away to residents during the Plants for Residents event, 38 Quenda homes being constructed from recovered materials, the WALGA Street Trees initiative increasing shade by nearly 54,000 square metres, and 51 volunteers, contractors and staff completing their Dieback Greencard training
The City of Kalamunda has been working on the Draft Urban Forest Strategy following public comment � T he vision for the City’s urban forest is: Our diverse forest is valued as an intrinsic feature of our evolving urban landscape that supports a happy, healthy and prosperous community
The draft Strategy has been developed in part to respond to this annual loss of tree canopy, especially in
the urban environment � T he Strategy looks at the three main environments within the City (Swan Coastal Plain, Darling Scarp and Darling Plateau) with targets for both retention and improvements in tree canopy coverage by 2028 against the 2018 benchmark � Specific actions have been proposed in the Strategy
The Draft Strategy has now been sent for peer review and is expected to be finalised in 2023
The City has developed a Draft Local Biodiversity Strategy, which has had public consultation occur and is currently being peer reviewed
T he Draft Local Biodiversity Strategy 2020-2030 is presented in two parts:
PART 1: Summary and Actions
This section provides a summary of key elements of the
strategy� Key aspects of the summary include:
» Why it is important to conserve biodiversity
» What is the status of biodiversity in the City of Kalamunda
» What we can do to improve biodiversity conservation in the City�
This section provides documentation of the data and methodologies used to inform the Strategy Key elements of this section include:
» Biodiversity assets of the City
» Threats to biodiversity
» Methods used to identify high biodiversity value areas and corridors
» Biodiversity conservation priorities
» Methods available to conserve biodiversity within the City Strategy Action Plan
Comprehensive mapping of biodiversity features within the City including access to a web based GIS platform
The City has continued to strive to integrate ecosystem and biodiversity protection into planning process Dr aft provisions are being considered, in liaison with the State Government, to inform recommendations for the new Local Planning Scheme (LPS 4) for vegetation and tree protection and retention, as well as rehabilitation � T he Draft Local planning Policy - Tree Retention, for retention and replacement of trees through the planning process has been developed� T he intent of the draft LPP is being partially implemented through the development approval and compliance process currently T he City is also increasing resources in
development compliance to facilitate compliance and education regarding vegetation and tree retention
T he Draft Local Planning Policy 34- Wetlands and Waterways which establishes foreshore areas, wetland buffers and rehabilitation requirements through the planning process was developed� T his policy is currently on hold, awaiting State planning Policy 2 �9 review to conclude�
An Environmental Planner has been recruited to assist in reviewing environmental impacts of planning applications and providing advice on City projects
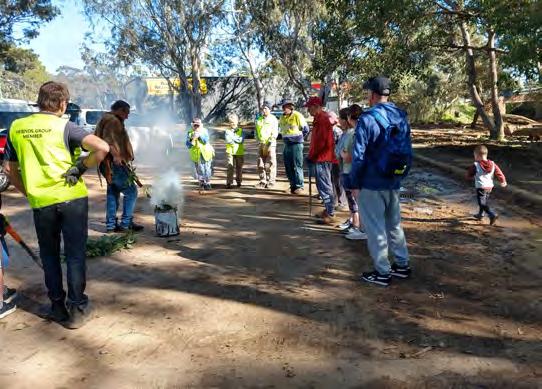
This year’s Planet Ark National Tree Planting Day event was held at Woodlupine Brook, Forrestfield on Saturday 25 June 2022 � T his community event was held as part of the Western Australian Government’s Natural
Resource Management Program and the partnership with the Water Corporation to re-vegetate stage 1 of the Woodlupine Brook reconstruction T he event began with Uncle Neville Collard delivering a Welcome to Country smoking ceremony O ver 500 plants were
2.1.4 Increasing and protecting local biodiversity and conservation wherever possible, through integrating ecosystem and biodiversity protection into planning processes including schemes, policies and strategies
planted by 20 adults and 8 children and they were rewarded for their efforts by a free sausage sizzle, donated by Kalamunda Toyota � Planet Ark also donated hats and gloves for participants to use during the event
Walliston Primary School was selected for the Schools National Tree planting day on 2 June 2022 with the entire school, approximately 300 students, participating �
Approximately 550 plants were planted in the school’s Adopt-A-Patch bush near to their yarning circle and newly installed Cockatube�
colouring and play dough activities � Constable Care also made an appearance for 3 hours and the Woodlupine Family Centre ran a sausage sizzle that participants could purchase after collecting their plants
F eedback from the event was overall positive and a debrief after the event identified that ordering the plants in alphabetical order, by common name, assisted with the flow and ability for people to find their ordered plants �
Some comments from feedback in the Plants for Residents Survey include: “This new way of ordering online is way better than previous years when, by the time we got there all the plants were gone already� New system of click and collect is great!”
“Just moved into 4,000m2 property that’s neglected� So, this helps us bring property back to life and create habitat for bees, birds and fauna � ”
“Wonderful it has encouraged many animals/birds Less watering required ”
“Usually, I only lose a couple� Great quality & my property is benefitting from more animal visitors :)”
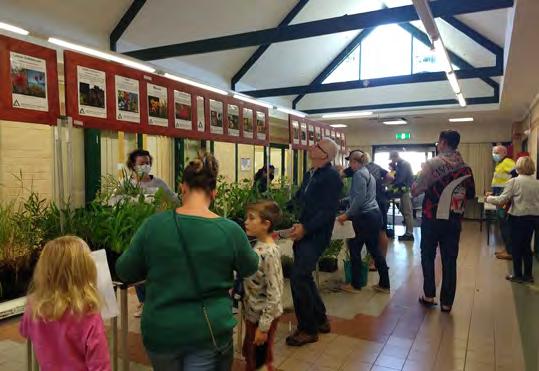
On the 28 May 2022 the City of Kalamunda gave away 13,200 plants as a part of the Annual program, which this year was once again held at the Woodlupine Community Centre, 88 Hale Road in Forrestfield�
T he event included City of Kalamunda staff providing information relating to Waterwise planting, ‘look out for wildlife’, recycling stickers and vegetable seedlings Also, the Health Team engaged with attendees encouraging them to have a go on the smoothie bike and an activity room was provided for children with
“Our property has transformed! This programme is community changing thank you! FYI � Your volunteers are amazing!”
“We have an entirely native garden, much of it from these free plants over the years Even though we’re on a relatively small residential block we love all the birds that specifically seek out our garden to visit �”
The Adopt-A-Patch program included a number of events held at schools and a Greenlab Professional
City of Kalamunda
Learning Day was organised for 17 teachers on 3 September 2022, hosted by the City of Kalamunda in partnership with Millennium Kids
�
Schools involved in the Adopt-A-Patch program during 2021/2022:
» Walliston Primary School
» High Wycombe Primary School
» Lesmurdie Primary School
» Kalamunda Cub Scouts
» Wattle Grove Primary School
» Darling Range Sports College
» Gooseberry Hill Primary School
» Edney Primary School
» Mat thew Gibney Catholic Primary School
» Kalamunda Secondary Education Support Centre (KSESC)
Collection & Exploring the Kalamunda Heritage trail, watering techniques and Quenda observations at Hugh Sanderson Reserve, woody weed removal, infill revegetation planting and a NAIDOC week event
�
On 29 March, Walliston Primary School enjoyed the opportunity to watch and learn from Simon Cherriman when he installed a Cockatube near to the school’s new yarning circle and Adopt-A-Patch bush Approximately 70 students listened to Simon talk about the Black Cockatoos and they then moved outside to watch him climb the tree, install the Cockatube and explain what he was doing � Students were excited to have the opportunity to monitor when the site becomes popular to birds, and hopefully Black Cockatoos �
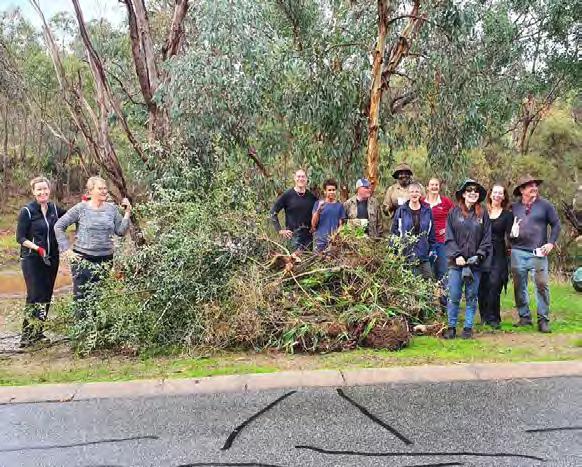
Per th College had a busy bee at Jorgensen Park and tackled woody weed removal on 3 May 2022 with 120 year 9 students � T his was arranged as a way to provide an activity for the College as camps weren’t available due to COVID restrictions � T he students were first introduced to the park by listening to a summary about the revegetation project which was funded through the Swan Alcoa Landcare Program and Quenda home construction T hey were then split into groups to work in areas throughout the park
T he event was very successful, with teachers providing feedback that the students valued the experience and the school would be interested in helping again�
As part of activities with the KSESC Duke of Edinburgh Award students, key topics in the second semester of 2021 delivered by the City of Kalamunda Environment Team and volunteers included: dieback, native wildlife by Kanyana, bees, woody weeds, rubbish clean-up in Local Natural Areas and the KSESC Graduation was held on 23 November 2021 (25 attendees), with presentations from the Mayor� In the first semester of 2022, topics covered by the City included: Rubbish
Woodlupine Primary School conducted a clean up of Woodlupine Brook near Aldi and the Nature Play space with 28 students, organised by a year 6 student Bella Lehman on 13 May 2022 T he students collected 2 very full bags of rubbish and undertook a rubbish audit
T he Kalamunda Cub Scouts undertook their first weed removal and Adopt-A-Patch activity at Sundew Reserve on 29 May 2022 with 20 participants � T he newly formed Friends of Sundew Reserve also assisted with loading woody weeds that the Environment Team had previously cut up and took the green waste to the
�
Twenty four participants from the Kalamunda Cub Scouts enjoyed a Reconciliation Week night walk and cultural awareness activity at Jorgensen Park with Uncle Nick Abraham on 1 June 2022
The 2022 Commemorative Tree Planting program was held on Friday 8 July 2022 at Jacaranda Springs, Ledger Reserve and Maamba Reserve where we celebrated the birth of 147 babies born in year prior
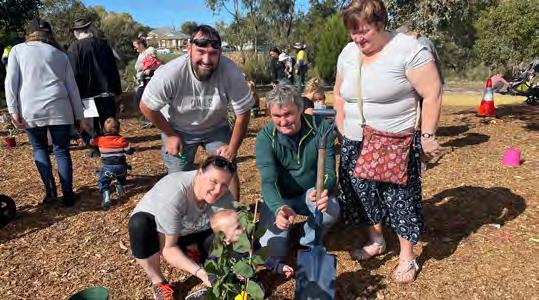
With beautiful weather conditions on the day and many getting involved in the planting at the reserve, the event was a great success, with our Mayor Margaret Thomas introducing the event to attendees at each location
�
The use of a field based data capture system has allowed the City to effectively map problem weeds Genista linifolia and Genista monspessulana infestations throughout the City� Both of these shrubs are Weeds of National Significance based on their invasiveness and impact characteristics, their potential and current area of spread and their primary industry, environmental and socioeconomic impacts �
In the City, Genista is mainly found in dense clumps on roadsides and overtime will spread further into agricultural land and bushland�
Each property owner is responsible for feral animal control on their property� T his includes the City and the key messaging from the City to the community is that our collective efforts will bring the best results �
A workshop to assist the residents to understand their responsibilities in managing feral animals was conducted at the Lesmurdie Club in May 2022 Twenty residents were in attendance to hear representatives from the Department of Primary Industry and Regional Development explain individuals’ responsibilities under the Biosecurity and Agriculture Management Act 2007 and provide advice on control techniques available to residents in the City of Kalamunda �
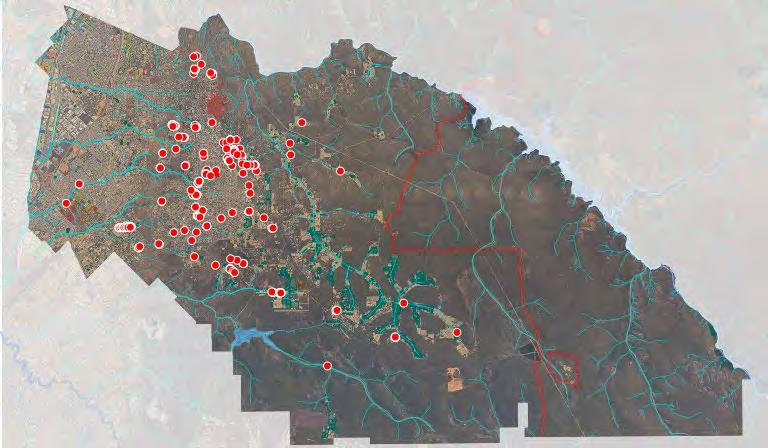
The City continues to maintain a database which records locations and timing of fox sightings reported by the community T he data is used to guide the City when planning feral animal control activities � T he data this year was used for a fox control program within the Walliston/Bickley/Carmel/Pickering Brook areas which saw the City’s contractor trap and dispose of five foxes and one feral cat as well as locating and destroying 7 fox dens
Figure 5 � F ox Trapping Location Map
There were 14 planting days held by Friends Groups at the following reserves:
» Booralie Way Reserve (some plants donated by National Tree Planting Day)
» Coral/Crayden Reserve
» Fleming Reserve
» Gunbar Way Reserve
» Jor gensen Park
» Ledger Road Reserve
» Markham Road Reserve
» Railway Reserve
» Robert Road Reserve
» Spring Road (North) Reserve
» Taylor Road Reserve
» Toornart Creek Reserve
» Woodlupine Brook
» Woodlupine Living Stream (Kalari Road) Queens’ Jubilee
In June 2022, funding was awarded to the City of Kalamunda for the Queen’s Jubilee A s part of funding provided for the Queen’s Jubilee, an official tree planting event was held on Tuesday 26 July 2022
�
Western Australian Government’s Natural Resource Management Program Community Events in partnership with Water Corporation
On Friday 24 June, 5 members from the Friends of Woodlupine Brook and other Friends Group members planted approximately 400 plants in the Woodlupine Brook revegetation area
�
On Monday 27 June, 10 students and two teachers from Darling Range High School planted 500 tubestock as one of the Western Australian Government’s Natural Resource Management Program community events
�
The City has 35 active Friends Groups who contribute greatly with their knowledge and assistance, caring for our bush reserves
�
T he Friends of Kadina Brook also received funding for Round 5 of the Community Rivercare Program to provide bank stabilisation, prevent foreshore erosion, increase riparian vegetation and reduce the weed burden along Kadina Brook in Kadina Reserve, Gooseberry Hill� T his project will be funded from 2022 to 2026
�
Some notable events involving the Friends Groups include:
» A Creek Awareness Workshop with Kadina Brook friends group on 14 August 2021 which included a community walk to discuss catchments, creeks, issues and management
» During the month of September 2021 the Local Natural Areas of Kalamatta, Hill Street, Maida Vale, Hartfield Park and Railway Heritage Trail held Nature Walks with a total of 64 participants attending �
» On 11 September 2021, Booralie Friends Group held a working bee with 18 participants A total of 100 wetland species, 100 dryland species were planted with 2 temporary fences erected and 3 quenda bungalows constructed
�
» Throughout this financial year, Quenda bungalows have been constructed at Booralie Way Reserve (3), Gunbar Reserve (3), Jorgensen Park (10), Gooseberry Hill Primary School (12 half bungalows)� With the Jorgensen Park event being part of International Women’s Day, 15 people assisted with construction�
» On 9 November, 2021 the Western Australian Landcare Network held their Landcare Conference in Kalamunda and in collaboration with the City of Kalamunda held a Field Walk in Jorgensen Park �
» Rubbish collection at the Woodlupine Brook 27 January 2022 with 6 Friends members from the Friends of Woodlupine Brook � Juniper clean-up with 6 Friends Group members, collecting 3 bags of rubbish
» On 5 February 2022, the Friends Group Coordinators Meeting was held at the Jack Healey Centre with 35 attendees T his event included a talk by Ryan Craig, from the University of WA about his research on Parasitic Plants
» In collaboration with the Youth Services Team, the Environment Team held a Youth Week Clean-up Day at Kalari Road Reserve (Woodlupine Brook) with 20 participants and 16 bags of rubbish collected�
» The Kalamunda Cub Scouts helped out at the Toornart Creek Friends Group planting day� T he Friends Group planted tubestock from both the City of Kalamunda and also 200 plants donated by Trillion Trees � Also, as part of National Reconciliation Week, the Kalamunda Cub Scouts attended a night walk
�
» As a deliverable of the Local Environment Strategy to Map all our Local Natural Areas for the presence/ absence of Phytophthora, 121 hectares of our bushland reserves throughout the city were
assessed, including:
» Canning Road and Mason Mill Reserves, Lower Lesmurdie Falls, Kadina Brook Reserve, Jorgensen Park, and Yongar Reserve All new data is entered into our Intramaps system for viewing by the City and the community�
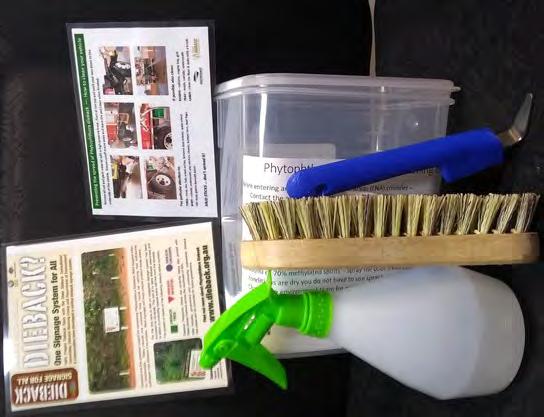
» Two Greencard training events were delivered by an accredited trainer to 12 Friends Group members and 16 staff and contractors from Asset Delivery� Dieback Hygiene kits have also been created for use by City staff before entering bushland with dirty equipment
�
The City was successful in receiving funding from the Western Australian Government’s Natural Resource Management Program T he $56,363 grant will allow the City to map the occurrence of Phytophthora cinnamomi in 75ha of Local Natural Areas over the next three years � T he grant will also assist staff and key contractors working for the City to undertake Greencard training aimed at increasing their knowledge and awareness of the disease and practical ways to limit its spread�
On 10 August 2021, the City of Kalamunda joined other Western Australian Local Governments by signing the WALGA Climate Change Declaration� F ollowing extensive community engagement throughout 2021, and with the support of the City’s Environmental and Sustainability Advisory Committee the City of Kalamunda drafted a Climate Change Action Plan for public comment
�
The Draft Action Plan sets out what the City of Kalamunda will be doing to address risks to the City’s environment, economy, infrastructure, community health, safety and wellbeing T he document will be reviewed regularly as new information and technologies, and government initiatives become available� T he development of the Draft Action Plan served as a call to action for all members of the Kalamunda community� It was positioned as a collaborative tool that should be seen as a ‘living document’ and plan, developed to ensure the City and its residents remain prepared and ready to adapt to the climate challenges that lie ahead T he City stood behind the conviction that responding appropriately to climate change demanded a whole-of-community approach and therefore the Action Plan outlined the City’s commitment to support and advise businesses, community groups and individuals to help them meet these challenges, alongside the City’s own
commitment to action, advocacy and policy change�
In 2021 the City collaborated with the community to better understand opinions on Climate Change and to identify actions needed to address risk to our environment, economy, infrastructure, and community health, safety and wellbeing
Two primary engagements were undertaken, including:
» A two-hour Big Ideas Climate Change Forum held on 2 December 2021; and
» A Have Your Say Survey that closed on 2 December 2021
�
The feedback was used to inform the development of the new Climate Change Action Plan
The Survey received 122 responses, and four (4) formal written submissions � The overarching sentiment was in strong favour of an Action Plan and of the City taking a leadership role in Climate Change emergency action�
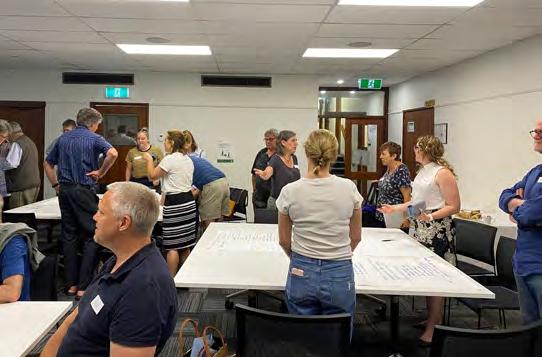
There was a strong turn out to the Big Ideas Climate Change Forum, with 27 community members attending (31 registered) T he workshop was facilitated by the City’s Engagement Specialists and Project Leads P articipants were highly motivated, engaged and contributed valuable conversations and ‘Big Ideas’ to help formulate the City’s Climate Change Action Plan� T here was strong sentiment to call it a Climate Emergency Action Plan�
Further to the above engagements, the City delivered an integrated marketing campaign to promote understanding and awareness of climate change, the urgent need for action and increase stakeholder awareness of the City’s proposed Climate Change Action Plan
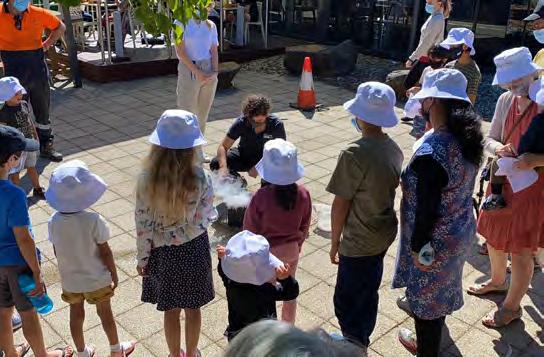
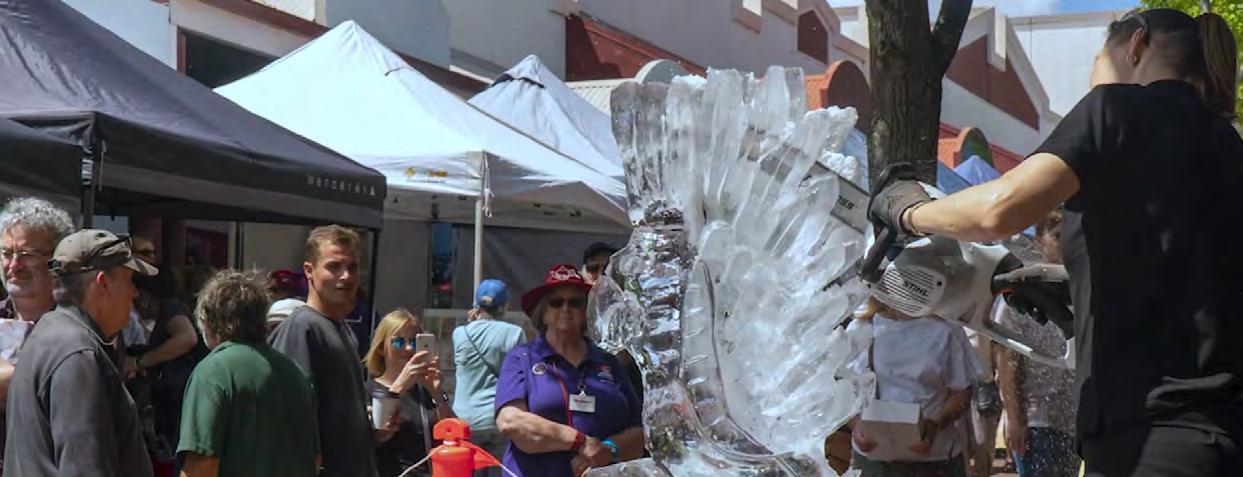
A Live Ice Carving Event was held at the Artisan Markets, where an ice carving of a cockatoo provided a striking conversation starter and opportunity for locals and visitor alike to provide feedback to the City�
2.2.1 Manage the forecast impacts of a changed climate upon the environmentBig Ideas Climate Change Forum, December 2021
A number of ice sculptures that slowly melted across the day created a thought provoking metaphor about the impacts of Climate Change, aiming to raise general awareness of Climate Change in the community and to develop the sense of place and ethos associated with the City of Kalamunda T he act of localising the conversation, of engaging with people in the City on what this means for both our community, our natural surroundings and ‘backyard’, as well as the global impacts, was one strategy used to gain momentum for a community-wide conversation about what action could be taken by individuals and groups at the local level, and what influence could the Kalamunda community have on the State, Federal and International level� F ootpath stickers and posters with QR codes were placed in the market zone to further promote the project and lead attendees to the live ice carving and engage in conversations T he event was filmed for additional (and future) Climate Change promotion and engagement � ‘Pop-up, Pop-in’ Booths were set up outside the Kalamunda Library and Hawaiian’s Forrestfield shopping centre to encourage further face-to-face discussion of the project, continuing the visually
striking ice sculpture works of art as a way to capture attention and invited locals and visitors to the area to learn more about the project � T he booths were also promoted on the City’s Facebook page� Across all social media channels, community engagement was high with more than 47,703 Post Impressions, 17 comments and a 2 4% average engagement rate O ther tools used included mail outs to stakeholders, newspaper advertising, posters, one on one meetings with relevant stakeholders, media releases, a printed survey and engagement via the City’s online engagement portal�
F ollowing this extensive community engagement, and in partnerships with climate change experts, the City prepared a Draft Climate Change Action Plan which was distributed for further public comment T he Draft Action Plan outlined practical approach to dealing with the changing climate, building a strong green economy and further reducing greenhouse gas emissions � In doing so, the City sought to move beyond alarming people about the climate emergency to assuring them that meaningful action is possible and essential, presenting important new opportunities for Kalamunda’s community
All of these reserves have been designed for efficiency in mind� Hydro zoned areas for specific plant needs means some areas receive minimal water to deliver better water efficiencies
The Reticulation Team ensure regular maintenance of the City reticulation systems, such as testing of all the bores which helps to identify any issues and ongoing servicing requirements


In 2021/2022 the Parks Supervisor arranged removal of 285m³ of organic matter from the cricket oval In addition to levelling the oval, this process also removes built up dead grass vegetation that allows fertiliser and water to get through to the grass roots where it is taken up by the plant
�
During 2021/2022 effort continued to work through Waste Plan actions with a focus to increase the amount of Waste recovered and reduce the amount going to Landfill�
The City of Kalamunda, in partnership with Cleanaway the City’s waste contractor reviewed options to significantly increase the recovery and recycling rates of general waste skips provided to local residents (On request Skip Bins)�
A recycling/recovery option was identified resulting in the General Waste Skip Bins from April 2022 being taken to a sorting plant, resulting in almost 40% recovery being achieved�
The City has been involved in promoting the Containers for Change Program (10c Container Deposit Scheme) to ensure containers get another chance and be recycled rather than landfilled� Along with its Recycling hubs in local shopping centre/libraries hosting drop off points for household (dry cell) batteries, light globes, mobile phones and ink cartridges � T he City’s Waste Van mobile education vehicle has been used for events and in schools
�
At the Walliston Transfer Station improvements continued to increase the amount of waste recovered/ recycled
Waste Services have built asphalt and sealed roads throughout the Walliston Transfer Station� T his has alleviated the issues we were having with dust �
Speed cushions have been installed to help keep the speed to 10Km per hour speed within the site�
Waste Services have poured a concrete hard stand for the mixed waste area; this has been a huge improvement for the movement of the bins and safety hard stand is 150mm thick with 8mm reo bar
T he Second Chance Shop opened in February 2022 and is very popular with residents � It serves a dual purpose in that it has been a success with the community and by reducing the City’s land fill tonnages � Currently, the Second Chance Shop is selling approximately six tons of goods every month; instead of six tons ending up in landfill
2.3 To reduce the amount of waste produced and increase the amount of reuse and recycling of wasteLincoln Reserve Reticulation Upgrade
The shop is managed by Workpower who employ four staff members, some with a disability who work alongside industry professionals
�
The city was successful in receiving an $18,000 grant from Waste Sorted, the money was used to purchase a cardboard compactor
Having the compactor means Waste Services could remove 10 of the cardboard skips from the Walliston Transfer Station saving money and allowing space for other useful recycling processes
�
T he cardboard baler is operated by Workpower staff, and they also take the bales for recycling allowing them to collect the rebates for the cardboard

T his has also meant that no cardboard ends up in landfill� On average we bale 5 tonnes of cardboard every week
�
The City continues to undertake complex sampling, maintenance, and remedial works on contaminated sites to fulfil Contaminated Sits Act 2003, Statutory responsibilities � T he Former Brand Road Landfill investigations are continuing to understand soil, landfill gas and groundwater contamination for reporting and mitigation purposes
�
T he City commissioned a Mandatory Auditors Report (MAR) on the Brand Road site, before submitting to the Department of Water and Environmental Regulation (DWER) T he MAR resulted in a requirement to expand Brand Road investigations to better understand the nature and extent of the contamination
�
at both Pioneer and Dawson Park, which formed part of the former landfill T he Dawson Avenue sites will follow the same statutory reporting process already completed at Brand Road
� L andfill gas and groundwater mitigation measure are refined and implemented through ongoing investigations
� T hese measures include landfill gas extract systems operating on-site and leachate management systems at the Brand Road and Dawson Avenue sites
The City’s commissioning of contaminated sites investigation and Audited reports are used to support Government agencies determination of future land use proposals � A small-scale solar farm and sporting precinct are some of the land uses being considered
�
Works continued through approved Asbestos Management Plans (AMP) for Ledger Road and Alan Anderson Reserves The ongoing management involves Biannual emu picks of surface asbestos and review of the AMP for effectiveness recommended improvement
Detailed Site Investigation will also be conducted at the former Dawson Avenue Landfill sites during the current reporting period and beyond� T he investigations include groundwater, landfill gas and soil evaluation
� T he contaminated site investigations were supported by over 50 sites safety audits and rectification works conducted by the City this reporting period� T he resulting improvements in sites safety include targeted signage; installation of CCTV towers; and installation and repair of fencing

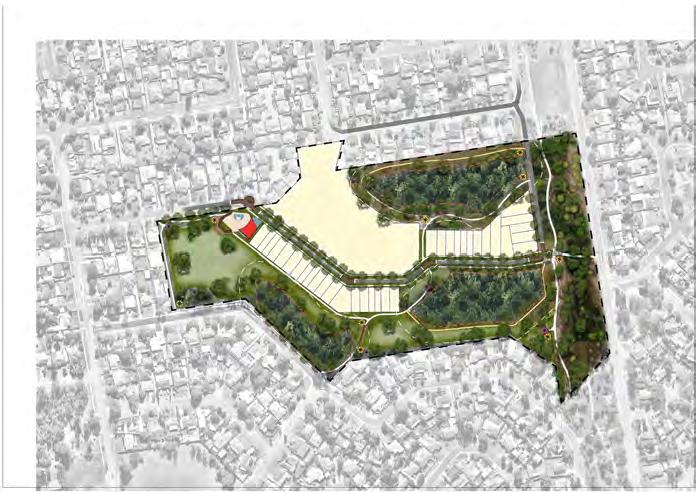
After several years of planning, the Cambridge Reserve Concept Plan (Concept Plan) and an amendment to Local Planning Scheme No� 3 were adopted by the Council in August 2020 and approved by the WAPC in April 2022
�
T he Concept Plan outlines a vision for Cambridge Reserve including a site for aged care and residential development and a focus on protection of environmental values, improved drainage, and open space improvements including new recreational spaces

The Residential Precinct Local Structure Plan (LSP) encompasses the land generally bounded by Poison Gully Creek, Roe Highway, Sultana Road West and Milner Road, just to the east of the new High Wycombe Train Station, and the associated Transit Oriented Development Precinct � T he LSP has been prepared to facilitate the coordinated development of high-quality medium to high density residential development, expected to encompass single houses, grouped dwellings and apartments �
The LSP provides for over 30 hectares of green public spaces in the form of local open space, environmental conservation areas and pre-existing Bush Forever bushland reserves � T hese green spaces will support the vision to create a ‘Forest Neighbourhood’ in a medium to high density area with a ‘bush character’� A primary school site is identified in conjunction with district open space on Brand Road, to form a future combined education and sporting precinct � T he Residential Precinct LSP was approved by the WAPC on 27 July 2020
A Business Plan was prepared which proposed entering into a land transaction for Cambridge Reserve with the State and satisfy the provisions of Section 3 � 59 of the Local Government Act 1995 � On 21 December 2021 Council resolved to proceed with the transaction as proposed in the Business Plan�
T he City is now focused on turning the Concept Plan to reality In October 2022 the State Government transferred ownership of Cambridge Reserve to the City to enable the project to continue to the next phase� T he next step will see the City seek expressions of interest to develop the site and bring the concept
Plan for diverse and sustainable activity centres, housing, community facilities and industrial development to meet future growth, changing social, economic and environmental needs
Modifications to the Residential LSP have been prepared to align the LSP with the spatial layout of the adjacent Transit Oriented Development Precinct Activity Centre Structure Plan (TOD ACSP), to have regard for projected residential and commercial development, and regard to traffic investigations undertaken since the approval of the LSP� T he LSP Amendment was adopted at the Ordinary Council Meeting on 24 May 2022 T he LSP Amendment was considered by the WAPC’s Statutory Planning Committee (SPC) meeting on 11 October 2022, with the SPC resolving to request the City modify the LSP in accordance with the schedule of modifications � T he City is progressing modifications to the LSP Amendment and supporting technical reports for submission to the WAPC �
T he draft TOD ACSP was adopted by the Council at the Ordinary Council Meeting on 12 October 2021, for the purposes of submission to DevelopmentWA for assessment, consultation, and determination� The draft TOD ACSP has been lodged with the planning authority, DevelopmentWA, and is required to undergo an assessment and advertising process � T he City has been advised that DevelopmentWA are to recommence further establishment of the planning framework for the precinct, including the preparation of Design Guidelines and undertaking consultation with landowners and key stakeholders
The City’s development engineering team has continued to see significant development activity, and continue providing high quality advice and assessment services to developers on matters relating to drainage, roads, lighting, retaining walls and related engineering assets
�
Notable developments underway during 2021/2022 were:
» The Hales Estate, which progressed through to the final development stages with further roads, drainage, landscaping and associated designs and construction
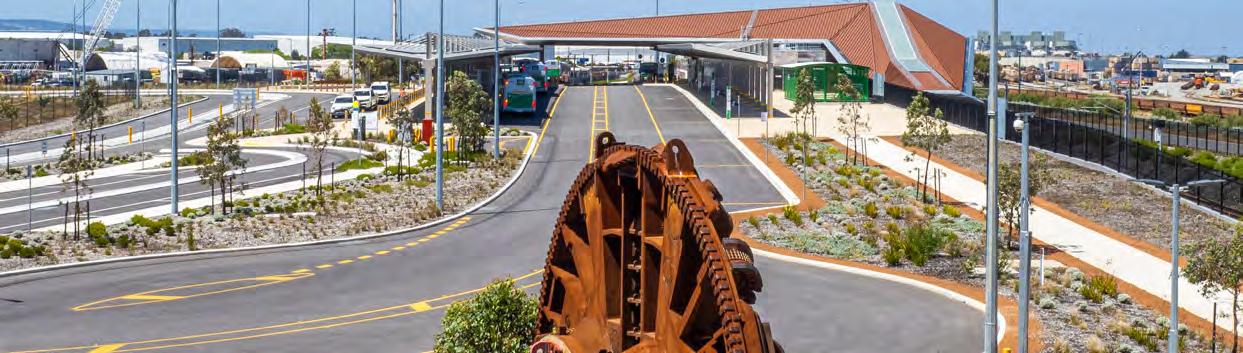
» The High Wycombe Train Station, including construction of upgrades and new roads around the station
The Transit Oriented Development (TOD) Precinct will incorporate planning for a new activity centre and commercially focused, transit-oriented area based around the new High Wycombe train station
�
» A number of developments in the new Roe Highway Logistics Park
» Developments of industrial lots in the former Aurizon site along Abernethy Road, and the Forrestfield Industrial area
All development in the City of Kalamunda is assessed
against the provisions of Local Planning Scheme No� 3, adopted policies and other relevant State legislation including the Planning and Development Act 2005, and the Planning and Development (Local Planning Schemes) Regulations 2015 � L and use compliance is undertaken in accordance with the City’s legislative and policy obligations resulting in negotiated outcomes or the issuing of directions and penalties where appropriate
In 2021/2022 a total of 696 planning applications were received, representing a 24% decrease in the number of planning applications when compared with the 2020/2021 financial year T he reduction in the total number of planning applications should be considered in the context that the 2020/21 year represented the period when COVID19 was at its height and people were in lockdown, which led to an increase in people undertaking home renovations � When considering the overall trend in planning applications 2019/20 is a better
1000
800
600
400
200
guide where the number of applications received is comparable� 0
Figure 10 Total Planning Applications Received 2017/18 - 2021/22
*Note: the 20 day approval timeframe applied to basic or fast track development applications is not a statutory requirement rather an initiative of the City of Kalamunda to streamline the planning assessment process �
For the 2021/2022 period a total of 527 development applications were processed O f this number 96% were processed within the statutory timeframe of 60 days
for standard development applications not requiring advertising and 90 days for more complex applications requiring formal advertising �
In addition to the statutory timeframes for processing development applications, the City operates a fast track system of processing basic development applications with a 20 day processing timeframe� A total of 99 basic development applications were processed, with 91% processed within a 20 day timeframe
Development of the Forrestfield/High Wycombe Industrial Area Stage 1 continues to yield high quality freight and logistics industrial development due primarily to its strategic location with respect to road, rail and air transport, with a number of highprofile companies taking advantage of the locational attributes of the industrial area �
T he City received a total of 14 Joint Development Assessment Applications (JDAP) for a range of commercial and industrial developments with an estimated value in excess of $2m, with the highest being estimated cost of $15m for a light industrial development
�
The City reviews, revokes and adds new Local Planning Policies for the purpose of ensuring consistency and transparency in the decision-making process, and importantly to provide guidance to Council, the City and the community on planning related matters � T he following Planning Policies were adopted by Council:
Review of existing Local Planning Policies:
» Loc al Planning Policy 26 – Public Art Contributions
» St ate Administrative Tribunal and Joint Development Assessment Applications
In the 2021/2022financial year the City has been involved in 7 appeals lodged with the State Administrative Tribunal and 14 Joint Development Assessment Panel applications for a range of
commercial and industrial developments with an estimated value in excess of $2m, with the highest being estimated cost of $15m for a light industrial development � A s the City continues to grow and the complexity and significance of planning applications increases, it is anticipated that the City will continue to receive an increasing number of SAT reviews and JDAP applications
In July 2018, Approval Services commenced its customer survey form for all planning applications processed by the City T he responses provide valuable feedback particularly in relation to where the City can improve its customer service in the processing of planning applications T he City received a total of 66 responses during the 2021/2022 period, with 83% of respondents stating that they were either satisfied or very satisfied, with 17% indicating stating they were unsatisfied or very unsatisfied�
During the 2021/2022 period, the City received an increasing number of complaints with respect to unauthorised works and land use activities in breach of the City’s Local Planning Scheme No� 3 as sociated
with a range of planning matters, including removal of native vegetation, and building construction� In order to protect the amenity of areas subject to the unauthorised works/activity and to acknowledging the expectations of the community with respect to compliance, the City may take steps to prosecute landowners/business in certain circumstances
Where a person contravenes the provisions of a local planning scheme, an offence is being committed and under s218 of the Planning and Development Act 2005, and a fine of $200,000 can apply and where the offence continues a further fine of $25,000 per day can be applied F or businesses the fine applied can be $1m
In 2021/2022the City successfully prosecuted a landowner for authorised works, with the business fined a total of $102,555 �
The City of Kalamunda continues to maintain Memorandum of Understanding with the Shires of Brookton (from March to the end of June 2022), Bruce Rock, Corrigin, Narembeen, Wandering and Williams �
T he principal services provided are:
» Process building applications and issue Certificates of Design Compliance for all Classes of Buildings A total of 73 applications were processed and Certificates of Design Compliance issued T his is 5 applications less than the previous year even though we now have an MOU with the Shire of Williams �
» Processing of planning applications for the Shire of Wandering �

» At tend onsite discussions with building applicants, inspect Shire building assets and provide reports that can be used for maintenance or for budgeting purposes �
» Undertake Swimming Pool fencing compliance inspections �
» Undertake building compliance inspections and provide written reports �
» Prepare Council Report items and attend Council meetings as and when required Building
The following table compares the number of Building, 2017/18 2018/19 2019/20 2020/21 2021/22
Works)
Other Approvals
2017/2018 1126 1087 510 446 34 51 46 2018/2019 988 968 424 423 59 30 32 2019/2020 974 962 427 431 44 31 29 2020/2021 1463 1420 525 763 72 31 29 2021/2022 1143 1115 398 638 41 22 16
Figure 12 � Permit Approvals over the past six financial years
Demolition, and other miscellaneous permit approvals over the past six financial years
�
In the 2021/2022 financial year there were 1,115 building approvals compared with 1420 in the 2020/21 financial year T his is a 22% decrease compared with the previous financial year
The total value of the 1115 Permits issued for the year was $217,874,756 which is an increase in building value of $42,992,771 or approximately 20% increase in building value than last financial year, this is despite 305 fewer applications being approved� T he average value per building permit was $198,673 compared with $125,134 last year T he average value has increased markedly due to a sharp increase in the cost of construction attributed to material and labour shortages driving up costs
�
In the Forrestfield industrial precinct had a warehouse valued at $24,750,000 approved and two other warehouses close by approved with an average value of $14,254,605
St atute requires that a local authority approves applications for Certified and Demolition Permits within 10 working days, and Uncertified applications within 25 working days � F or the 2021/2021 year, the average approval times were:
» Certified Applications – 4 working days
» Demolition Permits – 6 working days
» Uncertified Applications – 4 working days
The number of new residences approved for the 2021/2021 Financial Year was 282 compared with 332 new residence approvals for the 2020/21 period� T his is a 15% decrease for the Financial Year over the previous year T he decrease in single houses in part could be
attributed to the Government’s COVID construction incentives and grants coming to an end, and cost blowouts at the contract stages caused by material and labour shortages
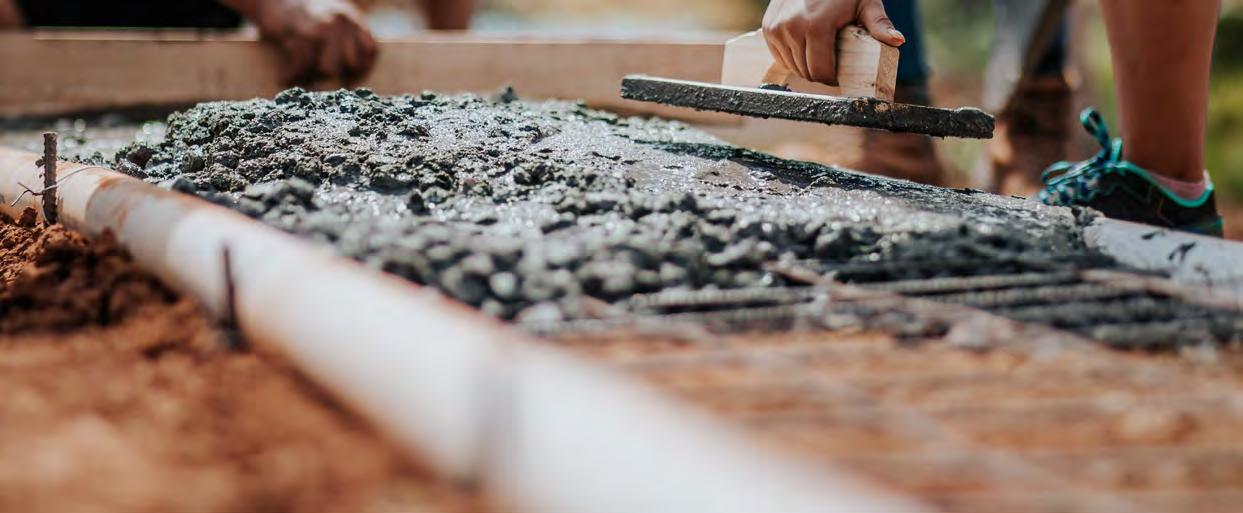
The foothills suburb of Forrestfield proved the most popular suburb for new residential development with 138 new residences compared with 198 last year which is a 30% decrease, in High Wycombe there were 25, Maida Vale 18, and Wattle Grove 34 �
In the hills, Kalamunda again showed the highest level of growth with 40 new residential dwellings compared with 44 new dwellings last year, this is a 9% decrease In Lesmurdie, the number was 8, Walliston had 7, and a further 5 residences were approved in the other hills suburbs �
41 Demolition permits were issued for the period compared with 72 the previous year, which demonstrates a level of uncertainty within the infill subdivision development market, possibly due to the tightening in borrowing, mortgage interest rates increasing, lack of trades and materials stymieing development
The decrease in building approvals is not unique to the City of Kalamunda and similar trends have been reported across the other metropolitan local government authorities � When COVID first presented itself, it was thought that there would be a dramatic downturn in building activity, however the Government created incentive schemes, State and Federal grants made available to people considering building, coupled with that people unable to travel, had created an opportunity for people to renovate their homes � T he number of minor works such as patios, retaining walls, front fencing, sheds, pools, and residential additions increased markedly� T he new subdivisions, particularly
in the Hales Residential Estate in Forrestfield, but also ones in Maida Vale and Wattle Grove continued to drive most new residential building permit applications in that short term T his all started to change in 2021 when interest rates were tipped to rise and subsequently have, adding to consumer woes was the fact that

material supply started to dry up and the demand for labour increased thus creating the perfect storm of demand exceeding supply thus forcing prices up� Several applications were cancelled because the owners simply couldn’t afford the cost blowouts
Note: On 2 April 2012 private certification came into effect paving the way for certified building applications � Certified building applications are where a private contracting building surveyor undertakes the traditional statutory compliance checking aspect of a building application� Private building surveyors may check for compliance and issue Certificates of Design Compliance (CDCs), for all types of buildings (Class 1a to Class 10b and include Classes 2 - 9) Uncertified Applications can only be made for Class 1a and Class 10 buildings � Local Authorities are only permitted to issue CDCs for uncertified applications �
The number of unlawful building works being brought to the City’s attention during the year was 22 where the property owners made application for retrospective approval, (31 in the previous year) T he Building Act 2011 makes provision for where unlawful building works have been undertaken to be formally approved through the Building Approval Certificate process
It should be noted that while application may be made for retrospective approval for unlawful works, the City can still prosecute in relation to these works, currently the penalty for a first offence is $50,000�
Only 1 Building Notice needed to be served within the year with the owners required to secure a vacated commercial property that is subject to future development
As of 30 June 2022, the City had 5810 registered private swimming pools and spas, which is 109 more pools than last year�
10 0 new pools and spa building approvals were issued during the year A number of these new pools are currently under construction due to a delay of available trades and materials, to complete the projects
�
F ormal advice and subsequent inspections identified that 71 swimming pools had been removed during the year�
The State Government legislates that all private swimming pools and spas within the local government’s boundaries must be inspected at least once every four years T he City of Kalamunda employs a full time Swimming Pool Fencing Compliance Officer who is able to inspect on average 12 properties per day�
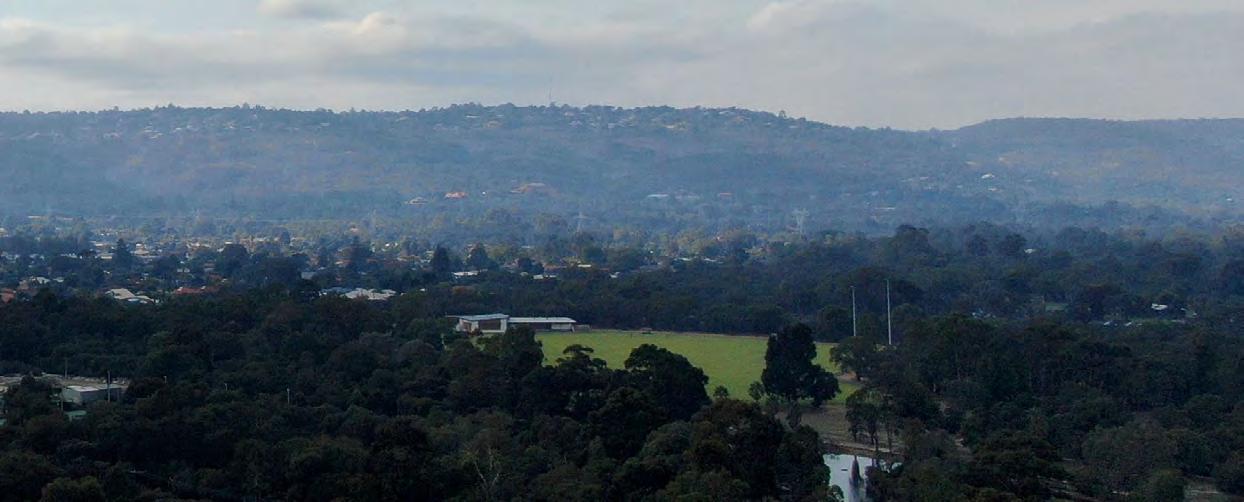
While most of our private swimming pool or spa owning community comply with the legislation, it is being found that several properties still have non-compliant security fencing or have allowed their fencing to deteriorate to the point of non-compliance Despite the inherent risks associated with non-compliant swimming pools, only 62% of pools were found to have compliant barrier fences on the first inspection
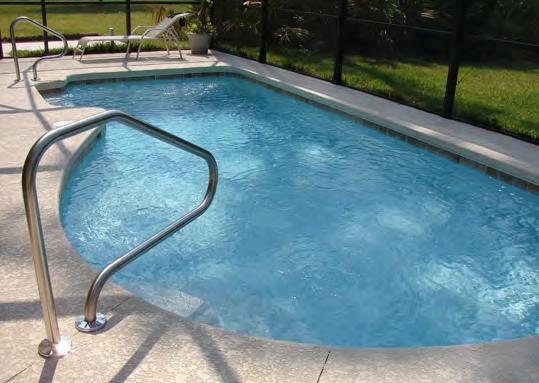
�
T he City is currently working through the level of noncompliance with landowners � Infringement Notices, which carry a modified penalty of $5,000, could have been issued where property owners are refusing to provide compliant fencing Where access to properties is not being afforded via the normal means, Entry Warrants have been obtained and acted on 41 Entry Warrants were obtained during the year to enable access to be gained to these properties
�
As of 30 June 2022, the following statistics apply:
» Total number of swimming pools and spas = 5,810
» Total non-compliant (i�e� , not yet inspected and those inspected but non-compliant), as of 30 June = 164 compared with 194 last year
» Total compliant (as per 4yrly inspection regime) = 5,590 (96 � 2%)
» Number of pools (properties) inspected from 01/07/21 to 30/06/2022 = 1,641
» Total number of pool inspections undertaken from 01/07/21 to 30/06/2022 = 2,588 (does not include try calling and leaving a card)
» Number of pools compliant on initial inspection = 1,021
» 71 pools and or spas were removed during the financial year�
» Inspections undertaken via Entry Warrant = 41
The City continued a range of ongoing asset management practices through 2021/2022 � T hese include inspections of assets to determine their condition and replacement needs, scoping for asset renewals, and recording asset details as they are constructed and replaced� B y linking the asset details and conditions to industry unit rates, the City derives asset valuations each year in accordance with accounting standards
As part of a long term plan to develop Catchment Management Plans for the six major sub-catchments in the City, the team arranged for data collection of drainage infrastructure in the Lower Helena Catchment � Pits and pipes were recorded and condition rated, enabling the City to updates its asset valuation, and also to start hydrologic modelling of the catchment T he modelling results and catchment management plan will be produced during the 2022/23 financial year�
With well established processes now in place, the City is able to respond to more complex stormwater drainage concerns � In addition to the Lower Helena Catchment work mentioned previously, the City has the ability to model and design improvements to drainage systems with the ultimate aims of reducing flooding impacts and improving water quality If you have a stormwater drainage concern that relates to roads or parks in the City, please write to us via enquiries@kalamunda wa gov au and describe the situation as well as you can, with photos and site plans � We will then have someone undertake a technical assessment and provide advice�
During 2021/2022the City investigated drainage at:
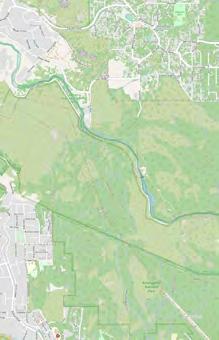
» Willoughby Road, Lesmurdie
» Ryan Way, Lesmurdie
» Gooseberry Hill Road, Gooseberry Hill
» Freeduff Drive, Wattle Grove (ongoing)


» Kenneth Road, High Wycombe
As part of our catchment management plan work, we have installed three tipping buckets and flow meters in different locations � T hese will allow us to see the relationship between rainfall and stormwater flows � Mackenzie Park, High Wycombe
At Mackenzie Park all the existing aged infrastructure was removed� T his included the limestone block work for the existing swing, small combination unit and concrete basketball pad�
A new play pit was constructed and one course of
3.2 To connect community to key centres of activity, employment and quality amenities
Ensure existing assets are maintained to meet community expectations
�
At Lower Lesmurdie Falls the existing picnic seats and tables were removed and refurbished, and a terracotta coloured footpath, 1800mm wide installed

A new picnic shelter was also installed and a disabled bay created

A 1800mm wide concrete footpath was installed to provide accessibility for all users
A new swing and combination unit and shelter, seating and fitness equipment were new additions to the park
� Booralie Reserve, Lesmurdie
The scope of works for this project included a new 1800mm wide footpath through the park providing access to a new shelter and picnic setting, BBQ, playground equipment, drink fountain and a new basketball pad
�
Renewal of the basketball court was completed at Fennel Reserve with a new pad for a half basketball court installed, along with two basketball hoops, seating and a link to the existing footpath


�
E xtensive relocation of irrigation laterals and sprinklers were undertaken by the Irrigation Team
�
An accessible footpath through the reserve was installed to encourage residents to explore and enjoy the lake, bushland, the amenities and playground
� T he planting adjacent to the lake was removed and replaced with local native sedges, rushes and shrubs to provide habitat and a food source for the birds
�
Solar lighting has also been installed along the route of the footpath
Trees have been planted in the new median island along Hale Road
�
Species selected are compact and provide strong
aesthetic lines to create an avenue effect

Under the 2021/2022 Capex renewal program the rubber soft fall at the Hartfield Park Recreation Centre playground was replaced�

program and an additional 55 trees planted as part of the capital works program
Connaught Reserve

45 trees were planted throughout the reserve
The Maida Vale Reserve project consisted of installation of a limestone retaining wall with pedestrian access points along the length of the wall 1500mm high chainmesh fencing core drilled into the retaining wall with gates for pedestrian and ambulance access � A new footpath and entry landscaping were installed�
The existing coffee rock embankment on the edge of the oval was removed and a retaining wall was constructed along the length of the ovals, adjusting height to match existing levels A new footpath was poured between the kerb and the wall for pedestrian access
New entry landscaping was installed and a solar light to highlight the signage at night
�
Crumpet Creek
115 trees were planted to augment the existing canopy
Edinburgh Reserve had 25 planted and Jacaranda Springs 95 planted� Lincoln Reserve

Sixty trees were planted as part of the WALGA Grant

There are a few gravel roads within the City of Kalamunda that require regular regrading Currently the City has a program to inspect these gravel roads once a year and if necessary, regrade them accordingly
In some instances, the resident also requests maintenance of these gravel roads � In that case the road will be inspected and maintained as necessary�
Earlier this year Council accepted a proposal from Building Maintenance to standardise the colours of all our City owned facilities � Lesmurdie Hall and the Kalamunda Town Square Hall have been repainted in the new colours
�
During 2021/2022the draft business case on the future of aquatic facilities within the City of Kalamunda was advertised for the purpose of seeking public comment � T he draft business case, along with the results of the community engagement and recommendations, were then presented to Council in April 2022 Council resolved to continue to advocate for funding to improve the existing Kalamunda Water Park whilst also considering the future operational impacts of a twopool model within the City�
In May 2021, a Federal funding commitment of $30 million was made towards a future aquatic facility at the High Wycombe Train Station site, matching a State Government pledge of $30 million to the project
Maintenance, repairs and repainting of “The Wagon” in Kalamunda completed Fleet and
The City has procured a new Water Tanker equipped with a 14,000 litre water tank and Electric Water Cannon Fog Jet � T his truck will provide much needed support for fire fighting and fire mitigation activities for all response agencies as well as enhanced water suppression capability for City works and operations at Walliston Transfer Station
The Hartfield Park Master Plan Stage 2 – Co-location Strategy was endorsed by Council in August 2021� T he City has since been successful in attracting $620,000 in funding through the State Government Community Sporting and Recreation Facilities Funding program to leverage against a previous Federal Government commitment of $2 million T his was further supported by a Federal Government Election commitment in May 2022 of $5 �4 million, all of which will facilitate the delivery of the following Stage 2A projects within the plan:

» Co -location of Tennis and Bowls
» New AFL/Little Athletics Unisex Changerooms
» New shared Rugby League Unisex Changerooms
3.2.2 Develop improvement plans for City assets such as parks, community facilities, playgrounds to meet the changing needs of the community
» Refurbishment of existing Rugby League changerooms
» Two new Tennis courts with LED lighting
» Little Athletics Infrastructure – Two long jump pits and throwing circles for discus and shot put �
Stirk
In December 2021, the City was successful in attaining Lotterywest funding of $1 75 million for the Stirk Park Playspace and Skate Park � F ollowing Council endorsement of the concept designs in April 2022, the project progressed to the detailed design phase� T he Rotary Club of Kalamunda have also committed $75,000 to the project

�
In response to COVID, the City allocated $2 million to the development of female (unisex) changerooms across its major sporting reserves including Ray Owen Reserve, Maida Vale Reserve, Scott Reserve and Kostera Oval During the 2020/2021 financial year, the City undertook detailed project scoping, consultation with user groups and design development, cognisant of the relevant Council adopted Reserve Master Plans
Upgrades to the Pat Moran Pavilion at Kostera Oval were completed in June 2022 and have provided four new unisex changerooms at the facility and an umpire’s room
�
Sports floodlighting for the Eastern reserve was noted as a high priority during the development of the Maida Vale Reserve Master Plan� T he City was successful in receiving funding to the amount of $148,333 through the State Government Community Sporting and Recreation Facilities Funding program to assist in delivering the project
The project was further supported through a contribution from the Kalamunda United Football Club and municipal funding
�
The project was completed in May 2022 and provides new LED lighting across the eastern reserve at both 50 and 100 lux levels
Planning for the implementation of the Ray Owen Master Plan has continued throughout this financial year with the following projects progressing:
» St age 1 of the car park was funded and delivered during the 21/22 financial year� T he car park provides an additional 150 parking bays, a drop off turning point and accessible parking bays
�
» Investigations and design processes continue as part of the planning for the following projects which received funding support of $5 million to deliver:
» Oval Expansion and alignment
» Oval floodlighting
» Provision of water source to site
The City has continued to advocate for funding for the future implementation of the court extension and further stages of the Car Park project
�
The access way to Maida Vale Road, off Ridge Hill Road was below the City’s standard and required an upgrade T he upgrade was completed in conjunction with the retaining wall and new footpath along the reserve side of the access way�
This was stage two of the project, linking stage one to the existing drainage system to mitigate the flooding of Marri Crescent residents in Lesmurdie On completion of this project all rainwater from Marri Crescent, a small portion of Gladys Road and Basildon Road will be entering the drainage system through various inlets and eventually discharges into the existing open drain at the Eastern side of Welshpool Road East
�
Through 2021/2022the City continued to liaise closely with Main Roads WA, and their appointed contractor Greater Connect Alliance, for the planning and design of the Great Eastern Highway Bypass Interchanges (GEHBI) project � T his large scale project includes:
» The upgrade of Adelaide Street, west of Stirling, to an industrial standard road that connects to Abernethy Road and provides for trucks up to Restricted Access Vehicle (RAV, aka road trains) and also specialised Over Size Over Mass vehicles

�
» The upgrade of the Stirling Crescent and Adelaide Street intersection to a roundabout � T he roundabout design will provide for road trains and OSOM to access the north and west, but limit traffic to the south and east to normal truck sized vehicles only�
» The upgrade of Abernethy Road, from Ollie Worrell Reserve, including the intersection of Kalamunda Road, and north all the way to the Great Eastern Highway T his will provide two lanes each way and provide for road trains
» A new intersection where Adelaide Street meets Abernethy Road with a roundabout
» The upgrade of the Kalamunda Road rail bridge, west of Abernethy Road T his project is being managed by Main Roads WA
A s the manager of local roads, the City seeks to raise the standard of safety for people working in the road and in the road reserve� We do this by providing free assessment and approvals of Traffic Management Plans (TMP)�
The City’s Economic Development Strategy is committed to promoting sustainable economic growth and has four major priorities:
1 Industry Expansion and Attraction 2 Business Capacity Building 3 � Strong Local Identity
4 � Welcoming Environment
The City continues to actively participate in regional networks with the Inland Freight and Logistics Hub
Member Councils (Link WA) on collaborative projects to facilitate industry expansion and attraction� Link WA is a collaborative working group comprising the cities of Canning, Belmont, Swan and Kalamunda � T hey work together for the promotion, advancement and development of the Inland Freight and Logistics Hub and Corridor recognising that the freight and logistics industry is a major economic driver T he Alliance have recently worked on an Investment Prospectus for the region, which will aim to attract and invigorate the freight and logistics industry for the area � T he Planning Departments of the member Local Governments continue to work together to develop a planning harmonisation framework �
advocate
3.3 To develop and enhance the City’s economy
Works commenced in early January 2022 to transform Central Mall into its pedestrian focussed shared space in line with the Kalamunda Activity Centre Master plan adopted by Council�
BOS Civil Construction were awarded a $2 �4m contract to create a new ‘door to door’ streetscape where
pedestrians and vehicles share the space�
Outdoor dining areas, casual seating and landscaped spaces feature heavily in the works as well as new energy efficient street lighting and canopy structures
It is expected that works will be completed in early September 2022
�
The City maintains an excellent working relationship with the Kalamunda Chamber of Commerce and continues to support the Farmers and Night Markets, the Annual Kalamunda Business Awards, industry events, training opportunities and networking � A s a small business friendly local government, the City’s collaboration assists in building business capacity� Also
gain feedback from local business owners

The City’s Economic Development Advisory Committee has worked throughout the year on the production of an Investment Prospectus which will help to guide new investors to the region
�
The Kalamunda Activity Centre Plan (KACP) outlines the 10-year vision for the development of the town centre and provides a planning framework to coordinate the future subdivision, zoning and development in the area
Following ta comprehensive public consultation process, the Plan was finalised and presented to Council at the 24 March 2020 Ordinary Council Meeting � At this meeting, Council endorsed the Kalamunda Activity Centre Plan, subject to a number of
modifications to address submissions received during advertising �
The KACP was referred to the WAPC in April 2020 for final endorsement � T he KACP remains with the WAPC awaiting endorsement �
The City is also required to progress Amendment 106 to the Local Planning Scheme No 3 (LPS 3) to ensure the KACP and LPS 3 Provisions are aligned, and to give full statutory effect � Amendment 106 seeks to introduce a new Centre zone and objectives, rezone the area affected by the draft KACP to the Centre zone, delete
the existing Special Control Area provisions relating to the Kalamunda Town Centre Design Control area, and rationalise the existing Additional Uses, Special Uses and Restricted Uses contained within the amendment area

Amendment 106 was initiated by the Council in
November 2020� Consent to advertise was granted in August 2021 and advertising occurred between November and January 2022 � In May 2022, the Council considered submissions and adopted the final Amendment 106 document for referral to the WAPC and for approval of the Minister for Planning
The Perth Hills regions continue to grow in popularity as a must see destination a short drive from the City Tourism is a critical industry in the Perth Hills and the City of Kalamunda owned and operated Perth Hills Visitor Centre has seen a resurgence of interest in the region
�
Key regional partnerships continue to be the mainstay of growth within the region, with the Perth Hills Tourism Alliance working to ensure the Perth Hills are recognised as a major regional tourism precinct T he Experience Perth Hills brand which commenced in the City of Kalamunda has been shared across the region, stretching from Gidgegannup to Mundaring, Armadale and Serpentine Jarrahdale to create a cohesive easily recognised brand for the Perth Hills region � Pivotal during this year has been the creation of a new regional Experience Perth Hills website which is the focus for the Perth Hills Tourism Alliance marketing and the cornerstone for all current and future regional tourism promotion
Key promotions during the year have included Nova Radio advertisements highlighting the Perth Hills – “it’s closer than you think”� Perth Now digital immersive feature on “The Hills are Alive” daytrip ideas � Soft
Adventure InstaMeet and PerthisOK articles and stories With a strong social media following the Perth Hills story continues to grow and look at innovative ways to garner more visitors to the region�
The City of Kalamunda works with the Kalamunda Tourism Advisory Committee to realise the Kalamunda Tourism Development Strategy as a living document � T he City is passionate about uncovering the region’s hidden and obvious potential and supporting the private sector to play their part in this growth through streamlining of statutory processes and business support � Our approach is two-fold in delivering highquality customer service and value at our direct tourism products and secondly driving forward the growth of the local tourism industry through support, advocacy and destination marketing �
The Kalamunda History Village continues to garner huge interest from both visitors to the region and the schools who participate in the education programme T he education programme is fully booked each year and receives excellent accolades from the schools who recognise the worth of a hands on experience� Many students return to the Village at a later date with their families �
3.4 To be recognised as a preferred

The City represented and provided submissions on the Project Working Group for the Pickering Brook and Surrounds Sustainability and Tourism Strategy Taskforce and advocated in the interests of the City’s residents and landowners �
The Working Group guided the preparation of the Strategy report titled “Part 2 - Facilitating Sustainable Economic Opportunities” which was released for community engagement in February 2022 T he report focuses on challenges and prospects to facilitating future viability and growth of the tourism and agriculture industries, and discusses the opportunity for appropriately scale agritourism and ecotourism
business ventures, that will provide options for landowners to diversify their businesses and introduce additional income streams �
The vision, strategic objectives and 24 actions presented in the report will provide strategic direction for government agencies and organisations, including the City, to implement over the next 5 years
T here are 19 priority recommendations that could be initiated within 12 – 18 months of the final Strategy’s release� T he remaining recommendations are to be considered for inclusion in future business programs over a longer period, within five years after the release of the Strategy� T he recommendations and actions are subject to funding approval by State and local government �
The City is firmly committed to organization-wide riskmanagement practices to ensure consistent, efficient and effective assessment and management of risks in decision making � T he City has recently undertaken a review of its Risk Appetite Statement resulting in an overall risk appetite as “risk averse ” During the year, the City held workshops with elected members to reassess the City’s strategic risks
The City continues to focus on the integration of risk management into its business practices to ensure that we make informed decisions in terms of strategies and operations ensuring that risks and opportunities are adequately considered� A s the City’s Risk Management practices mature, improvements in the internal reporting and management of risks will occur
The City’s Risk Management Framework (shown below) is structured around the Australian Standard for Risk Management (AS/NZ/ISO 31000:2018) which is strongly focused on:
» Maintaining high levels of integrity for services provided by the City
» Protecting the City’s physical and non-physical assets including employees, elected members, financial information and property
» Achieving and maintaining legislative and regulatory compliance, including codes of conduct and professional standards
» Creating an environment where all employees assume responsibility for the proactive management of risk, and
» Demonstrating transparent and responsible risk management processes aligned to accepted best practice to address uncertainty and to deliver continuous improvement
�
The City’s Audit and Risk Committee undertakes a six-monthly review of the Strategic Risk Register and reviews the City’s Internal Audit Plan on an annual basis
Every two years the City measures employee engagement by surveying employees based on a series of benchmarked questions through a thirdparty contractor T he survey provides the City with valuable information on employee satisfaction, areas of opportunity to improve (employee priorities) and whether they would recommend the City as a place to work (Net Promoter Score)�
With historically low unemployment levels, there is significant competition attracting trained, experienced, and quality employees All organisations are experiencing staff turnover, so we are very pleased to see a response of 98% of staff rating the organisation positively as a place to work �
F or the past three years, the City has developed and delivered a unique in-house training program called “GROW”� Training sessions are created and delivered by our own staff in a host of subjects relevant to working at the City as well as more diverse subjects that help build employee resilience and increase wellbeing T he
program was specifically designed to create a sense of capability amongst City staff to create a highly motivated, customer focused and team centric can-do culture T he City’s GROW program incorporates all our development and cultural change training � In a nutshell all the things we do to make the City a great place to work and assist our team to be the best they can be� GROW programs and initiatives are based on our Core Values of Service, Professionalism and Quality as well as our Aspirational Values of Courage, Diversity, and Innovation
In 2021/2022, we delivered over 35 training sessions with a total attendance of 482 staff F eedback is extremely positive with staff saying things like “Some of these sessions are as good or better than externally purchased courses � Having an internal subject matter expert present these courses has benefits beyond education: it also establishes a channel to a helpful person inside the City” and “good experience for staff to become trainers”
The City has continued to engage with the community in a myriad of different and innovative ways F or example, on 23 November 2021, the City of Kalamunda selected BOS Civil to redevelop the Central Mall A key challenge for the project was to maintain access and exposure for the many businesses that operate in and around the Central Mall during construction�
To overcome this challenge, the City continued to engage with the community in a variety of formats to prepare them for construction and work collaboratively to overcome impediments to commercial activity F eedback was sought on the draft Concept Plan for the space through two face-to-face workshops and one online workshop including a presentation by
PLACE Laboratory to explain the concept design in more detail F or those who were unable to attend the workshops, opportunity was provided to submit feedback through an online survey Pop up stalls were held in Kalamunda Central and the Kalamunda Farmer’s Market, and a communications campaign was delivered across the City’s several platforms, including the City’s online engagement portal, Facebook and Instagram, email campaigns and digital newsletters, and print advertising in the ECHO�
The City of Kalamunda continued to have significant engagement in online platforms The following showcases statistics relating to the City of Kalamunda website and social media
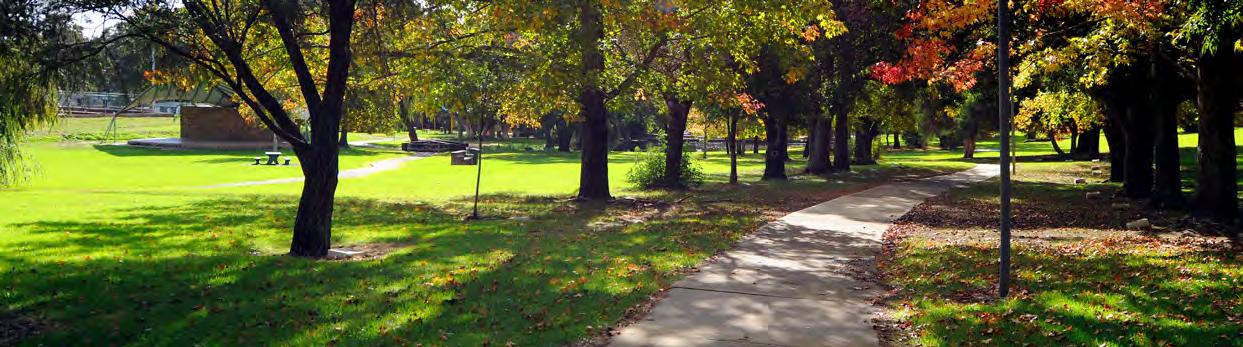


Numerous partnerships have been formed with organisations, community groups and volunteers in the community, including the Darling Range Hub, The Forget-Me-Not-Memory Café, Fount of Life Sanctuary Inc, Hillview Lifestyle Village, Building Friendships, Home Instead, Wanslea and Relationships Australia (WA Branch)�
The City of Kalamunda have partnered with Inclusion Solutions to deliver the Kalamunda WayFairer Project between 2019 and 2024, an initiative designed to meet the growing needs of older adults, while simultaneously supporting clubs, groups, and community-based organisations with skilled volunteers �
make their way through a series of workshops, mentor sessions and pitches to develop their idea for a business into an achievable product or service T he three finalists received a share in $2,500 prize money provided by Hawaiian’s Forrestfield�
The City was successful in receiving funding from the Department of Health to establish a Compassionate Communities program in the City of Kalamunda focusing on End-of-Life awareness and support, in partnership with Kalamunda Hospital Palliative Care Unit and the Darling Range Hub� T his program will include an Artist in Residence to capture local stories and experiences, a forum, a collaborative art project and the establishment of a community working group by the end of 2024 �
The City of Kalamunda partnered with Injury Matters and the Shire of Mundaring to host a ‘Remove Hazards Safe-Tea Fair’, a free community event and afternoon tea P articipants learned about preventing falls, making their home safer, foot and eye health, and featured guest speakers from allied health professionals
�

The free SEED Young Entrepreneurs Program was launched in partnership with the Kalamunda Chamber of Commerce (KCC) and Hawaiian’s Forrestfield� A year long program saw young aspiring entrepreneurs
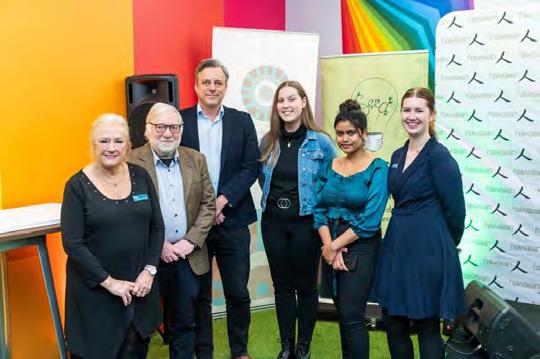
The City of Kalamunda, in partnership with Lifeline and Meerilinga, conducted a ‘Domestic Violence Aware’ workshop Community members discovered ways to recognise the various warning signs, which indicate the possibility of domestic violence and what they can do to help make a difference� Resources on seeking help and a list of support agencies in the community were
4.2.2 Increase advocacy activities and develop partnerships to support growth and reputation.
distributed to all attendees

Youth Services assisted the Public Transport Authority and the Right Track Program to install the youthguided mural design and installation at the new High Wycombe Train Station Ten youth participants were involved in the initial design and participated in the installation with artist Fieldey
The City of Kalamunda is committed to the management of government records in accordance with legislative requirements and best practice standards � T he City of Kalamunda’s Record Keeping Plan was approved by the State Records Commission on the 8 April 2020, and is due for resubmission in April 2025
The Enterprise Content Management System, Altus ECM, is the official records store T he City of Kalamunda has implemented the Records component under Microsoft 365 Compliance, to ensure documents created in OneDrive, Teams and SharePoint are retained and destroyed according to the General Disposal Authority for Local Government �
The City continues to provide training to staff, including an initial Records Induction Training for all staff� Training is focused on documentation, on the responsibilities of staff regarding Record Keeping, what constitutes a Business Email, the City of Kalamunda Records Business Rules, and using the Records System Training Videos are available on the City of Kalamunda’s Intranet
The Information Statement for the City of Kalamunda was updated in 2021/2022and will be reviewed in October 2022 T he Information Statement is available on the City’s website and from the Administration Centre

There were thirty two (32) new valid Freedom of Information requests received during the 2021/2022
for how to use Altus ECM �
The City of Kalamunda uses Litmos as its Learning Management System, which allows for online learning, including Records Management It also allows for quizzes at the end, to reinforce learning, and ensuring there is a baseline knowledge
Risks relating to Records Management have been entered into the City’s Operational Risk System and are reported on quarterly�
Records performance is measured through the Interplan System on a quarterly basis, providing a system of monitoring of the Records Area by management and Council�
The City of Kalamunda’s Records Management program was audited by an Internal Auditor in November/ December 2021 Results of the Internal Audit were submitted to the Audit & Risk Committee on 15 March 2022
financial year� In 2021/2022, the split between personal and non personal requests was:
» 2 were for personal information
» 30 were for non-personal information
The average time taken to deal with an FOI request was 17 days


City of Kalamunda
To the Councillors of the City of Kalamunda
I have audited the financial report of the City of Kalamunda (City) which comprises: the Statement of Financial Position at 30 June 2022, the Statement of Comprehensive Income by Nature or Type, Statement of Changes in Equity, and Statement of Cash Flows and Rate Setting Statement for the year then ended

Notes comprising a summary of significant accounting policies and other explanatory information.
In my opinion, except for the effects of the matter described in the Basis for Qualified Opinion section of my report, the financial report is: based on proper accounts and records
presents fairly, in all material respects, the results of the operations of the City for the year ended 30 June 2022 and its financial position at the end of that period
in accordance with the Local Government Act 1995 (the Act) and, to the extent that they are not inconsistent with the Act, Australian Accounting Standards.
The City has not recognised 969 assets under Infrastructure assets (Drains) in the financial report at 30 June 2022. These assets have been included in the City’s Asset Management System at nil values however, they were never recorded in the Fixed Assets Register and revalued to their fair value. As these assets have not been recognised in the financial report at fair value in accordance with Regulation 17A(2)(a) of the Local Government (Financial Management) Regulations 1996, I am unable to determine the extent to which InfrastructureDrains balance reported in Note 9 of the financial report at $123,730,140 as at 30 June 2022 (2021: $124,550,736) is misstated, as it is impracticable to do so. Additionally, there is a consequential impact on Depreciation, Infrastructure, Revaluation Surplus and Retained Earnings.
I conducted my audit in accordance with Australian Auditing Standards. My responsibilities under those standards are further described in the Auditor’s responsibilities for the audit of the financial report section below.
I believe that the audit evidence I have obtained is sufficient and appropriate to provide a basis for my opinion.
I draw attention to Note 34 to the financial report, which states that the amounts reported in the previously issued 30 June 2021 financial report have been restated and disclosed as comparatives in the financial report. My opinion is not modified in respect of this matter.
The Chief Executive Officer (CEO) is responsible for the preparation and the Council for overseeing the other information. The other information is the information in the entity’s annual report for the year ended 30 June 2022, but not the financial report and my auditor’s report.
My opinion on the financial report does not cover the other information and, accordingly, I do not express any form of assurance conclusion thereon.
In connection with my audit of the financial report, my responsibility is to read the other information and, in doing so, consider whether the other information is materially inconsistent with the financial report or my knowledge obtained in the audit or otherwise appears to be materially misstated.
If, based on the work I have performed, I conclude that there is a material misstatement of this other information, I am required to report that fact. I did not receive the other information prior to the date of this auditor’s report. When I do receive it, I will read it and if I conclude that there is a material misstatement in this information, I am required to communicate the matter to the CEO and Council and request them to correct the misstated information. If the misstated information is not corrected, I may need to retract this auditor’s report and re-issue an amended report.
The Chief Executive Officer of the City is responsible for: preparation and fair presentation of the financial report in accordance with the requirements of the Act, the Regulations and Australian Accounting Standards
managing internal control as required by the CEO to ensure the financial report is free from material misstatement, whether due to fraud or error.
In preparing the financial report, the CEO is responsible for:
assessing the City’s ability to continue as a going concern
disclosing, as applicable, matters related to going concern
using the going concern basis of accounting unless the State Government has made decisions affecting the continued existence of the City.
The Council is responsible for overseeing the City’s financial reporting process.
As required by the Auditor General Act 2006, my responsibility is to express an opinion on the financial report. The objectives of my audit are to obtain reasonable assurance about whether the financial report as a whole is free from material misstatement, whether due to fraud or error, and to issue an auditor’s report that includes my opinion. Reasonable assurance is a high level of assurance but is not a guarantee that an audit conducted in accordance with Australian Auditing Standards will always detect a material misstatement when it exists.

STATEMENT OF COMPREHENSIVE INCOME
BY NATURE OR TYPE
FOR THE YEAR ENDED 30 JUNE 2022 2022 2022 2021 NOTE Actual Budget Actual Restated* $ $ $
Revenue
Rates 27(a)39,925,80039,137,78438,342,129
Operating grants, subsidies and contributions 2(a) 5,131,5452,676,8284,000,703
Fees and charges 26(c),2(a) 16,832,61015,542,52216,116,365
Interest earnings 2(a) 497,523479,175622,173 Other revenue 2(a) 153,26445,60058,086 62,540,74257,881,90959,139,456
Employee costs (25,170,251)(25,962,725)(24,892,251)
Materials and contracts (23,253,381)(22,885,136)(20,233,774)
Utility charges (1,990,010)(2,017,443)(1,965,822) Depreciation 10(a)(13,764,916)(11,858,661)(13,385,719) Finance costs 2(b) (275,577)(282,193)(266,981) Insurance (677,822)(636,026)(605,809) Other expenditure 2(b) (2,847,113)(1,156,700)(308,286) (67,979,070)(64,798,884)(61,658,642) (5,438,328)(6,916,975)(2,519,186)
Capital grants, subsidies and contributions 2(a) 9,853,085 11,326,966 10,907,932 Profit on asset disposals 10(b) 69,409 0 41,699 Loss on asset disposals 10(b)(1,049,899) 0 (301,608)
Dividends Received 828,394 0 0 Share of net profit of associates accounted for using the equity method 813,318998,408627,871 10,514,30712,325,37411,275,894
Net result for the period 26(b) 5,075,9795,408,3998,756,708
Other comprehensive income for the period
Items that will not be reclassified subsequently to profit or loss Increase in fair value of other equity investments 7,994 0 5,172
Share of comprehensive income of associates and joint ventures accounted for using the equity method (47,985) 0 (779,312)
Total other comprehensive income for the period (39,991) 0 (774,140)
Total comprehensive income for the period 5,035,9885,408,3997,982,568
* Refer Note 34 for details regarding the restatement of prior period amounts. This statement is to be read in conjunction with the accompanying notes.
CITY OF KALAMUNDA
STATEMENT OF FINANCIAL POSITION AS AT 30 JUNE 2022 2022 2021 01-July-2020
NOTE Restated* Restated* $ $ $
CURRENT ASSETS
Cash and cash equivalents 3 38,697,929 32,134,446 24,196,351
Trade and other receivables 5(a) 4,036,273 4,964,395 3,795,352 Other financial assets 4(a) 13,131 3,400,131 3,394,524 Inventories 6(a) 143,554 123,756 123,249
Other assets 7(a) 304,537 394,844 303,636
TOTAL CURRENT ASSETS 43,195,424 41,017,572 31,813,112
NON-CURRENT ASSETS
Trade and other receivables 5(b) 938,284 906,090 866,115 Other financial assets 4(b) 213,955 219,093 226,335 Other assets 7(b) 0 79,331 158,663 Inventories 6(b) 386,067 386,067 386,067 Investment in associate 22(a) 29,871,503 29,106,170 29,257,611
Property, plant and equipment 8 122,430,049125,300,356120,811,550 Infrastructure 9 382,497,060375,609,062375,097,039 Right-of-use assets 11(a) 166,403 100,692 0 Intangible assets 12 0 863,385 865,958
TOTAL NON-CURRENT ASSETS 536,503,322 532,570,246 527,669,338
TOTAL ASSETS 579,698,746 573,587,818 559,482,450
CURRENT LIABILITIES
Trade and other payables 13 11,728,238 10,641,375 8,435,334 Other liabilities 14(a) 4,116,727 3,146,351 2,214,705 Lease liabilities 11(b) 65,712 44,711 0 Borrowings 15 1,229,486 1,228,737 1,027,692 Employee related provisions 16(a) 4,707,360 4,688,521 4,196,505 TOTAL CURRENT LIABILITIES 21,847,523 19,749,695 15,874,236
NON-CURRENT LIABILITIES
Other liabilities 14(b) 43,716 10,945 0 Lease liabilities 11(b) 100,611 56,071 0 Borrowings 15 7,756,176 8,785,662 6,961,299 Employee related provisions 16(b) 464,863 535,574 362,263 TOTAL NON-CURRENT LIABILITIES 8,365,366 9,388,252 7,323,562
TOTAL LIABILITIES 30,212,889 29,137,947 23,197,798
NET ASSETS 549,485,858 544,449,870 536,284,653
EQUITY
Retained surplus 230,079,984225,849,888225,890,312 Reserve accounts 30 24,357,427 23,511,544 14,531,763 Revaluation surplus 17 295,048,447295,088,438295,862,578 TOTAL EQUITY 549,485,858 544,449,870 536,284,653
* Refer Note 34 for details regarding the restatement of prior period amounts. This statement is to be read in conjunction with the accompanying notes.
CITY OF KALAMUNDA
STATEMENT OF CASH FLOWS
FOR THE YEAR ENDED 30 JUNE 2022
2022 2022 2021
NOTE Actual Budget Actual Restated* $ $ $
Receipts
Rates 40,594,398 38,757,78438,192,786
Operating grants, subsidies and contributions 6,696,574 1,281,1313,554,158
Fees and charges 12,233,139 13,875,93012,326,478
Interest received 497,523 479,175622,173
Goods and services tax received 4,599,471 3,895,6973,789,887 Other revenue 153,264 45,600908,045 64,774,36958,335,31759,393,527
Employee costs (25,147,632) (24,999,226)(24,291,286)
Materials and contracts (20,881,557) (22,984,115)(18,004,588)
Utility charges (1,990,010) (2,017,443) (1,965,822)
Finance costs (275,577) (282,193)(266,981) Insurance paid (677,822) (636,026)(605,809)
Goods and services tax paid (805,896) (663,093)(731,869) Other expenditure (2,037,631) (1,156,700)(308,286) (51,816,125)(52,738,796)(46,174,641)
Net cash provided by (used in) operating activities 18(b)12,958,2445,596,52113,218,886
Payments for purchase of property, plant & equipment 8(a) (4,419,064) (8,242,282) (9,380,684)
Payments for construction of infrastructure 9(a)(16,352,722)(22,631,576)(9,802,680) Payments for intangible assets 12 (55,820) 0 (98,969) Non-operating grants, subsidies and contributions 9,340,47111,326,96611,839,582
Proceeds from financial assets at amortised cost 3,387,717 0 0 Proceeds from financial assets at amortised cost - self supporting loans 29(a) 12,414 12,414 11,737
Distributions from investments in associates 828,394 0 0 Proceeds from sale of property, plant & equipment 10(b)1,940,718 0 158,044 Net cash provided by (used in) investing activities (5,317,891)(19,534,478)(7,272,970)
Repayment of borrowings 29(a)(1,228,737)(1,227,997)(1,027,692) Payments for principal portion of lease liabilities 29(d) (48,135) 0 (33,229) Proceeds from new borrowings 29(a)200,000200,0003,053,100 Net cash provided by (used In) financing activities (1,076,871)(1,027,997)1,992,179 Net increase (decrease) in cash held 6,563,483(14,965,954)7,938,095 Cash at beginning of year 32,134,44627,436,74224,196,351 Cash and cash equivalents at the end of the year 18(a)38,697,92912,470,78732,134,446 * Refer Note 34 for details regarding the restatement of prior period amounts. This statement is to be read in conjunction with the accompanying notes.
SETTING STATEMENT
FOR THE YEAR ENDED 30 JUNE 2022
2022 2022 2021 Actual Budget Actual NOTE Restated*
$ $ $
NET CURRENT ASSETS - At start of financial year - surplus/(deficit) 3,542,590 4,424,345 6,619,571
Revenue from operating activities (excluding general rate) Rates (excluding general rate) 27(a)215,960156,683203,306
Operating grants, subsidies and contributions 5,131,5452,676,8284,000,703
Fees and charges 16,832,61015,542,52216,116,365
Interest earnings 497,523479,175622,173 Other revenue 153,26445,60058,086
Profit on asset disposals 10(b) 69,409 0 41,699 Share of net profit of associates and joint ventures accounted for using the equity method 813,318998,408627,871 23,713,62919,899,21621,670,203
Expenditure from operating activities
Employee costs (25,170,251)(25,962,725)(24,892,251) Materials and contracts (23,253,381)(22,885,136)(20,233,774)
Utility charges (1,990,010)(2,017,443)(1,965,822) Depreciation (13,764,916)(11,858,661)(13,385,719)
Finance costs (275,577)(282,193)(266,981) Insurance (677,822)(636,026)(605,809)
Other expenditure (2,847,113)(1,156,700)(308,286)
Loss on asset disposals 10(b)(1,049,899) 0 (301,608) (69,028,969)(64,798,884)(61,960,250)
Non-cash amounts excluded from operating activities 28(a)14,693,42811,218,20113,516,581 Amount attributable to operating activities (30,621,913) (33,681,467) (26,773,466)
Non-operating grants, subsidies and contributions 9,853,08511,326,96610,907,932
Proceeds from disposal of assets 10(b)1,940,718 0 158,044
Proceeds from financial assets at amortised cost - self supporting loans 29(a) 12,414 12,414 11,737
Distributions from investments in associates 828,394 0 0
Purchase of property, plant and equipment 8(a)(4,419,064)(8,242,282)(9,380,684)
Purchase and construction of infrastructure 9(a)(16,352,722)(22,631,576)(9,802,680)
Payments for intangible assets 12 (55,820) 0 (98,969) (8,192,994)(19,534,478)(8,204,620)
Non-cash amounts excluded from investing activities 28(b)465,136 0 567,236 Amount attributable to investing activities (7,727,858) (19,534,478) (7,637,384)
Repayment of borrowings 29(a)(1,228,737)(1,227,997)(1,027,692)
Proceeds from borrowings 29(a)200,000200,0003,053,100 Payments for principal portion of lease liabilities 29(d)(48,135) 0 (33,229)
Transfers to reserves (restricted assets) 30 (12,509,710)(1,711,000)(12,470,107)
Transfers from reserves (restricted assets) 30 11,663,82812,616,0323,672,974
Amount attributable to financing activities (1,922,754) 9,877,035 (6,804,953)
Surplus/(deficit) before imposition of general rates (36,729,939) (38,914,564) (34,596,234) Total amount raised from general rates 27(a) 39,709,840 38,981,101 38,138,823 Surplus/(deficit) after imposition of general rates 28(c) 2,979,901 66,535 3,542,590
* Refer Note 34 for details regarding the restatement of prior period amounts.
This statement is to be read in conjunction with the accompanying notes.

The financial report comprises general purpose financial statements which have been prepared in accordance with the Local Government Act 1995 and accompanying regulations.
Section 6.4(2) of the Local Government Act 1995 read with the Local Government (Financial Management) Regulations 1996 prescribe that the financial report be prepared in accordance with the Local Government Act 1995 and, to the extent that they are not inconsistent with the Act, the Australian Accounting Standards. The Australian Accounting Standards (as they apply to local governments and not-for-profit entities) and Interpretations of the Australian Accounting Standards Board were applied where no inconsistencies exist.
The Local Government (Financial Management) Regulations 1996 specify that vested land is a right-of-use asset to be measured at cost, and is considered a zero cost concessionary lease. All right-of-use assets under zero cost concessionary leases are measured at zero cost rather than at fair value, except for vested improvements on concessionary land leases such as roads, buildings or other infrastructure which continue to be reported at fair value, as opposed to the vested land which is measured at zero cost. The measurement of vested improvements at fair value is a departure from AASB 16 which would have required the City to measure any vested improvements at zero cost. Accounting policies which have been adopted in the preparation of this financial report have been consistently applied unless stated otherwise. Except for cash flow and rate setting information, the financial report has been prepared on the accrual basis and is based on historical costs, modified, where applicable, by the measurement at fair value of selected non-current assets, financial assets and liabilities.
All funds through which the City controls resources to carry on its functions have been included in the financial statements forming part of this financial report.
All monies held in the Trust Fund are excluded from the financial statements. A separate statement of those appears at note 31 of the Financial Report.
The preparation of a financial report in conformity with Australian Accounting Standards requires management to make judgements, estimates and assumptions that effect the application of policies and reported amounts of assets and liabilities, income and expenses.
The estimates and associated assumptions are based on historical experience and various other factors that are believed to be reasonable under the circumstances; the results of which form the basis of making the judgements about carrying values of assets and liabilities that are not readily apparent from other sources. Actual results may differ from these estimates.
The balances, transactions and disclosures impacted by accounting estimates are as follows:
• estimated fair value of certain financial assets
• impairment of financial assets
• estimation of fair values of land and buildings, and infrastructure
• estimated useful life of Property, Plant & equipment
• estimated useful life of intangible asset
• estimation of uncertainties made in relation to lease accounting
Contracts with customers
Recognition of revenue is dependant on the source of revenue and the associated terms and conditions associated with each source of revenue and recognised as follows:
Revenue Category
Operating grants, subsidies, and contributions with customers
Fees and ChargesLicences, Registrations, Approvals
Nature of goods and services When obligations typically satisfied Payment terms
Community events, minor facilities, research, design, planning evaluation and services
Building, planning, development and animal management.
Waste management collections Kerbside collection service
Waste management entry fees Waste treatment, recycling and disposal service at disposal sites
Over time Fixed terms transfer of funds based on agreed milestones and reporting
Returns/Refunds/ Warranties Timing of revenue recognition
Contract obligation if project not complete Output method based on project milestones and/or completion date matched to performance obligations.
Single point in time Full payment prior to issue None
Over time Payment on an annual basis in advance None
Single point in time Payment in advance at gate or on normal trading terms if credit provided
None
Sale of stock Kiosk and visitor centre stock Single point in time In full in advance. Refund for faulty goods
Fees and charges for other goods and services Library fees, reinstatements and private works
Single point in time Payment in full in advance None
On payment of the licence, registration or approval.
Output method based on regular weekly and fortnightly period as proportionate to collection service
On entry to facility
Output method based on goods sold
Output method based on provision of service or completion of works
Consideration from contracts with customers is included in the transaction price.
Revenue recognised during the year under each basis of recognition by nature or types of goods or services is provided in the table below:
For the year ended 30 June 2022
Nature or type
Contracts with customers Capital grant/contributions
Statutory Requirements Other Total $ $ $ $ $
Rates 0 0 39,925,800 0 39,925,800
Operating grants, subsidies and contributions 0 0 0 5,131,5455,131,545
Fees and charges 1,630,721 0 13,145,851 2,056,03816,832,610
Interest earnings 0 0 370,852 126,672497,523
Other revenue 0 0 152,514 750 153,264
Non-operating grants, subsidies and contributions 1,306,433 4,147,797 4,398,855 0 9,853,085
Total 2,937,154 4,147,797 57,993,872 7,315,005 72,393,827
For the year ended 30 June 2021
Nature or type
Contracts with customers Capital grant/contributions
Statutory Requirements Other Total $ $ $ $ $
Rates 0 0 38,342,129 0 38,342,129
Operating grants, subsidies and contributions 0 0 0 4,000,7034,000,703
Fees and charges 1,411,644 0 12,528,297 2,176,42316,116,365
Interest earnings 0 0 461,380 160,792622,173
Other revenue 0 0 56,538 1,548 58,086
Non-operating grants, subsidies and contributions 1,208,172 7,615,745 2,084,015 0 10,907,932
Total 2,619,816 7,615,745 53,472,359 6,339,466 70,047,388
NOTES TO AND FORMING PART OF THE FINANCIAL REPORT FOR THE YEAR ENDED 30 JUNE 2022
2. REVENUE AND EXPENSES (Continued)
2022 2022 2021
Note Actual Budget Actual
(a) Revenue (Continued) $ $ $
Interest earnings
Financial assets at amortised cost - self supporting loans
4,487 3,599 5,402
Interest on reserve funds 63,789 48,000 54,850
Rates instalment and penalty interest 360,646 362,576 461,380
Other interest earnings 68,601 65,000 100,540 497,523 479,175 622,173
(b) Expenses
Auditors remuneration
- Audit of the Annual Financial Report 55,400 50,000 49,500
- Other services 34,078 80,000 10,583 89,478 130,000 60,083
Finance costs
Borrowings 29(a) 274,361 280,978 266,302
Lease liabilities 29(d) 1,216 1,215 678 275,577 282,193 266,981
Other expenditure
Other Expenditure 2,037,631 1,156,700 308,286
Initial Application of Software as a Service (SaaS) 12 809,483 0 0 2,847,113 1,156,700 308,286
3. CASH AND CASH EQUIVALENTS
Note 2022 2021 $ $
Cash at Bank and on hand 35,301,854 32,134,446
Term deposits 3,396,075 0 Total cash and cash equivalents 18(a) 38,697,929 32,134,446
Held as
- Unrestricted cash and cash equivalents
10,242,527 6,039,168
- Restricted cash and cash equivalents 18(a) 28,455,402 26,095,278 38,697,929 32,134,446
Cash and cash equivalents
Restricted financial assets
Cash and cash equivalents include cash on hand, cash at bank, Restricted financial asset balances are not available for general use deposits available on demand with banks and other short term by the local government due to externally imposed restrictions. highly liquid investments with original maturities of three months Restrictions are specified in an agreement, contract or legislation. or less that are readily convertible to known amounts of cash This applies to reserves, unspent grants, subsidies and contributions and which are subject to an insignificant risk of changes in value. and unspent loans that have not been fully expended in the manner specified by the contributor, legislation or loan agreement and for Term deposits are presented as cash equivalents if they have which no liability has been recognised. a maturity of three months or less from the date of acquisition and are repayable with 24 hours notice with no loss of interest.
Details of restrictions on financial assets can be found at Note 18.
(a)
2022 2021 $ $
Financial assets at amortised cost 13,131 3,400,131 13,131 3,400,131
Other financial assets at amortised cost
Self supporting loans (i) 13,131 12,414
Term deposits 0 3,387,717 13,131 3,400,131
Held as
- Unrestricted other financial assets at amortised cost 13,131 12,414
- Restricted other financial assets at amortised cost 18(a) 0 3,387,717 13,131 3,400,131
Financial assets at amortised cost 58,348 71,479
Financial assets at fair values through other comprehensive income 155,607 147,614 213,955 219,093
Financial assets at amortised cost Self supporting loans (i) 58,348 71,479 58,348 71,479
Financial assets at fair values through other comprehensive income Units in Local Government House Trust (ii) 155,607 147,614 155,607 147,614
An amount of money raised by the City in its own name through a specific loan for a period no longer than 10 years and provided to an approved community group or sporting club through a Self-Supporting Loan Agreement. Loans receivable from clubs/institutions have the same terms and conditions as the related borrowing disclosed in Note 29(a) as self supporting loans.
The Local Government House Trust is a unit trust created for the purpose of providing building accommodation to the Western Australian Local Government Association (WALGA).
Other financial assets at amortised cost
Financial assets at fair value through profit and loss
The City classifies financial assets at amortised cost if both of The City classifies the following financial assets at fair value the following criteria are met: through profit and loss: - the asset is held within a business model whose objective is to - debt investments which do not qualify for measurement at either collect the contractual cashflows, and amortised cost or fair value through other comprehensive income. - the contractual terms give rise to cash flows that are solely - equity investments which the City has not elected to recognise payments of principal and interest. fair value gains and losses through other comprehensive income.
Fair values of financial assets at amortised cost are not materially
Impairment and risk different to their carrying amounts, since the interest receivable
Information regarding impairment and exposure to risk can be on those assets is either close to current market rates or the found at Note 23. assets are of a short term nature. Non-current financial assets at amortised cost fair values are based on discounted cash flows using a current market rates. They are classified as level 2 fair values in the fair value hierachy (see Note 25 (i)) due to the observable market rates.
Interest received is presented under cashflows from operating activities in the Statement of Cash Flows where it is earned from financial assets that are held for cash management purposes.
CITY OF KALAMUNDA
NOTES TO AND FORMING PART OF THE FINANCIAL REPORT FOR THE YEAR ENDED 30 JUNE 2022
5. TRADE AND OTHER RECEIVABLES Note 2022 2021 $ $
(a) Current Rates receivable 2,829,521 3,628,212 Trade and other receivables 438,841 533,731 GST receivable 591,761 639,153 Receivables for employee related provisions 16 176,150 163,299 4,036,273 4,964,395
(b) Non-current Pensioner's rates and ESL deferred 938,284 906,090 938,284 906,090
Trade and other receivables
Classification and subsequent measurement Trade and other receivables include amounts due from Receivables which are generally due for settlement within ratepayers for unpaid rates and service charges and 30 days except rates receivables which are expected to be other amounts due from third parties for grants, collected within 12 months are classified as current assets. contributions, reimbursements, and goods sold and All other receivables such as, deferred pensioner rates services performed in the ordinary course of business. receivable after the end of the reporting period are classified as non-current assets.
Trade and other receivables are recognised initially at the amount of consideration that is unconditional, unless they
Trade and other receivables are held with the objective contain significant financing components, when they are to collect the contractual cashflows and therefore the City recognised at fair value. measures them subsequently at amortised cost using the effective interest rate method.
Information about the impairment of trade receivables
Due to the short term nature of current receivables, their and their exposure to credit risk and interest rate risk carrying amount is considered to be the same as their can be found in Note 23. fair value. Non-current receivables are indexed to inflation, any difference between the face value and fair value is considered immaterial.
CITY OF KALAMUNDA
NOTES TO AND FORMING PART OF THE FINANCIAL REPORT FOR THE YEAR ENDED 30 JUNE 2022
Note 2022 2021
(a) Current $ $
Fuel and materials 143,554 123,756 143,554 123,756
(b) Non-current Land held for resale Cost of acquisition 370,021 370,021 Development costs 16,046 16,046 386,067 386,067
The following movements in inventories occurred during the year:
Balance at beginning of year 509,823 509,316 Additions to inventory 19,798 507 Balance at end of year 529,621 509,823
General
Land held for resale (Continued) Inventories are measured at the lower of cost and net Borrowing costs and holding charges incurred after realisable value. development is completed are expensed.
Net realisable value is the estimated selling price in the
Gains and losses are recognised in profit or loss at ordinary course of business less the estimated costs of the time of signing an unconditional contract of sale if completion and the estimated costs necessary to make significant risks and rewards, and effective control over the sale. the land, are passed onto the buyer at this point.
Land held for resale
Land held for resale is classified as current except Land held for development and resale is valued at the where it is held as non-current based on the Council’s lower of cost and net realisable value. Cost includes the intentions to release for sale. cost of acquisition, development, borrowing costs and holding costs until completion of development.
2022 2021 $ $
(a) Current Prepayments 304,537 393,452 Accrued income 0 1,392 304,537 394,844
(b) Non-current Prepayments 0 79,331 0 79,331
Other current assets
Other non-financial assets include prepayments which represent payments in advance of receipt of goods or services or that part of expenditure made in one accounting period covering a term extending beyond that period.
CITY OF KALAMUNDA NOTES TO AND FORMING PART OF THE FINANCIAL REPORT FOR THE YEAR ENDED 30 JUNE 2022
8. PROPERTY, PLANT AND EQUIPMENT (Continued)
(b) Carrying Value Measurements
Date of Last Valuation
Basis of Valuation
Average price for square meter / sales proceeds of comparable properties.
Improvements to land using construction costs and current condition (Level 2), residual values and remaining useful life assessments (Level 3) inputs.
Improvements to building using construction costs and current condition (Level 2), residual values and remaining useful life assessments (Level 3) inputs.
June 2020
Independent registered valuer
Fair Value Hierarchy
June 2020
Independent registered valuer
Valuation Technique
Asset Class
Market approach using recent observable market data for similar assets
Improvements to land valued using cost approach using current replacement cost
Level 2
Inputs Used (i) Fair Value Land and buildings Land
June 2020
Independent registered valuer
Improvements to building valued using cost approach using current replacement cost
Level 3
Improvements to Landvested in and under the control of Council
Level 3
Buildingsspecialised
Level 3 inputs are based on assumptions with regards to future values and patterns of consumption utilising current information. If the basis of these assumptions were varied, they have the potential to result in a significantly higher or lower fair value measurement. level 2 or level 3 inputs.
During the period there were no changes in the valuation techniques used by the local government to determine the fair value of Land and Buildings using either
N/A
Not Applicable
Not Applicable
Cost
Cost
N/A
(ii) Cost Furniture and equipment
N/A Plant and equipment
N/A
CITY OF KALAMUNDA
NOTES TO AND FORMING PART OF THE FINANCIAL REPORT FOR THE YEAR ENDED 30 JUNE 2022
9. INFRASTRUCTURE (Continued)
(b) Carrying Value Measurements
Date of Last Valuation
Basis of Valuation
Observable input based on depreciation replacement cost (Level 3)
Independent valuationJune 2018
Observable input based on depreciation replacement cost (Level 3)
Independent valuationJune 2018
Observable input based on depreciation replacement cost (Level 3)
Independent valuationJune 2018
Valuation Technique
Fair Value Hierarchy
Inputs Used (i) Fair Value
Cost approach using current replacement cost
Cost approach using current replacement cost
Level 3
Cost approach using current replacement cost
Level 3
Observable input based on depreciation replacement cost (Level 3)
Independent valuationJune 2018
Observable input based on depreciation replacement cost (Level 3)
Independent valuationJune 2018
Cost approach using current replacement cost
Level 3
Cost approach using current replacement cost
Level 3
Level 3
Asset Class
InfrastructureRoads Restated*
InfrastructureFootpaths
InfrastructureDrains Restated*
InfrastructureParks and Ovals
InfrastructureOther
Level 3 inputs are based on assumptions with regards to future values and patterns of consumption utilising current information. If the basis of these assumptions were varied, they have the potential to result in a significantly higher or lower fair value measurement. During the period there were no changes in the valuation techniques used to determine the fair value of infrastructure using level 3 inputs.
CITY OF KALAMUNDA
TO AND FORMING PART
FOR THE YEAR ENDED 30 JUNE 2022
(a) Depreciation 2022 2022 2021 Note Actual Budget Actual Restated*
$ $ $
Improvements to Land - vested in and under the control of Council 8(a) 67,749 0 67,749 Buildings - specialised 8(a) 3,368,9671,791,4973,134,129 Furniture and equipment 8(a) 55,784308,35353,424 Plant and equipment 8(a) 956,196800,087797,360
Infrastructure - Roads 9(a) 4,715,3494,509,8534,657,000
Infrastructure - Footpaths 9(a) 1,021,885966,884999,861
Infrastructure - Drains 9(a) 1,466,3241,568,2091,612,557
Infrastructure - Parks and Ovals 9(a) 1,007,258964,6341,025,214
Infrastructure - Other 9(a) 947,716885,508903,564
Right-of-use assets - plant and equipment 11(a) 47,96463,63633,319 13,655,19311,858,66113,284,177
Amortisation Intangible assets - Computer software 12 109,723 0 101,542 109,723 0 101,542 13,764,916 11,858,661 13,385,719
* Refer Note 34 for details regarding the restatement of prior period amounts.
Depreciation rates
Typical estimated useful lives for the different asset classes for the current and prior years are included in the table below:
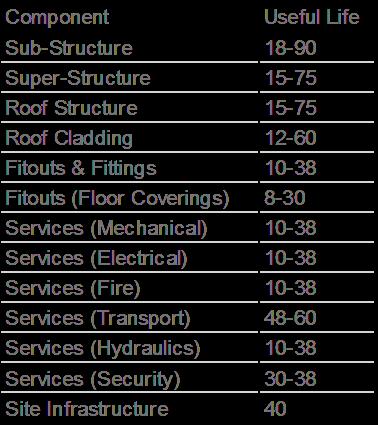
Asset Class Useful life
Furniture and equipment 5 to 10 years Plant and equipment 5 to 20 years Intangible Assets 5 years
Buildings
CITY OF KALAMUNDA
NOTES TO AND FORMING PART OF THE
FOR THE YEAR ENDED 30 JUNE 2022
Depreciation rates
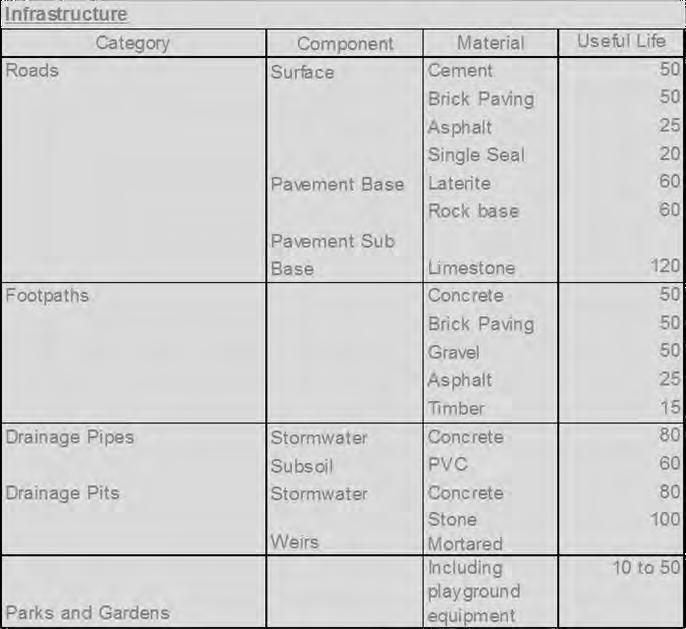
Each class of fixed assets within either property, plant and equipmentFor property, plant and equipment and infrastructure, increases in or infrastructure, is carried at cost or fair value as indicated less, the carrying amount arising on revaluation of assets are credited where applicable, any accumulated depreciation and impairment to a revaluation surplus in equity. Decreases that offset previous losses. increases of the same class of asset are recognised against revaluation surplus directly in equity. All other decreases are
Initial recognition and measurement for assets held at cost recognised in profit or loss. Subsequent increases are Plant and equipment including furniture and equipment is then recognised in profit or loss to the extent they reverse a recognised at cost on acquisition in accordance with Financial net revaluation decrease previously recognised in profit or loss Management Regulation 17A. Where acquired at no cost the asset for the same class of asset. is initially recognised at fair value. Assets held at cost are depreciated and assessed for indicators of impairment annually.
The depreciable amount of all property, plant and equipment
Initial recognition and measurement between and infrastructure, are depreciated on a straight-line mandatory revaluation dates for assets held at fair value basis over the individual asset’s useful life from the time the Assets for which the fair value as at the date of acquisition is under asset is held ready for use. Leasehold improvements are $5,000 are not recognised as an asset in accordance with depreciated over the shorter of either the unexpired period Financial Management Regulation 17A (5). These assets are of the lease or the estimated useful life of the improvements. expensed immediately.
The assets residual values and useful lives are reviewed, and Where multiple individual low value assets are purchased together adjusted if appropriate, at the end of each reporting period. as part of a larger asset or collectively forming a larger asset exceeding the threshold, the individual assets are recognised as An asset's carrying amount is written down immediately to its one asset and capitalised. recoverable amount if the asset's carrying amount is greater than its estimated recoverable amount.
In relation to this initial measurement, cost is determined as the fair value of the assets given as consideration plus costs incidental to Gains and losses on disposals are determined by the acquisition. For assets acquired at zero cost or otherwise comparing proceeds with the carrying amount. These significantly less than fair value, cost is determined as fair value at gains and losses are included in the statement of the date of acquisition. The cost of non-current assets constructed comprehensive income in the period in which they arise. by the City includes the cost of all materials used in construction, direct labour on the project and an appropriate proportion of variable Depreciation on revaluation and fixed overheads.
When an item of property, plant and equipment and infrastructure is revalued, any accumulated depreciation Individual assets that are land, buildings and infrastructure at the date of the revaluation is treated in one of the acquired between scheduled revaluation dates of the asset class following ways: in accordance with the mandatory measurement framework,
(i) The gross carrying amount is adjusted in a manner are recognised at cost and disclosed as being at fair value as that is consistent with the revaluation of the carrying management believes cost approximates fair value. amount of the asset. For example, the gross carrying They are subject to subsequent revaluation at the next revaluation in accordance amount may be restated by reference to observable with the mandatory revaluation date measurement framework. market data or it may be restated proportionately to the change in the carrying amount. The accumulated Revaluation depreciation at the date of the revaluation is adjusted The fair value of land, buildings and infrastructure to equal the difference between the gross carrying is determined at least every five years in accordance amount and the carrying amount of the asset after with the regulatory framework. This includes buildings and taking into account accumulated impairment losses; or infrastructure items which were pre-existing improvements (ii) Eliminated against the gross carrying amount of the (i.e. vested improvements) on vested land acquired by the City. asset and the net amount restated to the revalued amount of the asset.
At the end of each period the carrying amount for each asset class is reviewed and where appropriate the fair value is updated to
All intangible assets with a finite useful life, are amortised in accordance with Local Government (Financial Management) on a straight-line basis over the individual asset’s useful life Regulation 17A (2) which requires land, buildings, infrastructure, from the time the asset is held ready for use. and vested improvements to be shown at fair value.
reflect current market conditions. This process is considered to be
The residual value of intangible assets is considered to be zero and the useful life and amortisation method are reviewed at the end of each financial year.
Amortisation is included within depreciation in the Statement of Comprehensive Income and in Note 10(a).
CITY OF KALAMUNDA
NOTES TO AND FORMING PART OF THE FINANCIAL REPORT FOR THE YEAR ENDED 30 JUNE 2022
Movement in the balance of each class of right-of-use asset between the beginning and the end of the current financial year. Note
Right-of-use assets - plant and equipment
Right-of-use assets Total $ $
Balance at 1 July 2020 0 0 Additions 134,011 134,011
Depreciation (33,319) (33,319) Balance at 30 June 2021 100,692 100,692 Additions 113,676 113,676 Depreciation 10(a)(47,964) (47,964) Balance at 30 June 2022 166,403 166,403
The following amounts were recognised in the statement 2022 2021 of comprehensive income during the period in respect Actual Actual of leases where the entity is the lessee: $ $
Depreciation on right-of-use assets 10(a) 47,96433,319 Interest expense on lease liabilities 29(d) 1,216 678
Low-value asset lease payments recognised as expense 21,31562,112 Total amount recognised in the statement of comprehensive income 70,495 96,109
Total cash outflow from leases (49,350)(32,551)
(b) Lease Liabilities 29(d)
Current 65,71244,711 Non-current 100,61156,071 166,323 100,782
Secured liabilities and assets pledged as security Lease liabilities are effectively secured, as the rights to the leased assets recognised in the financial statements revert to the lessor in the event of default.
Leases
Right-of-use assets - valuation measurement
At inception of a contract, the City assesses if the contract Right-of-use assets are measured at cost. This means that contains or is a lease. A contract is, or contains, a lease if the all right-of-use assets (other than vested improvements) contract conveys the right to control the use of an identified under zero cost concessionary leases are measured at asset for a period of time in exchange for consideration. zero cost (i.e. not included in the Statement of Financial Position). The exception is vested improvements on
At the commencement date, a right-of-use asset is recognised concessionary land leases such as roads, buildings or at cost and lease liability at the present value of the lease other infrastructure which are reported at fair value. payments that are not paid at that date. The lease payments are discounted using the interest rate implicit in the lease, if that rate Refer to Note 10 under revaluation for details on the significant can be readily determined. If that rate cannot be readily accounting policies applying to vested improvements. determined, the City uses its incremental borrowing rate.
All contracts that are classified as short-term leases (i.e. a lease Right-of-use assets are depreciated over the lease term or with a term of 12 months or less) and leases of low useful life of the underlying asset, whichever is the shorter. value assets are recognised as an operating expense on a Where a lease transfers ownership of the underlying asset, straight-line basis over the term of the lease. or the cost of the right-of-use asset reflects that the City anticipates to exercise a purchase option, the Details of individual lease liabilities required by regulations specific asset is amortised over the useful life of the are provided at Note 29(d). underlying asset.
CITY OF KALAMUNDA
NOTES TO AND FORMING PART OF THE FINANCIAL REPORT FOR THE YEAR ENDED 30 JUNE 2022
2022 2021
Note Actual Actual
Intangible assets $ $
Non-current Computer software 899,852899,852
Initial Application of Software as a Service (SaaS) (232,108) 0 Less: Accumulated amortisation (667,744)(558,021) 0 341,831
Movements in balances of intangible assets during the financial year are shown as follows:
Balance at 1 July 341,831337,058
Recognition of computer software 0 106,315
Initial Application of Software as a Service (SaaS)* (232,108) 0 Amortisation of computer software 10(a)(109,723)(101,542) Balance at 30 June 0 341,831
Intangible Assets Work In Progress
Balance at 1 July 521,554528,900 Additions during the year 55,82098,969 Transfer to Intangible Assets 0 (106,315)
Initial Application of Software as a Service (SaaS)* (577,374) 0 Balance at 30 June 0 521,554
TOTAL INTANGIBLE ASSETS 0 863,385
*Total intangible assets classified as Software as a Service (SaaS) arrangement during the year is $809,483.
Software as Service (SaaS) arrangements
Changes in Accounting Policies SaaS arrangements are service contracts providing the City with the right to access the cloud provider's application software over the contract period. As such, the City does not receive a software intangible asset at the contract commencement date.
Implementation costs including cost to configure or customise the cloud provider's application software are generally recognised as operating expenses when the services are received. However, configuration and customisation costs not distinct from the SaaS access and performed by the cloud provider are recognised as a prepayment and expensed when the supplier provides access to the application software over the contract period.
The IFRS Interpretation Committee (IFRIC) has issued the agenda decisions with respect to accounting for SaaS arrangements. The agenda decision concluded that Software as a Service (SaaS) arrangements are likely to be service arrangements rather than intangible or leased assets, This is because the customer typically only has a right to receive future access to the supplier's software running on the supplier's cloud infrastructure and therefore the supplier controls the intellectual property (IP) of the underlying software code.
Management assessed all possible SaaS arrangements against IFRIC criteria and identified all intangible assts and construction in progress capital projects meeting the criteria of SaaS arrangements.
CITY OF KALAMUNDA
TO AND FORMING PART
FOR THE YEAR ENDED 30 JUNE 2022
13. TRADE AND OTHER PAYABLES 2022 2021 $ $
Current
Sundry creditors 5,830,027 5,220,111 Prepaid rates 2,366,213 2,464,112 Accrued payroll liabilities 396,625 322,134 Bonds and deposits held 2,437,146 1,866,550 Income in Advance 4,154 15,666
Public Open Space funds - received prior to 10 April 2006 151,224 156,748 Accrued interest on long term borrowings 75,416 81,531 Accrued Expenses 467,433 411,310 Retention Money 0 103,213 11,728,238 10,641,375
Financial liabilities
Trade and other payables (Continued) Financial liabilities are initially recognised at fair value The amounts are unsecured, are recognised as a when the City becomes a party to the contractual current liability and are usually paid within 30 days of provisions of the instrument. recognition. The carrying amounts of trade and other payables are considered to be the same as their fair Non-derivative financial liabilities (excluding financial values, due to their short-term nature. guarantees) are subsequently measured at amortised cost.
Prepaid rates are, until the taxable event has occurred Financial liabilities are derecognised where the related (start of the next financial year), refundable at the request obligations are discharged, cancelled or expired. The of the ratepayer. Rates received in advance are initially difference between the carrying amount of the financial recognised as a financial liability. When the taxable event liability extinguished or transferred to another party and occurs, the financial liability is extinguished and the City the fair value of the consideration paid, including the recognises revenue for the prepaid rates that have not been transfer of non-cash assets or liabilities assumed, is refunded. recognised in profit or loss.
For certain infrastructure works and hall hire, the City Trade and other payables represent liabilities for goods requires a refundable bond amount to be paid by and services provided to the City prior to the end of the the applicant. The bond amount provides security against financial year that are unpaid and arise when the City any damage to the City’s property. The amount is becomes obliged to make future payments in respect recognised as a liability until such a time as it is of the purchase of these goods and services. refunded to the applicant or is forfeited.
Trade and other payables
14. OTHER LIABILITIES Note 2022 2021 $ $
(a) Current
Liabilities under transfers to acquire or construct non-financial assets to be controlled by the City (i)
3,377,975 1,894,985
Forrestfield Industrial Area Scheme Stage 1 (ii) 738,752 1,251,366 4,116,727 3,146,351
Reconciliation of changes in capital grant/contribution liabilities
(i) Capital grants received from State and Commonwealth Government Balance at the start of the year
1,894,985 1,813,298 Net Movement during the financial year 1,482,990 81,687 Balance at the end of the year 3,377,975 1,894,985
(ii) Forrestfield Industrial Area Scheme Stage 1 30 Balance at the start of the year 1,251,366 401,407 Net Movement during the financial year (512,614) 849,959 Balance at the end of the year 738,752 1,251,366
Liabilities under transfers to acquire or construct non-financial assets to be controlled by the entity Less than 1 year 4,116,727 4,116,727
Capital grant liabilities are expected to be recognised as revenue in accordance with the following time bands:
Performance obligations in relation to capital grant/contribution liabilities are satisfied as project milestones are met or completion of construction or acquisition of the asset.
Capital grant/contribution liabilities
Forrestfield Industrial Area Scheme Stage 1 Capital grant/contribution liabilities represent the City's A reserve is established to meet the City's' reporting obligations to construct recognisable non-financial obligation under clause 6.5.16 of the City of Kalamunda assets to identified specifications to be controlled the Local Planning Scheme No. 3. The funds that were City which are yet to be satisfied. Capital grant/contribution managed under the Trust for the scheme were liabilities are recognised as revenue when the transferred to the newly established reserve on obligations in the contract are satisfied. 23rd June 2015. The reserve will be maintained to reflect all transactions related to the scheme for the benefit of
Non-current capital grant/contribution liabilities fair values are the scheme members. based on discounted cash flows of expected cashflows to satisfy the obligations using a current borrowing rate. They are classified as level 3 fair values in the fair value hierarchy (see Note 25(i)) due to the unobservable inputs, including own credit risk.
(b) Non-current
Deferred Salary Scheme - Employee Contribution 43,716 10,945 43,716 10,945
KALAMUNDA
2021
Secured liabilities and assets pledged as security Debentures, bank overdrafts and bank loans are secured by a floating charge over the assets of the City of Kalamunda. The City of Kalamunda has complied with the financial covenants of its borrowing facilities during the 2022 and 2021 years.
Risk
2022 | 27
Borrowing costs
Information regarding exposure to risk can where they are directly attributable to the acquisition, construction or
be found at Note 23. production of a qualifying asset. Where this is the case, they are
Details of individual borrowings required by regulations capitalised as part of the cost of the particular asset until such time
are provided at Note 29(a). as the asset is substantially ready for its intended use or sale. Fair values of borrowings are not materially different to their carrying amounts, since the interest payable on those borrowings is either close to current market rates or the borrowings are of a short term nature. Borrowings fair values are based on discounted cash flows using a current borrowing rate. They are classified as level 3 fair values in the fair value hierachy (see Note 25(i)) due to the unobservable inputs, including own credit risk.
NOTES TO AND FORMING PART OF THE FINANCIAL REPORT FOR THE YEAR ENDED 30 JUNE 2022
Employee Related Provisions
2022 2021
(a) Current provisions $ $
Employee benefit provisions
Annual Leave 2,167,4772,252,983 Long Service Leave 2,539,8832,435,538 4,707,3604,688,521
(b) Non-current provisions
Long Service Leave 464,863 535,574 464,863 535,574 5,172,223 5,224,095
Provision is made for benefits accruing to employees in respect of wages and salaries, annual leave and long service leave and associated on costs for services rendered up to the reporting date and recorded as an expense during the period the services are delivered.
Annual leave liabilities are classified as current, as there is no unconditional right to defer settlement for at least 12 months after the end of the reporting period. Assessments indicate that actual settlement of the liabilities is expected to occur as follows:
Note 2022 2021
Amounts are expected to be settled on the following basis: $ $ Less than 12 months after the reporting date 2,607,116 2,810,803 More than 12 months from reporting date 2,565,1072,413,292 5,172,223 5,224,095
Expected reimbursements of employee related provisions from other WA local governments included within other receivables 5 176,150 163,299
The City’s obligations for employees’ annual leave, long Other long-term employee benefits service leave and other employee leave entitlements are Long-term employee benefits provisions are measured at the recognised as employee related provisions in the Statement present value of the expected future payments to be made to of Financial Position. employees. Expected future payments incorporate anticipated future wage and salary levels, durations of Short-term employee benefits service and employee departures and are discounted at Provision is made for the City’s obligations for short-term rates determined by reference to market yields at the end employee benefits. Short-term employee benefits are of the reporting period on government bonds that have benefits (other than termination benefits) that are expected maturity dates that approximate the terms of the obligations. to be settled wholly before 12 months after the end of the Any remeasurements for changes in assumptions of annual reporting period in which the employees render the obligations for other long-term employee benefits are related service, including wages, salaries and sick leave. recognised in profit or loss in the periods in which the Short-term employee benefits are measured at the changes occur. (undiscounted) amounts expected to be paid when the obligation is settled.
The City’s obligations for long-term employee benefits are presented as non-current provisions in its statement of The City’s obligations for short-term employee benefits financial position, except where the City does not have an such as wages, salaries and sick leave are recognised as unconditional right to defer settlement for at least 12 months a part of current trade and other payables in the statement after the end of the reporting period, in which case the of financial position. obligations are presented as current provisions.
32,334,929
0
0
0
32,334,929
32,334,929
0
0
0
32,334,929
Revaluation surplusLandfreehold land and improvements to Landvested in and under the control of Council
0
0
0
59,896,897
59,896,897
0
0
0
59,896,897
Revaluation surplusBuildingsspecialised
0
0
0
570,669
570,669
0
0
0
59,896,897 Revaluation surplusPlant and equipment
570,669
0
0
0
1,152,900
1,152,900
0
0
0
570,669 Revaluation surplusPublic Art Works
1,152,900
0
137,084
(779,312)
0
(779,312)
0
0
200,848,340 200,848,340
916,396
89,099
0
(47,985)
0
(47,985)
0
1,152,900 Revaluation surplusInfrastructure
0
200,848,340
137,084
200,848,340 Revaluation surplusShare of other comprehensive income of investment in associate
295,088,438
5,172
(774,140)
0
5,172
(779,312)
5,172
142,443
155,609
295,048,447 295,862,578
7,994
(39,991)
0
7,994
(47,985)
7,994
147,615
147,615 295,088,438
Revaluation surplusLocal Government House Investment
Movements on revaluation of property, plant and equipment (including infrastructure) are not able to be reliably attributed to a program as the assets were revalued by class as provided for by AASB 116 Aus 40.1.
CITY OF KALAMUNDA
NOTES TO AND FORMING PART OF THE FINANCIAL REPORT FOR THE YEAR ENDED 30 JUNE 2022
For the purposes of the Statement of Cash Flows, cash includes cash and cash equivalents, net of outstanding bank overdrafts. Cash at the end of the reporting period is reconciled to the related items in the Statement of Financial Position as follows:
2022 2022 2021
Note Actual Budget Actual Restated* $ $ $
Cash and cash equivalents 3 38,697,92912,470,78732,134,446
The following classes of financial assets have restrictions imposed by regulations or other externally imposed requirements which limit or direct the purpose for which the resources may be used:
- Cash and cash equivalents 3 28,455,40210,915,40626,095,278
- Financial assets at amortised cost 4 0 0 3,387,717 28,455,40210,915,40629,482,995
The restricted financial assets are a result of the following specific purposes to which the assets may be used:
Restricted reserve accounts 3024,357,42710,915,40623,511,544 14(a)3,377,975 0 3,146,351 Unspent loans 29(c)720,000 0 2,825,100
Grants to acquire or construct recognisable non financial assets to be controlled by the City
Total restricted financial assets 28,455,402 10,915,406 29,482,995
Net result 5,075,9795,408,3998,756,708
Non-cash items:
Depreciation/amortisation 13,764,916 11,858,661 13,385,719 (Profit)/loss on sale of asset 980,490 0 259,909 Share of profits of associates (813,318)(998,408)(627,871) Adjustment to Forrestfield Industrial Area Scheme Stage 1 (512,614) 0 849,959
Changes in assets and liabilities: (Increase)/decrease in trade and other receivables 895,928 0 (1,045,715) (Increase)/decrease in other assets 169,638 0 (11,876) (Increase)/decrease in inventories (19,798)(116,139)(507)
Increase/(decrease) in trade and other payables 1,293,606(15,000)2,058,469
Increase/(decrease) in employee related provisions (51,872)963,499502,027 Increase/(decrease) in Capital grant liabilities 1,515,761(177,526)931,646
Non-operating grants, subsidies and contributions (9,340,471)(11,326,966)(11,839,582)
Net cash provided by/(used in) operating activities 12,958,2445,596,52113,218,886
Credit Standby Arrangements
Bank overdraft limit 3,000,000 3,000,000
Bank overdraft at balance date 0 0
Credit card limit 75,000 75,000
Credit card balance at balance date (2,781) (2,208)
Total amount of credit unused 3,072,219 3,072,792
30 JUNE 2022
In compliance with the Contaminated Sites Act 2003 Section 11, the City has listed the following sites to be possible sources of contamination.
- Alan Anderson Reserve
180, Lawnbrook Road, Walliston, WA, 6076
- Ledger Road Reserve 42, Ledger Road, Gooseberry Hill, WA, 6076
Lot 1879 on plan 168945, Piesse Brook, WA, 6076
- Brand Road Reserve 65, Brand Road, High Wycombe, WA, 6057 101, Brae Road, High Wycombe, WA, 6057
29, Smokebush Place, High Wycombe, WA, 6057 39, Smokebush Place, High Wycombe, WA, 6057 Road Reserve, High Wycombe, WA, 6057
Smokebush Place, High Wycombe, WA, 6057 Brand Road, High Wycombe, WA , 6057
Brae Road, High Wycombe, WA, 6057
51, Brand Road, High Wycombe, WA , 6057
- Dawson Avenue
Crown Reserve 29061, 155, Dawson Avenue, Forrestfield, WA, 6058
Crown Reserve 35618, 191, Dawson Avenue, Forrestfield, WA, 6058
- Pioneer Park
120, Dawson Avenue, Forrestfield, WA, 6058 170, Dawson Avenue, Forrestfield, WA, 6058
- Maida Vale Reserve
20, Ridge Hill Road, Maida Vale, WA, 6057
- Pistol Club Walliston Transfer Station 155, Lawnbrook Road, Walliston, WA, 6076
- Hartfield Park
199, Hale Road, Forrestfield, WA, 6058
- East Terrace
30, East Terrace, Kalamunda, WA, 6076
24, East Terrace, Kalamunda, WA, 6076
-Kalamunda
15, William Street, Kalamunda, WA, 6706
The City is in the process of conducting investigations to determine the presence and scope of contamination, assess the risk, and agree with the Department of Water and Environmental Regulation on the need and criteria of remediation of a risk based approach. The City is unable to estimate the potential costs associated with remediation of these sites. This approach is consistent with the Department of Water and Environmental Regulation Guidelines.
The City uses the funds in the Waste Avoidance and Resource Recovery reserve (Note 30) to facilitate the annual maintenance of contaminated sites and any future remediation work.
CITY OF KALAMUNDA
NOTES TO AND FORMING PART OF THE FINANCIAL REPORT FOR THE YEAR ENDED 30 JUNE 2022
2022 2021 $ $
Contracted for: - capital expenditure projects 1,430,755273,503 1,430,755273,503
Payable: - not later than one year 1,430,755273,503
At the end of each financial year the City reviews the position of its incomplete capital expenditure projects and the position of unexpended specific purpose grants. The City recognises the costs of major capital projects to be carried forward to the next financial year and transfers adequate funds to the unexpended capital works and specific purpose grants reserve. The reserve is fully cash backed and categorised under restricted cash.
CITY OF KALAMUNDA
YEAR ENDED 30 JUNE 2022
2022 2022 2021
(a) Elected Member Remuneration Note Actual Budget Actual $ $ $
Mayor
Mayor's annual allowance 63,354 63,354 63,354
Meeting attendance fees 31,149 31,149 31,149 Annual allowance for ICT expenses 3,500 3,500 2,300 Annual allowance for travel and accommodation expenses 50 50 50 98,053 98,053 96,853
Deputy Mayor's annual allowance 11,152 15,839 0
Meeting attendance fees 23,230 23,230 23,230 Annual allowance for ICT expenses 3,500 3,500 2,300
Annual allowance for travel and accommodation expenses 50 50 50 37,932 42,619 25,580
Councillor 1
Meeting attendance fees 23,230 23,230 23,230 Annual allowance for ICT expenses 3,500 3,500 2,300 Annual allowance for travel and accommodation expenses 50 50 50 26,780 26,780 25,580
Councillor 2
Meeting attendance fees 23,230 23,230 23,230
Annual allowance for ICT expenses 3,100 3,500 2,300 Annual allowance for travel and accommodation expenses 50 50 50 26,380 26,780 25,580
Councillor 3
Meeting attendance fees 23,230 23,230 23,230 Annual allowance for ICT expenses 3,500 3,500 2,300 Annual allowance for travel and accommodation expenses 50 50 50 26,780 26,780 25,580
Councillor 4
Meeting attendance fees 23,230 23,230 23,230
Annual allowance for ICT expenses 2,300 2,300 2,300 Annual allowance for travel and accommodation expenses 50 50 50 25,580 25,580 25,580
Councillor 5
Meeting attendance fees 23,230 23,230 23,230
Annual allowance for ICT expenses 2,300 2,300 2,300 Annual allowance for travel and accommodation expenses 50 50 50 25,580 25,580 25,580
Councillor 6
Meeting attendance fees 22,885 23,230 23,230
Annual allowance for ICT expenses 2,266 2,300 2,300 Annual allowance for travel and accommodation expenses 49 50 50 25,200 25,580 25,580
Councillor 7
Meeting attendance fees 23,230 23,230 23,230
Annual allowance for ICT expenses 3,500 3,500 2,300
Annual allowance for travel and accommodation expenses 50 50 50 26,780 26,780 25,580
Councillor 8
Meeting attendance fees (until October 2021) 7,399 23,230 23,230
Annual allowance for ICT expenses 733 3,500 2,300
Annual allowance for travel and accommodation expenses 16 50 50 8,147 26,780 25,580
CITY OF KALAMUNDA
NOTES TO AND FORMING PART OF THE FINANCIAL REPORT FOR THE YEAR ENDED 30 JUNE 2022
(a) Elected Member Remuneration (Continued)
Councillor 9
2022 2022 2021
Note Actual Budget Actual $ $ $
Deputy Mayor's annual allowance (until October 2021) 4,687 0 15,682
Meeting attendance fees 23,230 23,230 23,230
Annual allowance for ICT expenses 3,500 3,500 2,300 Annual allowance for travel and accommodation expenses 50 50 50 31,467 26,780 41,262
Councillor 10
Meeting attendance fees (until October 2021) 7,399 23,230 23,230
Annual allowance for ICT expenses 1,115 3,500 2,300 Annual allowance for travel and accommodation expenses 16 50 50 8,529 26,780 25,580
Councillor 11
Meeting attendance fees 16,356 0 0
Annual allowance for ICT expenses 2,385 0 0 Annual allowance for travel and accommodation expenses 34 0 0 18,776 0 0
Councillor 12
Meeting attendance fees 16,356 0 0 Annual allowance for ICT expenses 2,385 0 0 Annual allowance for travel and accommodation expenses 34 0 0 18,776 0 0 404,761 404,872 393,915
Fees, expenses and allowances to be paid or 2022 2022 2021 reimbursed to elected council members. Actual Budget Actual $ $ $
Mayor's annual allowance 63,354 63,354 63,354 Deputy Mayor's annual allowance 15,839 15,839 15,682
Meeting attendance fees 287,384 286,679 286,679 Annual allowance for ICT expenses 37,584 38,400 27,600 Annual allowance for travel and accommodation expenses 600 600 600 404,761 404,872 393,915
2022 2021
The total of compensation paid to KMP of the Actual Actual City during the year are as follows: $ $
Short-term employee benefits 870,668854,470 Post-employment benefits 86,525 80,506 Employee - other long-term benefits 369,231308,223 Council member costs 21(a) 404,761393,915 1,731,184 1,637,114
Short-term employee benefits
These amounts include all salary and fringe benefits awarded to KMP except for details in respect to fees and benefits paid to council members which may be separately found in the table above.
Post-employment benefits
These amounts are the current-year's cost of the City's superannuation contributions made during the year.
Other long-term benefits
These amounts represent annual leave and long service leave entitlements accruing during the year.
Council member costs
These amounts represent payments of member fees, expenses, allowances and reimbursements during the year.
CITY OF KALAMUNDA
NOTES TO AND FORMING PART OF
FOR THE YEAR ENDED 30 JUNE 2022
(c)
FINANCIAL
Transactions between related parties and the City are on normal commercial terms and conditions, no more favourable than those available to other parties, unless otherwise stated.
No outstanding balances or provisions for doubtful debts or guarantees exist in relation to related parties at year end.
In addition to KMP compensation above the following transactions 2022 2021 occurred with related parties: Actual Actual $ $
Purchase of goods and services 4,019,9034,138,622
Investments in associates: Net Increase/decrease in Equity in Investments in Associates 765,333 627,871 Distributions received from investments in associates 828,394 0
Amounts payable to related parties: Trade and other payables 363,286356,493
The City's main related parties are as follows:
i. Key management personnel
Any person(s) having authority and responsibility for planning, directing and controlling the activities of the entity, directly or indirectly, including any council member, are considered key management personnel.
ii. Other Related Parties
An associate person of KMP was employed by the City under normal employment terms and conditions.
Any entity that is controlled by or over which KMP, or close family members of KMP, have authority and responsibility for planning, directing and controlling the activity of the entity, directly or indirectly, are considered related parties in relation to the City.
iii.
An entity that has the power to participate in the financial and operating policy decisions of an entity, but does not have control over those policies, is an entity which holds significant influence. Significant influence may be gained by share ownership, statute or agreement.
CITY OF KALAMUNDA
NOTES TO AND FORMING PART OF THE FINANCIAL REPORT FOR THE YEAR ENDED 30 JUNE 2022
(a) Investment in associate
Set out in the table below are the associates of the City. All associates are measured using the equity method. Western Australia is the principal place of business for all associates.
% of ownership interest 2022 2021
Name of entity 2022 2021 Actual Actual $ $
Eastern Metropolitan Regional Council 17.49%15.67%29,871,50329,106,170
Total equity-accounted investments 29,871,503 29,106,170
(b) Share of Investment in Eastern Metropolitan Regional Council
The City of Kalamunda has a share in the Net Assets of the Eastern Metropolitan Regional Council (EMRC) as a member council. The EMRC provides services in waste management, resource recovery, environmental management and regional development.
The City has determined it has significant influence over the Regional Council despite holding less than 20% of the voting rights. The City has representation of Council and participates in policy-making decisions including the decisions regarding contributions and distributions.
2022 2021
Summarised statement of comprehensive income Actual Actual $ $
Revenue 42,386,21045,090,716
Interest income 521,453 824,582
Interest expense (150,740)(227,467) Depreciation (4,896,630)(6,452,174)
Profit/(loss) from continuing operations 6,006,89210,296,371 Profit/(loss) for the period 6,006,89210,296,371
Other comprehensive income 0(4,009,286) Total comprehensive income for the period 6,006,8926,287,085
Summarised statement of financial position
Cash and cash equivalents 24,378,87455,361,145
Other current assets 60,828,37336,123,596 Total current assets 85,207,24791,484,741
Non-current assets 121,339,609115,414,742 Total assets 206,546,856206,899,483
Other current liabilities 8,077,75814,439,344 Total current liabilities 8,077,75814,439,344
Other non-current liabilities 27,709,7446,707,161 Total non-current liabilities 27,709,7446,707,161
Total liabilities 35,787,50221,146,505
Net assets 170,759,354 185,752,978
Reconciliation to carrying amounts
Opening net assets 1 July 185,752,978179,465,893
Changes in members' contributions (21,000,517) 0
Profit/(Loss) for the period 6,006,89210,296,371
Other comprehensive income 0(4,009,286)
Closing net assets 1 July 170,759,354185,752,978
Carrying amount at 1 July 32,488,196 28,122,305
- Share of associates net profit/(loss) for the period 1,056,2971,613,441
- Share of associates other comprehensive income arising during the period 0(629,576)
- Movement in member contributions (3,672,990) 0
Carrying amount at 30 June (Refer to Note 22.(a)) 29,871,503 29,106,170
CITY OF KALAMUNDA
TO AND FORMING PART OF
FOR THE YEAR ENDED 30 JUNE 2022
Investments in associates
FINANCIAL
An associate is an entity over which the City has the power to participate in the financial and operating policy decisions of the investee but not control or joint control of those policies.
Investments in associates are accounted for using the equity method. The equity method of accounting, is whereby the investment is initially recognised at cost and adjusted thereafter for the post-acquisition change in the City’s share of net assets of the associate. In addition, the City’s share of the profit or loss of the associate is included in the City’s profit or loss.
This note explains the City’s exposure to financial risks and how these risks could affect the City’s future financial performance.
Risk Exposure arising from Measurement Management Market risk - interest rates Sensitivity analysis
Long term borrowings at variable rates
Utilise fixed interest rate borrowings
Credit risk Aging analysis Credit analysis
Cash and cash equivalents, trade receivables, financial assets and debt investments
Diversification of bank deposits, credit limits. Investment policy
Borrowings and other liabilities
Availability of committed credit lines and borrowing facilities
The City does not engage in transactions expressed in foreign currencies and is therefore not subject to foreign currency risk.
Financial risk management is carried out by the finance area under policies approved by the Council. The finance area identifies, evaluates and manages financial risks in close co-operation with the operating divisions. Council have approved the overall risk management policy and provide policies on specific areas such as investment policy.
Cash and cash equivalents
The City's main interest rate risk arises from cash and cash equivalents with variable interest rates, which exposes the City to cash flow interest rate risk. Short term overdraft facilities also have variable interest rates however these are repaid within 12 months, reducing the risk level to minimal.
Excess cash and cash equivalents are invested in fixed interest rate term deposits which do not expose the City to cash flow interest rate risk. Cash and cash equivalents required for working capital are held in variable interest rate accounts and non-interest bearing accounts. Carrying amounts of cash and cash equivalents at the 30 June and the weighted average interest rate across all cash and cash equivalents, term deposits, and Treasury bonds held disclosed as financial assets at amortised cost are reflected in the table below.
Weighted Average Carrying
Fixed Variable Non Interest Interest Rate Amounts Interest Rate Interest Rate Bearing % $ $ $ $ 2022
Cash and cash equivalents
0.52% 38,697,929 3,396,075 24,683,630 10,618,224 Financial assets at amortised cost - term deposits 0.36% 0 0 0 0 2021
Cash and cash equivalents 0.49% 32,134,446 0 28,107,003 4,027,443 Financial assets at amortised cost - term deposits 0.48%3,387,7173,387,717 0 0
Profit or loss is sensitive to higher/lower interest income from cash and cash equivalents as a result of changes in interest rates.
2022 2021 $ $
Impact of a 1% movement in interest rates on profit and loss and equity* 246,836 281,070
* Holding all other variables constant
Borrowings
Borrowings are subject to interest rate risk - the risk that movements in interest rates could adversely affect funding costs. The City manages this risk by borrowing long term and fixing the interest rate to the situation considered the most advantageous at the time of negotiation. The City does not consider there to be any interest rate risk in relation to borrowings. Details of interest rates applicable to each borrowing may be found at Note 29(a).
The City’s major receivables comprise rates annual charges and user fees and charges. The major risk associated with these receivables is credit risk – the risk that the debts may not be repaid. The City manages this risk by monitoring outstanding debt and employing debt recovery policies. It also encourages ratepayers to pay rates by the due date through incentives.
Credit risk on rates and annual charges is minimised by the ability of the City to recover these debts as a secured charge over the land, that is, the land can be sold to recover the debt. The City is able to charge interest on overdue rates and annual charges at higher than market rates, which further encourages payment.
The level of outstanding receivables is reported to Council monthly.
The City applies the AASB 9 simplified approach to measuring expected credit losses using a lifetime expected loss allowance for all trade receivables. To measure the expected credit losses, rates receivable are separated from other trade receivables due to the difference in payment terms and security for rates receivable.
The expected loss rates are based on the payment profiles of rates and fees and charges over a period of 36 months before 1 July 2021 or 1 July 2022 respectively and the corresponding historical losses experienced within this period. Historical credit loss rates are adjusted to reflect current and forward-looking information on macroeconomic factors such as the ability of ratepayers and residents to settle the receivables. Housing prices and unemployment rates have been identified as the most relevant factor in repayment rates, and accordingly adjustments are made to the expected credit loss rate based on these factors.
The loss allowance as at 30 June 2022 and 30 June 2021 for rates receivable was determined as follows:
Less than 1 More than 1 More than 2 More than 3 year past due year past due years past due years past due Total Note 30 June 2022
Rates receivable
1,126,449 415,593 500,070 787,409 2,829,521
Expected credit loss 0.00% 0.00% 0.00% 0.00% Gross carrying amount 0 Loss allowance 0 0 0 0 0 5
30 June 2021
Rates receivable
1,566,317 484,709 982,883 594,303 3,628,212
Expected credit loss 0.00% 0.00% 0.00% 0.00% Gross carrying amount 1,566,317 484,709 982,883 594,303 3,628,212 Loss allowance 0 0 0 0 0 5
The loss allowance as at 30 June 2022 and 30 June 2021 was determined as follows for trade receivables.
Current More than 30More than 60More than 90 days past duedays past duedays past due Total
30 June 2022
Trade and other receivables
162,964 163,015 6,965 105,896 438,841
Expected credit loss 0.03% 0.04% 0.04% 0.47% Gross carrying amount 162,964 163,015 6,965 105,896 438,841 Loss allowance 49 65 28 498 640 5
30 June 2021
Trade and other receivables
401,592 12,515 96,519 23,104 533,731
Expected credit loss 0.04% 0.05% 0.05% 0.40% Gross carrying amount 401,59212,51596,519 23,104533,731 Loss allowance 161 6 48 9 224 5
CITY OF KALAMUNDA
NOTES TO AND FORMING PART OF THE FINANCIAL REPORT FOR THE YEAR ENDED 30 JUNE 2022
Payables and borrowings Payables and borrowings are both subject to liquidity risk – that is the risk that insufficient funds may be on hand to meet payment obligations as and when they fall due. The City manages this risk by monitoring its cash flow requirements and liquidity levels and maintaining an adequate cash buffer. Payment terms can be extended and overdraft facilities drawn upon if required and disclosed in Note 18(c).
The contractual undiscounted cash flows of the City’s payables and borrowings are set out in the liquidity table below. Balances due within 12 months equal their carrying balances, as the impact of discounting is not significant.
Due Due Due Total within between after contractual Carrying 1 year 1 & 5 years 5 years cash flows values 2022 $ $ $ $ $
Trade and other payables 11,728,238 00 11,728,23811,728,238 Borrowings* 1,489,0776,566,4202,183,50910,239,00610,239,006 Lease liabilities 65,712100,611 0 166,323166,323 13,283,027 6,667,031 2,183,509 22,133,567 22,133,567
2021
Trade and other payables 10,641,375 00 10,641,37510,641,375 Borrowings 1,509,2146,780,0083,219,03211,508,25411,508,254 Lease liabilities 44,71156,071 0 100,782100,782 12,195,300 6,836,079 3,219,032 22,250,411 22,250,411
* Borrowings include the principal and interest repayments due.
There have been no significant events after the reporting period that are to be included in 2021/2022.
a) Goods and services tax (GST)
i) Fair value hierarchy
Revenues, expenses and assets are recognised net of the amount of GST, AASB 13 requires the disclosure of fair value information by level of the fair value hierarchy, except where the amount of GST incurred is not recoverable from the which categorises fair value measurement into one of three possible levels based on the lowest Australian Taxation Office (ATO). level that an input that is significant to the measurement can be categorised into as follows:
Receivables and payables are stated inclusive of GST receivable or payable. Level 1
The net amount of GST recoverable from, or payable to, the ATO is included
Measurements based on quoted prices (unadjusted) in active markets for identical assets or with receivables or payables in the statement of financial position. liabilities that the entity can access at the measurement date.
Cash flows are presented on a gross basis. The GST components of cash Level 2 flows arising from investing or financing activities which are recoverable from, Measurements based on inputs other than quoted prices included in Level 1 that are or payable to, the ATO are presented as operating cash flows. observable for the asset or liability, either directly or indirectly.
b) Current and non-current classification Level 3
The asset or liability is classified as current if it is expected to be settled
Measurements based on unobservable inputs for the asset or liability. within the next 12 months, being the City’s operational cycle. In the case of liabilities where the City does not have the unconditional right to defer
The fair values of assets and liabilities that are not traded in an active market are determined settlement beyond 12 months, such as vested long service leave, the liability using one or more valuation techniques. These valuation techniques maximise, to the extent is classified as current even if not expected to be settled within the next 12 possible, the use of observable market data. If all significant inputs required to measure fair months. Inventories held for trading are classified as current or non-current value are observable, the asset or liability is included in Level 2. If one or more significant based on the City's intentions to release for sale. inputs are not based on observable market data, the asset or liability is included in Level 3.
All figures shown in this annual financial report, other than a rate in the dollar, The City selects a valuation technique that is appropriate in the circumstances and for which are rounded to the nearest dollar. Amounts are presented in Australian Dollars. sufficient data is available to measure fair value. The availability of sufficient and relevant data primarily depends on the specific characteristics of the asset or liability being measured. The
d) Comparative figures valuation techniques selected by the City are consistent with one or more of the following Where required, comparative figures have been adjusted to conform with valuation approaches: changes in presentation for the current financial year.
When the City applies an accounting policy retrospectively, makes a Valuation techniques that use prices and other relevant information generated by market retrospective restatement or reclassifies items in its financial statements that transactions for identical or similar assets or liabilities. has a material effect on the statement of financial position, an additional (third) Statement of Financial Position as at the beginning of the preceding Income approach period in addition to the minimum comparative financial statements is Valuation techniques that convert estimated future cash flows or income and expenses into a presented. single discounted present value.
Unless otherwise stated, the budget comparative figures shown in this annual Valuation techniques that reflect the current replacement cost of the service capacity of an asset. financial report relate to the original budget estimate for the relevant item of disclosure. Each valuation technique requires inputs that reflect the assumptions that buyers and sellers would use when pricing the asset or liability, including assumptions about risks. When selecting f) Superannuation a valuation technique, the City gives priority to those techniques that maximise the use of The City contributes to a number of Superannuation Funds on behalf of observable inputs and minimise the use of unobservable inputs. Inputs that are developed using employees. All funds to which the City contributes are defined contribution market data (such as publicly available information on actual transactions) and reflect the plans. assumptions that buyers and sellers would generally use when pricing the asset or liability are considered observable, whereas inputs for which market data is not available and therefore are g) Fair value of assets and liabilities developed using the best information available about such assumptions are considered Fair value is the price that the City would receive to sell the asset or would unobservable. have to pay to transfer a liability, in an orderly (i.e. unforced) transaction between independent, knowledgeable and willing market participants at the j) Impairment of assets measurement date. In accordance with Australian Accounting Standards the City's cash generating non-specialised assets, other than inventories, are assessed at each reporting date to determine whether there As fair value is a market-based measure, the closest equivalent observable is any indication they may be impaired. market pricing information is used to determine fair value. Adjustments to market values may be made having regard to the characteristics of the Where such an indication exists, an impairment test is carried out on the asset by comparing specific asset or liability. The fair values of assets that are not traded in an the recoverable amount of the asset, being the higher of the asset's fair value less costs to sell active market are determined using one or more valuation techniques. These and value in use, to the asset's carrying amount. valuation techniques maximise, to the extent possible, the use of observable market data. Any excess of the asset's carrying amount over its recoverable amount is recognised immediately in profit or loss, unless the asset is carried at a revalued amount in accordance
To the extent possible, market information is extracted from either the with another Standard (e.g. AASB 116) whereby any impairment loss of a revalued asset is principal market for the asset or liability (i.e. the market with the greatest treated as a revaluation decrease in accordance with that other Standard. volume and level of activity for the asset or liability) or, in the absence of such a market, the most advantageous market available to the entity at the For non-cash generating specialised assets that are measured under the revaluation model, end of the reporting period (i.e. the market that maximises the receipts from such as roads, drains, public buildings and the like, no annual assessment of impairment is the sale of the asset after taking into account transaction costs and required. Rather AASB 116.31 applies and revaluations need only be made with sufficient transport costs). regularity to ensure the carrying value does not differ materially from that which would be determined using fair value at the end of the reporting period.
For non-financial assets, the fair value measurement also takes into account a market participant’s ability to use the asset in its highest and best use or k) Initial application of accounting standards to sell it to another market participant that would use the asset in its highest During the current year, no new or revised Australian Accounting Standards and Interpretations and best use. were compiled, became mandatory and were applicable to its operations.
h) Interest earnings
New accounting standards for application in future years
Interest income is calculated by applying the effective interest rate to the The following new accounting standards will have application to local government in future years: gross carrying amount of a financial asset measured at amortised cost - AASB 2020-1 Amendments to Australian Accounting Standards - Classification of except for financial assets that subsequently become credit-impaired. For Liabilities as Current or Non-current credit-impaired financial assets the effective interest rate is applied to the - AASB 2020-3 Amendments to Australian Accounting Standards - Annual Improvements net carrying amount of the financial asset (after deduction of the loss 2018-2020 and Other Amendments allowance).
- AASB 2021-2 Amendments to Australian Accounting Standards - Disclosure of Accounting Policies or Definition of Accounting Estimates - AASB 2021-7 Amendments to Australian Accounting Standards – Effective Date of Amendments to AASB 10 and AASB 128 and Editorial Corrections
It is not expected these standards will have an impact on the financial report.
NOTES TO AND FORMING PART OF THE FINANCIAL REPORT FOR THE YEAR ENDED 30 JUNE 2022
City operations as disclosed in this financial report encompass the following service orientated functions and activities.
GOVERNANCE
To provide a decision making process for the efficient allocation of scarce resources.
To collect revenue to allow for the provision of services.
To provide services to help ensure a safer and environmentally conscious community.
To provide an operational framework for environmental and community health.
To provide services to disadvantaged persons, the elderly, children and youth.
Includes the activities of members of council and the administrative support available to the council for the provision of governance of the district. Other costs relate to the task of assisting elected members and ratepayers on matters which do not concern specific council services.
Rates, general purpose government grants and interest revenue.
Supervision and enforcement of various local laws relating to fire prevention, animal control and other aspects of public safety including emergency services.
Inspection of food outlets and their control, provision of meat inspection services, noise control and waste disposal compliance.
Provision and maintenance of senior citizen and disability services, youth services and other voluntary services.
To provide services required by the community. Rubbish collection services, operation of rubbish disposal sites, litter control, construction and maintenance of urban storm water drains, protection of the environment and administration of town planning schemes and public conveniences.
To establish and effectively manage infrastructure and resource which will help the social well being of the community.
To provide safe, effective and efficient transport services to the community.
To help promote the City and its economic wellbeing.
To monitor and control council’s overheads operating accounts.
Maintenance of public halls, civic centres, aquatic centre, recreation centres and various sporting facilities. Provision and maintenance of parks, gardens and playgrounds. Operation of library, museum and other cultural facilities.
Construction and maintenance of roads, footpaths, bridges, lighting and cleaning of streets.
Tourism and area promotion, rural services and building control.
Private works operation, plant repair and operation costs and engineering operation costs.
CITY OF KALAMUNDA
TO AND FORMING PART
THE FINANCIAL
FOR THE YEAR ENDED 30 JUNE 2022
(b) Income and expenses 2022 2022 2021 Actual Budget Actual $ $ $
Income excluding grants, subsidies and contributions
General purpose funding 40,647,77739,810,36039,019,789 Law, order, public safety 371,349311,330348,955 Health 900,445635,617903,027 Education and welfare 53,024 27,50051,766 Community amenities 13,554,14513,036,33012,925,176 Recreation and culture 1,268,967962,7651,189,424 Transport 9,585 10,00011,661
Economic services 433,526209,080434,751 Other property and services 1,881,4991,200,507923,774 59,120,318 56,203,48955,808,323
Grants, subsidies and contributions
Governance 18,513 0 30
General purpose funding 3,377,9241,160,6622,461,805 Law, order, public safety 452,126197,169180,644 Health 4,590 0 1,392 Education and welfare 28,427 3,250 5,707 Community amenities 551,802685,25070,476 Recreation and culture 2,039,6431,551,3766,363,200 Transport 3,387,8706,647,4573,167,441 Economic services 25,000 0 0 Other property and services 5,098,7353,758,6302,657,940 14,984,630 14,003,79414,908,635
Total Income 74,104,948 70,207,28370,716,958
Governance (3,212,526)(3,037,893)(3,065,048) General purpose funding (760,372)(679,300)(670,319) Law, order, public safety (2,150,697)(2,185,295)(2,222,439) Health (1,740,952)(1,842,687)(1,653,135)
Education and welfare (352,371)(363,808)(351,869) Community amenities (16,209,597)(16,864,816)(15,274,397) Recreation and culture (22,164,727)(19,912,676)(20,590,203) Transport (14,228,029)(13,843,756)(13,457,723) Economic services (1,176,192)(1,274,380)(1,331,667) Other property and services (7,033,507)(4,794,274)(3,343,449) Total expenses (69,028,969) (64,798,884)(61,960,250)
Net result for the period 5,075,979 5,408,399 8,756,708
CITY OF KALAMUNDA
NOTES TO AND FORMING PART OF THE FINANCIAL
FOR THE YEAR ENDED 30 JUNE 2022
2022 2022 2021 Actual Budget Actual
(c) Fees and Charges $ $ $
Governance
General purpose funding 228,940197,00060,890 Law, order, public safety 305,686271,330295,736 Health 898,595635,017900,727 Education and welfare 53,025 27,50051,766 Community amenities 13,469,14513,036,33012,925,176 Recreation and culture 1,268,967962,7651,189,423 Transport 9,585 10,00012,136 Economic services 433,526204,080433,731
Other property and services 165,142198,500246,780 16,832,610 15,542,52216,116,365
2022 2021 Actual Actual Restated*
(d) Total Assets $ $
Governance 8,674,652 8,673,974
General purpose funding 19,328,949 18,163,767 Law, order, public safety 1,353,248 1,380,233 Health 3,454,312 3,166,906 Education and welfare 2,743,831 2,755,031 Community amenities 43,550,583 42,331,605 Recreation and culture 102,728,717 105,921,884 Transport 386,421,413 380,876,840 Economic services 2,425 2,425 Other property and services 11,440,616 10,315,154 579,698,746 573,587,818
* Refer Note 34 for details regarding the restatement of prior period amounts.
NOTES TO AND FORMING PART OF THE FINANCIAL REPORT FOR THE YEAR ENDED 30 JUNE 2022
No Specified area rates were imposed by the City during the year ended 30 June 2022.
No service charges were imposed by the City during the year ended 30 June 2022.
(e) Discounts, Incentives, Concessions, & Write-offs
The City did not offer any rates discounts or incentives for the year ended 30 June 2022.
The City did not offer any waivers or concessions for the year ended 30th June 2022.
CITY OF KALAMUNDA
NOTES TO AND FORMING PART OF THE FINANCIAL REPORT FOR THE YEAR ENDED 30 JUNE 2022
Instalment Instalment Unpaid Rates Date Plan Plan Interest Instalment Options Due Admin Charge Interest Rate Rate $ % %
Option One
Single full payment 26 August 2021 0 0.0% 7.0%
Option Two
First instalment 26 August 2021 0 5.5% 7.0%
Second instalment 29 December 2021 8 5.5% 7.0%
Option Three
First instalment 26 August 2021 0 5.5% 7.0%
Second instalment 27 October 2021 8 5.5% 7.0%
Third instalment 29 December 2021 8 5.5% 7.0%
Fourth instalment 02 March 2022 8 5.5% 7.0%
2022 2022 2021 Actual Budget Actual $ $ $
Interest on unpaid rates 210,578201,151300,082 Interest on instalment plan 150,068161,425161,298 Instalment plan admin charge revenue 127,320140,000 0 487,966 502,576 461,380
28. RATE SETTING STATEMENT INFORMATION
2021/22 2021/22 Budget 2021/222020/21 (30 June 2022 (30 June 2022(1 July 2021(30 June 2021 Carried Carried Brought Carried Note Forward) Forward)Forward) Forward $ $ $ $
(a) Non-cash amounts excluded from operating activities
The following non-cash revenue or expenditure has been excluded from amounts attributable to operating activities within the Rate Setting Statement in accordance with Financial Management Regulation 32.
Adjustments to operating activities
Less: Profit on asset disposals 10(b)(69,409) 0 (41,699)(41,699)
Less: Share of net profit of associates and joint ventures accounted for using the equity method (813,318) (998,408) (627,871) (627,871)
Add: Loss on disposal of assets 10(b)1,049,899 0 301,608301,608
Add: Depreciation 10(a)13,764,91611,858,66113,385,71913,385,719
Add: Initial Application of Software as a Service (SaaS) 12 809,483 0 0 0
Pensioner deferred rates (32,194)(20,000)(39,975)(39,975)
Employee benefit provisions (53,302)377,948502,027502,027
Other Liabilities 32,771 0 10,94510,945
Add: Bad debts written off 4,582 0 25,82725,827 Non-cash amounts excluded from operating activities 14,693,42811,218,20113,516,58113,516,581
(b) Non-cash amounts excluded from investing activities
The following non-cash revenue or expenditure has been excluded from amounts attributable to investing activities within the Rate Setting Statement in accordance with Financial Management Regulation 32.
Adjustments to investing activities
Movement in non-current capital grant/contribution liability 434,979 0 310,858 310,858
Capital WIP transferred to expenses 30,157 0 256,378 256,378 Non-cash amounts excluded from investing activities 465,136 0 567,236567,236
(c) Surplus/(deficit) after imposition of general rates
The following current assets and liabilities have been excluded from the net current assets used in the Rate Setting Statement in accordance with Financial Management Regulation 32 to agree to the surplus/(deficit) after imposition of general rates.
Adjustments to net current assets
Less: Reserve accounts 30 (24,357,427)(10,915,406)(23,511,544)(23,511,544)
Less: Financial assets at amortised cost - self supporting loans 4(a) (13,131)(13,130)(12,414)(12,414)
Add: Current liabilities not expected to be cleared at end of year
- Current portion of borrowings 15 1,229,4861,212,5441,228,7371,228,737
- Current portion of lease liabilities 11(b)65,712 0 44,71144,711
- Employee benefit provisions 4,707,3604,400,0004,525,2214,525,221
Total adjustments to net current assets (18,368,000) (5,315,992) (17,725,289) (17,725,289)
Net current assets used in the Rate Setting Statement
Total current assets 43,195,424 21,631,165 41,017,572 41,017,572
Less: Total current liabilities (21,847,523)(16,248,638)(19,749,695)(19,749,695)
Less: Total adjustments to net current assets (18,368,000)(5,315,992)(17,725,289)(17,725,289)
Net current assets used in the Rate Setting Statement 2,979,901 66,535 3,542,590 3,542,590
Budget
Principal Repayments During 2021-22
New Leases During 2021-22
Principal at 1 July 2021
Principal Repayments During 2021-22 Principal at 30 June 2022
New Leases During 2021-22
Principal Repayments During 2020-21 Principal at 30 June 2021
New Leases During 2020-21
$
$
$
$
$
$
$
$
$
$
Principal at 30 June 2022 $
Principal at 1 July 2020
(33,229)
0
100,782
56,196
(44,586)
0
100,782
(33,229)
CITY OF KALAMUNDA NOTES TO AND FORMING PART OF THE FINANCIAL REPORT FOR THE YEAR ENDED 30 JUNE 2022 29. BORROWING AND LEASE LIABILITIES (Continued) (d) Lease Liabilities Purpose
Note
Photocopiers and printers lease
134,011
0
189,146
(3,549)
125,142
(36,778)
0
125,142
100,782
Actual for year ending 30 June 2021
110,127
166,323
(3,549)
113,676
(48,135)
Budget for year ending 30 June 2022
Actual for year ending 30 June 2022
113,676
0
100,782
0
(33,229)
0
67,553 Cardio Equipment lease
134,011
0
0
11(b)
121,593 Total Lease Liabilities
Interest Rate
$
Institution
$
Lease Term $
Lease Number
Function and activity
Note
Lease Interest Repayments Purpose
(678)
0
(593)
(593)
0.74%
Vestone Capital PTY Limited
COK011020
(622)
(1,215)
Actual | 52
(622)
3.95%
3 years Cardio Equipment lease
MAIA Financial PTY Limited
E6TEC63872
(1,216)
(678) Other property and services Recreation and culture
2(b)
5 years Total Interest Repayments
CITY OF KALAMUNDA NOTES TO AND FORMING PART OF THE FINANCIAL REPORT FOR THE YEAR ENDED 30 JUNE 2022
2021
2021
2021
2021
2022
2022
2022
2022
2022
2022
2022
2022
Actual
Actual
Net Transfers from Trust Accounts
Actual
Actual
Budget
Budget
Budget
Budget
Actual
Actual
2021 Actual
Actual
Transfer (from)
Transfer to
Opening Balance
$
Closing Balance
Transfer (from)
Transfer to
Opening Balance
$
Closing Balance
Transfer (from)
Transfer to
Actual 30.
Opening Balance
$
RESERVE ACCOUNTS
$
$
$
$
$
$
$
$
Closing Balance $
0
0
501,403
428,565
687,765
(407,849)
519,268
576,346
1,217,374
(225,306)
512,712
929,968
0
(175,089)
1,025,048
401,406
279,626
(1,375,102)
1,001,437
653,291
738,752
(2,429,221)
1,916,607
929,967 (b) Forrestfield Industrial Scheme Stage 1 Reserve*
1,251,366
0
0
490
124,141
124,775
0
274
124,501
125,049
0
418
1,251,365 ( c) Forrestfield Industrial Area Reserve
124,631
182,649
0
66,029
0
0
0
0
0
0
(424,049)
175,370
124,631 (d) Public Open Space Funds Reserve
248,679
0
0
0
0
0
0
0
0
0
0
0
248,678 ( e) Public Open Space Funds ReserveGooseberry Hill **
0
0
0
0
0
0
0
0
0
182,849
0
182,849
0 (f)
0
Public Open Space Funds ReserveHigh Wycombe **
0
0
0
0
0
0
0
0
65,660
0
65,660
0 (g) Public Open Space Funds ReserveMaida vale **
0
0
0
0
0
0
0
0
0
55,135
0
55,135
0 (h) Public Open Space Funds ReserveKalamunda **
0
0
0
0
0
0
0
0
0
121,074
0
121,074
0
0 (i)
Public Open Space Funds ReserveForrestfield **
0
0
0
0
0
0
0
0
1,354,1381,520,979(1,782,951)1,092,166954,1121,592,970(175,089)182,6492,554,642
0
0
0
0
0 (j)
0 2,554,6443,029,825(3,078,576)2,505,892 | 53
Public Open Space Funds ReserveLesmurdie **
CITY OF KALAMUNDA NOTES TO AND FORMING PART OF THE FINANCIAL REPORT FOR THE YEAR ENDED 30 JUNE 2022
2021
2021
2021
2021
2022
2022
2022
2022
2022
2022
2022
2022
Actual
Actual
Net Transfers from Trust Accounts
Actual
Actual
Budget
Budget
Budget
Budget
Actual
Actual
2021 Actual
Actual
Transfer (from)
Transfer to
Opening Balance
Closing Balance
Transfer (from)
Transfer to
Actual 30.
Opening Balance
Closing Balance
Transfer (from)
Transfer to
Opening Balance
$
$
$
$
$
$
$
$
$
Closing Balance $
$
0
(512,257)
2,678,807
3,121,555
4,311,313
(1,346,577)
12,419
5,645,471
5,514,203
(836,950)
1,063,048
$ Restricted by council (k) Waste Management Reserve
5,288,105
0
0
3,870
982,101
987,120
0
2,167
984,953
1,759,278
0
773,307
985,971
5,288,105 (l)
Long Service Leave Reserve
0
(1,400,000)
854,003
1,434,122
890,240
0
1,954
888,286
1,941,103
0
1,052,977
985,971 (m) Land and Property Enhancement and Maintenance Reserve
888,126
0
(700,000)
302,543
878,047
46,434
(480,219)
46,057
480,596
877,200
0
396,609
888,125 (n) EDP IT Equipment Reserve
480,591
0
0
70,526
1,040
71,577
(100,000)
100,157
71,420
72,245
(100,000)
100,678
480,590 (o) Local Government Elections Reserve
71,567
0
(100,000)
964
284,073
185,305
0
407
184,898
185,658
0
621
71,566 (p) Insurance Contingency Reserve
185,037
1,810,935
0
(100,000)
0
(185,000)
673
303,665
7,729
1,988,207
104,618
(100,000)
1,812,959
0
449
204,169
3,979
1,808,980
104,585
(100,000)
2,102,011
0
247
185,037 (q) Revaluation Reserve
291,075
204,338
1,810,936
204,338 ( r) Nominated Employee Leave Provisions Reserve
0
0
3,810,494
1,100,384
1,389,171
(2,693,127)
8,960
4,073,338
4,201,413
(1,425,928)
716,463
4,910,878
(s) Asset Enhancement Reserve
0
0
2,637,727
3,415,163
15,607
(6,052,408)
13,319
6,054,696
4,923,362
(6,061,625)
4,932,096
4,910,878 (t)
6,052,891
Unexpended Capital Works and Specific Purpose Grants Reserve
0
0
272
69,292
8,896
(60,750)
153
69,493
9,044
(60,750)
234
6,052,890 (u) Environmental Reserve
69,559
0
0
8,901
0
0
0
0
0
161,433
0
152,532
69,564 (v) Public Art Reserve
8,901
0
(500,628)
500,628
0
0
0
0
0
0
0
0
8,901 (w) Crisis Relief Fund
0
0
(3,497,885)
23,511,544
182,649
(3,672,974)
10,877,136
13,577,649
12,470,107
14,531,763
9,823,240
(10,833,081)
10,915,406
(12,616,032)
190,021
1,711,000
20,466,300
21,851,534
21,820,438
24,357,427
(8,585,252)
0 20,956,900
(11,663,828)
9,479,886
12,509,710
20,956,900 23,511,544
All reserves are supported by cash and cash equivalents and financial assets at amortised cost and are restricted within equity as Reservescash/financial assets backed.
CITY OF KALAMUNDA
NOTES TO AND FORMING PART OF THE FINANCIAL REPORT FOR THE YEAR ENDED 30 JUNE 2022
Funds held at balance date which are required to be held in trust and which are not included in the financial statements are as follows:
1 July 2021 Amounts Received Amounts Paid 30 June 2022 $ $ $ $
Wattle Grove - Cell 9* 8,086,454 4,524,690(6,516,733)6,094,411
Cash in lieu of Public Open Space 1,885,959 10,889(978,921)917,927 NBN Tower Pickering Brook 41,459 26,409(45,462)22,406 10,013,872 4,561,989 (7,541,116) 7,034,744
* The Wattle Grove CELL 9 Trust includes an amount of $3.9 million payable to the Department of Education for their contribution to the Trust in the form of the Wattle Grove Primary School land.
The City has been investigating the development of Cambridge Reserve for the purposes of aged care, residential development and improved public open space. The City has been liaising with the Department of Planning, Lands and Heritage (DPLH) to secure the purchase of the subject land, subject to Minister approval, for the purposes of implementing the Cambridge Reserve Community Enhancement Project.
On 21 December 2021, the Council at its Ordinary Meeting considered submissions on, and adopted, a Business Plan for to satisfy the provisions of Section 3.59 of the Local Government Act, given that the purchase of Cambridge Reserve from the State will be defined as a preparatory action for the broader land sale and development activities proposed will be defined as a Major Land Transaction. The Business Plan outlines the City’s intention to acquire Cambridge Reserve from the State of WA to implement the Proposed Cambridge Reserve Community Enhancement Project.
The City did not participate in any trading undertakings or major trading undertakings during the 2021/2022
Financial Year.
CITY OF KALAMUNDA
TO AND FORMING PART OF
FOR THE YEAR ENDED 30 JUNE 2022
FINANCIAL
During the year the City recognised some infrastructure assets (traffic management devices, stormwater pits and pipes) which had not been previously recognised. The City applied the standard infrastructure valuation methods to value these assets, in order to fair value them, which resulted in an increase in the infrastructure assets account balance by $3,567,678 at 1 July 2020.
AASB 108 - Accounting Policies, Changes in Accounting Estimates and Errors requires the entity to correct material prior period errors retrospectively in the first set of financial statements authorised for issue after their discovery by: (a) Restating the comparative amounts for the prior period(s) presented in which the error occurred; or
(b) If the error occurred before the earliest prior period presented, restating the opening balance of assets, liabilities and equity for the earliest period presented.
The City of Kalamunda has retrospectively applied the correction as at 1 July 2020 (beginning of the earliest period practicable) to reflect the City's fair value of the assets.
Increase/30 June 2021
Increase/1 July 2020
Statement of Financial Position30 June 2021(Decrease)(Restated)1 July 2020(Decrease)(Restated) (Extract) $ $ $ $ $ $
Infrastructure 372,099,374 3,509,688 375,609,062 371,529,361 3,567,678 375,097,039 Net assets 372,099,374 3,509,688 375,609,062 371,529,361 3,567,678 375,097,039
Retained surplus 222,340,202 3,509,688 225,849,888 222,322,634 3,567,678 225,890,312 Total equity 222,340,202 3,509,688 225,849,888 222,322,634 3,567,678 225,890,312
Increase/ 2021 Statement of Comprehensive Income 2021 (Decrease)(Restated) (Extract) $ $ $
By Nature or Type
Depreciation on non-current assets 13,327,729 57,990 13,385,719
Total Expenses (61,600,650)(57,990)(61,658,640)
Net result for the period 8,814,700 (57,990) 8,756,708
Total comprehensive income for the period 8,040,560 (57,990) 7,982,568