130 $ 83,132,661
18,599,780 37,658,494 4,093,722 6,365,692 $ 73,947,610
430,000 29,021,201 3,421,940 11,808,531 $ 66,871,043
$ 73,473,519
$ 7,229,922 -
$ 2,102,098 7,082,953 $ 9,185,051
$ 22,189,371 -
$ 2,145,051 4,457,425 $ 6,602,476
2004
$ 67,028,090
7,703,977 31,751,472 4,979,560 5,609,261 $ 58,182,671
$ 8,138,401 -
$ 2,644,316 6,201,103 $ 8,845,419
2005
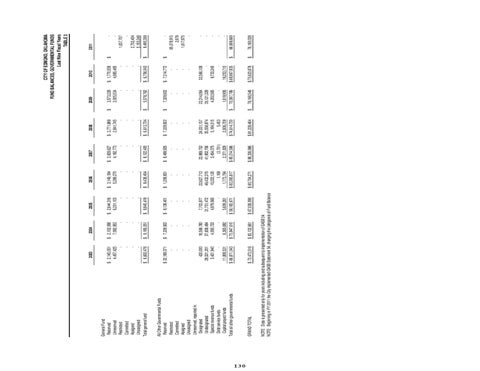
NOTE: Data is presented only for years including and subsequent to implementation of GASB 34. NOTE: Beginning in FY 2011 the City implemented GASB Statement 54, changing the categoreis of Fund Balance
GRAND TOTAL
All Other Governmental Funds Reserved Restricted Committed Assigned Unassigned Unreserved, reported in: Designated Undesignated Special revenue funds Debt service funds Capital project funds Total all other governmental funds
General Fund Reserved Unreserved Restricted Committed Assigend Unassigned Total general fund
2003
$ 90,704,271
22,627,713 46,432,370 10,222,120 1,169 1,773,794 $ 82,265,817
$ 1,208,651 -
$ 3,149,184 5,289,270 $ 8,438,454
2006
$ 88,336,986
23,989,752 41,902,706 3,454,075 (3,701) 2,371,829 $ 80,214,586
$ 8,499,925 -
$ 3,929,627 4,192,773 $ 8,122,400
2007
$ 81,228,464
24,031,157 35,556,974 5,184,515 5,453 2,606,709 $ 74,614,730
$ 7,229,922 -
$ 3,771,989 2,841,745 $ 6,613,734
2008
$
$
$
$
$
76,166,548
22,314,064 35,121,329 4,202,565 1,619,906 70,587,786
7,329,922 -
3,573,228 2,005,534 5,578,762
2009
$ 75,623,878
32,566,108 9,733,245 19,253,710 $ 68,867,835
$ 7,314,772 -
$ 1,770,558 4,985,485 $ 6,756,043
2010
$
$
$
$
$
76,190,028
66,699,669
65,078,915 2,879 1,617,875 -
1,637,707 2,702,404 5,150,248 9,490,359
2011
CITY OF EDMOND, OKLAHOMA FUND BALANCES, GOVERNMENTAL FUNDS Last Nine Fiscal Years TABLE 3