

Prepared by the Northeast Georgia Regional Commission


Prepared by the Northeast Georgia Regional Commission

Steve Horton, Mayor
Susie Keck, East Ward
Don Floyd, East Ward
Fleeta Baggett, East Ward
Charika Davis, West Ward
Anthony Henderson, West Ward
Kenneth Morgan, West Ward
Steve Horton, Mayor
Kenneth Morgan, City Council Member
Fleeta Baggett, City Council Member
Tres Thomas, Interim City Manager
Marc Beechuk, Planning and Zoning Manager
Shamica Tucker, Covington Housing Authority
Serra Hall, Select Newton Executive Director
Willie Davis, Incredible Citizen
John King, Assistant City Manager
Kevin Sorrow, Water Planning Manager
Renee Criswell, City Planner
William Smith, Former Economic Development Director
Cathy Laseter, Incredible Citizen
Ken Malcom, Community Development Director
Shawn McGovern, Planning Commission Vice-Chair
Steve Horton, Mayor
Tres Thomas, Interim City Manager
Serra Hall, Select Newton Executive Director
Marc Beechuk, Planning and Zoning Manager
Kevin Sorrow, Water Planning Manager
Burke Walker, NEGRC Executive Director
Mark Beatty, PGS Division Director
Jon McBrayer, GIS Planner
Sara Kaminski, Community Planner special recognition
Thank you to the City of Covington, the Community Development Department, and Beth Ivey for the photographs within the Plan. Most if not all images and photographs were provided by the City of Covington.
 Photo provided by the City of Covington
A Comprehensive Plan is a community’s long-range guide for growth and development and is a living and breathing document that is publicly accessible. This plan, designed distinctively for the City of Covington, outlines the vision and goals identified by the community, and establishes the actions required to achieve those vision and goals. The plan serves as a decision-making guide for local government officials and community leaders and was developed based on input from the public, city staff, elected officials, and a steering committee. The document illustrates Covington’s needs and opportunities, goals and policies, land use practices, and implementation framework, also known as a community work program. The plan seeks to answer three questions: Where are we now? Where do we want to be? How do we get there?
The Comprehensive Plan process follows the Rules of the Georgia Department of Community Affairs (“DCA”), O.C.G.A. Chapter 11012-1, Minimum Standards and Procedures for Local Comprehensive Planning, effective October 1, 2018. The DCA rules state that the City of Covington’s Comprehensive Plan is required or encouraged to include the following elements:
Through public and steering committee engagement, the City’s vision, goals, and policies were developed to determine the community’s future direction. The goals align with the short-term work program which enables Covington to progress as a community towards the vision stated in Chapter Two.
An analysis of the community’s needs and opportunities determines the existing conditions within the city. This required element will assist the community in identifying the weaknesses that it needs to address and the opportunities on which it can capitalize.
As of 2018, all communities are required to include a broadband element to analyze served and unserved locations. A focus on broadband ensures that the community promotes cost-effective and reasonable access to internet services for all. This element does not have a dedicated chapter but is incorporated throughout the plan in the Needs and Opportunities and the Community Work Program.
This section is required for any community that has a local zoning ordinance; it assigns future land use categories by parcel. The Future Land Use map is intended as a guiding tool for City Council, the Planning and Development Department, and the Planning Commission on zoning and land use policy decisions. The objective is to influence growth and development throughout the community in consideration of existing development patterns, access to utilities and services, and community needs and goals.
Since the City of Covington is within the Atlanta Metropolitan Planning Organization (MPO) boundary, a transportation element is required to ensure alignment with the Atlanta Regional Transportation Plan (RTP). Transportation is referenced throughout the document, and Chapter Five is also dedicated to transportation.
This element is not required for the City of Covington, but was encouraged by the local government, steering committee, and the public. The community has an active housing authority, and it was imperative that housing be a topic of discussion within the plan. The element includes goals and policies, needs and opportunities, and work program items related to housing initiatives.
This section is not required for the City of Covington, but was encouraged by the local government, steering committee, and the public. A focus in economic development gives residents access to personal wealth, increases Covington’s tax revenue, and encourages resilience by diversifying the local economic base. The element includes goals and policies, needs and opportunities, and work program items related to economic development initiatives.
The final required component of the comprehensive plan, the Community Work Program, outlines strategic projects identified to achieve the community’s goals and implementing its plans. The Work Program will include a Report of Accomplishments from the previous Comprehensive Plan, a five-year list of priority projects, and a list of long-term projects that designate responsibilities and outline funding strategies.
The Comprehensive Plan encouraged public involvement throughout the process. The planning process began with a public hearing and community input session on May 9, 2022, where the public was invited to discuss the assets and challenges found in the city, and their hopes for its future. Following the initial public meeting, five publicly available input sessions were held with the Steering Committee, a group of elected officials, city staff, and citizens representing various communities throughout the city. This Committee provided valuable feedback, guidance, and recomendations and served an integral role in developing a plan representative of the community’s vision. Throughout the process, steering committee members provided feedback through questions, comments, and a review of plan elements.
Opportunities for public engagement were also available outside of the public hearings and input sessions. Covington tied in public participation at a local concert on August 12th, 2022. City staff provided free food to residents who filled out the comprehensive plan questionnaire and answered any questions the public had about the
plan. The event was advertised through Covington’s social media pages and was a success at reaching residents who were unaware of the survey or didn’t have the ability to attend the input sessions (Figure 1).
In addition, public questionnaires were available and distributed from May 13, 2022 - August 21, 2022. There were three survey options available during the process. The first survey was a detailed online survey that allowed the local government to receive a wider range of input than otherwise would have been possible. The online survey was embedded in a dedicated webpage to the Comprehensive Plan update; the link was displayed on the City’s website, social media pages, and at City Hall. The link and QR code for the online questionnaire were mailed to all residents within their June utility bill, and this survey closed on July 24th, 2022.
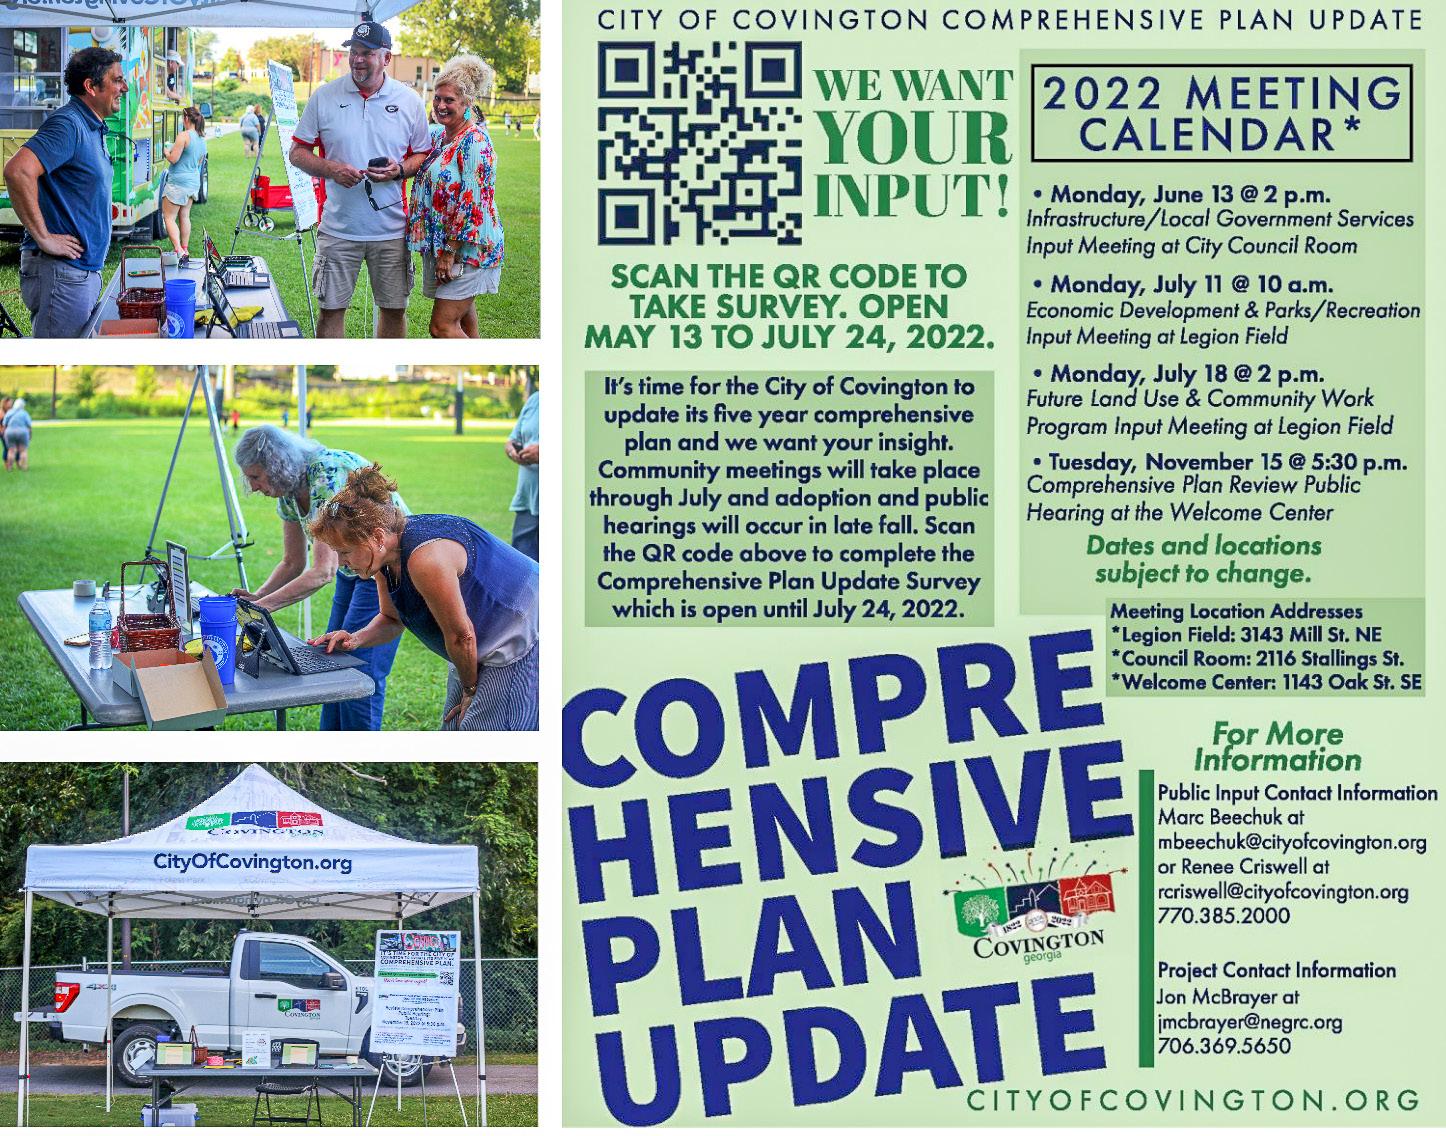
The second questionnaire was an online events survey that was less detailed but was utilized at public events held in Covington throughout the summer and closed on August 21st, 2022. The last survey was a hardcopy questionnaire that was distributed to residents and business owners by city staff. In total, 342 questionnaires were received during the process.
A final public hearing was held on November XX, 2022, before submittal of the plan to the DCA for review. The Northeast Georgia Regional Commission Planning & Government Services Division oversaw the development of this plan, including facilitating public involvement and input meetings.
According to the DCA’s rules for comprehensive planning, effective October 1, 2018, the City must transmit the plan to the Northeast Georgia Regional Commission (NEGRC) when all required components are complete. The transmittal must also include the community’s certification that it has considered both the Regional Water Plan and the Rules for Environmental Planning Criteria . Once it completes its review, the NEGRC will forward the plan to the DCA for review. Once the plan has been found by the DCA to be in compliance with Minimum Standards and Procedures, the approved Plan must be adopted by local resolution to maintain Qualified Local Government (QLG) status.
The facts, figures, and statistics used to develop the Plan were generated from data compiled throughout the planning process. The data and analyses were used to identify general trends and provide a reliable quantitative context to describe existing conditions and assist in informing the recommendations and policies.
Unless otherwise noted, all data used throughout this plan are sourced from Esri’s Business Analyst (BAO), which is based on U.S. Census data and the U.S. Census’s 2016–2020 American Community Survey (ACS). These data are available in the appendix. The 2016–2020 surveys preceded several national and international events that have
substantially affected the cost of living in 2020–2022, such as the COVID-19 pandemic and high inflation, including significant recent increases in home values, rents, and gasoline prices (Bureau of Labor Statistics). For these reasons, the 2016–2020 ACS data (including the 2022 and 2026 projections based on these data) may be only somewhat representative of Covington today.
In an effort to be truly comprehensive, the City of Covington will work in conjunction with other pertinent planning documents that have either already been completed or that are in progress. Incorporating these documents builds momentum, establishes consistency, and reduces redundancy. The following list outlines current planning documents that are referenced in the comprehensive plan. These documents should be used in conjunction with the plan to assist the City in accomplishing its vision and goals:
• Atlanta Regional Transportation Plan, (2022)
• Northeast Georgia Regional Commission Housing Guidelines, (2022)
• Newton County Transit Master Plan, (2022)
• Central Park Master Plan, (2022)
• Traffic and Parking Assessment, (2021)
• Eastside Sewer Capacity Analysis, (2021)
• Economic Impact of the Film Industry in Newton County, (2021)
• Covington Sanitary Sewer Manhole Repair and Rehabilitation Planning Report, (2020)
• Covington Urban Redevelopment Plan, (2020)
• Newton County Housing Study, (2020)
• CMP Replacement Master Plan, (2020)
• Newton County Strategic Water Plan, Forecast and Capacity Evaluation, (2019)
• HWY 278 CID Master Plan, (2018)
• Covington Pavement Preservation Plan, (2018)
• Cricket Frog Trail Master Plan, (2018)
• Middle Ocmulgee Regional Water Plan, (2017)
• Covington Walks Master Plan, (2015)
• Design Guidelines For Historic Districts of Covington, Georgia, (2015)
 Photo provided by the City of Covington
Covington is a community at the corner of yesterday and tomorrow. The city’s culturally rich heritage and historic design paves the way for future innovation. Residents and visitors of all ages, abilities, and incomes are welcome to the diverse, safe, comfortable, and walkable environment. Citizens have access to state-of-the art schools, a variety of quality housing options, and first-rate employment opportunities.
Businesses and employers that invest in Covington are not only partners with the City but are also friends and family. Assets such as high-end city services, superior infrastructure, and a multi-modal transportation network permits smart growth and will enhance the community and sustain the small-town charm for years to come.
 Photo provided by the City of Covington
The goals and policies below serve as a roadmap for elected officials and city staff and chart the course for the City to turn the vision into reality. They are categorized based on DCA’s State Planning Recommendations and target identified needs and opportunities. The abbreviations are used as a reference in the community work program.
• Encourage citizen participation in all government activities, events, and initiatives.
• Serve residents and attract newcomers and tourists by providing quality services, employment and retail options, and recreational opportunities.
• Celebrate the entire community by embracing diversity and inclusion.
• Enhance the sense of place by hosting community events for residents and newcomers.
• Maintain the nature and character of our community’s “Small Town Feel”.
• Raise the standard of living and increase the quality of life for our residents.
• Guide new development in targeted locations in order to protect natural resources, environmentally sensitive areas, and the city’s historic aesthetic.
• Attract developments whose design, landscaping, signage, and scale add value to the community.
• Guide developers to understand the aesthetic and feel that we want to achieve.
• Spur appropriate developments that align with our community’s planning priorities and are sustainable, utilizing existing infrastructure.
• Ensure zoning ordinances reflect best practices in zoning that promote positive economic development and quality growth.
• Support mixed-use developments that align with our values and goals, and promote a vibrant area to live, work, and play.
• Encourage redevelopment with a mixture of uses, while strengthening viable neighborhoods and commercial areas.
• Promote redevelopment and infill to maximize our use of space.
• Establish public transit as a mode of transportation for all residents and visitors.
• Continue to expand and connect the city’s trail system in a way that fosters recreational opportunities and transportation alternatives, including linkages to neighboring trails and other points of interest.
• Enhance the safety, walkability, and design of the Highway 278 Corridor by supporting and utilizing the 278 Community Improvement District (CID).
• Design streets, intersections, and Right-Of-Way’s (ROW) that encourage connectivity, walkability, bicycle use, sidewalks, electric vehicles and carts, and safe crossings.
• Promote and maximize the use and upgrade of the Covington Airport.
• Establish a high degree of continuity in the tree canopy.
• Maintain high quality parks, both active and passive, while continuously adapting to the future needs and wants of the community.
• Improve local parks and greenspaces that are inviting to all members of the community.
• Support the implementation and connection of Central Park.
• Develop guidelines and trail heads for the Cricket Frog Trail.
• Continue to partner with Newton Trails on the development and expansion of trails with our city.
• Continue providing exceptional water, sewer, gas, and electric services in a safe, clean, efficient, economical, and environmentally sound manner, concurrent with new development.
• Maintain our fire department’s level two ISO rating.
• Forecast and budget infrastructure improvements before improvements are needed.
• Provide exceptional customer service to all utility customers.
• Maintain the safe atmosphere of our community.
• Implement strategies and sustainable solutions for decreasing energy usage from public streetlights, fleet vehicles, and public facilities.
• Improve the environment by monitoring and improving local air quality, reducing greenhouse gas emissions, cleaning up waterways, reducing auto dependency by increasing transportation options, decreasing waste, and reducing uncontrolled development.
• Partner with local non-profit organizations such as Sustainable Newton to promote sustainability initiatives throughout the community.
• Encourage the use of electric vehicles and advertise electric vehicle charging stations provided by the City.
• Upgrade recycling services to residents and businesses.
• Expand city services to include broadband as an option for residents and employers within the city.
• Supply the residents and employers with exceptional broadband access and broadband speeds.
• Identify strategic investments and partnerships to reach a threshold of 100% residents served.
• Partner and coordinate with other local jurisdictions in Newton County to manage cost and handle growth in an effective manner.
• Support efforts to collaborate with local governments at a regional scale.
• Engage in partnerships with Newton County Schools, as well as the local colleges, to create a world-class educational system.
• Encourage a diverse and vibrant local economy that provides meaningful employment for our citizens.
• Partner with existing businesses and industries to support and encourage the retention and expansion of jobs.
• Attract businesses and industries that are compatible and add value to the character of our community.
• Develop a business environment that attracts and cultivates a highly skilled workforce.
• Invite industries that operate in a sustainable or environmentallyfriendly manner.
• Attract green-based industries and businesses that complement existing industries around the region.
• Support community partners in developing the city’s workforce in a way that meets the needs of existing and potential industry.
• With a thriving downtown, promote further growth around the square and along corridors to and from the square.
• Attract tourists and the film industry into our community.
• Support new business and industries operating within our community.
• Establish diverse housing options in the downtown area and quality housing throughout the city.
• Work with public and private partners to encourage the development of quality, multi-tiered housing at various price points for all members of the community.
• Support the Covington Housing Authority and other non-profit organizations to redevelop and revitalize target areas within our community.
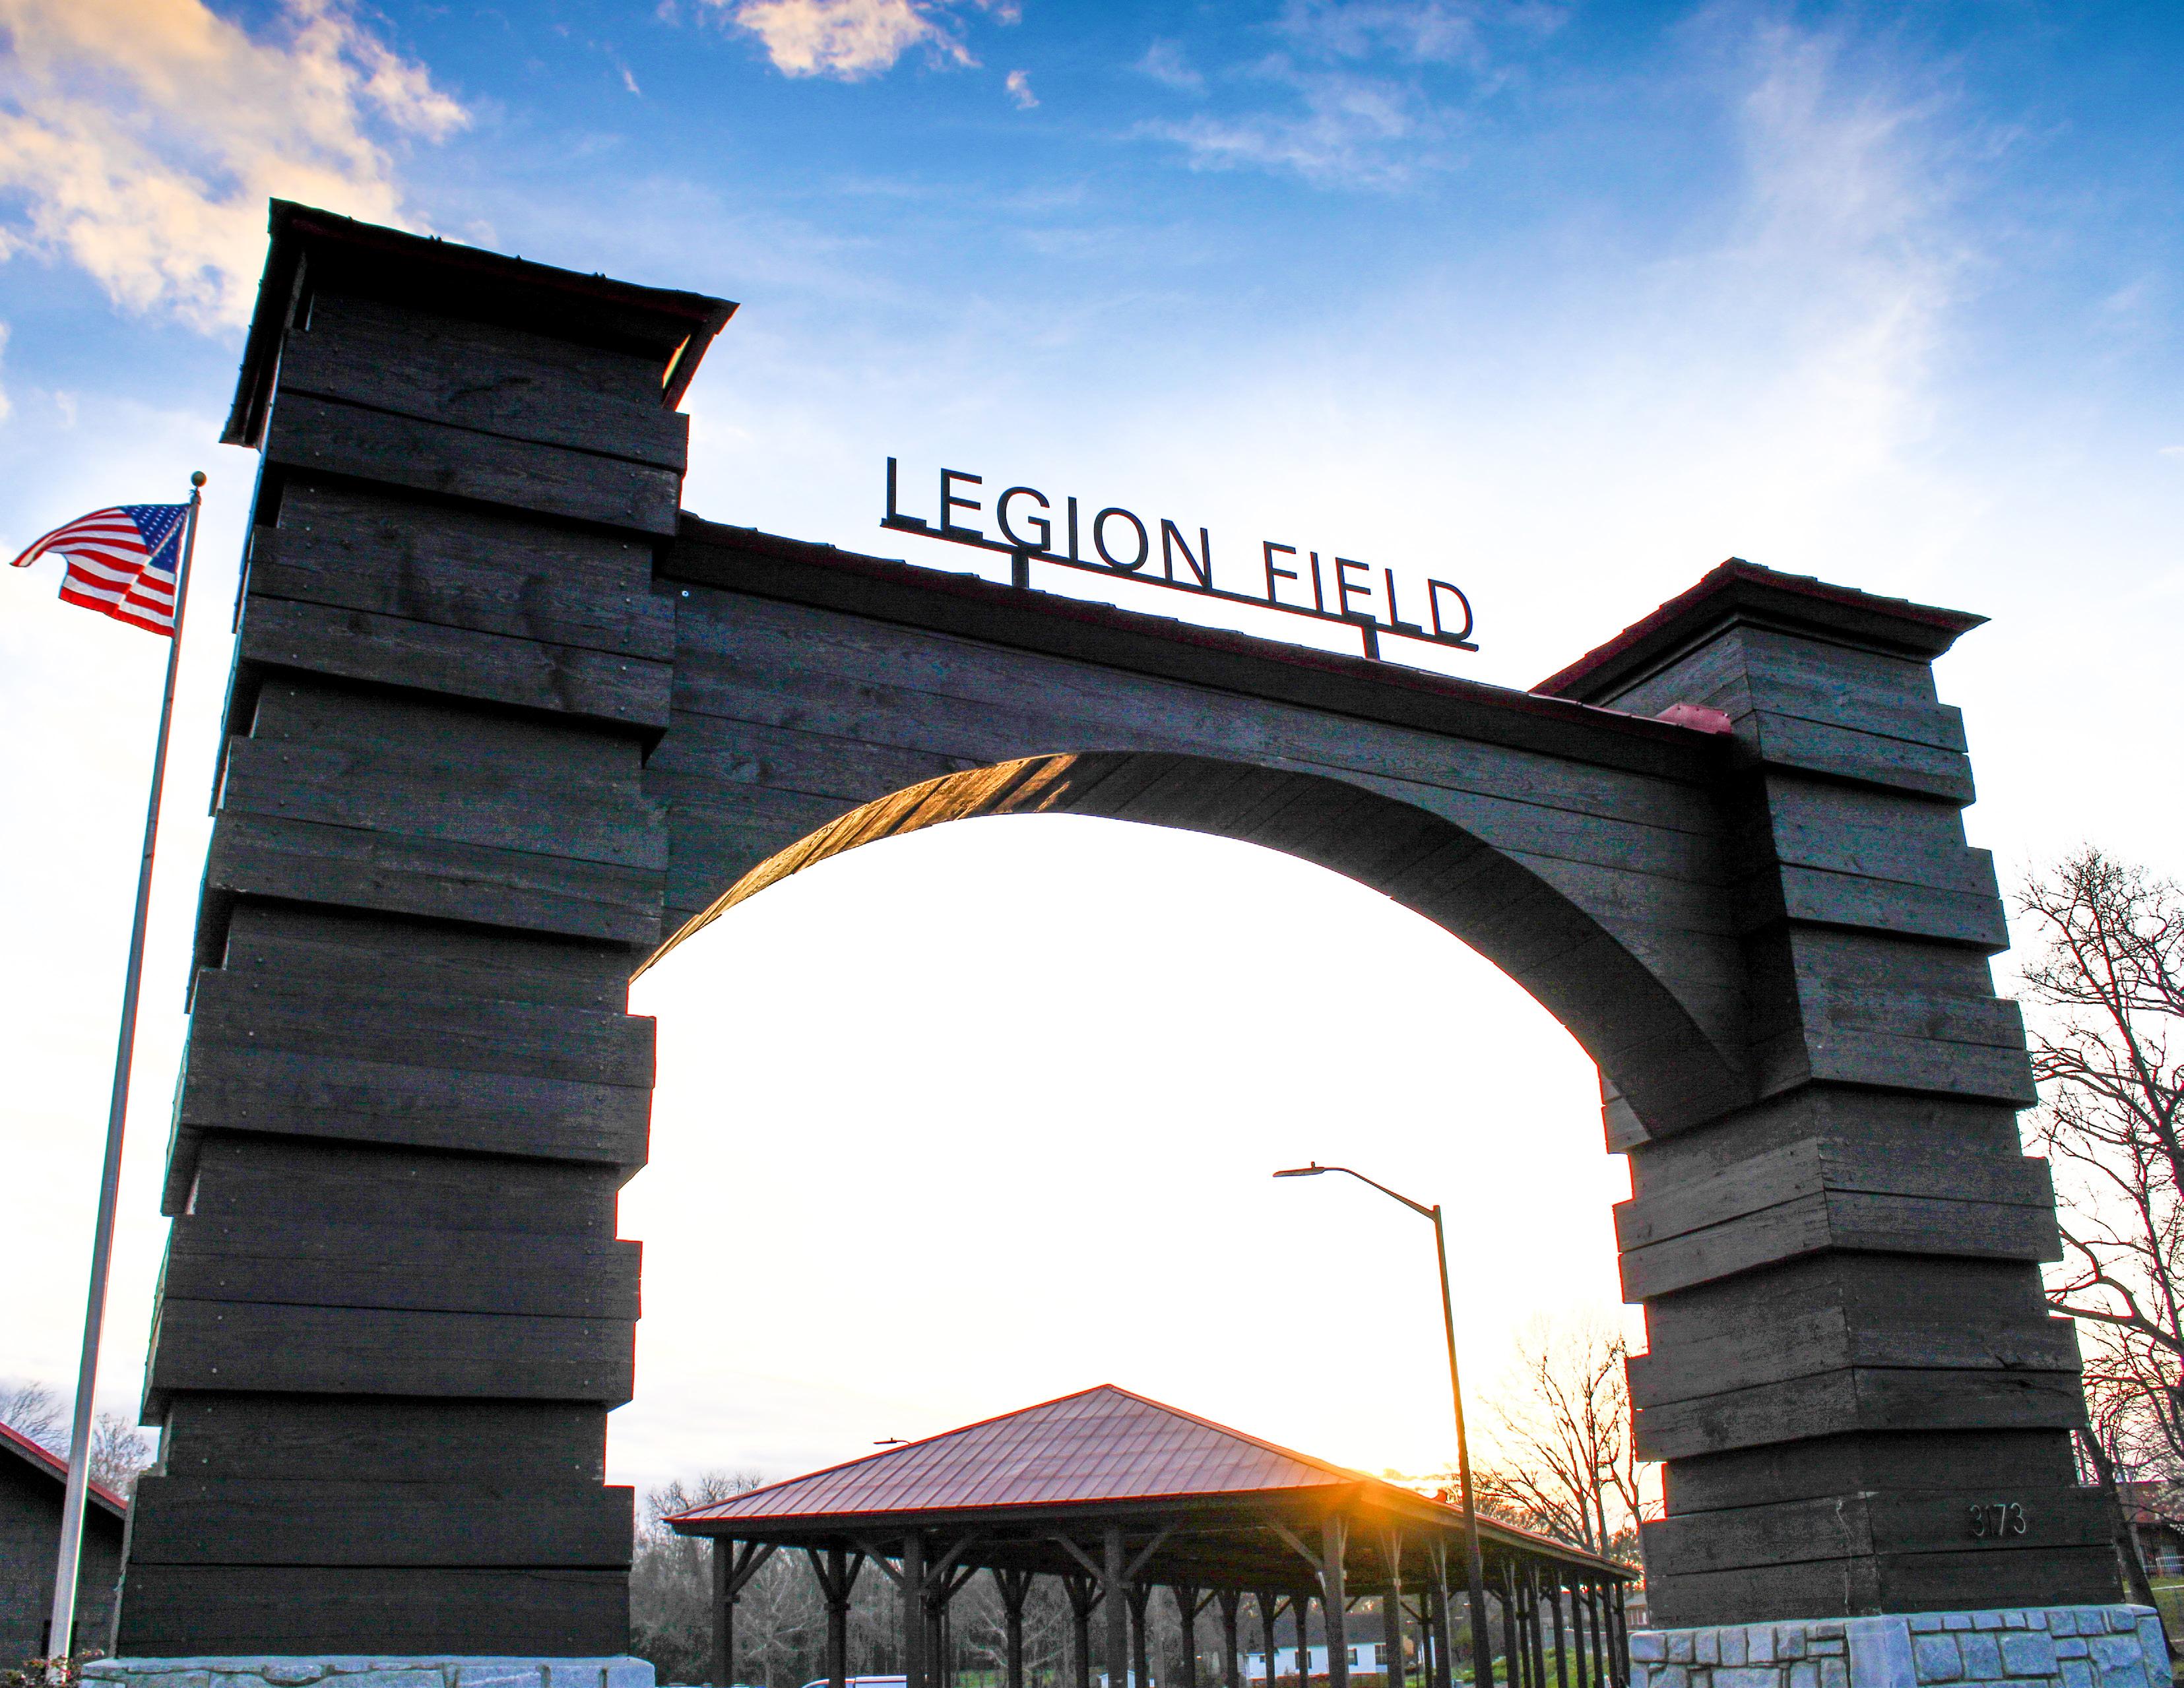 Photo provided by the City of Covington
The Needs and Opportunities were identified using a SWOT matrix, data analysis, public input sessions, and surveys completed by the public, city staff, elected officials, and the steering committee. The list is intended to capture the most prescient needs that the community anticipates over the next five to ten years. The needs and opportunities are categorized into the following topics:
• Population, Community, and Governance
• Planning and Land Use
• Parks and Recreation
• Infrastructure and Resource Allocation
• Community Facilities and Services
• Sustainability
• Broadband Services
• Intergovernmental Coordination
*Additional community statistics used in the local analysis to determine needs and opportunities and guide discussions during public input meetings can be found in the Appendix.
*Bolded items indicate high priorities within the community.
Covington, Georgia is an urbanizing municipality located southeast of Atlanta in north-central Newton County. The city has an estimated population of 15,757 and is projected to grow to 17,137 by 2026 (Figure 2). The population has grown by roughly 2,500 since 2010, an 18.9% increase. The daytime population swells to 22,379, which could provide additional opportunities for business development in the city. However, increased growth in population and the expected development has caused some concerns for citizens and the local government, including the desire to preserve Covington’s small-town
feel and historic atmosphere. Covington is a diverse community with approximately 47.6% of residents in Covington identifying as black alone, 46.7% white alone, and the remaining 5.7% of the population identifying as multiracial, Asian, or another race. The median age of the community is 35.3, and an estimated 27.2% of the population is over the age of 55 (Figure 3). Approximately one-third of households have one or more people with a disability, and it is estimated that 30.3% of households received Social Security income. Due to a high percentage of population over the age of 55, Covington should strategize senior service delivery.
At $41,788, Covington’s median household income is far below the state average of $61,000. While the statewide median household income is projected to rise to $65,000 per year in 2025, Covington’s median household income is projected to increase to $47,069, which is a faster rate than the state, but still well below the median. Furthermore, 29% of households had incomes below the poverty level in the past 12 months. Economic and housing initiatives will address these data points, and those initiatives have dedicated sections within this plan.
Covington creates an environment where residents, businesses, and visitors can foster connections amongst each other. This is done with a variety of events hosted by the City and through community facilities provided for public use (Figure 4). In addition to the city run events, our community partners offer many other opportunities with over 30 additional events including a Disc Golf Tournament, Juneteenth parade, Fuzz Run, and Back to School bashes. Combined with the multiple nonprofit organizations dedicated to transparency and public participation, there are always opportunities for residents to interact with each other and their local government. These opportunities add to Covington’s identity and sense of place.

Needs and Opportunities identified throughout the process that relate to population, community, and governance are on the next page.

• The City will experience population growth over the next 5-20 years. Population growth creates an obligation for the City to increase public services, including safety (Fire, Police, and EMS) as well as public utilities. Interconnected planning and development patterns are needed to ensure that infrastructure and services are financially productive and sustainable.
• Around 27% of the population is over 55 years old. The City needs to assess if it is adequately prepared to manage services for an aging population.
• Stakeholders cite socioeconomic and geographic disparity as focal points for improvement, whether delineated as East/West, Black/ White, or Rich/Poor. Also, 29% of the population reported incomes below the poverty rate. It is imperative that the community works together to address poverty as well as socioeconomic, geographic, and racial disparity.
• Covington’s cultural, historic, and slower-paced style of living is comforting to residents. Residents have a strong sense of community and care for each other. The community can work through social issues together, and this will be essential for the community to adapt as population growth and development continue.
Community partnerships:
• The city has multiple civic and non-profit organizations within the community, and each organization partners with the City to provide a range of benefits. Recently, the City of Covington, a local non-profit group, and a local church worked together to create a local warming center for the homeless. Partnerships with nonprofits and civic organizations allow the community to combat issues as a team which is a great asset to Covington.
Community events:
• The City of Covington hosts numerous events for the residents, and these events are inclusive to the entire community. Covington published over twenty public, community-hosted events for 2022, among others hosted in collaboration with the City. Events are crucial to building an inviting atmosphere for all residents, and these events can be used to expand community pride.
The City of Covington is considered a developing suburb, but the residents, elected officials, and steering committee members noted that it is imperative for the city to preserve Covington’s small-town charm, historic downtown, and commercial nodes. As development pressures expand from the Atlanta metropolitan area along the I-20 corridor, appropriate land use management and planning will be vital to the success of maintaining Covington’s small-town atmosphere. Smart planning and redevelopment will allow the city to manage growth accordingly by focusing development in targeted areas and by implementing a variety of planning initiatives that foster interconnectedness.

With the continued growth of industries in Covington, Newton County, and surrounding areas, it is reasonable to expect an increase in demand for housing and commercial developments. City staff, elected officials, and planning commission members will need to assess which developments are a priority for the community and review each development to determine if it aligns with the vision of Covington. The Future Development Map in Chapter Four will give the community a resource to determine if new developments align with Covington’s proposed future development pattern.
Online respondents listed overgrowth and an increase in population as a major threat to the community over the next five years. Growth will be an unavoidable trend for Covington, but there is an effective regulatory framework the community has in place and can build upon to manage future growth. In April of 2022, the City adopted a “Designated Corridor Bonus Density” ordinance that implements criteria to focus growth and intensity to preserve current standards, utilize existing infrastructure, and to preserve and balance the use of land within Covington. The purpose of the ordinance is to focus growth on select corridors such as certain Thoroughfares, Neighborhoods, and Green/Recreational areas. The ordinance allows Covington to have more control with managing land and developments, and also allows the City to have strict standards

in place so that developers are encouraged to work in partnership with the City.
Design guidelines are a set of design parameters for development which apply within an overlay district or zoning district. Guidelines open communication with the developer and city staff and allow both parties to work collectively on the design of the building or structure. Covington has design guidelines in place for its historic district which includes recommendations on parking, scale, windows, and building design for new developments. Following these guidelines will be essential if the community decides to increase mixed-use developments along major intown roads. Under these guidelines, new mixed-use developments will be required to match the aesthetic of the downtown area, including the structure and material of the building, the number of stories, and the square footage required. The guidelines allow city staff to have more tools in place to manage development while forming partnerships that benefit investors and the local government.
The 278 Community Improvement District (CID) is another great resource for Covington. The CID is a target focused area dedicated to enhancing the 278 corridor (Figure 5). The purpose and goals of the 278 CID from the 278 CID website and the HWY 278 CID Master include:
∗ Increase property values through long-term beautification projects.

∗ Develop a corridor branding theme that includes upgraded street and way finding signage, sidewalks, and lighting.
∗ Maintain an appropriate mix and balance of residential, commercial, and recreational uses, ensuring the long-term economic vitality and quality of life within the CID.
∗ Create a well-planned, aesthetic environment that enhances walkability and the quality of life and expands outward from Covington’s major business corridor.
∗ Promote the community’s vision, physical improvements, and economic opportunities, including ideas for an effectively targeted promotional and/or marketing campaign.
∗ Leverage the CID report and status to obtain future funding for the enhancement of the entire community
∗ Increase the connectivity and coordination between neighboring activity centers at exit 90 and Turner Lake Road, Hwy 81 and Emory Street, Alcovy Road as well as Elm Street, and Hwy 142Hwy 278.
The 278 CID will allow Covington to implement a variety of initiatives related to planning and land use, transportation, and economic development. Projects include developing a targeted gateway into the historic downtown, creating an attractive streetscape, providing options for alternative transportation methods, installing branded banners and wayfinding signage, and enhancing the safety and usability of Highway 278. These activities can increase Covington’s sense of place, and potentially increase property values if properly connected.


In the Fall of 2022, Urban3 performed an “Economic MRI” or revenue modeling analysis for Newton County and the City of Covington. The analysis demonstrated that the downtown square and mixed-use neighborhoods such as Clark’s Grove create the best deal for taxpayers while the big box stores, fulfillment centers, and large single-family subdivisions often consume more public resources than they pay in taxes (Figure 6). This was completed by analyzing the tax value per acre in the City of Covington and Newton County, and comparing the data to other parcels within the jurisdictions.

The model created by Urban3 for the City of Covington displayed that the City is operating under a $8,000,000 shortfall against the longterm replacement and maintenance of its existing infrastructure (Figure 7). Additional revenue is needed due to the amount of infrastructure in place in Covington, and the amount of money needed to replace and maintain existing infrastructure is more than the amount of revenue generated by taxes, SPLOST, and other funding mechanisms. Therefore, the City will need to evaluate development patterns and trends with future developments and redevelopments to better align the infrastructure budget with tax revenue. This includes developing new mixed-use neighborhoods and commercial spaces. The City should also should explore expanding the downtown core with tasteful developments that add to the character of the area. The Covington Square value per acre is 30X higher than the average properties found within the county, and the Clark’s Grove neighborhood is 45X higher. The City will need to explore these type of development to narrow the shortfall of infrastructure cost through property taxes. Continued expansion of single-family homes and chain retail stores will continue to widen the cost gap of infrastructure and generated revenue. The report from Urban3 can be found in the appendix of this document after the mandatory review is completed by the Department of Community Affairs.
Needs and Opportunities identified throughout the process that relate to planning and land use are on the next page.

Anticipate increases in development requests:
• Covington is growing and will continue to grow for the foreseeable future. Development requests should be anticipated for all types of projects including housing, commercial, industrial, and mixed-use. Being prepared for an increase in development requests and identifying if these new developments align with the community are essential to the community’s wellbeing. This will be accomplished through proper staff capacity, training of commission members, and efficient local review processes.
Utilizing design guidelines:
• Utilizing the Historic District Design Guidelines for mixed-use developments could give the local government the tools needed to encourage development while maintaining Covington’s small-town charm and aesthetic. Requiring future developments within the district to complement the historic architecture of Covington will permit the community to expand the downtown area by blending new mixed-used developments with the historical buildings around the town square.
• Incorporating design guidelines or standards within urban redevelopment areas can promote redevelopment and revitalization that aligns with the community’s values and goals.
• Implementation of the Designated Corridor Bonus Density ordinance and design requirements allows Covington to manage growth in certain areas, but other options and initiatives should be explored to give as many tools and coverage to city staff as possible. Another initiative includes strengthening zoning ordinances and considering variances or conditional variances as needed.
• The City could also explore true mixed-use developments or livework developments to encourage walkability, sustainability, and density.
• Collaborating with developers on in-fill and redevelopment could also be a useful tool to maximize land use throughout the community.
Implementation and expansion of mixed-use developments:
• A targeted area discussed in the input sessions imagined mixeduse developments along the larger in-town streets leading to the downtown square. With the implementation of existing design guidelines, mixed-use developments can blend with the existing historic architecture in the downtown area. These types of targeted developments would improve walkability, increase density, attract younger residents to the community, and promote sustainable and fiscally responsible infrastructure. The design standards could give the City the leverage needed to ensure that new developments match the current aesthetic of the area, and that the proposed sites align with the existing framework.
Utilize the 278 Community Improvement District to improve planning and design of the Hwy 278 corridor:
• The CID will allow Covington to implement a design and brand that is unique to the community, while encouraging revitalization and improving walkability.
• Covington should leverage the grants and funding opportunities that are available to the CID to implement the projects and narratives outlined in the CID Master Plan.
Designated Corridor Bonus Density Ordinance:
• Implementing the Designated Corridor Bonus Density Ordinance will allow the City to manage growth in select areas. The corridors highlighted in the ordinance allow for innovative development and redevelopment with requirements that are beneficial to the City and to potential investors. Corridors include:
∗ U.S. Hwy 278: from Capes Drive to SR36 and SR142
∗ SR142: from U.S. Hwy 278 to I-20
∗ Pace Street: from U.S. Hwy 278 to Cricket Frog Trail
∗ Washington Street: from Midway Drive to Emory Street
∗ Cricket Frog Trail
∗ Eastside Trail
Parks and recreation are pivotal to the community for increasing quality of life and economic development. The expansion of parks and greenspace can serve as a transportation hub and serve as an amenity for neighborhoods or areas that spur reinvestment. Survey respondents in Covington noted that parks and greenspace within the community are a terrific asset, and Covington has a variety of park and recreation options including Legion Field, the Cricket Frog Trail, and numerous pocket parks throughout the city (Figure 8). According to the survey responses, residents feel that the parks and greenspace are well maintained, and citizens commended all that Covington has accomplished regarding local parks. With growth and development pressures expected to increase in Covington in the near future, the preservation and expansion of parks and greenspace will be an important focal point for residents, city staff, and elected officials. Ensuring that there is a standard of open space requirement per number of residents could provide a quantifiable goal for the city to carry out. Also, working with developers to incorporate greenspace and conservation areas into new developments could expand recreational opportunities for visitors and residents.

An exciting opportunity for the community includes the Central Park Master Plan that was completed in 2022. Central Park is a proposed 220-acre park just south of the downtown square, and would include walking, hiking, and biking trails, playgrounds, a skate park, and large pavilions. The park would be a central destination designed for all demographics, and would serve as a location for gathering, playing, and relaxing. The main goals of the park include connecting residents to parks and greenspaces, creating memorable experiences for users, restoring the park’s ecology, attracting visitors to the park, and activating the park by promoting community health initiatives and providing thoughtful amenities to residents and visitors. Intergovernmental partnerships between Covington and Newton County and partnerships with non-profit organizations such as the Path Foundation, Newton Trails, and Sustainable Newton are needed to implement a project of this magnitude. Central Park has the potential to be a premier destination that visitors from all over the country visit.
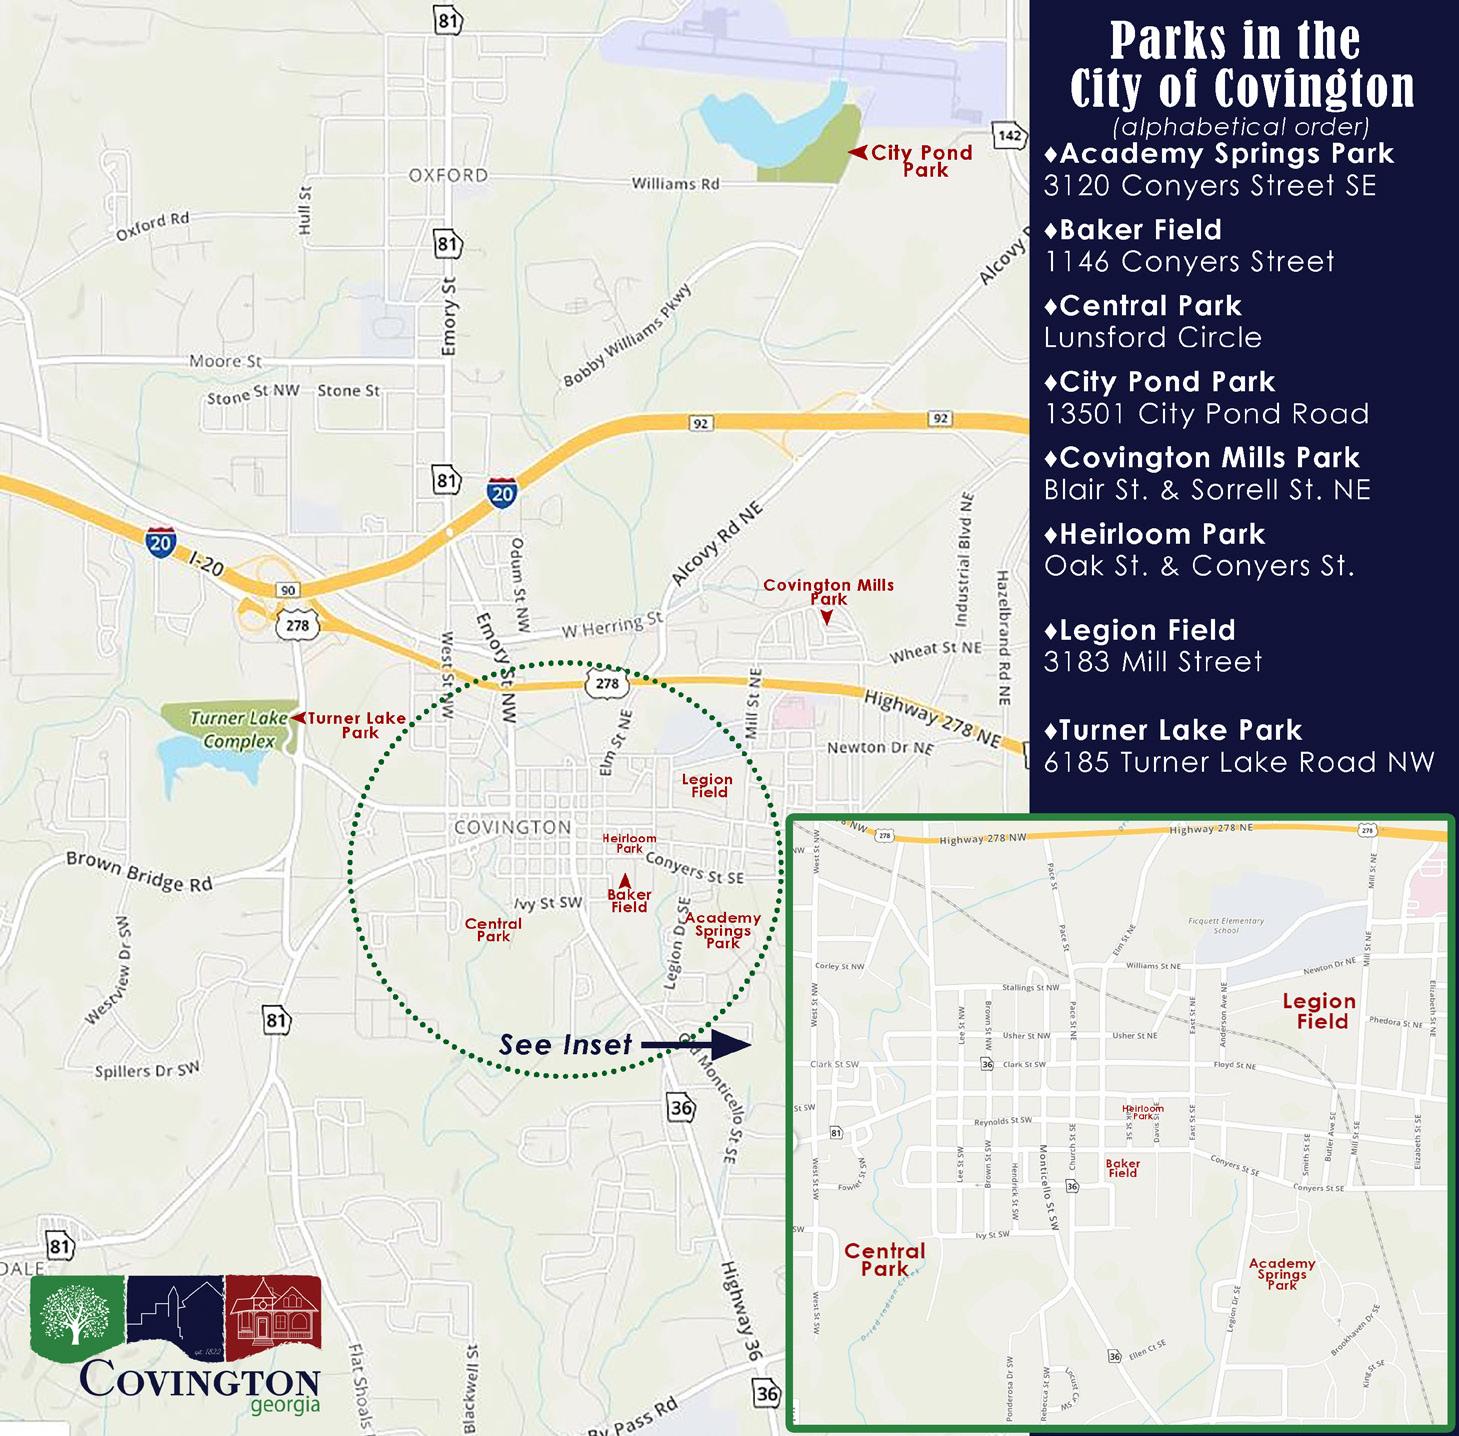
Central Park is a long-term plan, and due to estimated costs, the park will require years of planning and funding allocation for it to be completed. Although the plan will take time to develop, there are existing amenities at the north-node of the park. Currently, Central Park offers residents and visitors playgrounds, disc golf, and parking to all users.

The Cricket Frog Trail is another recreational amenity and mode of alternative transportation that residents in Covington and visitors can utilize. The trail is mentioned numerous times throughout the transportation chapter, but the trail is a great asset to parks and recreation as well. As of 2023, there are four miles of paved Cricket Frog Trail within the city limits, and easements have been acquired by the City to provide a connection to Central Park for when the park is funded and developed. Continued partnerships with local non-profits and surrounding local governments should be explored to provide more connections to the Cricket Frog Trail. Other trails and facilities within Covington include the Eastside Trail, Turner Laker Park, and the Legion Field trail. These trail facilities promote community health initiatives and encourage visitors and residents to maintain an active lifestyle. Currently, the Cricket Frog Trail lacks trail heads, which could be funded through the Recreational Trail Program grant offered by the Georgia Department of Natural Resources. The Cricket Frog Trail could also use consistent park policy and signage, which is outlined in the Cricket Frog Trail Master Plan. The incorporation of these elements would benefit branding of the city’s park system as well as improve user experience. Newton County provides organized recreation for residents, but the parks within the city limits are owned and maintained by the City of Covington. The partnership between local governments for the programming of organized sports is expected to continue. Pocket parks within the city allow residents to easily access greenspace, and city leadership emphasized the need to improve playground equipment located within the pocket parks.
Needs and Opportunities identified throughout the process that relate to Parks and Recreation are identified on the next page:

Identify funding sources for Central Park:
• The implementation of Central Park will have an immediate impact on Covington, Newton County, and surrounding jurisdictions. However, a project of this scale will require numerous funding streams. Identifying potential investors, grant opportunities, and state and federal allocations will be needed for Central Park to become a reality.
Create multiple trailheads for the Cricket Frog Trail:
• The creation of a trailhead for the Cricket Frog Trail would encourage more residents to utilize the trail and would bring in more visitors. This type of project could be subsidized through grants like the Recreational Trails Program offered by the Georgia Department of Natural Resources.
Increase park personnel, equipment and resources:
• As growth continues, resources, equipment, and personnel to parks and recreation initiatives.
Spur economic opportunities along multi-use trails:
• Multi-use trails such as the Cricket Frog Trail offers unique opportunities for businesses and industries to capitalize on the user base of the trail. The trail can be used as an asset to the community and spur businesses and industries that cater to trail users.
• Central Park has the potential to be a regional and statewide destination. The creation and planning of the park is very exciting for residents and businesses in Covington, and the impact of the park on the community will be immediate.
• Explore connections to neighborhoods and points of interest to maximize connectivity to Central Park.
Multi-jurisdictional trail connections:
• Connections to other jurisdictions allow residents and visitors to explore areas that may have not been explored without the trail.
• Finalizing the Cricket Frog Trail connections will increase economic development and private investment for all jurisdictions in Newton County.
Infrastructure and the allocation of resources are significant topics relating to the future of Covington. As mentioned, numerous times throughout the plan, Covington is growing not only in population and development, but also regarding the number of cars that traverse through the community daily. Planning for a variety of infrastructure improvements and the expansion of existing infrastructure will be crucial in the next 5 to 25 years.
Upgrading and expanding water and sewer infrastructure is costly, but it is a requirement due to aging pipes and connecting services to new developments. Local governments must plan expansions and upgrades years in advance, and Covington has master plans and reports in place that prioritize necessary infrastructure improvements. The current plans dedicated to water and sewer infrastructure include: the Eastside Sewer Capacity Analysis, Covington Sanitary Sewer Manhole Repair and Rehabilitation Report, and Corrugated Metal Pipe (CMP) Replacement Master Plan. These master plans and reports prioritize upgrades and improvements that need to be made and include work program items. Completing the action items listed in these plans will assist Covington with planning and budgeting for infrastructure projects and will help develop a timeline for the replacement of dated infrastructure.
The allocation and capacity of water, natural gas, and power also must be accounted for regarding growth and development. An increase in population and new structures will create a demand for more resources, and all natural resources have a capacity. The City of Covington has an agreement with the Newton County Water Resources Department which allows the City to supply water to the community. Covington also offers water treatment services and water reclamation services to residents. According to the Newton County Strategic Water Plan: Forecast and Capacity Evaluation, the water demand in Covington is expected to be 4.06 Million Gallons per Day (MGD) in 2030, which is an increase from 3.66 MGD in 2020. By 2030, the Covington water reclamation facility is expected to reach capacity, and additional capacity will be
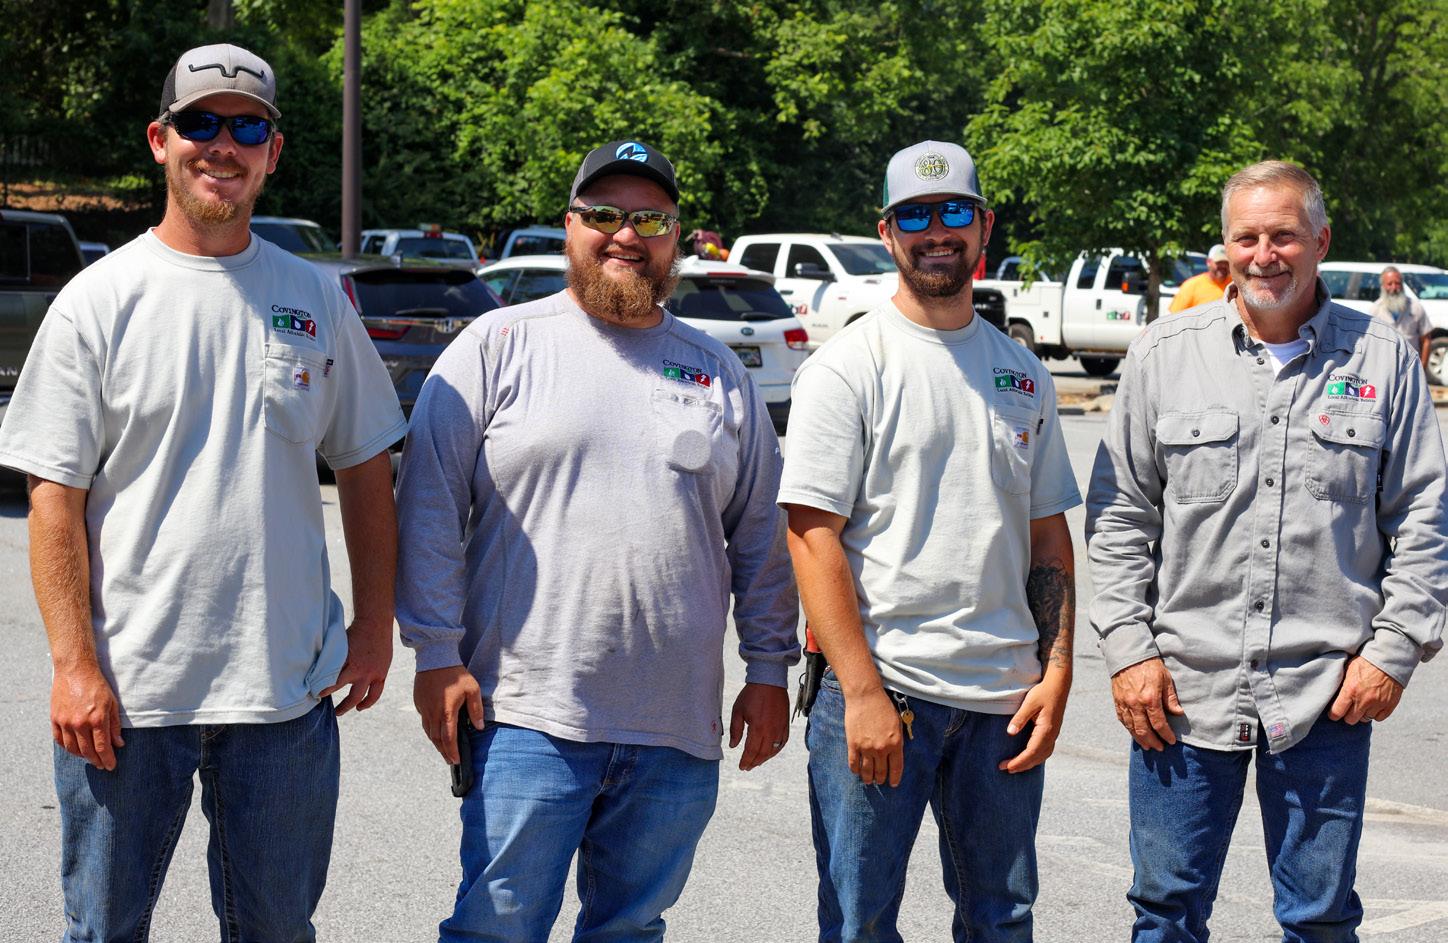

needed to serve the City’s needs. In the next few years, Covington will need to extend the capacity of the water reclamation facility tanks, and coordinate with the Georgia Environmental Protection Division on permitting the expansion. The Middle Ocmulgee Regional Water Plan estimates surface and ground water resources in the region are adequate for future water demands.
The City of Covington is a Municipal Electric Authority of Georgia (MEAG) member, and purchases power through MEAG’s wholesale agreements. MEAG and Covington should analyze and forecast energy usage citywide to determine how much power will be needed in the future. Projecting or forecasting power usage will allow Covington to determine if energy capacity needs to be expanded. Covington will also need to be wary about the impact electric vehicles will have on the power grid. As electric vehicles become more prevalent, there will be an increase usage of watts within the city by residents and visitors who charge their vehicles overnight. The City should develop a permitting process for the installation of residential and commercial EV charging stations. The permit process will allow the local government to have a general understanding of how many residential and commercial charging stations are located within the city and will allow city staff to inspect the charging stations to ensure installations are up to code.


Additional funding sources may be needed to keep up with the ongoing infrastructure improvements or maintenance. One of the best alternative funding sources is a Special Local Optional Sales Tax (SPLOST) which will allow the City to spend SPLOST dollars on approved projects. These projects can include infrastructure improvements that will directly impact the quality of life of residents and the quality of services provided by the City. Funding and infrastructure improvements related to the 278 CID and Transportation are covered in Chapter 5.
Needs and Opportunities identified throughout the process that relate to Infrastructure and Resource Allocation are on the next page.
Implement work program items in existing infrastructure master plans:
• Prioritizing and budgeting for infrastructure improvements is a difficult task. Covington has a variety of master plans in place to guide the City on prioritizing infrastructure improvements. Funding and implementing these projects will be essential to maintaining top-tier City services to all users within the city limits. Explore the expansion of the Covington Water Reclamation Facility:
• The Covington WRF is expected to reach permitted capacity by 2030. The City will need to explore expansion needs and coordinate with Georgia EPD to receive the necessary permits. Identify additional funding opportunities for road infrastructure:
• Increased wear and tear on the roads in Covington is a concern with the increase in development and population within the city and surrounding areas. Covington will need to accurately report all new roads to GDOT to maximize its LMIG funding amounts and explore additional funding opportunities to assist with maintenance of local roads.
Complete an energy usage study:
• The City of Covington should complete a study that analyzes energy usage city-wide and forecast potential usage in the future. This study will inform city staff, elected officials, and the Covington energy provider on how much electricity will be needed in the future and provide a target for economic development initiatives. Then the City and energy provider can determine if infrastructure upgrades will be needed or if capacity will need to be expanded.
• Covington should explore developing a permitting process for residential and commercial EV charging stations. This process will allow city staff to inspect the installation for code and safety violations and create a system to inventory charging stations.
Infrastructure Master Plans:
• Since Covington has prioritized most infrastructure projects that are needed, it will be easier for the City to implement and budget the projects. The completion continued use of numerous plans allows Covington to be proactive about infrastructure upgrades instead of reactive.
• Newton County has SPLOST in place which allows Covington to access additional funds to complete approved projects that would not have been funded without grants or raising property taxes. SPLOST ensures that programs and projects will not be completely funded by the residents of Covington, Newton County, and surrounding jurisdictions, but will be funded by visitors as well.
The City of Covington is a provider of all major utility services including water and sewer, wastewater, power, broadband, and gas as well as public safety services such as police and fire, including emergency medical services, hazmat response, and technical rescue operations. The City also has a contract in place to provide sanitation or solid-waste services.


The utility services Covington provides generate enough revenue to allow the City to keep taxes low while improving residents’ quality of life. Overall, water and sewer services offered in Covington were rated good, with 96.5% of respondents stating that services were good, great, or excellent. Continued maintenance of utility infrastructure will be necessary to continue high-quality service delivery. The ability for customers and residents to interact with City staff for service questions or complaints can be seen as an asset since the residents are interacting with the local government over a private organization. Additionally, the City expects to implement a new utility billing software that will allow users to see a full breakdown of usage and will be more user-friendly than the existing software.
Safety and Emergency services in Covington are also rated highly by survey respondents. Less than 5% of respondents rated safety and emergency services as “poor”. Both the Covington Fire Department and Police Department have accredited status, and the Insurance Services Office (ISO) rating in Covington is 2. An ISO fire rating is a score provided to fire departments and insurance companies by the Insurance Services Office, and the score reflects how prepared an area is for fires. An ISO rating of 2 is almost the best possible score or ranking and allows businesses and residents to have lower insurance costs. The Covington Police Department also does an exceptional job at community outreach and transparency by offering many programs that encourage citizens to participate and understand department policies and procedures.
These programs include the Fuzz Run, Citizens Academy, and Shop with a Cop. The number of calls, reports, and accidents are also listed on the Covington Police website. Covington Police is a wonderful asset to the City of Covington, but some residents noted the need for improvement on crime suppression, police presence in the downtown square, and traffic enforcement.
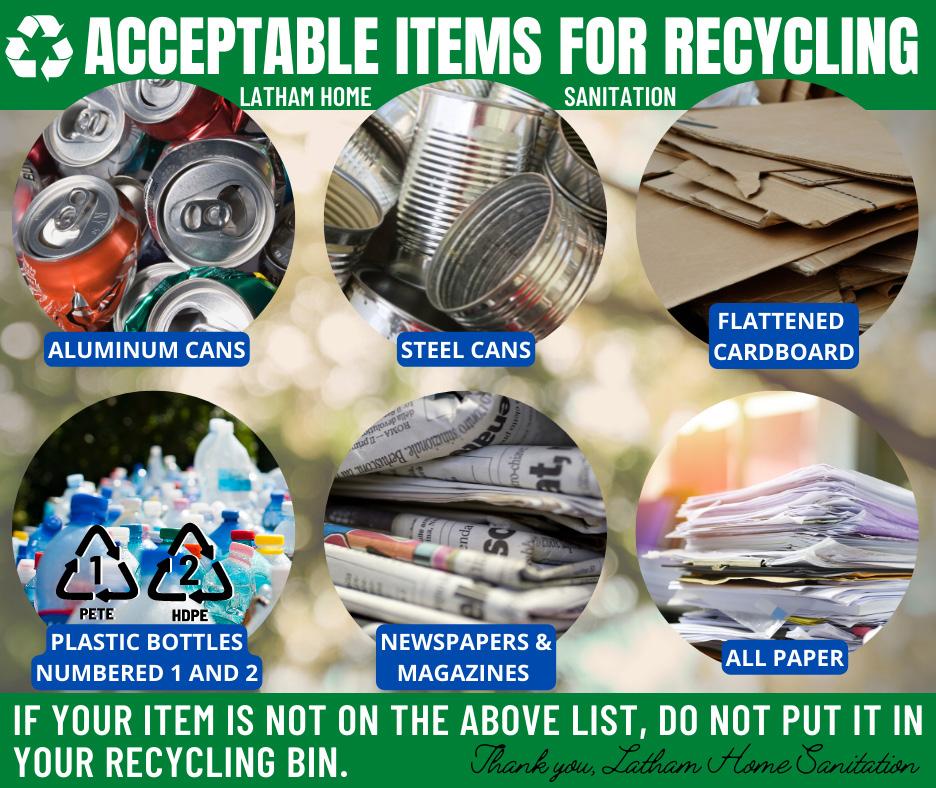
Covington provides all residents with curbside sanitation or solid-waste services through a private contractor. The service includes weekly pickup of household trash and the collection of recyclable materials. Additionally, there are two recycling and convenience center located near the Covington city limits. Although recyclable materials are collected, glass materials are not accepted (Figure 9). Covington should negotiate glass as an approved recyclable material in the next contract negotiation if it is reasonable. Providing sanitation services through a contractor has a lot of benefits, but the City needs to ensure that the contracts in place are fair and practicable regarding the price of service by renegotiating the contract in frequent intervals.

The high-quality services provided by Covington are what the residents and businesses have come to expect. As the population swells with future development and growth, the City will be expected to maintain the same services, but it will be more difficult due to rising costs. An increase in population and development suggests the need for more solid-waste pickups, more first responders, and access to more resources. This threat requires the City to take action to determine which services should be prioritized, and to determine the best route forward for maintaining first-rate services with a limited budget. Covington should perform a service expansion study as well as an organizational and compensation study to ensure resources are being used efficiently and effectively.
In the near future, Covington will provide citizens and local businesses with broadband services, and more information on this service will be available in Broadband section of this chapter.
Needs and Opportunities identified throughout the process that relate to Community Facilities and Services are on the next page.
Service delivery expansion master plan and cost analysis:
• A review of city services will assist the City by analyzing service demands that will occur as the population and the number of developments increase. The study should also include a costbenefit analysis and a forecast of revenues and expenditures for future services that are provided. Historically, local governments have been expected to be innovative and do more with less, and a study of this nature will assist with that sentiment.
Perform an organizational & compensation study:
• Doing more with less is a difficult task in local government, but it is possible with innovative leadership and dedicated employees. An organizational study will ensure that human capital resources are allocated appropriately, and that each department has the staff needed to complete tasks and provide services efficiently. Also, a compensation study will allow the City to ensure that its wages and pay-rates are competitive. Adjusting wages will give the local government the ability to attract innovative employees.
Improve landscaping and litter pickup:
• Due to the inmate contract being terminated, there has been a drastic rise in cost for litter pickup and landscaping services. The Public Works Department manages most of the landscaping and litter pick up in the City, but resources and staff capacity are limited. The City needs to partner with local organizations and develop a strategy for litter pickup and landscaping to utilize at the City’s discretion.
• Residents noted the need for historic trees near the square need to be pruned, and a few dead trees need to be removed.
Provide high-quality utility services:
• Utility services provided by Covington are a great asset to the community. The services allow users to support the local government, and the revenues keep tax rates low while paying for quality services and quality of life improvements.
• Users can also interact with local government employees when they have questions or complaints about services. This is an asset since most employees are local and are on-site in Covington.
Maintain police and fire accredited status:
• The accredited status means that the policies and procedures in place are internationally recognized, and only a handful of communities in the nation have the accredited status designation.
• This status displays that the standards and procedures for safety are highly regarded.
Maintain ISO score of 2:
• The ISO ranking in Covington is almost the best possible score that a fire department can receive. This speaks to the quality of training, performance, and infrastructure in place that is dedicated to safety and fire suppression.

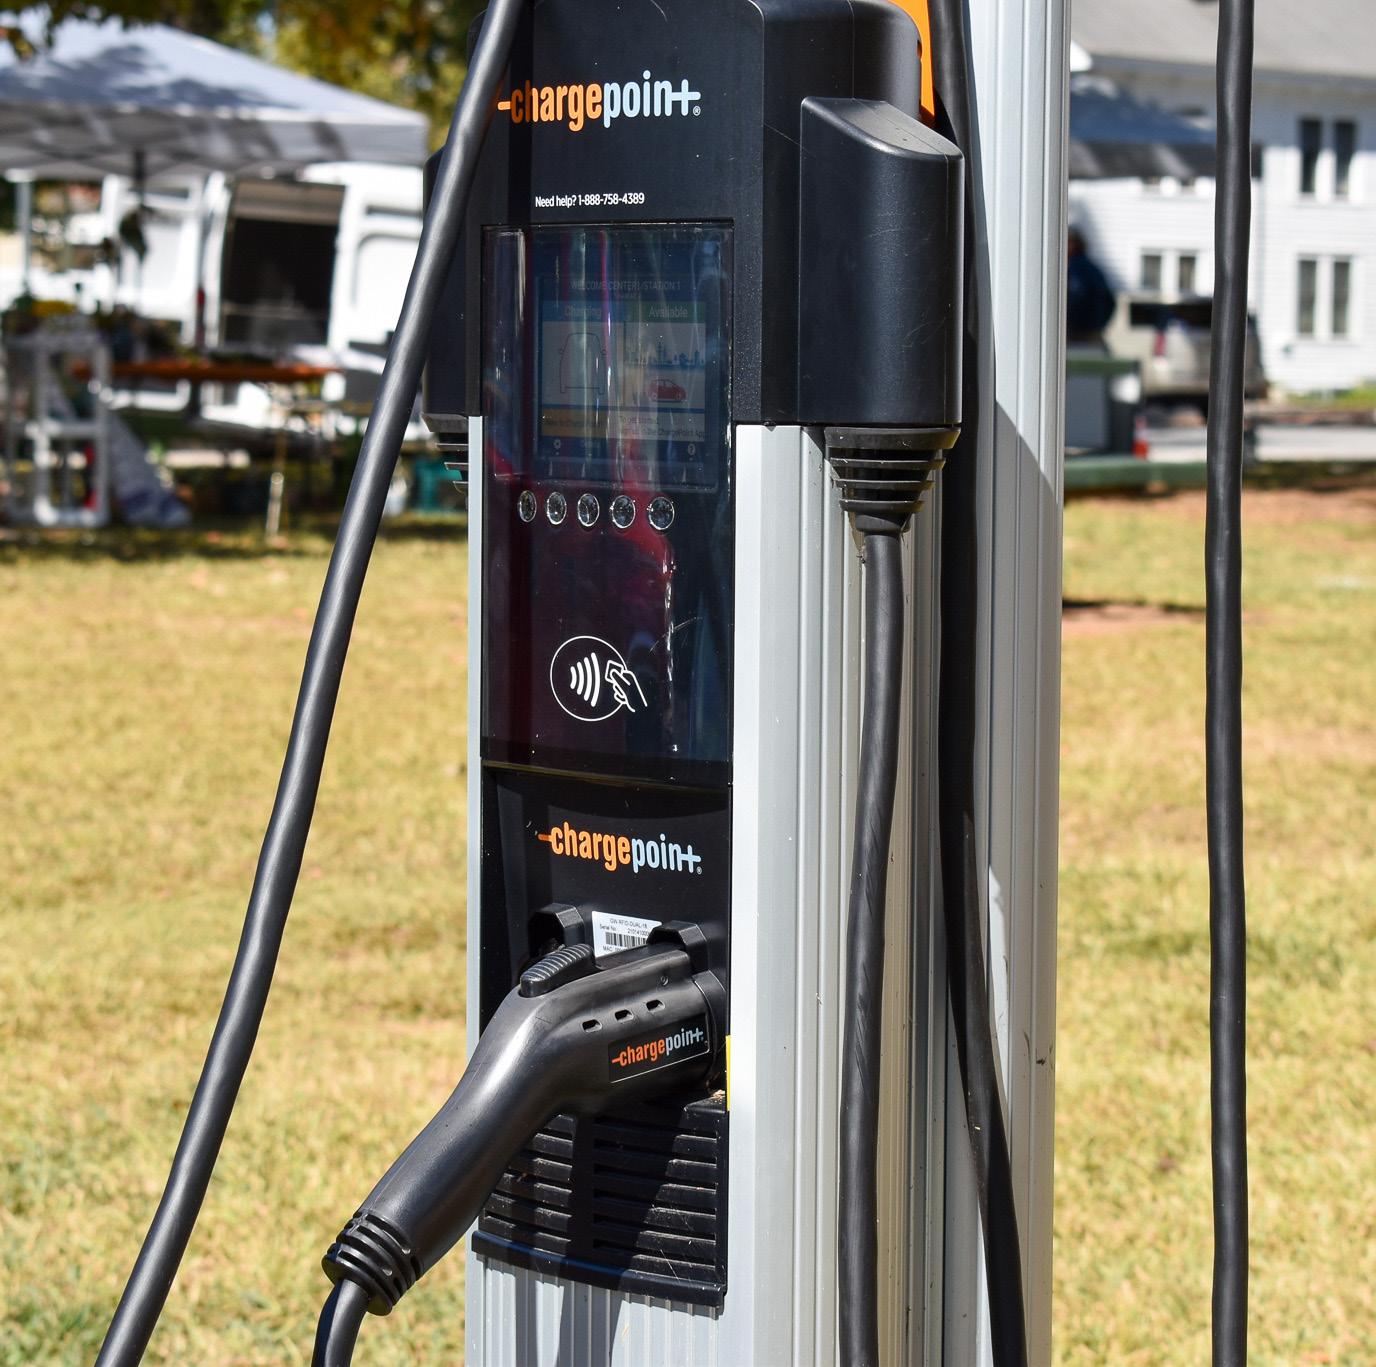
Local governments should be at the forefront of implementing and encouraging green infrastructure and sustainable policies. Local policies and initiatives have influence on how industries, residents, and services adopt sustainable practices. As technology and best practices evolve, local governments must adapt to the changing conditions and encourage local businesses and residents to adapt as well. Covington has taken steps to encourage sustainable practices by installing EV Charging Stations at public buildings, installing LED bulbs in city-owned streetlights, and providing recycling services to residents, even after recycling prices have increased in recent years. The continuation of implementing sustainable policies will be crucial to reducing waste, improving air quality, and reducing encroachment on nature. The City of Covington is committed to supporting sustainable and environmentally friendly policies and initiatives and should explore developing a Sustainability Master Plan as well as applying for a Green Community Program designation.
Needs and Opportunities identified throughout the process that relate Sustainability are on the next page.
Expand sustainability group:
• Adding personnel and a budget to sustainability the existing sustainability group can allow the City to promote and implement sustainable initiatives.
Develop a sustainability master plan:
• Developing a Sustainability Master Plan will allow Covington to understand what practices and initiatives can be set in place to reduce energy, water, and waste. The implementation of green practices leads to a greater quality of life, fosters civic pride, and sets an example for organizations and businesses throughout the community.
Evaluate energy usage at public facilities and government buildings:
• Reducing energy usage at public facilities and government buildings is a budget-friendly approach to sustainable practices. Encouraging employees to turn off lights in rooms that are not being used and changing light bulbs to LED lightbulbs will assist with reducing energy usage.
Review local zoning ordinances to determine if solar panels are appropriate:
• Some communities unintentionally have zoning ordinances that do not allow residential solar panels. Before a community promotes solar panels, it is first important to determine the extent that local ordinances address solar panels.
Incorporate the collection of glass material in the sanitation services contract:
• Covington could try and incorporate the collection of glass materials as a recyclable material that is collected in the next contract negotiation. If prices are reasonable, the City should incorporate the collection, but if prices are not reasonable then alternative solutions should be explored.
Partner with local non-profits:
• Partnering with Sustainable Newton and other local organizations will be beneficial to Covington for the education and promotion of sustainable initiatives.
Promote and encourage EV charging stations:
• As technology evolves, more and more electric vehicles will be on the roads of Covington. Ensuring those vehicles have a place to charge allows Covington to be a destination for drivers to stop and shop. Covington already has one EV charging station at the Welcome Center but installing charging stations around the downtown square could increase economic development and promote tourism.
Convert to electric fleet vehicles:
• Georgia is quickly becoming a hub for the manufacturing of renewable energy technology and electric vehicles, and lithium-ion batteries. In addition, several new EV fleet vehicle manufacturers have entered the market in recent years. Covington should explore a partnership with a manufacturer to purchase electric fleet vehicles to reduce carbon emissions. This will assist with addressing air pollution since Covington is located within a non-attainment area for Ozone 8-hour concentrations.
Utilize partnerships to expand sustainable practices:
• Covington could find and develop partnerships with organizations to expand sustainable practices. These partnerships could encourage innovative solutions that aid the City with implementing sustainability projects.
In 2018, the Georgia Department of Community Affairs launched the Georgia Broadband Deployment Initiative (GDBI) to coordinate and establish broadband programs to increase economic, educational, and social opportunities for Georgia citizens and businesses. The initiative provides for the expansion of broadband infrastructure and services through new state and local broadband planning policies.
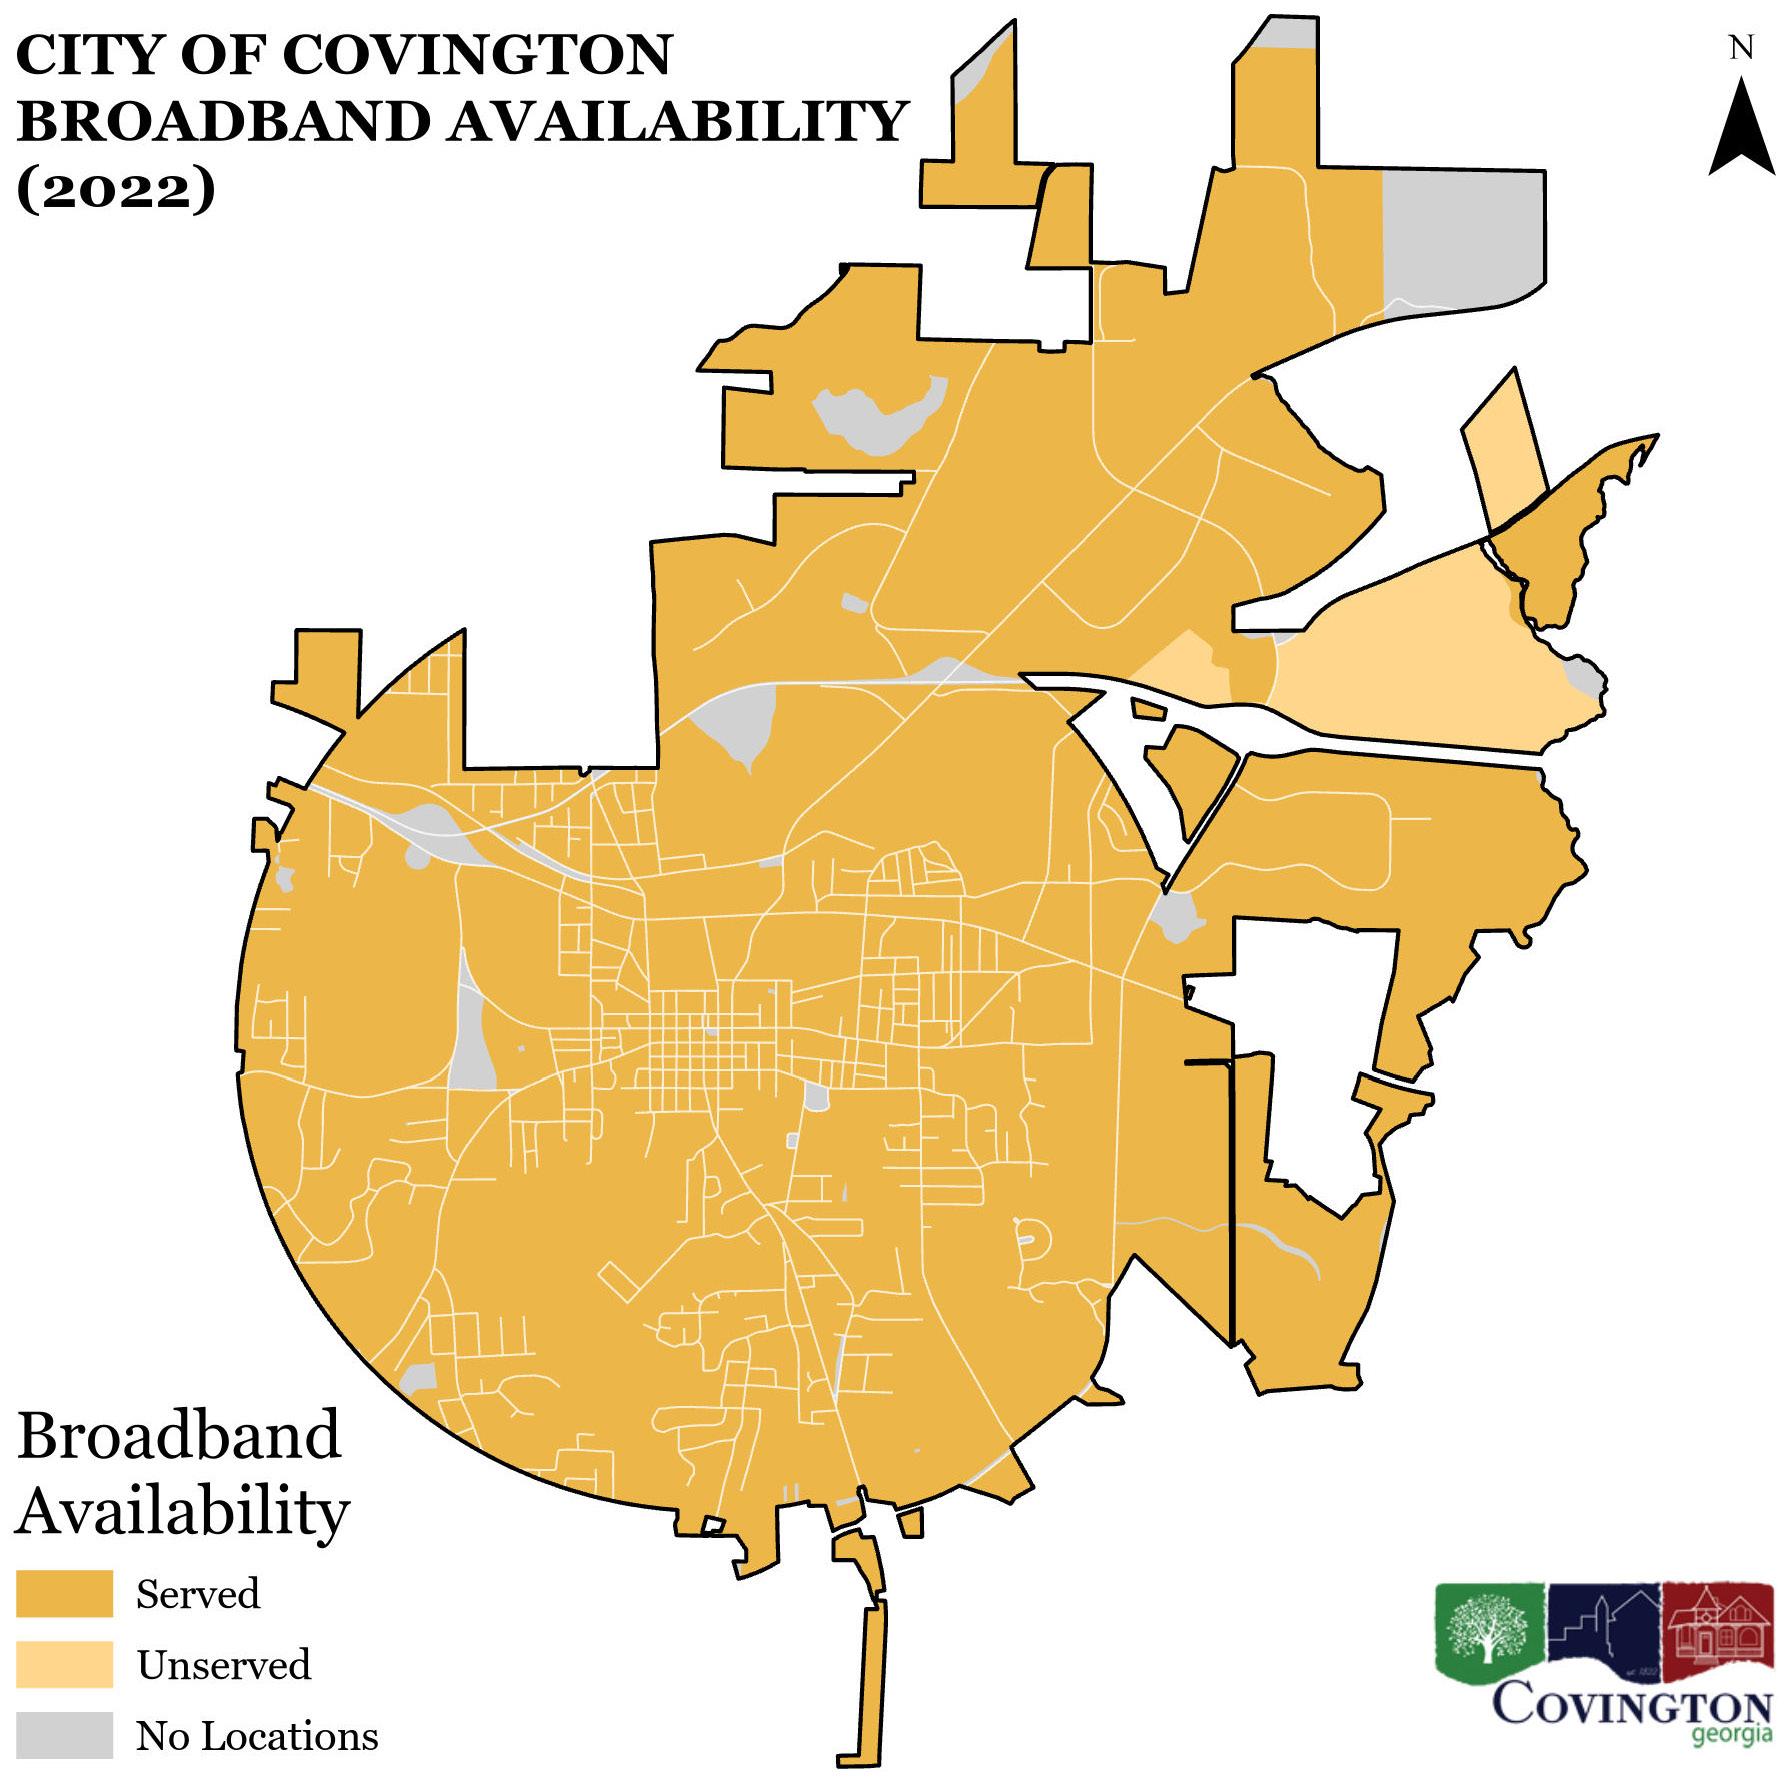
The Georgia Department of Community Affairs considers 98.7% of populated areas in the City of Covington, to be “served” by broadband (Figure 10). While the DCA map provides greater detail than federal service maps, DCA utilizes the Federal Communications Commission’s (FCC) definition of “served” as a download speed of 25 Mbps and an upload speed of 3 Mbps. This standard may be sufficient for certain kinds of digital needs, but it may not meet the speeds or bandwidth necessary for remote work, streaming content, or virtual learning. The remaining 1.3% of populated areas in the city do not meet this state threshold of broadband availability.
Survey respondents stated that there is a need to improve broadband speeds. 21% of survey respondents rated Internet services as “Poor,” while 23.4% rated the service as “Average.” Surveys also indicated broadband improvements should be a project the city accomplishes in the next five years.
The City of Covington plans to address broadband speed concerns by offering broadband as a city service through a partnership with Georgia Public Web. Covington plans to provide 1 gigabyte upload and download speeds to residential and commercial users by installing fiber optic cable throughout the city. Due to supply chain issues, city staff expects to receive most of the equipment needed for implementation by Fall 2023. However, some areas may see cityprovided broadband services by the end of 2022 due to inventory being available sooner than expected, with services targeting apartment complexes and commercial areas first. It is estimated that a majority of the city will be served with city-provided broadband by 2024-2026. The services are being funded by proceeds of the Georgia Public Web acquisition, local funds, and through available grants.
There are currently multiple commercial internet providers operating within the city, and these companies have already taken up most of the space to run fiber optic cable. This problem has led to innovative solutions by city staff, and certain sites may require special attention and creativity to be served. Commercial providers must follow proper construction protocols to install internet infrastructure, and city staff has identified a few instances where the protocols in place were not followed. The local government should explore penalizing commercial providers when city procedures are not followed.
Needs and Opportunities identified throughout the process that relate to Broadband are on the next page.
Improve internet speeds within the community:
• Internet speeds were identified as an area of improvement during the public input process. Nearly all of the city is served by broadband access, but the speeds classified as “served” do not reflect the true speeds needed to work from home, stream videos or music, or attend classes online.
Become a broadband provider:
• Providing broadband as a city service is a perfect opportunity to increase broadband speeds for residents and allows the City to profit by selling a service. Residents who purchase broadband from Covington will receive better customer service and will be provided with fast and reliable internet.
Collaboration between the City of Covington and surrounding local governments are crucial to many of the items discussed previously. Elected officials in Covington maintain an active relationship with the other local jurisdictions within Newton County and participate in a variety of county-wide initiatives. Working effectively with other jurisdictions is essential to managing cost and handling growth. A continued partnership with Newton County, the City of Oxford, the City of Porterdale, the City of Newborn, and the City of Mansfield enables Covington to make effective government investments.

Needs and Opportunities identified throughout the process that relate to Intergovernmental Coordination are on the next page.

Improvements to the Newton County school system:
• Residents and stakeholders indicated that Newton County Schools could improve. Increased collaboration with surrounding jurisdictions, local colleges and universities, and the Newton County Board of Education should be pursued to improve the community.
Collaboration with surrounding jurisdictions and organizations:
• The non-profit organization, Newton County Tomorrow, offers Covington a unique opportunity to collaborate regularly with other organizations and local governments within Newton County.
 Photo provided by the City of Covington
The Future Development Map is a representation of the community’s vision for future development and redevelopment, within the city. For each future land use category, a narrative describing the appropriate land uses and desired development patterns is included, as well as representative pictures of the type and style of development desired. It should be noted that the Future Land Use Map does not change the current zoning of any property but is intended to guide policy decisions of the Planning Department, Planning and Zoning Commission, and City Council for the next five years.
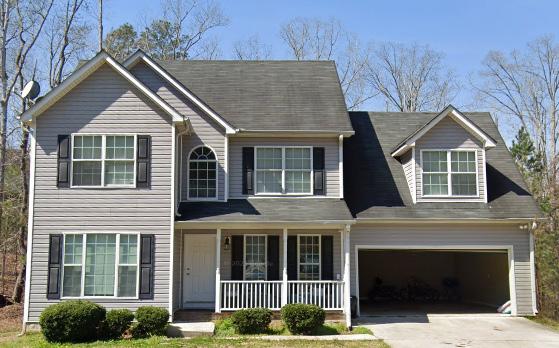

The Single-Family Residential category allocates areas that are suitable for low-density housing with densities of up to three (3) dwelling units per acre. Single-family detached housing is the most appropriate type of development for this district. Affordable workforce housing is encouraged. The minimum lot size begins at 1,800 square feet (sf).
Corresponding Zoning Districts: NR1, NR2, NR3
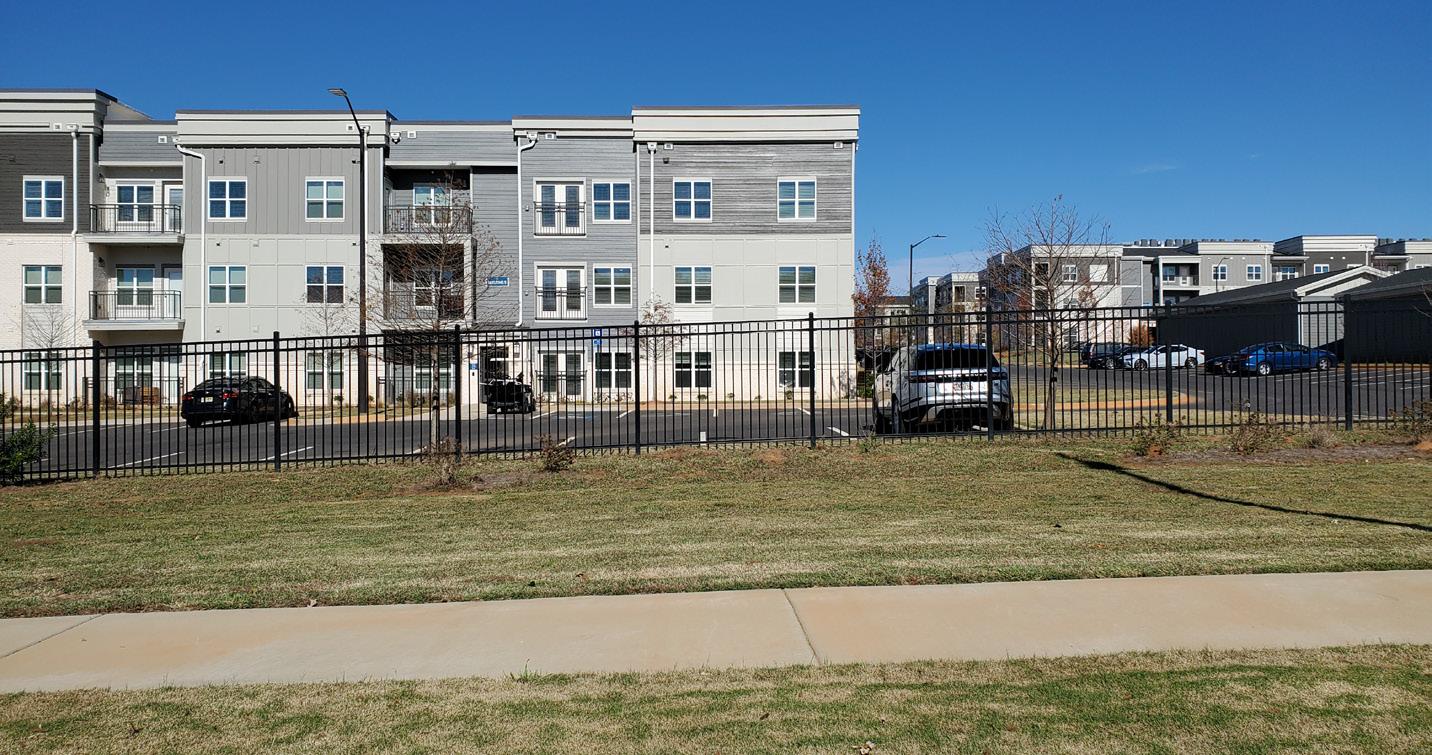
Multi-Family Residential districts are relatively compact areas located adjacent to commercial centers, employment centers, mixed-use developments, and along major corridors. These areas should also contain a transition to smaller scale housing and lower density buildings as the distance from the center increases. Apartments, town homes, or duplexes are appropriate.
Corresponding Zoning Districts: CR, TCR
Commercial land includes retail sales, restaurants, office, services, and entertainment facilities. Commercial uses may be located as a single use in one building or grouped together in a shopping center, office building, or commercial district.


Corresponding Zoning Districts: CM, NM
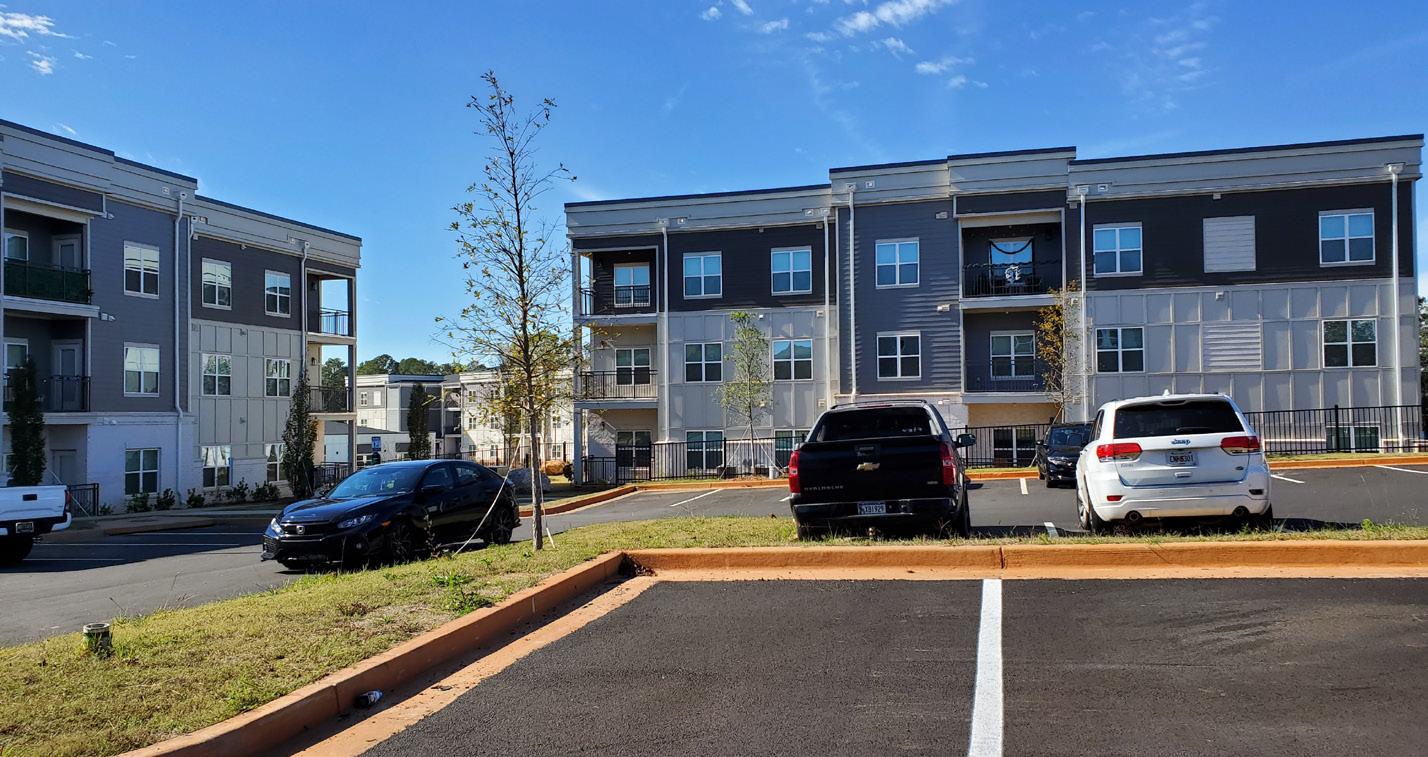
Properties that accommodate business concerns that do not provide a product directly to customers on the premises, or do not, as a primary activity involve the manufacture, storage, or distribution of products. This category includes small single-occupant structures, as well as large office parks with a variety of tenants in multi-story buildings.
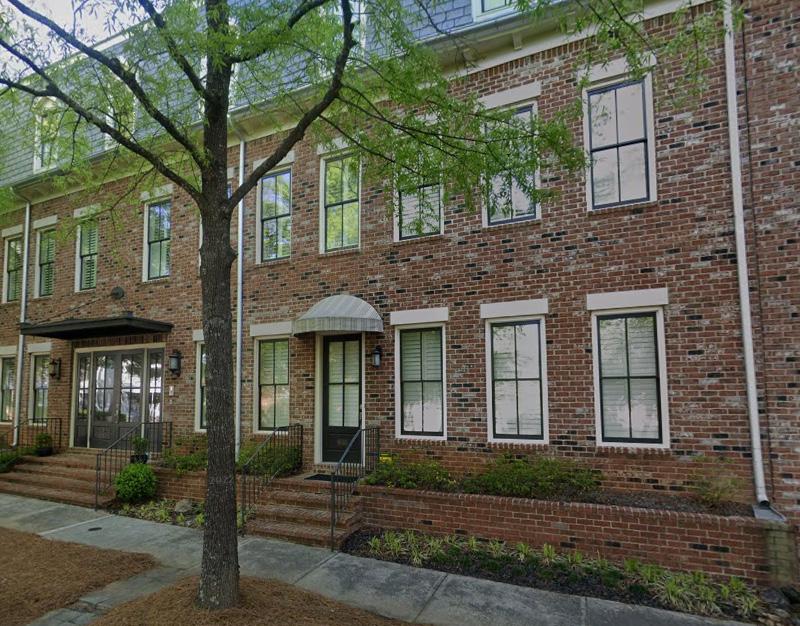
Corresponding Zoning Districts: CM, NM


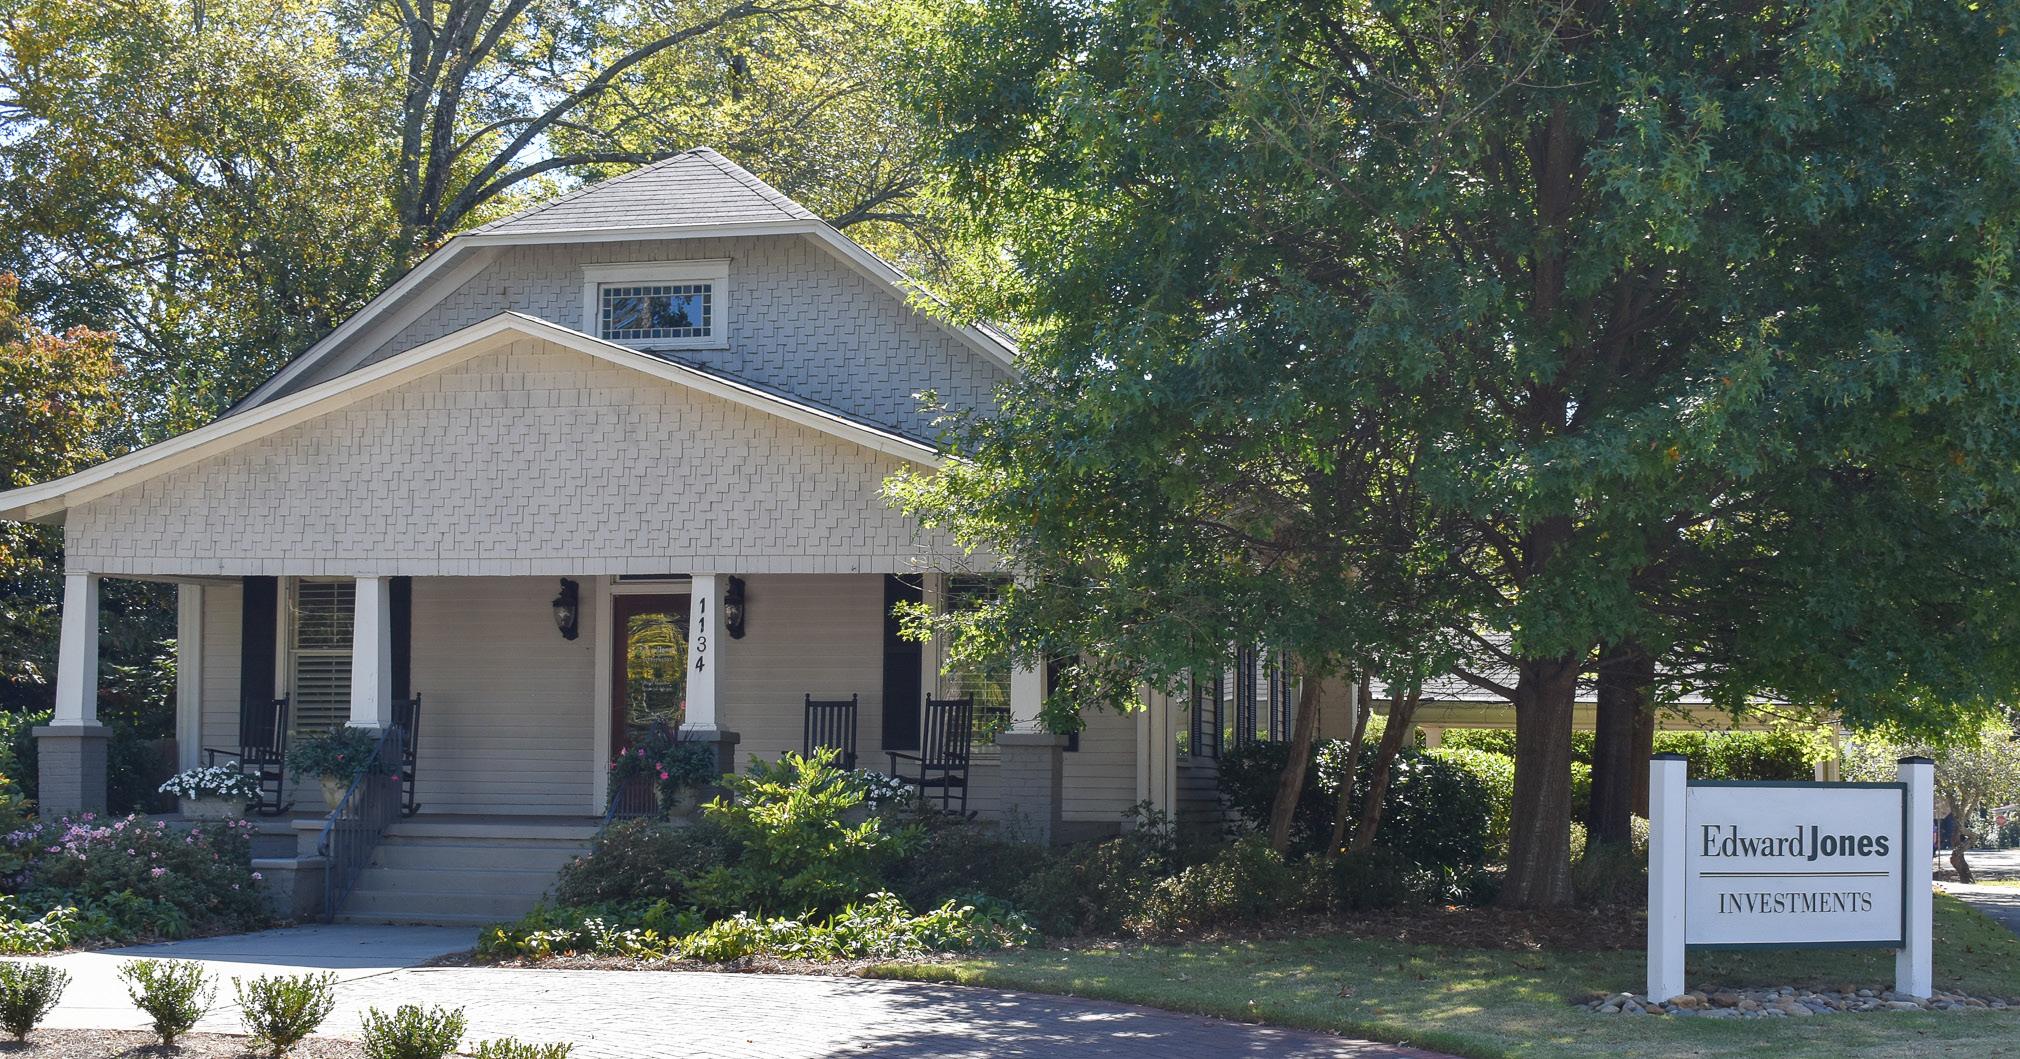
Multiple land uses within the same area, such as a blend of residential, commercial, office, and institutional uses. Located adjacent to singlefamily neighborhoods or blended within residential areas. Mixed-Use should encourage uses that are mixed vertically (on different floors of the same building) or horizontally (in neighboring buildings). Allows a variety of commercial, residential, and civic uses typically found in a lower density (less than three stories). Exact density and proposed uses depend on the site and the development type. Refer to the Covington Zoning Code for more information on appropriate development type, design, density, and percentage of mixes.
Corresponding Zoning Districts: NM

Multiple land uses within the same area, such as a blend of residential, commercial, office, and institutional uses. Located along major roads and highways such as US 278, SR 142, and SR 81. Mixed-use should encourage uses that are mixed vertically (on different floors of the same building) or horizontally (in neighboring buildings). Allows a variety of commercial, residential, and civic uses typically found in medium density areas. Exact density and proposed uses depend on the site and the development type. Refer to the Covington Zoning Code for more information on appropriate development type, design, density, and percentage of mixes.
Corresponding Zoning Districts: CM
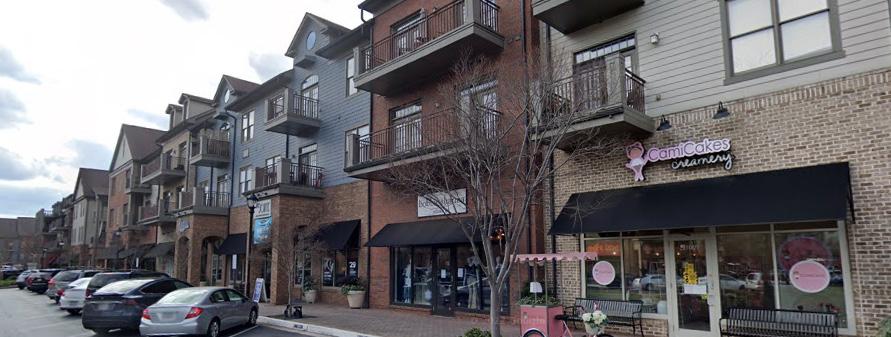
Multiple land uses within the same area, such as a blend of residential, commercial, office, and institutional uses. Located near or in close proximity to the Covington downtown square. Mixed-Use should encourage uses that are mixed vertically (on different floors of the same building) or horizontally (in neighboring buildings). Allows residences, retail, goods and services, and office uses typically found at a higher density. Intended to satisfy the common and frequent needs of the City’s commercial core. Exact density and proposed uses depend on the site and the development type, and generally these developments include buildings up to the street, walkability, and maintain historic character. Refer to the Covington Zoning Code for more information on appropriate development type, design, density, and percentage of mixes.


Corresponding Zoning Districts: TCM
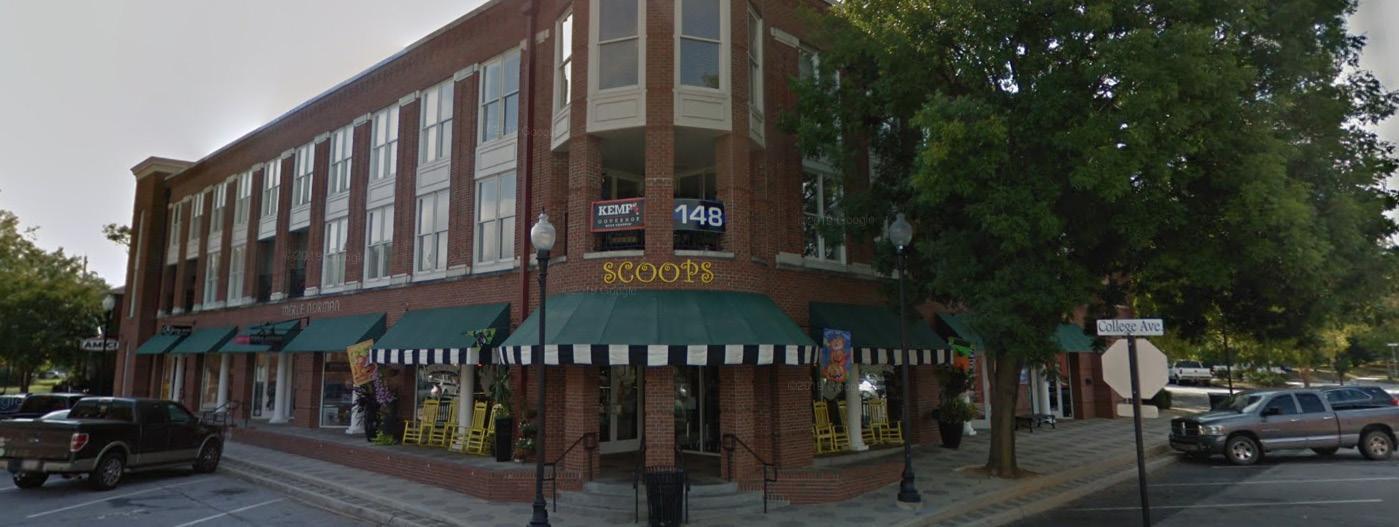
Industrial land includes land dedicated to warehousing, wholesale trade facilities, manufacturing facilities, processing plants, factories, mining or mineral extraction facilities or other similar uses.
Corresponding Zoning Districts: M1, M2
Federal, state, local, and institutional land uses. Uses such as government offices, public safety posts, libraries, schools, religious institutions, cemeteries, and hospitals are representative.

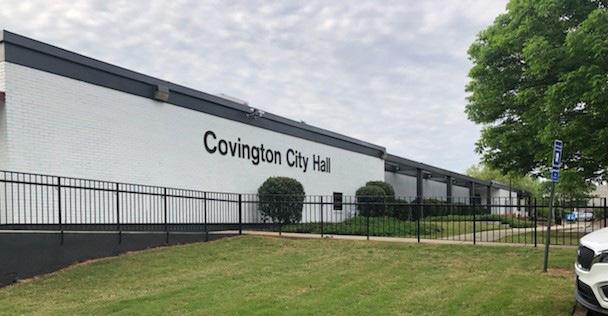
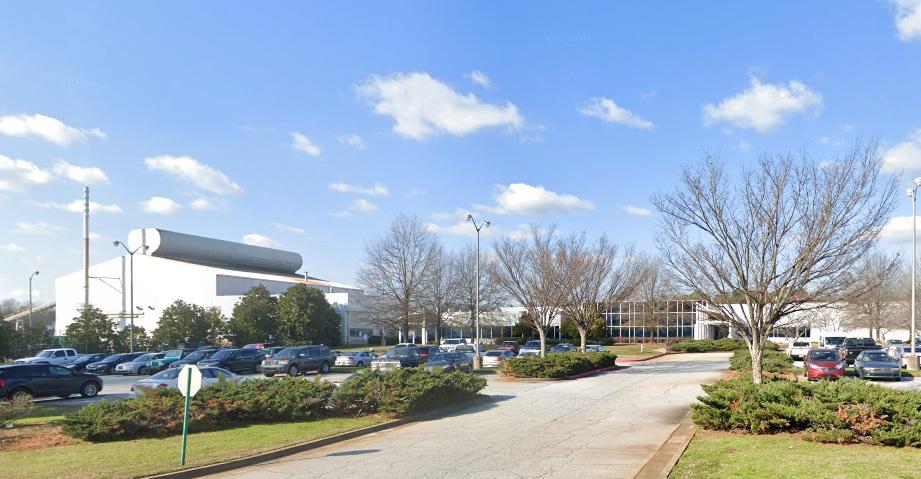
Corresponding Zoning Districts: All Districts

Areas used for transportation, communication, or utility-related activities, such as power generation plants, sewage and water treatment facilities, landfills, railroad facilities, radio towers, public transit stations, telephone switching stations, airports, or similar uses.
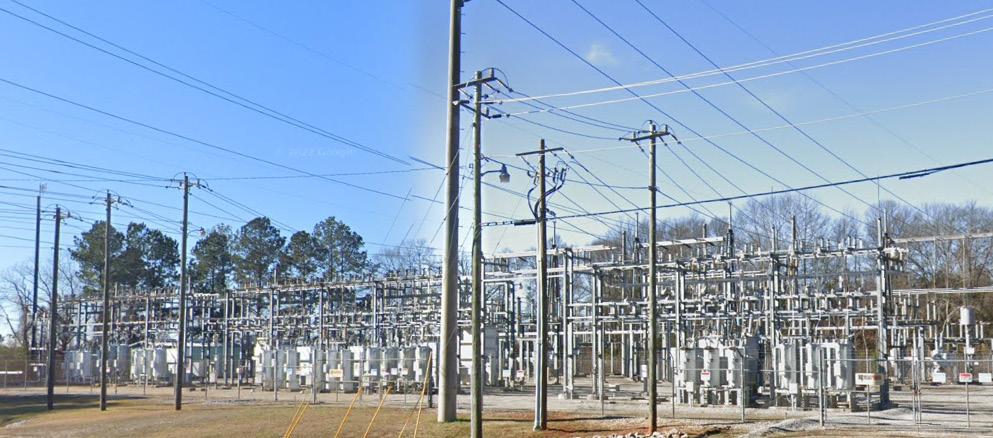
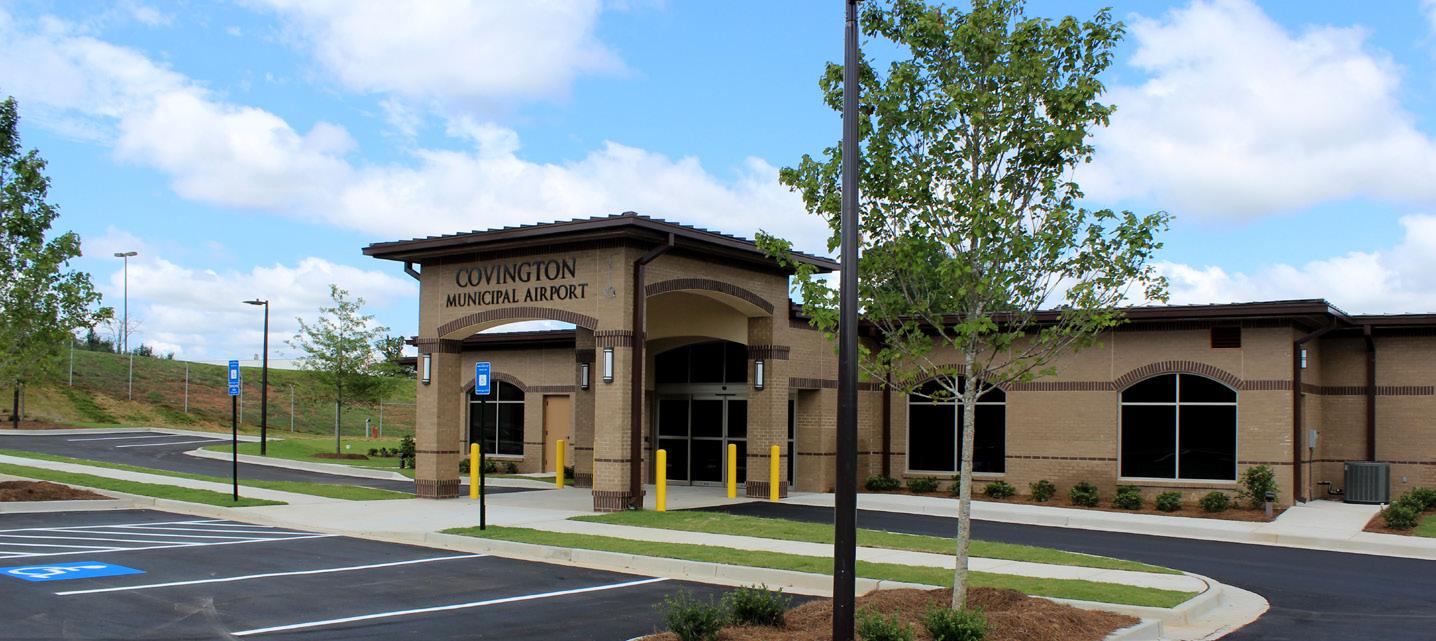
Corresponding Zoning District: All Districts
Parks / Recreation / Conservation land is dedicated to active or passive recreational uses and natural resource conservation. These areas may be either publicly- or privately-owned and may include playgrounds, public parks, nature preserves, wildlife management areas, national forests, golf courses, recreation centers, or similar uses. Conservation subdivisions may also include some land preserved as greenspace or recreational land through easements.

Corresponding Zoning District: All Districts

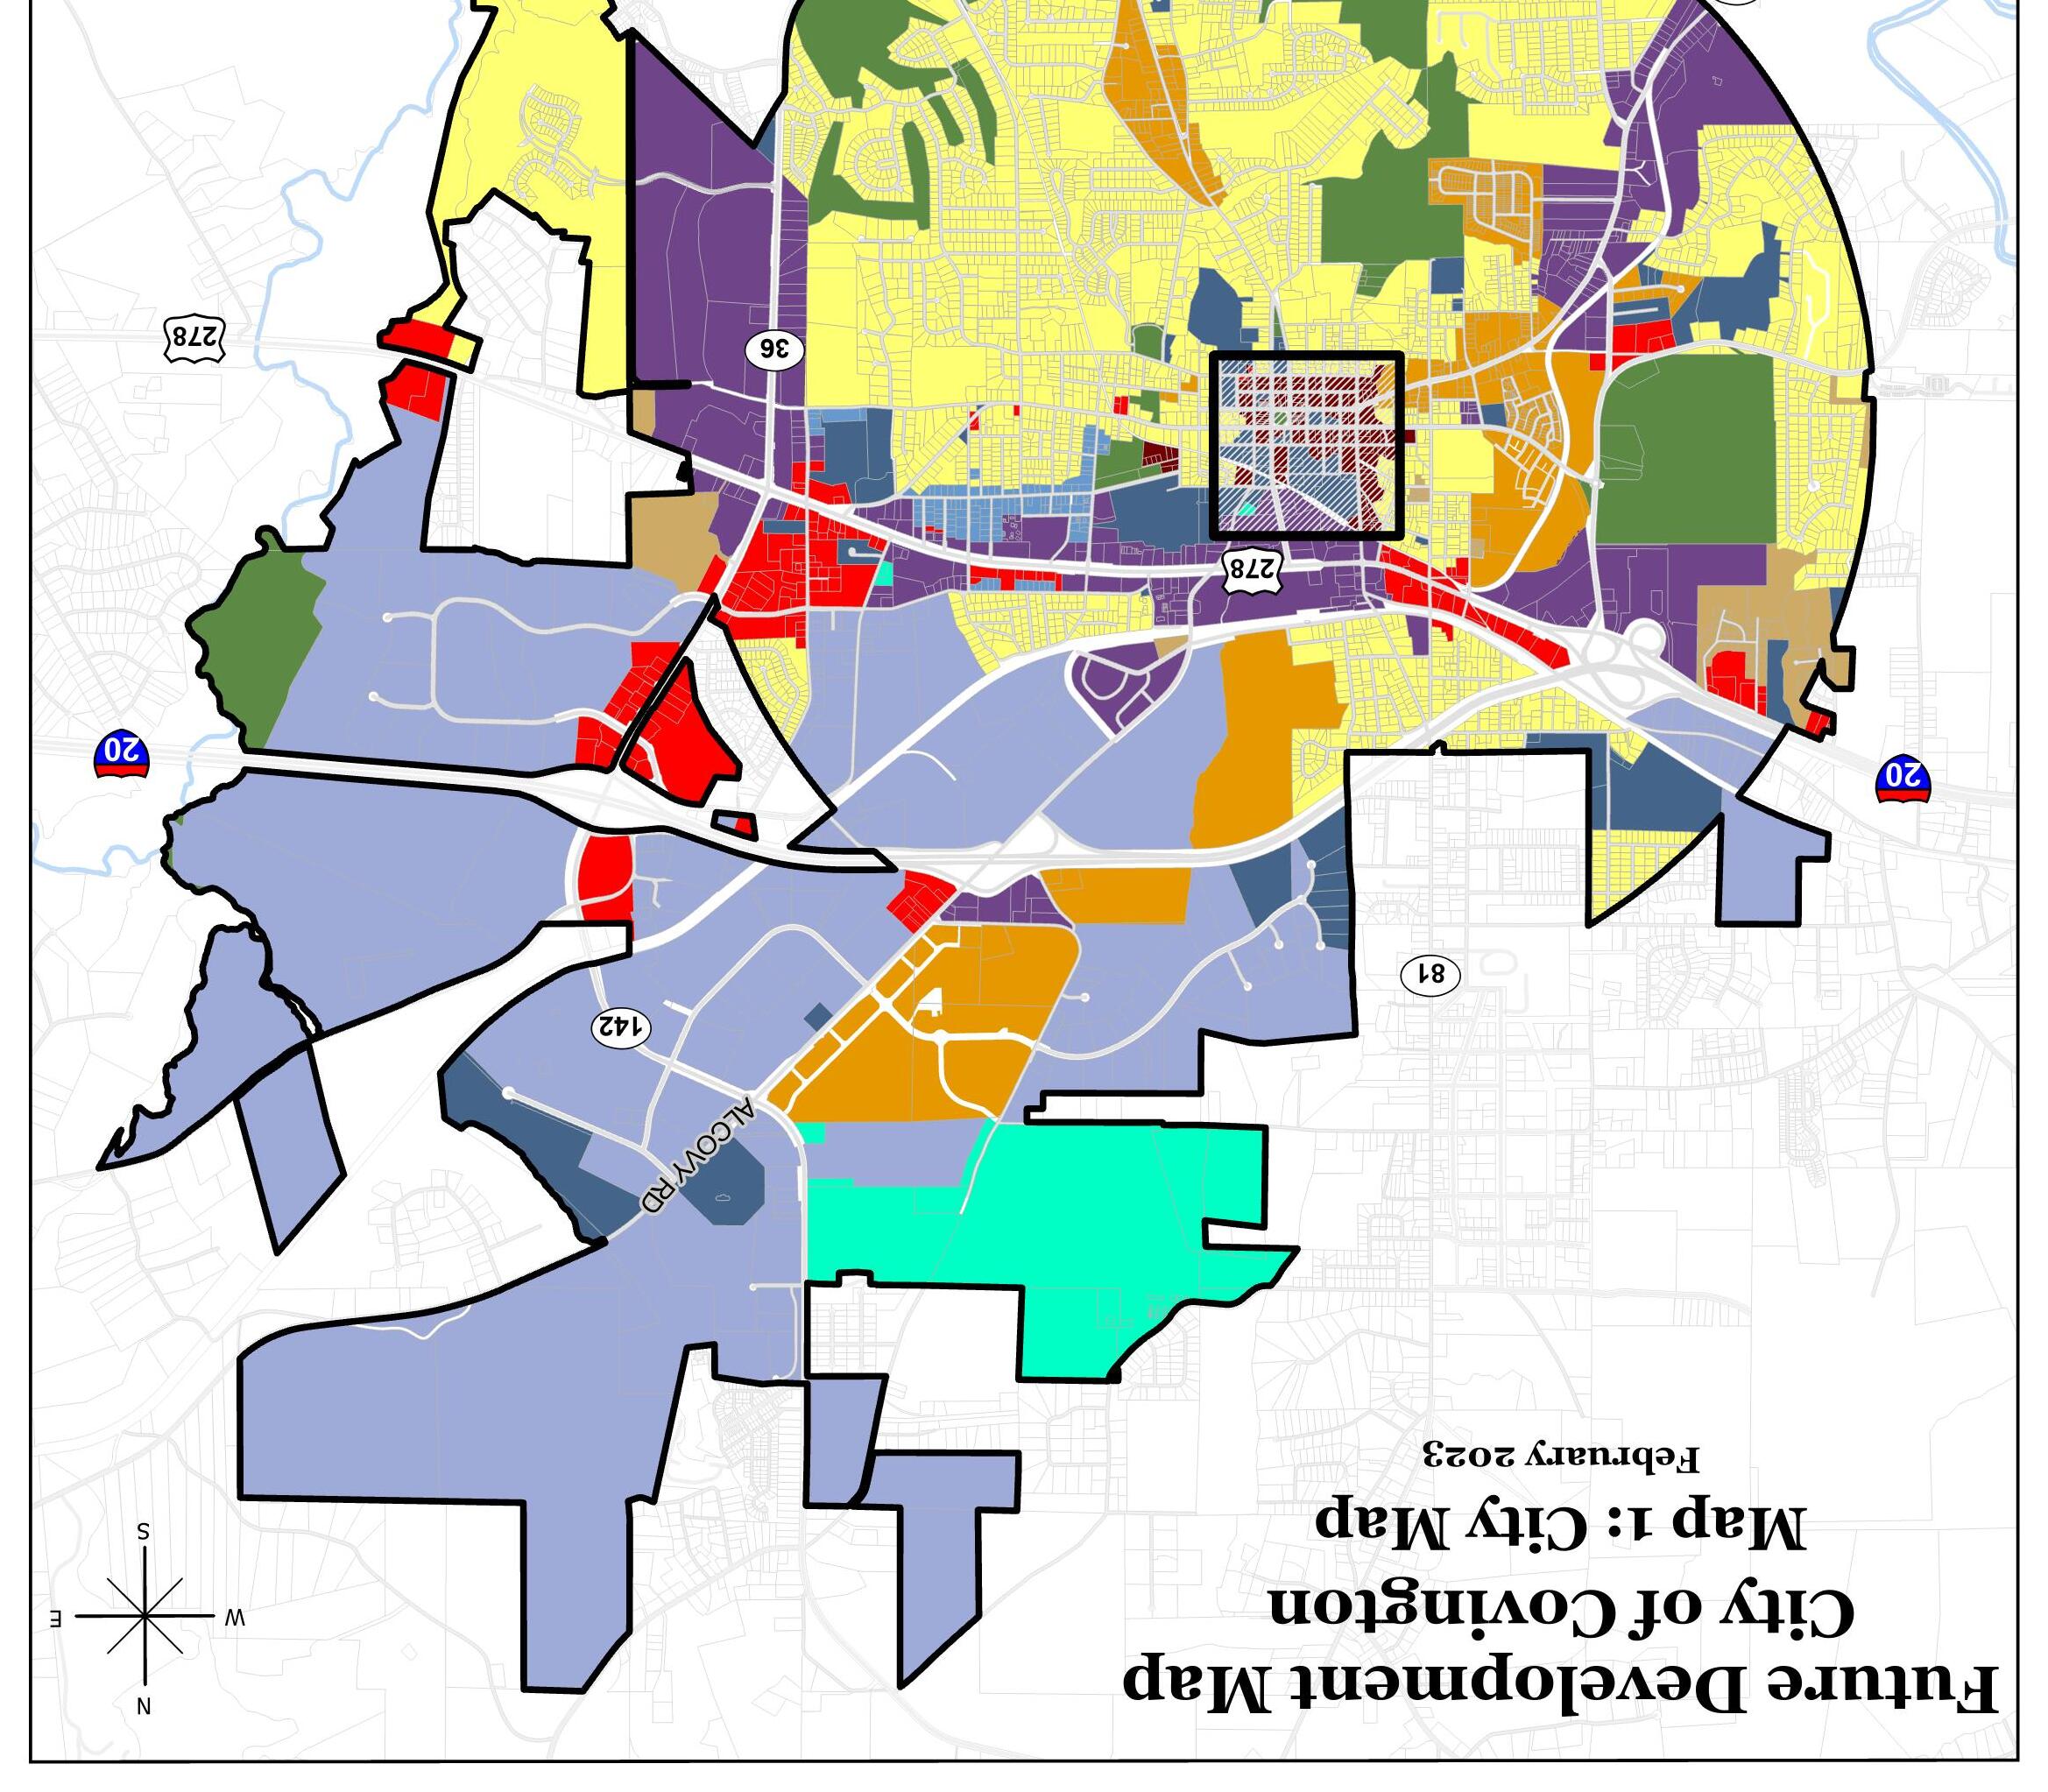
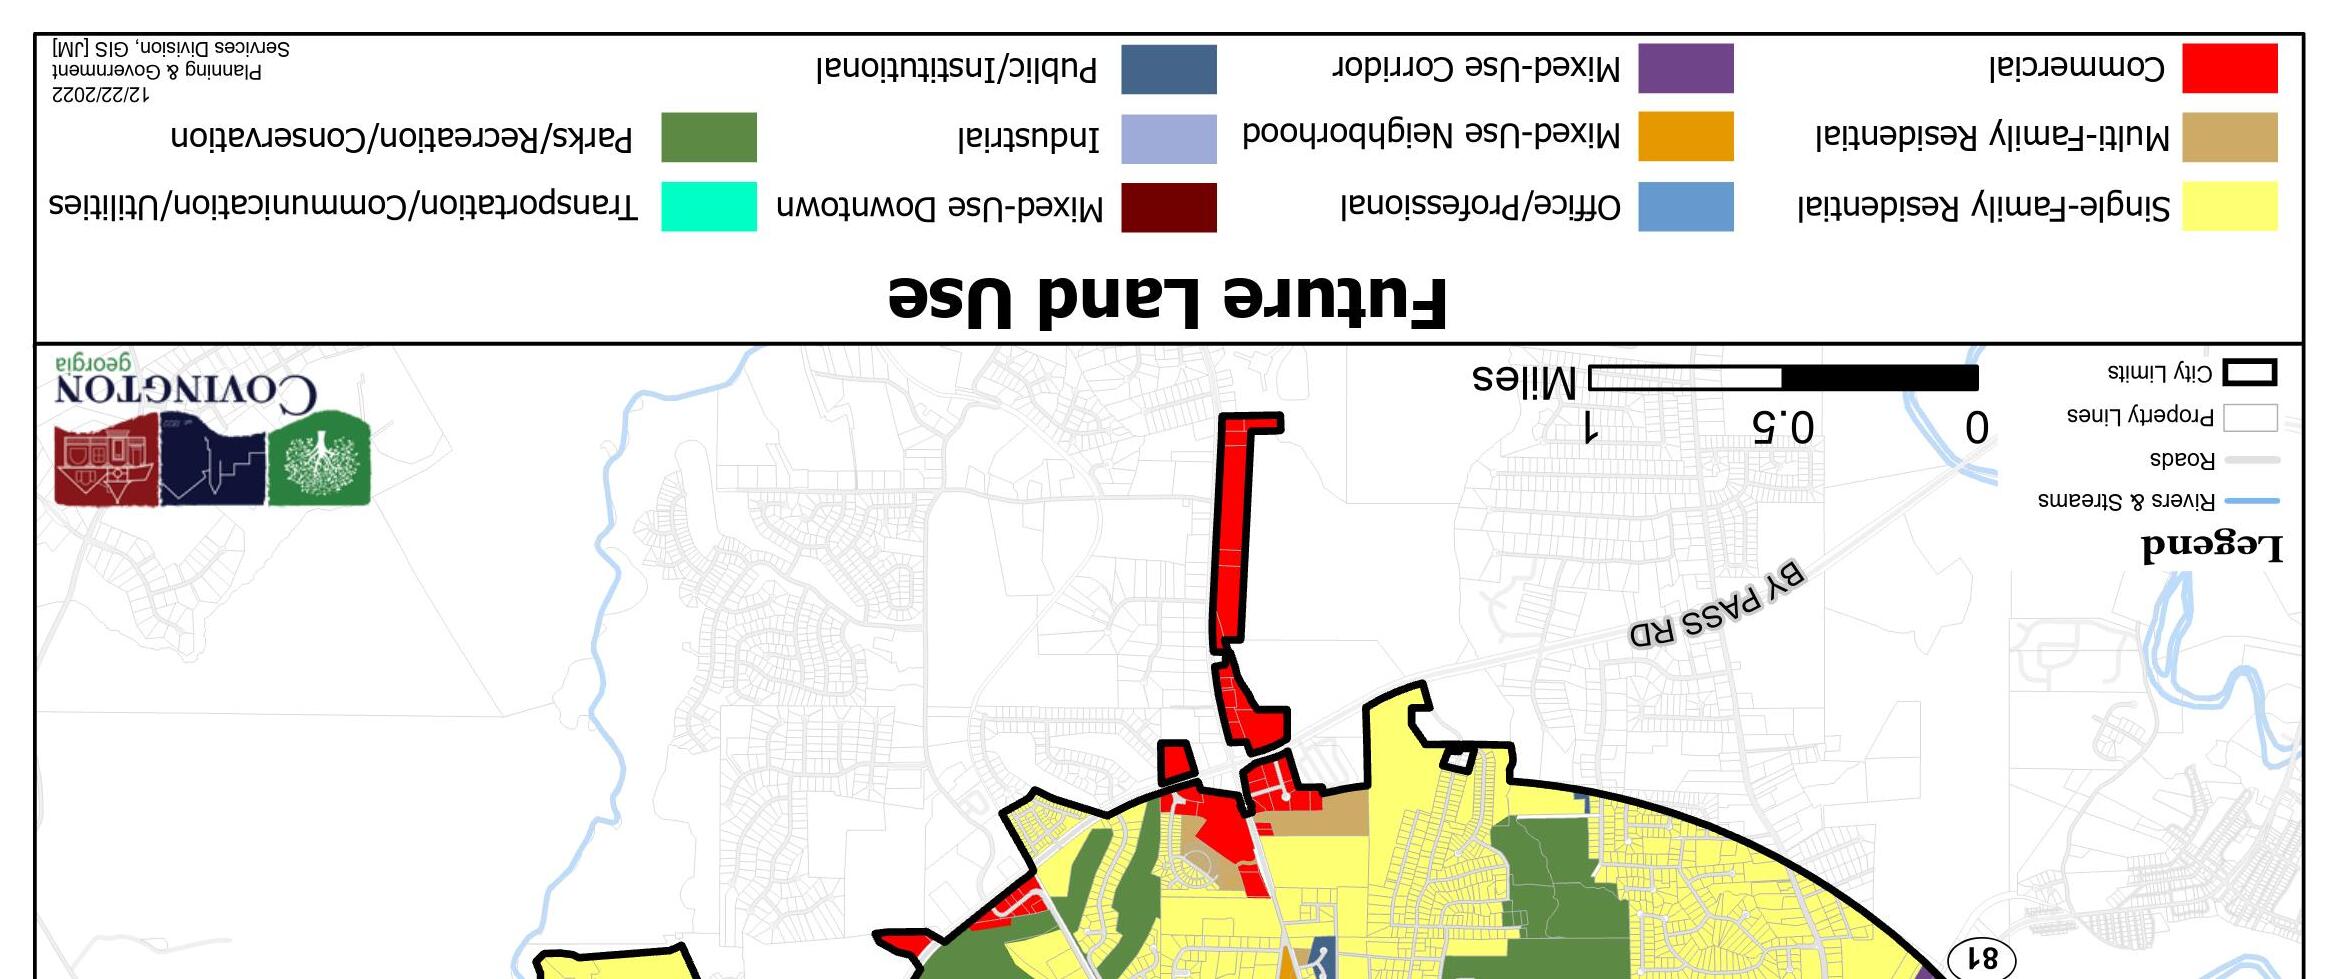

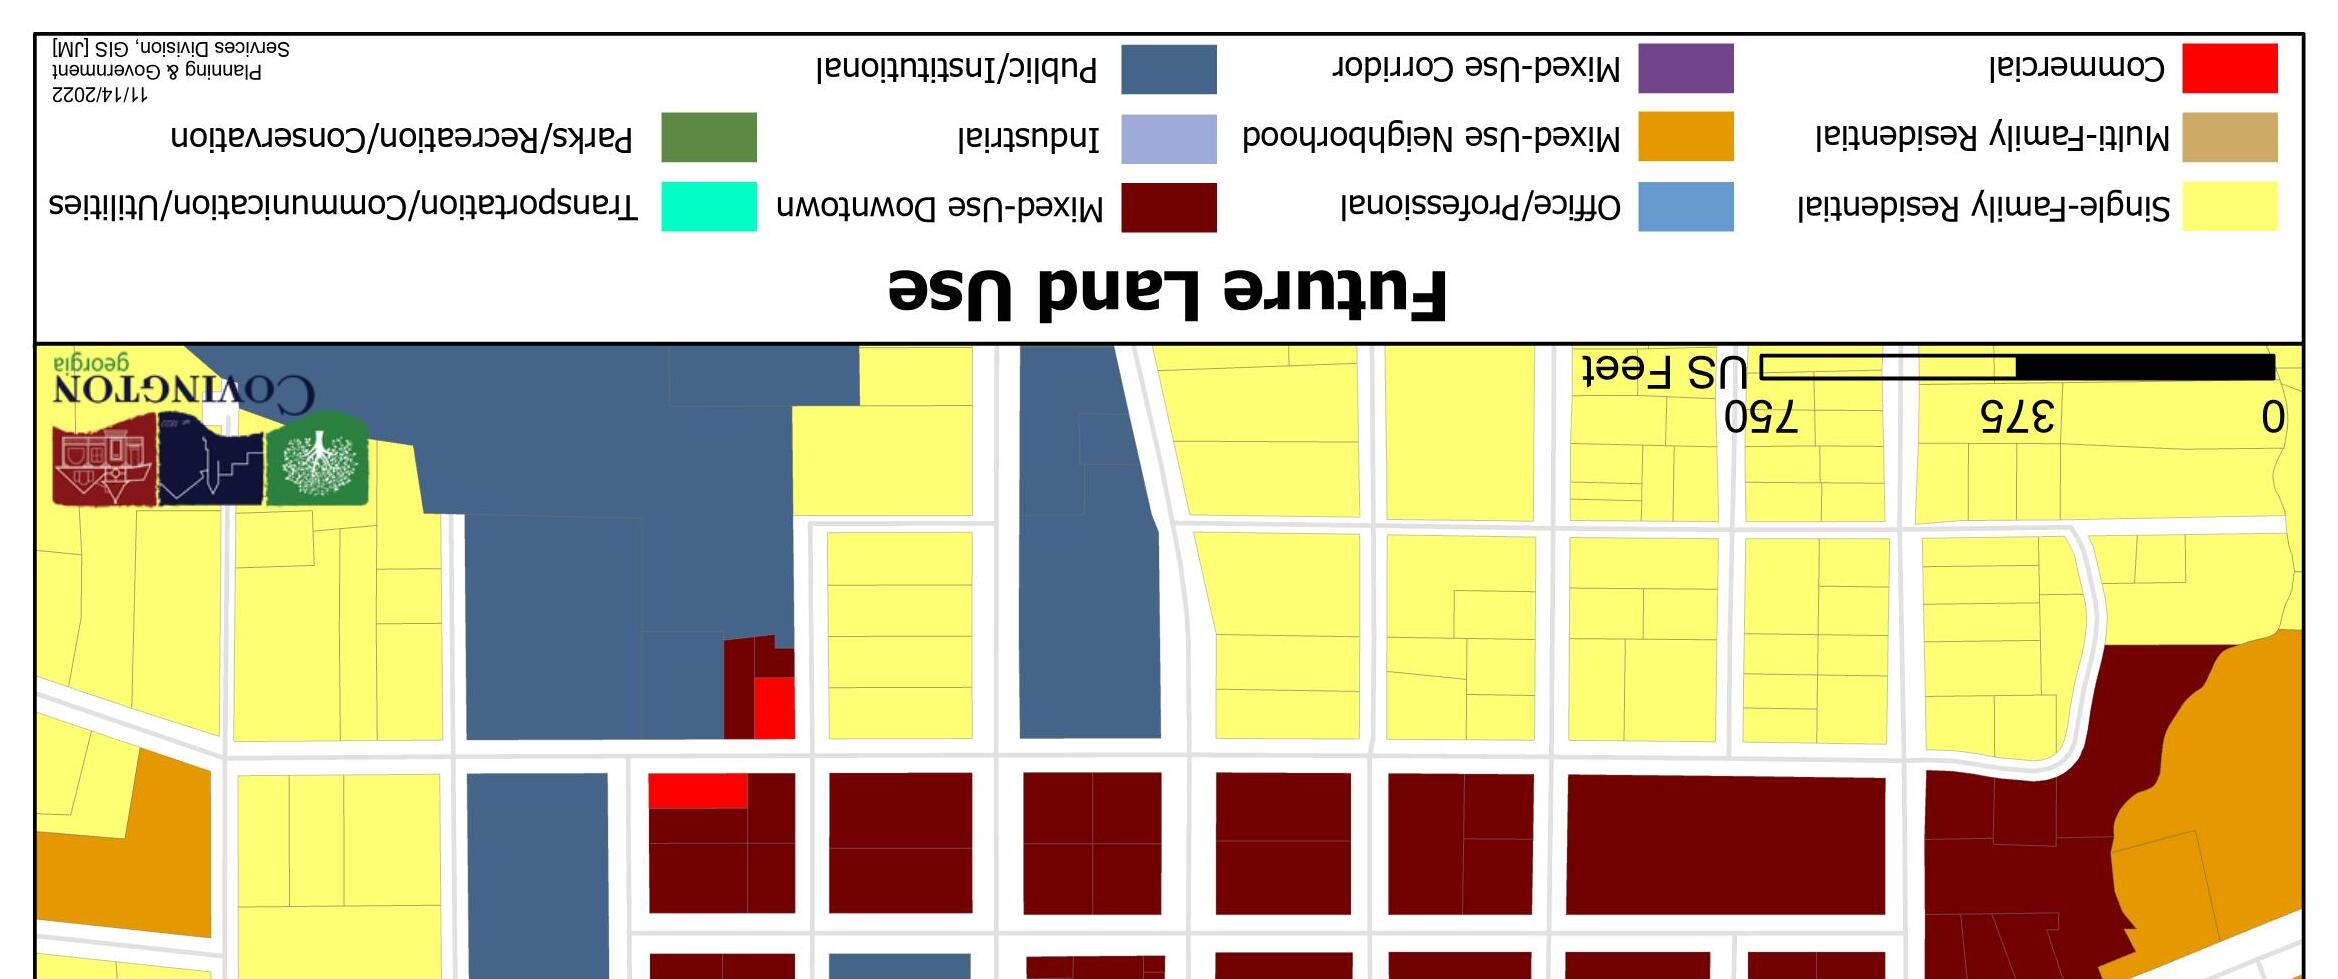
 Photo provided by the City of Covington
The Department of Community Affairs requires a transportation element for any local government whose jurisdiction falls within a Metropolitan Planning Organization (MPO) boundary. The City of Covington is located within the Atlanta MPO; the transportation objectives for the region’s transportation plan are listed below. The transportation objectives are categorized under two overarching goals: having world-class infrastructure and having healthy, livable communities. These objectives are achieved through categorical recommendations of development patterns found in the regional Unified Growth Policy Map. Refer to the Atlanta Region’s Transportation Plan for more information. In addition, this chapter provides an analysis of local transportation infrastructure to provide more specific planning context for the community in relation to local and regional goals.
*Bolded items indicate high priorities within the community.
Transportation Objectives and Policies for Atlanta MPO
World Class Infrastructure
• Maintain and operate the existing transportation system to provide for reliable travel
• Improve transit and non-singleoccupant vehicle options to boost economic competitiveness and reduce environmental impacts
• Strategically expand the transportation system while supporting local land use plans
• Provide for a safe and secure transportation network
• Promote an accessible and equitable transportation system
• Support the reliable movement of freight and goods
• Foster the application of advanced technologies to the transportation system
• Improve quality of life at the neighborhood, city, county, and regional levels
• In partnership with local communities, equitably and strategically focus resources in areas of need and importance
• Improve public health through the built environment
• Integrate sound environmental principles that ensure the region’s sustainability
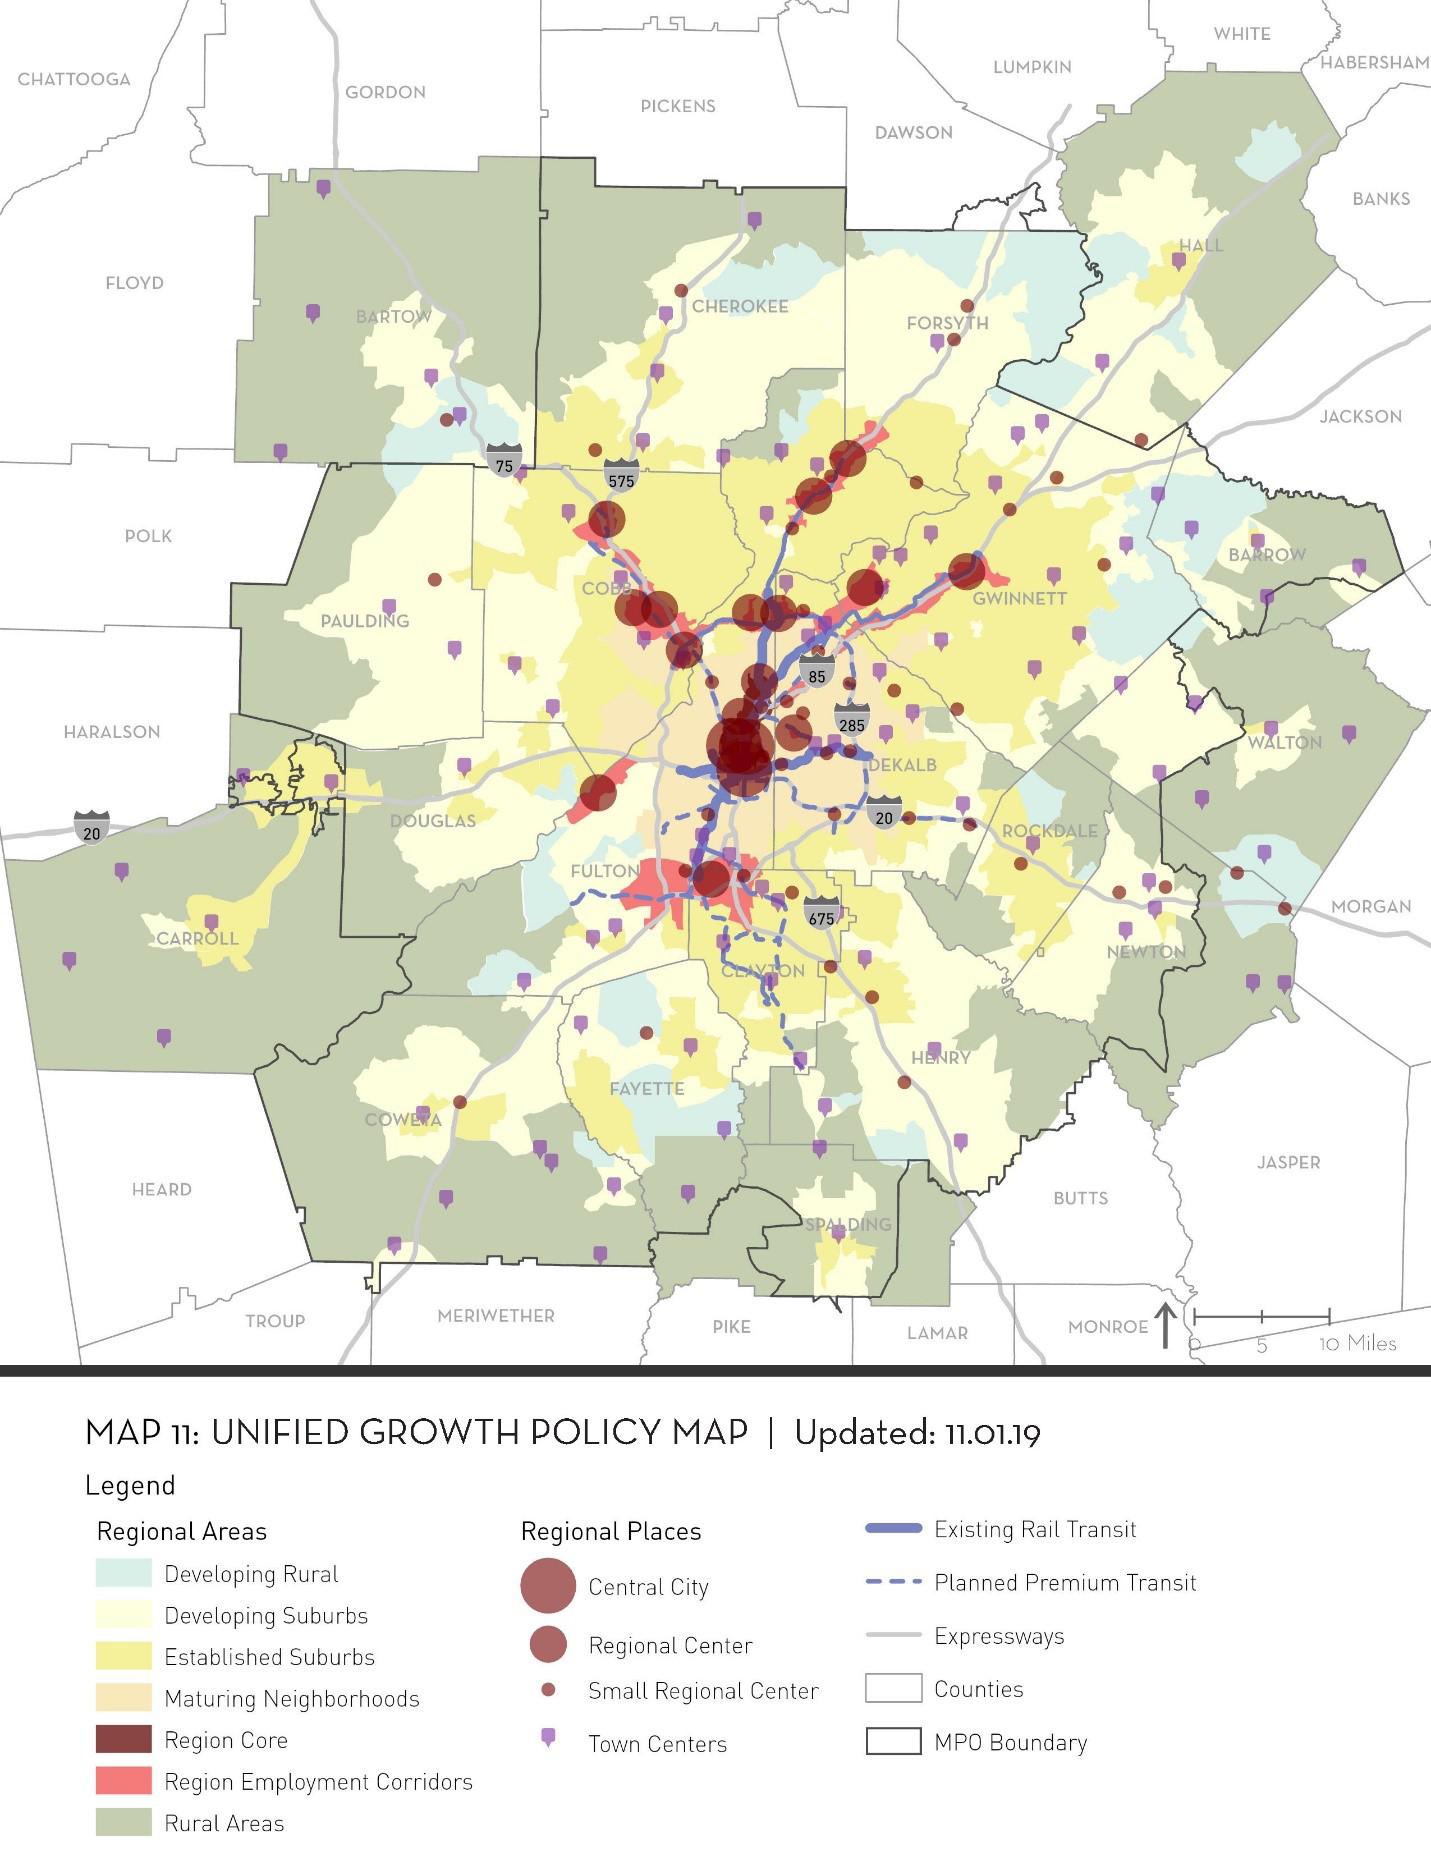
The Atlanta Region’s Transportation Plan provides a Unified Growth Policy Map (UGPM) that provides for direction of future growth in the region (Figure 11). The UGPM is comprised of Areas and Places. Areas describe predominant land use patterns throughout the region, and directly influence the future forecasted growth of the region by describing future land use patterns in each part of the region. Places reflect concentrated uses that have generally defined boundaries and provide greater detail within areas. The map indicates that three distinct growth Areas are found in Covington: Established Suburbs, Developing Suburbs, and Rural. These growth areas will be updated for Covington and Newton County in 2023. The Transportation Plan describes these growth Areas as:
Established Suburbs are areas in the region where suburban development has occurred. These areas are characterized by singlefamily subdivisions, commercial development, and office, industrial, and multifamily development in limited locations. With few remaining large parcels for additional development, these are the areas in which the region may see the least amount of land use change outside of retail and commercial areas. Preservation of existing single-family neighborhoods is important, and wholesale change will most likely not occur in those single-family subdivisions that make up most of these areas. However, infill and redevelopment will occur in the limited commercial areas.
Developing Suburbs are areas in the region where suburban development has occurred, and the conventional development pattern is present but not set. These areas are characterized by residential development with pockets of commercial and industrial development. These areas represent the extent of the urban service area, and the region’s first attempts at suburban smart growth can be found in these areas. There is a need in these areas for additional preservation of critical environmental, agricultural, and forest resources. Limiting existing infrastructure in these areas will constrain the amount of additional growth that is possible.
Rural Areas are areas in the region where little to no development has taken place and where there is little development pressure. These areas are characterized by sporadic large single-family lots, agricultural uses, protected lands, and forests, and they represent the limits of the urban service area in metro Atlanta. There is a desire by many residents and elected officials in these areas to keep them rural in character. Increased development threatens existing rural economic uses. The region is striving to protect these areas by limiting infrastructure investments to targeted areas. There will be a continued need to maintain existing transportation infrastructure, but care should be taken not to spur unwanted growth by inappropriate expansion of infrastructure capacity.
Covington is an active LCI Community, which allows access to grant funding from the Atlanta Regional Commission to create vibrant and walkable communities. The LCI program has invested $312 million in more than 120 communities throughout the Atlanta region, including the City of Covington. The funding assists communities with planning studies as well as the construction of transportation projects such as sidewalks and intersection improvements. In 2022, The 278 CID received $1,017,280 in funds for Phase II of the Hwy 278 Trail and Safety Improvements. As an LCI community, Newton County and the City of Covington will need to collaborate frequently with the Atlanta Regional Commission on transportation improvements.
Covington’s transportation network supports a variety of modes. From Interstates, Federal Highways, and State Routes to an airport, trails, and rail; Covington has many transportation options. However, a majority of the network is designed exclusively for automobiles. This section is dedicated to the needs and opportunities outlined by the public, steering committee, and local government regarding transportation.
Sections of Interstate 20 are located within the city limits along with U.S. Hwy 278, SR 81, SR 142, and SR 36. With an interstate, state and federal highways, major freight rail access, and a well-maintained local road network, Covington’s automobile and commercial transportation infrastructure suffers only from congestion associated with urbanized areas. When asked about traffic concerns within the city, around 50% of the survey respondents stated that there are predictable peaks in traffic, and 28% reported that they sometimes get stuck in severe congestion. Residents and visitors of the community noted that problem areas include Hwy 278, the downtown square, and Bypass Road.
From 2017-2021, there were 4,381 reported crashes in the community, with 1,533 reported injuries, and 16 fatalities (GDOT Traffic Data). Most of the crashes took place along the major arterials, major collectors, and within the downtown square. On average, between 28,000 and 31,700 cars drive on U.S. Hwy 278 daily (GDOT Traffic Data). With the expected increase in population and development, the city will need to prepare to resurface heavily trafficked roads more frequently. Covington should utilize the Pavement Preservation Plan to budget and implement the maintenance of local roads.
The HWY 278 CID Master Plan will implement strategies to reduce traffic accidents with reported injuries and fatalities by redesigning intersections and installing traffic circles along the U.S. 278 corridor.
The CID project is a multi-governmental partnership between the City of Covington, Georgia Department of Transportation, and Newton County. The project is divided into multiple phases with Phase I and Phase II planned to be implemented over the next five years. Phase I spans from Exit 90 to Emory Street and Phase II extends from Emory Street to Hospital Drive. Phase I of the master plan is estimated to be completed in 2026-2027, with construction starting in Fall of 2024. Work items in Phase I include designing the corridor, acquisition of land, landscaping, installation of streetlights, relocation of utility poles, and the installation of mobility infrastructure. Phase II is expected to begin in 2023-2024 which will include designing the corridor, land acquisition, and utility relocation. The City of Covington and Newton County committed to supporting Phase I and Phase II of the project.
The work and progress being completed by the CID team, city staff, and county staff generated the idea to eventually expand the CID to include arterial roads such as Turner Lake Road, Washington Street, City Pond Road, and other major connectors throughout Covington. An increased focus on major connectors can increase safety, walkability, and connectivity, while spurring development and increasing the usability. Survey respondents and local leaders highlighted the need for improvements on Turner Lake Road and Washington Street.
The Traffic and Parking Assessment identified a variety of improvements within the town center and immediately outside of the downtown square. These improvements relate to parking, intersection design, walkability, and cycling infrastructure. The plan outlines short- and longterm projects and action items that should be implemented between the years 2023-2028.
Throughout the planning process, alternative modes of transportation were mentioned by the public, steering committee, and city staff. The public survey reported that 26% of the respondents believe that it is unsafe or inconvenient to travel without a car, but 65% of the respondents reported that the community is safe, comfortable, and inviting for people to walk or bike.
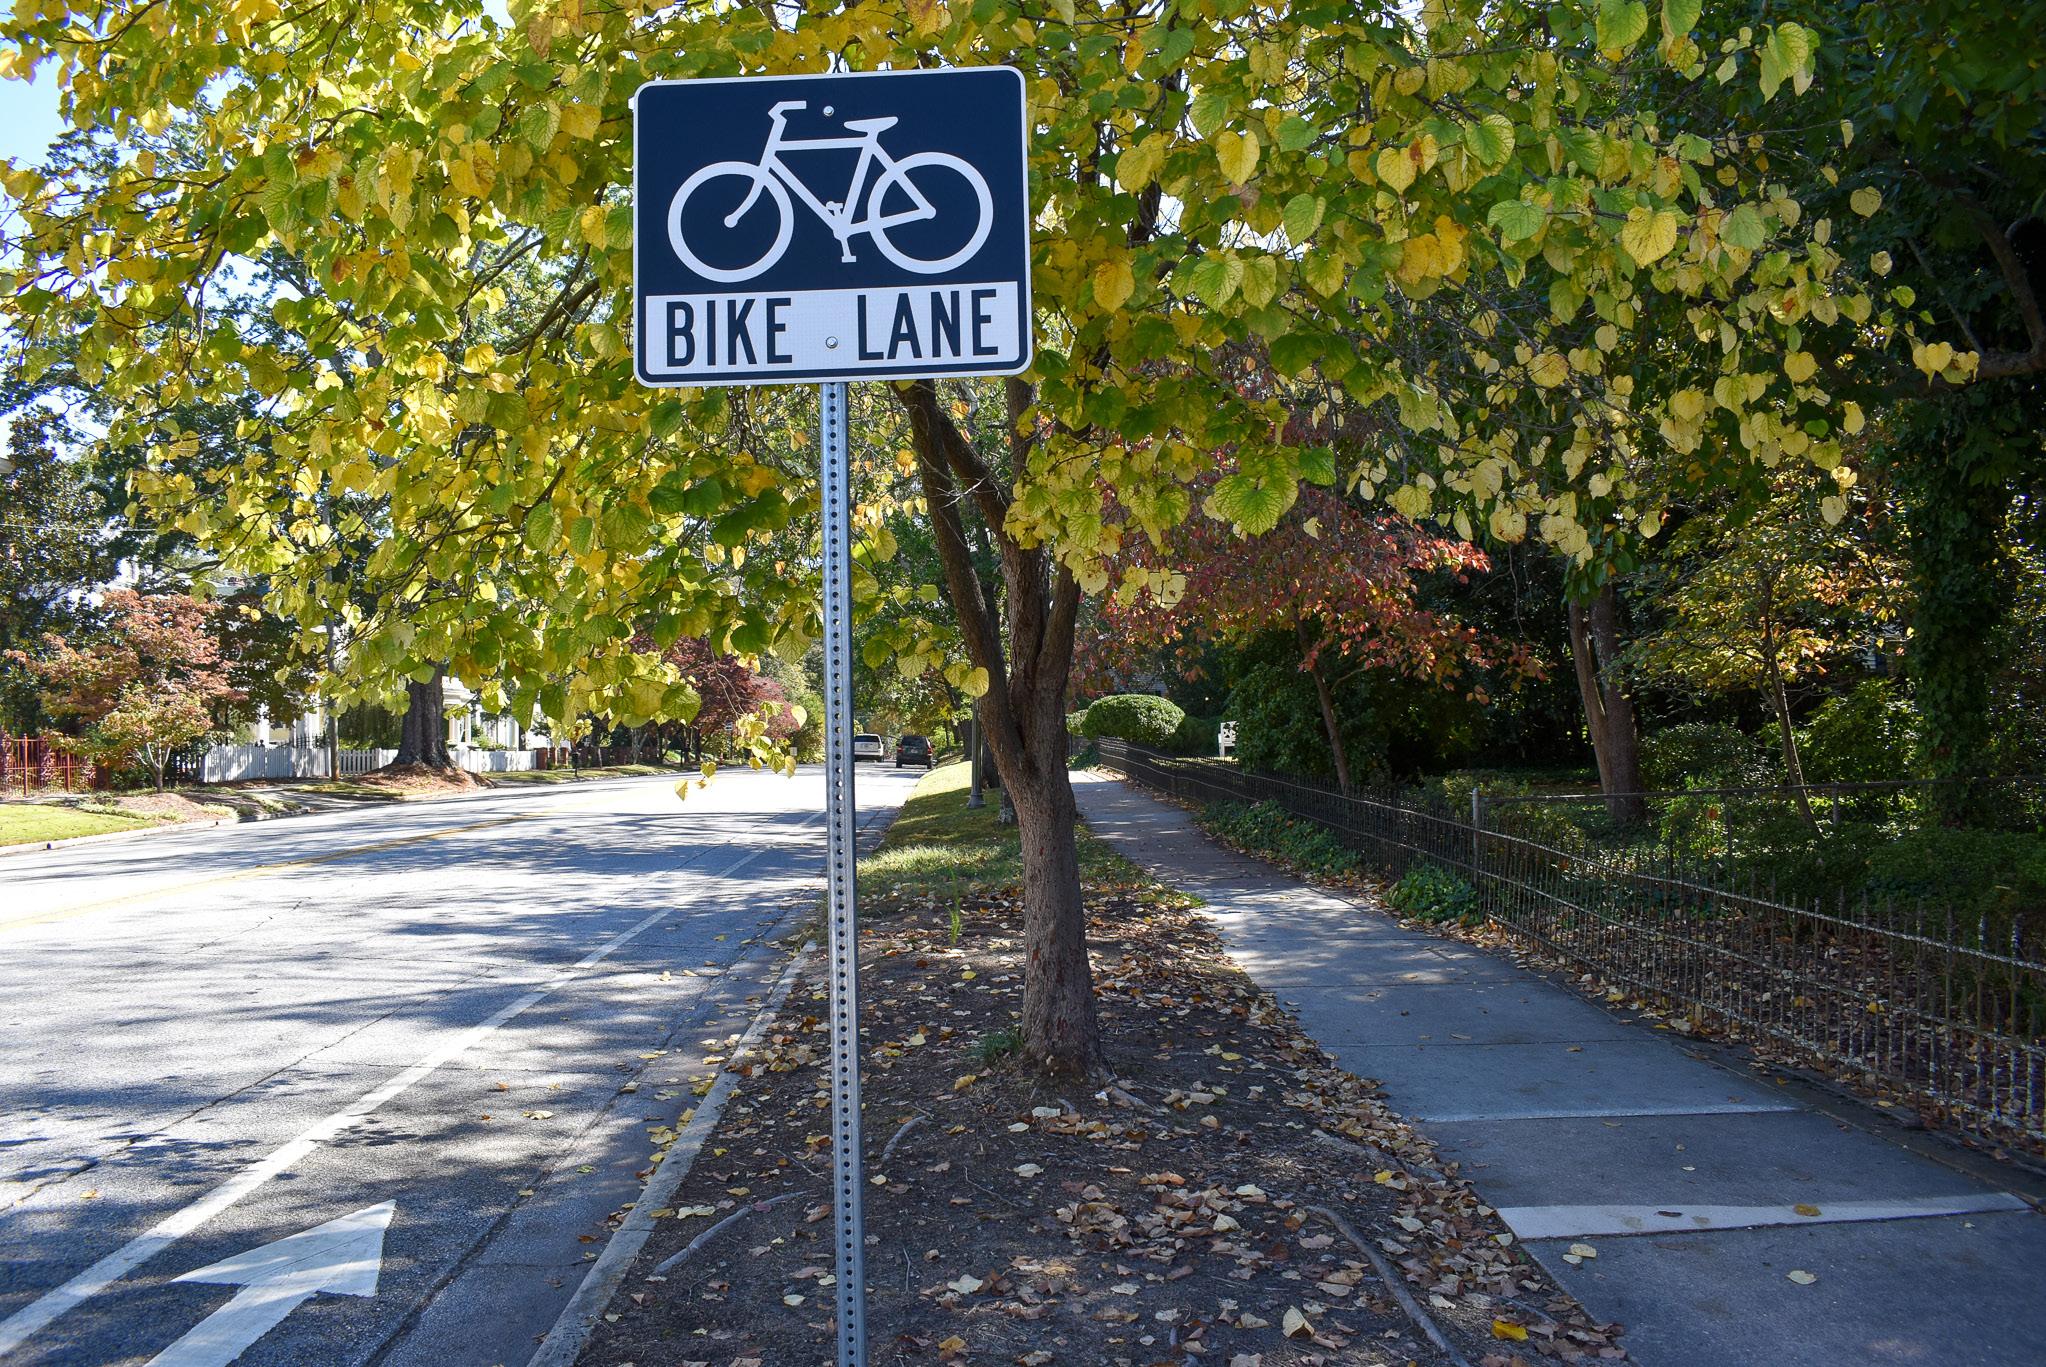
The creation and expansion of sidewalks, trails, and bicycle facilities were heavily emphasized in the survey responses and during the input sessions. The City established the Covington Walks Master Plan in 2015, which is a plan to develop a proposed multi-use trail system that connects local businesses, neighborhoods, and parks to the downtown area and other local jurisdictions. With the creation of the master plan and the development of the Cricket Frog Trail, a proposed multi-use trail that connects Newborn, Mansfield, and Porterdale with Covington, the foundation for walkability infrastructure was established. The Cricket Frog Trail is mostly complete, apart from a few connections. Extending this trail system with a connective network of sidewalks and onstreet bicycling facilities can not only decrease traffic congestion, but can also spur private investment and redevelopment, improve air quality, and promote a more active and healthy community. The improvement and expansion of mobility infrastructure should be a focal point of the community over the next 20 years.
Golf carts are another mode of transportation that has increased in use within Covington. Golf carts are a current trend for many communities, but golf carts are limited to the roads identified in the community golf cart ordinance. Although golf carts are classified as motor vehicles, they cause less damage to local roads, and have less impacts on air quality. As golf carts become more popular throughout the community, education and signage may be needed to ensure the safety of all trail and sidewalk users.


The Covington Municipal Airport is a resource that was heavily emphasized by elected officials and city staff during the input process. The airport is owned and staffed by the City of Covington, and the grounds are maintained by the public works department as well as private contractors. The site is comprised of more than 700 acres of land and is located 35 minutes from downtown Atlanta. The airport has experienced numerous upgrades such as the improved runway lighting system and building rennovations,and more upgrades are planned in the near future. One of the planned upgrades includes the expansion of hangars along Hangar Access Road (Figure 12). The Covington Municipal Airport is a perfect example of collaboration between the City and Newton County. The airport continues to encourage economic development, while catering to the needs of travelers accessing Atlanta, East Atlanta, and surrounding areas. The airport is one of the many modes of transportation within the city and plays an impactful role in the city’s multi-modal transportation network.

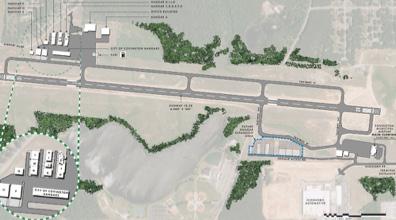
The City of Covington and Newton County do not provide public transit services, but both communities have recognized that public transportation needs to be addressed in the immediate future. In 2022, the Newton County Transit Master Plan was developed, which performed a detailed analysis on the need for public transit. The master plan also noted short-term and long-term solutions and established a cost estimate for the proposed service. The creation and implementation of transit services has a variety of benefits including reducing road congestion, improving health, increasing tax revenue, and decreasing transportation costs for residents. According to the Housing and Transportation (H+T) Affordability Index, the average resident in Covington spends 23% of their income on transportation. This percentage is on the edge of affordability and measures should be taken to reduce transportation costs throughout the community such as the implementation of public transit.

Short-term solutions outlined in the master plan included a Countywide Demand-Response System, a Covington to Conyers Shuttle, and a Parkand-Ride Commuter Shuttle (Figure 13). Covington could also examine other municipalities and counties offering transit services outside of Atlanta. A few options include the We-Go system in Hall County as well as the Let’s Ride system offered by the Georgia Department of Transportation. These solutions could be funded through a variety of Federal and local funding sources. The strategies and local partnerships for the implementation of public transit had not been made during the creation of this document. The results from the master plan were still being presented and reviewed by local government staff and elected officials. However, a public transit model or pilot-program should be implemented within Newton County and the City of Covington in the next few years. Also, a study identifying the transit needs and user base could help the City determine which transit system is critical.
Needs and Opportunities identified throughout the process that relate to transportation are on the next page:

Forecasting road infrastructure improvements due to suburban sprawl:
• Developing a detailed plan for allocating funds to local road infrastructure improvements will be necessary to ensure the safety and usability of local roads in the immediate future. Due to local governments having limited budgets, alternative funding sources should be explored to assist with implementation on top of the Local Maintenance Improvement Grant (LMIG) offered by the Georgia Department of Transportation (GDOT).
• Covington should continue to report all new local roads to GDOT utilizing the Local Road Activity (LRA) survey to ensure the community is receiving as much funding as possible.
• Covington should continue analyzing and exploring the implementation of active mobility infrastructure. Focusing on sidewalks, bike lanes, and trail connections have a variety of benefits, and a city-wide Complete Streets and Trails Master Plan for the community is a great starting point for identifying crucial connections to existing alternative transportation infrastructure outside of the areas focused by the Covington Walks Master Plan and the Traffic and Parking Assessment.
• As Covington becomes more urban, the community will need transit services in place to ease congestion and to have a more dynamic transportation system for residents. The development of the Newton County Transit Plan is a perfect gateway into implementing a transit case study or pilot program to determine the feasibility of transit without allocating large quantities of funds.
• Completing a study that identifies the user base and targeted use could benefit city staff and elected officials by enabling them to make an informed decision on long-term public transit operations.
• The paving of the Cricket Frog Trail allows the citizens and visitors of Covington to walk safely along miles of trail. The completion of the trail will connect numerous neighborhoods within Covington and will provide all local governments within Newton County a variety of benefits relating to health, economic development, and transportation. Continued focus and funding for the trail is a wonderful opportunity for Covington.
• Increased use and connections can also improve the safety and usability of the trail by encouraging accessibility and an active user group. Streetlights and emergency response beacons can also be implemented for extra precautions as the trail expands into multiple jurisdictions.
278 Community Improvement District –transportation related projects:
• The 278 Community Improvement District (CID) will have an enormous impact on Covington over the next five years. From 2023-2027, the community expects to complete Phase I of enhancing Highway 278. The Phase I project area expands from Exit 90 to Emory Street, and includes the implementation of safety improvements, walkability infrastructure, lighting, and landscaping. The project will be completed in partnership with GDOT, and will be funded through a mixture of grants, local funds, and State funds.
• Construction for Phase II is expected to start in 2026-2027, which will be when the comprehensive plan process for Covington will be starting again. The project design for this phase is expected to begin in 2023, with Right-of-Way (ROW) acquisition and utility relocations being slated for 2024 and 2025, respectively.
• Future expansion of the CID to include major connectors throughout Covington could also assist with increasing traffic flow, usability, connectivity, and walkability. The CID expansion can increase focus on roads such as Turner Lake Road and Washington Street
 Photo provided by the City of Covington
Economic development is defined by the Georgia Academy for Economic Development as, “the creation and retention of jobs and wealth, and the improvement of quality of life.” A focus on economic development gives a greater number of residents access to personal wealth, increases the tax base of the community, and diversifies the community’s economy. Covington’s median income is lower than the State average, and the gap is forecasted to widen in the next five years (Figure 14). It is vital that Covington continues to increase workforce training, support and retain local businesses, and diversify the community’s economic base all while maintaining integrity with land use and development practices. *Bolded items indicate high priorities within the community.

Existing Conditions
Esri’s Business Analyst estimates Covington’s unemployment rate for 2021 at 3.7%. The top industries in Covington include Services (49%), Manufacturing (14%), Retail Trade (14%), and Construction (8%). Roughly 84.7% of Covington residents have earned at least a high school diploma or equivalent, 7% have an associate degree, 11.9% have earned a bachelor’s degree, and 7.5% have earned a graduate or professional degree. The percentage of the workforce earning at least a high school diploma or equivalent is lower than the region (87.3%) and state (88.3%), and the college degree attainment is significantly lower for the city than for the region and the state.
A significant amount of Covington’s workforce lives outside of the city limits. Roughly 16,162 people travel to Covington for work from outside city limits, 1,101 people live and work within Covington city limits, and 5,173 people live in Covington but work outside the city limits (Figure 15). The City and Newton County should explore the cause of this dynamic and determine ways they could foster a more local workforce.

Covington residents noted in surveys a need for quality-of-life options such as, grocery stores, retail, and boutique or clothing stores. The types of entertainment options mentioned include a movie theatre, adult-style arcades, and more dining establishments. It is important that the City facilitates a dynamic mixture of business types and an environment that encourages local business development while addressing community needs or desires. Local business development is more likely to stimulate wealth generation among city residents, as opposed to traditional franchised stores. During input discussions, concerns were raised that big-box retail does not provide long-term benefits to the community. Reasons described include that they often provide inefficient uses of land, the tax revenue generated from the stores do not sustain the resources needed to support the infrastructure for the type of development, and that they are more likely to relocate when market conditions change, which would leave a vacant structure with minimal adaptive re-uses.
In addition, it was stated that Covington needs workforce and training alignment that will enable residents to access greater wealth and higher wages. Covington’s median income is much lower than the state average, and the poverty rates were nearing 30% in 2021. The City should focus resources on new development and skill development programs that increase the community’s access to wealth, wages, and a better quality of life.
To be successful in the future, Covington will need to support workforce development, attract industries and businesses that provide positions adequate to the skillset of the working population, and ensure that its local ordinances do not restrain small industry and business. Doing so will allow the community to increase personal wealth, diversify the economic base, and increase the local government’s tax base.
Local leaders emphasized the need to focus on re-education, workforce development, and the improvement of opportunities for Covington residents. Most of the workforce in Covington commutes from outside of the city and city residents have a lower-than-average median income; these two points display a need for workforce development and skillbuilding within the community. An emphasis on workforce development and training will enable residents to improve their skillset and obtain higher paying jobs. Covington should continue partnering with the local College and Career Academy and continue the partnership with the Northeast Georgia Regional Commission Workforce Development Division. These partnerships and educational resources can act as a catalyst to increase the community’s median income over the long-term. Covington should also build on the work items featured in the countywide Connecting Resilient Communities Plan related to workforce development.
According to Esri’s Business Analyst, about 15.3% of the population over the age of 25 did not complete high school, 58.2% earned a high school diploma, diploma equivalent, or some college credit, and 26.5% has a college degree (Figure 16). The City could attract or facilitate business development for skilled positions that do not require a college degree, positions than can be filled with a certification from the local college, or positions that develop skills through on the job training to fit the educational attainment of the majority of its residents.

Public input sessions identified the film industry and tourism industry as an opportunity for residents, businesses, and the local government. Over 100+ films and shows have been filmed in Covington, and numerous visitors travel to Covington to see their favorite fictional destinations. The city is also often refered to as the “Hollywood of the South”. An Economic Impact of the Film Industry report completed in 2021 for Newton County displayed that the film and tourism industry will grow rapidly over the next few years. In Newton County, the economic impact from the film industry is expected to grow 800%, from $11,602,889.76 in 2019 to $105,361,522.91 in 2025. The economic impact from the tourism industry is expected to grow by 17%, from $7,996,788.49 in 2019 to $9,355,111.47 in 2025. The report also estimated that 70% of the toursim in Newton County is film-inspired. This implies that the film industry brings many workers and tourists to Covington, and it is estimated that nearly 55,000 people travel to Newton County as a tourist visitor per year. The film and tourism industries allow Newton County and Covington to sustain more jobs and generate more tax revenue to increase the quality of life for residents. The ripples of the film industry in Newton County and Covington are not only felt locally, but will play a factor on the region and the state due to the increased popularity of filming in Georgia.
However, it was stated there is a lack of housing or short-term rentals to house the transient workforce. A goal mentioned by the steering committee includes capitalizing on these economic opportunities to further capture wealth within the community. City staff and elected officials could explore ideas to expand short-term rentals to members within the film industry with the intention to generate more revenue in taxes and promote the film industry to live and work in Covington for the duration of a project. Housing was also a threat identified during the input sessions, SWOT analysis, and public surveys. The lack of affordable housing and workforce housing is a topic covered in more detail in Chapter 7.


The City partners with Newton County’s Industrial Development Authority (IDA), SelectNewton, to attract new industries and businesses. In Fall 2022, Covington and Newton County merged the City’s and County’s economic development bodies, which could be a fantastic opportunity for Covington and Newton County. The increased colloboration has the potential to attract large-scale businesses and industries that will cater to the needs of the residents in the city and in the county.

Collaboration between the Planning and Zoning department, Utilities department, and Select Newton will be crucial to facilitating new developments into the community. Balancing land use management and economic development can be a complex task, but a relationship between the city departments and the IDA will allow staff to understand where new businesses can locate, what infrastructure is available, and what type of industries the City can proactively enable. The collaboration can also find needs within the city that relate to economic development, planning, infrastructure, and resource allocation. All parties involved in economic development should meet or coordinate on a regular basis.
The City of Covington, Newton County, and surrounding jurisdictions are partnering with the University of Georgia Archway Partnership to develop a Connected Resilient Communities (CRC) Plan that will address local challenges and increase potential for economic development. The priority areas of the plan include education and workforce development, health and wellness, and economic development. The plan and work items are expected to be completed in Winter of 2023. The NEGRC collaborated with the UGA Archway Partnership during the comprehensive plan process to include pertinent information from the CRC Plan into the Comprehensive Plan. Implementing the CRC plan could be a great initial task for SelectNewton and the City to partner on since the County and the City merged economic development bodies.
The City of Covington has many pull factors for economic development, which include the City’s vibrant downtown, diversity of industries, and variety of incentives. These factors explain why Covington is not only a great location to live, but also a great location to work and do business.

Covington’s downtown square has a blend of shopping and dining experiences that cater to the needs and wants of residents and visitors alike. The square is iconic, and in 2018 was voted Best Town Square in Atlanta by the readers of the Atlanta Journal-Constitution and has also appeared in many films and tv shows. Downtown Covington is a destination due to its historic architecture, numerous events, and unique local shops. The square fosters immense pride amongst the community. New and existing businesses within the downtown square are encouraged to locate or improve their businesses through a variety of incentives and support offered by the local economic development authority. These incentives include site selection, the Downtown Revolving Loan Fund (DRLF), and the Facade Improvement Grant.
The City has a variety of industries that support the economic base of the community. Steering committee members noted that new developments in Covington include emerging industries such as film, vertical farming, and cryptocurrency. Additionally, innovative job opportunities and new developments will offer employment opportunities to the residents of Covington and will use utilities that are provided by the City of Covington. The revenue collected from utility services in Covington will be used to increase the quality of life of residents within the community through service delivery. Due to Covington’s location along I-20 and proximity to Atlanta, many businesses have expressed interest in locating within the city limits. As a MEAG community, city staff expressed that Covington is interested in attracting industries and businesses that utilize gas, water, and power as well as offer competitive pay, manufacture using clean energy or create clean energy products, and invest in the community through partnerships.

The City of Covington has access to incentives and tax credits that can be used to attract new businesses to the city. Tax incentives or credits are the use tax relief measures to recruit, attract, and retain business to a community. These incentives are used as a tool to encourage investment and development and can allow the local government to select industries and developments that align with its goals and values.
In 2022, the City of Covington received a State Opportunity Zone designation from DCA for 91 parcels along Hwy 81, southwest of the downtown square (Figure 17). This designation allows all businesses that locate within the defined area access to State tax credits based on the number of full-time jobs the business creates, with a minimum creation of two full-time equivalent jobs. The opportunity zone designation is a highly competitive program that requires the local government to identify urban redevelopment areas by creating an Urban Redevelopment Plan (URP) and applying for the designation through the DCA. The designation expires in 2031, and any business that locates to the opportunity zone or is currently within the opportunity zone and creates two or more full-time jobs can receive the following benefits:
• Maximum of $3,500 per job created
• Use of job tax credits against 100% of Georgia income tax liability and withholding tax
The State Opportunity Zone designation can encourage investment and redevelopment in the area, which could transform the corridor leading into Covington from the City of Porterdale. Businesses of any nature can qualify if the minimum job creation threshold is met. Additionally, businesses locating in Covington have access to a Federal Opportunity Zone, County Job Tax Credits, and other incentives as well.
Needs and Opportunities identified throughout the process that relate to economic development are as follows:
Legend
Approved parcels for designation
It is understood that the data and map sets displayed have been created from information provided by various government sources at different moments in time and at various levels of accuracy.
Further, the data is not a “legal description” and is provided to you “as is” with no warranty, representation or guaranty as to the content, accuracy, timeliness or completeness of any of the information provided herein. It is the responsibility of the user of the data to be aware of the data’s limitations and to utilize the data in an appropriate manner.
Community Maps Contributors, Esri, HERE, Garmin, SafeGraph GeoTechnologies, Inc., METI/NASA, USGS, EPA, NPS, US Census Bureau, USDA
The user knowingly waives any and all claims for damages and under no circumstances shall DCA or its representatives be held responsible for any costs, expenses, damages or injuries, including special or incidental or consequential damages to any person(s) or property that arises from the use of the information provided.
Figure 17: Covington approved State Opportunity Zone
Workforce development:
• Attract industries that offer on the job training and partnering with local organizations such as College and Career Academy, Technical Colleges, and the Northeast Georgia Workforce Division to develop the skills of the workforce through certifications and training.
• Identify the needs of the working population within the community.
• The median income of Covington is lower than the state average, and the poverty rate was almost at 30% for 2021. For example, Census Block Group 12171007003 has a Housing Facility Deficiency greater than 8% and a minority concentration of 51%. Increased access to medical care, employment opportunities, quality education, and affordable housing can raise the standard of living within the community.
• Covington needs to identify the best tools, partnerships, and practices to raise the standard of living for residents throughout the community. The economic development authorities and the City have been addressing this issue over the past few years but raising the standard of living will need to be a continued focus of the community for the next five-ten years.
State Opportunity Zone:
• Encourages redevelopment and development of the Washington Street (Hwy 81) corridor leading into the town square.
• Offers a variety of tax incentives to all businesses that create two or more full-time jobs.
Connecting Resilient Communities (CRC) Plan:
• Developing the CRC Plan will be a great asset to Covington through collaboration with Newton County and surrounding jurisdictions. The plan will establish economic development projects for the community to complete and will also designate Covington as a CRC community once the projects are completed.
• Covington is searching for partners at the regional and state level by working with the University of Georgia Archway Partnership. These partnerships are crucial and allow Covington to think more broadly about partners.
Geographic location:
• Covington’s location is a perfect place for attracting new businesses to the area. Located 30 miles outside of Atlanta, Covington has many features that are attractive to new businesses such as a multi-modal transportation network (I-20, rail, airport, sidewalks, trails, etc.), proximity to Atlanta, and available land. These features allow Covington to be competitive at attracting businesses that fit the needs of the community.
• Covington and Newton County recently merged economic development bodies. This new partnership will increase collaboration efforts and is an opportunity that can lead to efficiencies for both Newton County and the City of Covington.

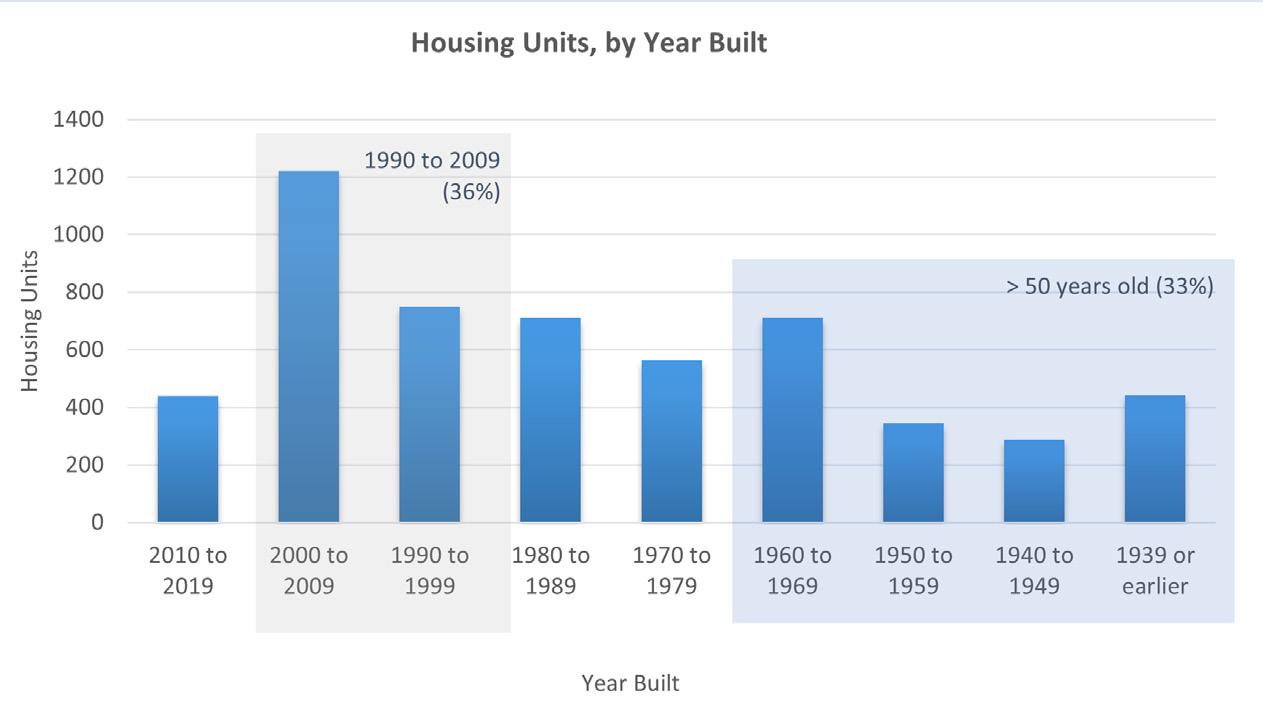

The purpose of the housing chapter is to evaluate the adequacy and suitability of the existing housing stock to serve current and future community needs. It provides an overview of current housing types, occupancy, and costs and explores housing needs and opportunities for the community. Covington incorporated a housing element to plan for anticipated increases in population and affordability needs. Unless otherwise noted, all data in this chapter are sourced from Esri’s Business Analyst Software, which is based on the U.S. Census American Consumer Survey.
The City of Covington is home to around 15,750 people, and the population is forecasted to grow to around 17,100 by 2026, an 8.7% increase. The number of households within the city are also expected to increase from 5,768 in 2021 to 6,279 in 2026, a 9.2% increase. As of 2021, roughly 42.6% of housing units are owner occupied, 46.2% renter occupied, and 11.2% of housing units are estimated to be vacant (unoccupied or new construction units with exterior windows and usable floors) (Figure 18). In 2026, owner occupied housing units and renter occupied units are projected to be the same at 44.2% with vacant units estimated at 11.6%. The forecasted population and household growth show a similar growth rate over the next five years, however, as was described in the Economic Development section, commuting patterns indicate that there is an imbalance of available housing between the city and the county as there are currently over 16,000 people who commute into the city for work compared to just 1,100 who live and work within the city. This imbalance was explored in the 2020 Newton County Housing Study which estimated that Covington needs to add 600-700 new housing units of mixed variety to meet housing demand, more than the estimated housing units built in Covington from 20102019 (Figure 19). Local leaders noted that more than 600-700 housing units are needed since over 1,000 people are on the Covington Housing
Authority’s waitlist. An increase in supply and variety could encourage more people to reside closer to work and enable more renters to purchase homes The Newton County Housing Study also identified challenges including housing affordability, housing types, and zoning. These challenges are all related to housing availability, desirability, attainability, and stability.
The U.S. Department of Housing and Urban Development (HUD) defines affordability as a household not paying more than 30% of their total income towards rent, mortgage payments, utilities, taxes, insurance and other related housing expenses. Households who spend more than 30% of income on housing are considered cost burdened. Housing prices were a major topic of discussion during the planning process. Steering committee members, city staff, and the public noted that attainable housing options were greatly needed within the community. The median home value in Covington is estimated at $184,789 and is expected to increase to $216,766 in the next five years. However, the median household income is roughly $41,788 and is expected to increase to $47,069 over the same time period. The median home value is increasing at a pace that is not sustainable to the median household income, which will continue to widen the gap to attainable housing.

Median rent in Covington from 2015–2019 was $658 per month, or $874 per month for gross rent with utilities. The 2022 HUD Fair Market Rent in the 30014 zip-code for a one-bedroom apartment is $900. Under the definition of affordability, a household income of over $35,000 would be necessary to afford the median rent in the city; however, it is estimated that 40% of Covington residents earn an annual household income lower than $35,000. Data also suggests that approximately 53.3% of households that rent, 20.5% of homeowners with a mortgage, and 2.5% of homeowners without a mortgage are considered cost burdened (Figure 20). These analyses demonstrate the need for an array of housing options, policies, and programs to address housing opportunities within the community. Especially for members of the community who are disabled or live on a fixed income. Several national and international events during 2020–2022 have substantially affected the cost of living. The Bureau of Labor Statistics reported that following the beginning of the COVID-19 pandemic, the nation has experienced high inflation and significant increases in home values, rents, and other essential goods and services. For these reasons, the 2015–2019 ACS data (including the 2021 and 2026 projections based on these data) may undervalue the affordability conditions present within Covington today.

In the detailed community survey, over 37% of survey respondents noted that the community did not have adequate housing option to meet the future needs of the community, while 36% of respondents stated that the community did have enough housing options. The remaining respondents were unsure. Residents were also divided regarding the amount of apartment buildings throughout the community. Many respondents said that there were too many apartment buildings throughout the community, and other respondents stated that the apartments being built were not affordable or attainable for the population living within the city.
Most of the housing stock in Covington is classified as single-family residential homes, with an estimated 64.5% of homes falling into this category from 2015–2019 (Figure 21). Most of Covington’s current single-family residential housing is detached (61.6%). “Missing Middle” housing (i.e., homes in buildings with 2–19 housing units) makes up 27% of the housing stock and includes duplexes (9%), 3–4-unit apartment buildings (10%), 5–9-unit apartment buildings (3%), and 10–19-unit apartment buildings (5%). However, most of these units do not fit the context of missing middle housing. For housing units to be classified as middle housing, the units should be located in a walkable environment, use type IV construction material, and be scaled appropriately to fit in to the existing neighborhood. Therefore, the benefits of the missing middle housing units are not being maximized within the community with the housing types that are present in Covington.
Covington has a lower concentration of single-family homes than Newton County, the 12-county Northeast Georgia Region, and the state of Georgia. The housing stock in the city is also more diverse than the county, region, and state, as shown in Figure 19. The mixture of housing stock in Covington is diverse comparatively to other areas but missing middle housing and higher-end housing options could still be improved within the community to increase housing supply and address attainability.
New housing stock and future developments must be reflective of the population and should be available to residents in all cycles of life, incomes, and abilities. Incorporating a variety of housing options including types, sizes, prices, and locations can strengthen the community economically and socially, while providing residents with an opportunity to live, work, and play in the same area.
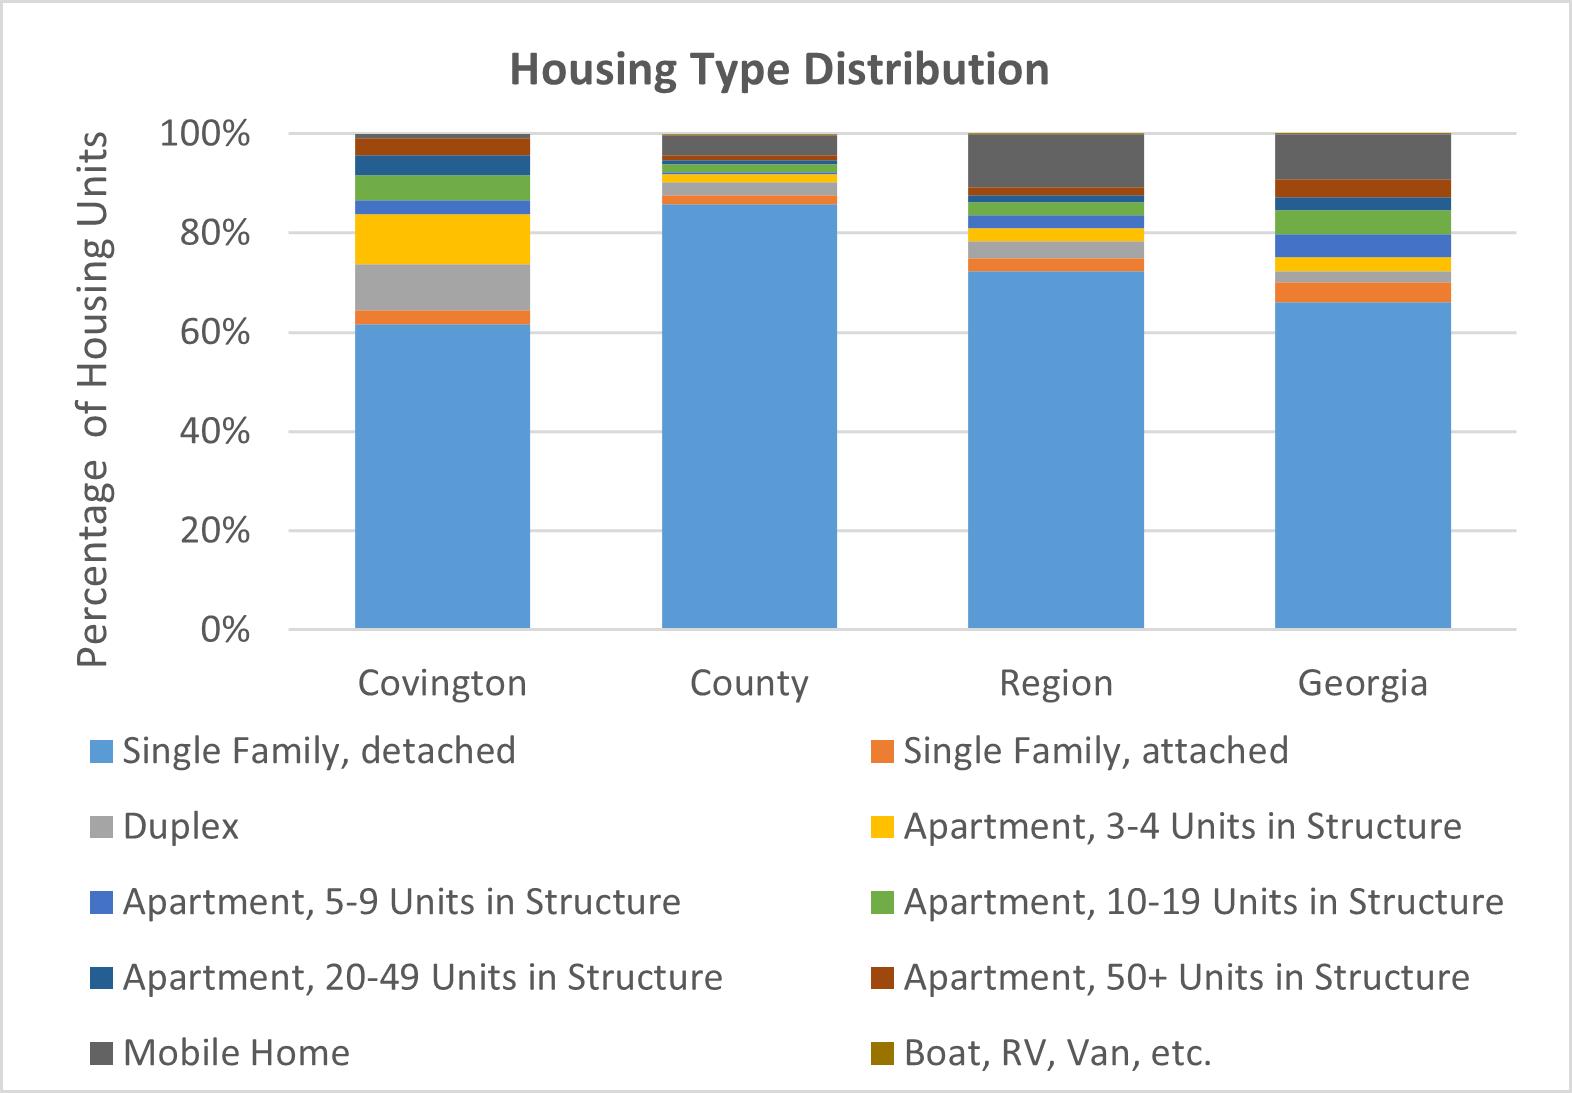
Diversifying housing stock can be a challenging task, especially when some housing types such as missing middle housing are prohibited in most communities due to local zoning ordinances. Most zoning ordinances do not allow multi-family residential units within areas zoned as single-family residential. However, Missing Middle Housing (MMH) units are designed to fit into the character of a two or three story residential neighborhood. These housing types are designed and retrofitted to the community, and the purpose of these units are to increase affordability, promote walkability, and diversity of housing stock, while maximizing the efficiency of land use within the community. MMH units are scaled to existing lots and can blend in naturally with existing neighborhoods. These types of developments can also encourage the redevelopment of dilapidated or blighted parcels. These housing types are generally more affordable due to the Type IV material used to construct the units and the smaller unit size. Missing Middle Housing Units are normally smaller but very livable units, and are always located in a walkable context, which lowers transportation and housing costs. Instead of looking at adding density when diversifying housing types, Covington could explore incorporating these types of developments into areas zoned as single family residential, and regulate building type, building design, and building material with design standards to ensure neighborhood compatibility for new developments.
According to the State of Georgia Balance of State Continuum of Care Point in Time County Report (2019), Newton County had the second highest number of homeless individuals of the Northeast Georgia counties at 84 total persons. This number was generated by the Georgia Department of Community Affairs (DCA) who performs a Point-In-Time homeless count every other year to enumerate the sheltered and unsheltered homeless population on one night in January to provide a snapshot of homelessness in the state. The County was recorded as having 65 total beds available for homeless individuals, a 77% availability rate based on the 2019 count. However, during input meetings the local privately-operated shelter was described as needing significant repairs and investment.

There are various short- and long-term methods that the City could explore to address local homelessness needs. The Northeast Georgia Housing Guidelines (2022) outlines the “housing first” model, government subsidy programs, and intentional development patterns that could contribute to the overall solution. City leadership could partner with local emergency shelters and the Covington Housing Authority to determine the extent of local emergency shelter needs and which method is appropriate.
Needs and Opportunities identified through public input that relate to housing are as follows:

Attainable housing:
• There is a need for more housing units that are affordable to households earning 80% or less of the AMI. Exploring options to increase affordability and diversifying housing stock could allow more opportunities for housing to be affordable throughout the community.
Diversify and increase local housing stock:
• Input sessions, research, and surveys identified the need for more types of housing within the community. City staff and elected officials could explore which housing types are needed, and determine if those housing types need variances, design standards, or modified zoning ordinances to be developed within the city.
• Covington needs to add a mixture of housing units including highend or luxury housing and starter homes/options.
Housing demand and additional housing:
• Additional housing units are needed within the community. The Newton County Housing Study identified that roughly 600-700 new housing units are needed to meet the city’s demand.
Covington Housing Authority (CHA):
• The Covington Housing Authority is a great resource and partner with the City and the community. The Housing Authority has received numerous grants to build new affordable housing and is a strong advocate for housing throughout the community. The City should continue to utilize the partnership with the Covington Housing Authority to mitigate housing insecurities within the community.
Economic Development:
• The City has a wonderful economic development coalition that continues to bring in and retain businesses and industries in the community. Economic development could allow additional opportunities for public-private partnerships and attract strategic housing developments within the community.
Infill and Redevelopment:
• Infill housing opportunities can allow the City to advocate for redevelopment and better utilization of existing parcels. This could be removing blighted structures for new developments or adding to or around existing structures.
 Photo provided by the City of Covington
# Activity Status Notes
1
Convene cultural affairs (or similar) committee to address economic, racial, and geographic inequities identified by stakeholders
2 Audit services and devise plan to address the city’s ability to serve its growing senior population
Completed
Diversity and Inclusion group was established by the City as well as a Public Arts group and a Police Review Committee.
3 Designate city staff member(s) as community outreach and volunteerism liaison(s)
Ongoing
Ongoing action item. Revised and carried over to new STWP as Item #1.
Completed
Established social media and outreach department that uses mulitple modes of communication for announcements, volunteering opportunities, etc.
4 Create ad hoc work group to devise plan to decrease obesity and inactivity rates and address other unhealthy community indicators such as food deserts
5 Initiate regular (monthly/quarterly) collaborative meetings of local nonprofit organizations
6 Develop plan to audit and improve housing stock and increase opportunities for homeownership
7 Evaluate and adjust (as necessary) code enforcement to eradicate blight, especially as related to absentee landlords and noncompliant residents
Ongoing Task force are established on an as needed basis. Removed from STWP.
Ongoing
Ongoing action item and removed from STWP.
Completed
Covington re-entered the GICH program in 2020, and is currently a sophomore in the porgram.
Completed
City has set aside funds and prioritized improvements and demolitions to blighted property.
8
Create citizens planning academy and/or other training opportunities that will increase community understanding of planning and zoning
9 Conduct comprehensive review of zoning ordinance and adjust as necessary
Completed
Training is provided to local boards on a bi-annual occurrence. Also, citizens and staff are involved in citizen planning academy at a regional scale.
Completed Adopted in Spring of 2022.
10
Adjust US 278 Livable Centers Initiative (LCI) study to ensure that street trees, setbacks, parking requirements, pedestrian friendliness, design and engineering, and other aspects of the corridor more closely match the attributes of the downtown Covington square area
11
Work with newly formed community improvement district (CID) to extend its boundary to the I-20 interchanges that frame the corridor
Completed
Findings displayed some aspects of the LCI were not pratical based on the width of the 278 Right-of-way. Concept for 278 focused on making it multimodal and incorporate street trees.
Completed
12
Develop partnership and strategy to reduce traffic congestion along US 278 and around the square (long-range implementation)
Completed
13
Develop comprehensive, citywide complete streets and trails plan, including safe routes to schools analysis to ensure safe travel for all ages across the city
14
Form partnership with Newton Trails to complete Cricket Frog Trail within the city limits (long-range implementation)
Ongoing
Phase I of the plan expands all the way to Turner Lake Road. Phase I had already started before the the footprint was expanded. Will be incorporated in Phase II.
The CID Master Plan was designed with safety and operations to reduce traffic congestion in the forefront of the design. The plan will provide safe alternatives to vehicle traffic such as cycling and pedestrian alternatives.
Three studies have been completed and adopted including the Covington Walks Master Plan, Central Park Master Plan, and the Downtown Transportation Study. Revised and carried over to STWP item #26.
Completed Last stretch of trail was completed in December 2021.
15
Evaluate potential for and, if appropriate, devise strategy to provide public transportation (implementation period unknown)
16 Create greenspace and parks acquisition program
Ongoing
Transit Master Plan was completed in 2022, and parternships and strategies are being developed. Carried over to new STWP item #30.
17
Study effectiveness of existing historic preservation practices and other ways (existing and potential) to protect and enhance traditional neighborhoods; create basic, in-house strategy
18
Conduct needs analysis and develop strategic plan for parks and recreation programming and facilities
Ongoing
Completed
Land was acquired for Central Park which will become largest green space in town. Removed from STWP.
Historic Guidelines were re-written in 2021. Window property check of both districts were completed in and letters were mailed to owners in need of minor repairs.
19
Select and implement one local project to be developed under the “Lighter, Quicker, Cheaper” principles of the Project for Public Spaces
20
Appoint collaborative working group to create a world-class educational system; institute standing meeting schedule (implementation ongoing)
Completed
The Central Park Master Plan and Covington Walks Plan were completed to expand parks and connectivity throughout the city.
Canceled Lack of community interest.
Completed
The Development Authority colloborates with the school systems, private schools, and universities. An advisory committee meets with the school system quarterly, and has monthly meetings with the technical school and Newton County school system.
21
Designate economic development committee and devise plan/strategy to address unemployment and underemployment
Completed
There are a series of committees and meetings that address economic development and unemployment. An example is Newton Tomorrow; a group comprised of members from all jurisdictions in Newton County.
# Activity Status Notes
22
Prepare report and needs analysis on incongruities between employer needs and local workforce skill
23 Develop recommendations (through ad hoc committee) for attracting and retaining younger residents
24 Study traffic flow, particularly regarding oneway streets, around downtown square (midterm implementation)
Completed These types of reports can and have been generated by the EDA.
Ongoing Task force are established on an as needed basis. Removed from STWP.
Completed Included in the 2021 Downtown Traffic Study.
25 Develop communitywide plan for wayfinding signage
Completed
Implemented by the Department of Community Development. Additional signage and kiosk were implemented in 2022.
26 Install downtown electric vehicle charging stations
27 Institute city policy/protocols on participating in and utilizing the ARC MPO’s transportation planning process
28
Create volunteer action team to assist with emergency preparedness and response, blight eradication, and other community needs
Completed
Two EV charging stations were installed at public facilities. Four more charging stations are out for bid.
Ongoing
This is an ongoing effort with different departments and organizations within the city. The need for policy depends on the department. Removed from STWP.
Ongoing Task force are established on an as needed basis. Removed from STWP.
29 Implement Central Park Master Plan
Ongoing
30
Work with partners to establish additional 20,000-300,000 of warehouse space within the city
31 *Install 12” pipe (Bypass-Flat Shoals Rd.)
Completed
Central Park Master Plan was completed in 2021. Revised and over to new STWP as STWP #7 and #8.
Over 1.5 million square feet of warehouse space is being developed with over 4 million more proposed.
Ongoing Project is ongoing and progress has been made. Carried over to new STWP as #16
32 *Construct Municipal Court facility
Completed
Constructed and completed in 2019.
Completed
34 *Revise thoroughfare plan
Ongoing
35 *Resurface other streets on 2011 SPLOST list as funds become available Completed
Mapping and inventory of public trees occurred in 2018. Additional mapping and data maintenance may be needed
Ongoing as a component of the Code update that was approved in Spring 2022. Removed from STWP.
Resurfacing projects were completed, but resurfacing roads will continously be ongoing.
*Entries with an asterisk represent carryover or revised items from the previous STWP.
1 *Develop service delivery plan to address the city’s growing senior population.
2 Create a social media campaign to raise awareness of community events in Covington.
3 Develop branding that is specific to Covington that highlights the city’s historic charm, small town feel, and role in the film industry.
4 Develop design guidelines for future mixed-use developments that locate within the overlay district.
5 Evaluate zoning ordinances and determine the feasibility of incorporating middle housing into more zoning categories.
6 Create a dedicated web-page outlining the main points in the comprehensive plan.
7 *Implement and develop the short-term goals from the Central Park Master Plan.
8
*Identify potential funding sources and grants to implement Central Park.
9 Establish multiple trailheads for the Cricket Frog Trail by applying for the Department of Natural Resources, Recreation Trail Program grant.
10 Upgrade the playground equipment in the pocket parks throughout the city.
*Entries with an asterisk represent carryover or revised items from the previous STWP.
*Entries with an asterisk represent carryover or revised items from the previous STWP.
21 Add resources and staff dedicated to sustainability efforts and outreach.
22 Develop a sustainability master plan.
23 Install fiber optic cable throughout the city to offer Broadband as a city service.
24 Become a DCA Broadband Ready Community.
25 Partner with the City of Oxford, Newton Trails, and GDOT to expand the Bridge on Hwy 81 over I-20 to include pedestrian and Bicycle facilities.
*Develop a citywide complete streets and trails plan, including connectivity to points of interest as well as an inventory of sidewalks, trails, and on-street bicycle facilities.
Complete Phase I improvements of the 278 CID Master Plan.
28 Complete Phase II improvements of the 278 CID Master Plan.
Apply for the Raise 2023 Grant to fund road and infrastructure improvements on Turner Lake Road.
*Identify strategic partners and devise a strategy to offer public transit services.
*Entries with an asterisk represent carryover or revised items from the previous STWP.
31 Colloborate with SelectNewton on the types of industries needed to support the skilleset of the workforce in Covington.
32 Implement the action items listed in the Connecting Resilient Communities Plan completed by the UGA Archway Partnership.
33 Partner with the local colleges and non-profits to provide annual skill and job training sessions for Covington residents. Including resume reviews, mock interviews, computer skills, and trade skills.
34 Actively participate and accomplish the objectives outlined in the Georgia Initative for Community Housing (GICH) program.
Apply for a Community Development Block Grant to mitigate housing insecurity and support neighborhood revitalization activites within the community.

STAFF REPORTS
news@covnews.com
COVINGTON, Ga.
— The City of Covington Management Development Program Class of 2022 is conducting a stuffed animal drive from April 11 to May 6. The stuffed animals are being collected to benefit Piedmont Newton Hospital, the Newton County Sheriff’s Office and Children’s Healthcare of Atlanta to help “comfort kids in crisis.” Members of the public are encouraged to drop off stuffed animals at one of three locations: Covington City Hall, located at 2194 Emory St.; Covington Fire Station 21, located at 2102 Pace St.; and Covington Fire Station 22, located at 11234 Alcovy Road. Stuffed animal being donated should be new, pose no choking threat and measure under 15 inches tall. The Covington Management Development Program class is provided through the Carl Vinson Institute of Government at the University of Georgia.
Continued from A2
D-Covington, will seek reelection for a second term in state House District 113, but she faces a challenge in the Democratic primary from fellow Newton County resident Billie Boyd-Cox.

The race for state House District 114 features former Newton County commissioner Tim Fleming of Covington and Morgan County businessman Wendell McNeal for the Republican nomination. The winner will face Malcolm Adams, of Oxford, who is unopposed for the Democratic nomination, in the general election. For state Senate District 17, incumbent Brian Strickland,
By TOM SPIGOLON tspigolon@covnews.com
COVINGTON, Ga.
— Newton County’s
SPLOST Oversight Committee heard they likely will be working overtime to hear requests for inclusion in the planned 2023 SPLOST renewal vote. They also were updated on the status of projects recently added to the voter-approved 2017 list.
County Projects Consultant Jeff Prine told committee members Monday, April 11, that the Board of Commissioners recently voted to distribute the $19 million the 2017 SPLOST is projected to produce above the original $65 million amount. New projects included a renovation of Washington Street Community Center and construction of the Yellow River Trail, for which the county is working with a private developer to build the first phase near the former Oaks golf course, Prine said. Others include the fi
nal phase of the Denny Dobbs Park skate park, which likely can be completed by October; and construction of a Westside Youth Facility at Fairview Community Park and Springhill Park off Lower River Road — both of which the county will issue
R-McDonough, seeks a third term, but he faces opposition from Republican challenger Brett Mauldin of Madison. The winner will face Democrat Kacy Morgan of Madison in the general election. State Sen. Tonya Anderson, D-Lithonia, seeks a fourth term representing District 43. She faces a challenge in the primary against Democrat Joe N. Lester, of Conyers. Local candidates that qualified for congressional races included incumbent Democrat Hank Johnson, of Stonecrest, for U.S. House, District 4, as well as Republican challengers Jonathan Chavez, of Conyers,
requests for proposals for design services, Prine said. He said designs for both can be completed by the end of this year and their construction go out for bid early in 2023.
On the 2023
SPLOST, commit-

tee Chairman Baxter
Bouchillon said the 1% sales tax — a continuation of the 2017 SPLOST — is estimated to produce around $108 million over its six-year life if approved by voters in the Nov. 8 General Election.
He said the county was in negotiations with the six cities on the percentages of the funds each will receive if the SPLOST is renewed. If the current split is used, the county would receive about $80 million of the total, Bouchillon said.
Bouchillon told committee members he recommended the project list include five catego
ries: Basic Infrastructure, Quality of Life, Debt Reduction, Public Safety and Economic Development
He said he expected the committee will need to meet twice-weekly in May to hear from all the county departments and others seeking to be part of the funding.
“This is kind of the once-every-six-year thing,” Bouchillon said.

Department heads
and Surrea Ivy, ,of Gwinnett County.
For U.S. House District 10, qualified Democrat candidates include Jessica Allison Fore, of Athens; Tabitha Johnson Green, of Sandersville; Phyllis Hatcher, of Conyers; Femi Oduwole, of Loganville; and Paul Walton, of Hull. Republicans that qualified include Timothy Barr, of Watkinsville; Paul Broun, of Athens; Mike Collins, of Jackson; David Curry, of Monticello; Vernon Jones, of Watkinsville; Marc McMain, of Monroe; Alan Sims, of Winder; and Mitchell Swan, of Good Hope.
have been given a May 2 deadline for their project recommendations for the funding.
Projects must meet the requirements of the state’s SPLOST law, he said.
Bouchillon said the committee’s goal is to recommend a final project list to the Board of Commissioners by its June 7 meeting — after which the Board can make changes to the list and approve it before the renewal vote on Newton County’s ballot. The county government is requesting suggestions from community members and organizations for projects for the SPLOST at https://www.co.newton. ga.us/ImageRepository/


Document?documen-

tID=4474. Bouchillon also noted the Newton Chamber of Commerce “took the ball and ran with it” to gain feedback about the SPLOST project list. Chamber President Debbie Harper, an ad-hoc member of the committee, said a survey was included in a newsletter sent to its membership. He said committee members could allocate one-fifth of the $80 million to projects in each of the five categories.
However, Prine noted county transportation
director Chester Clegg still must submit his project requests which likely will far exceed the $16 million a onefifth division would produce.
He said Clegg likely will recommend fund-


ing to widen heavily traveled Brown Bridge Road from its current two lanes by adding a middle turn lane — a project that will cost more than $16 million.
brief the community on the process in developing the comprehensive plan, and to obtain input on the proposed planning process. Citizens, business owners, and all stakeholders are invited to attend the Public Hearing to provide comments, ideas, and suggestions. If you are unable to attend and wish to receive information regarding the hearing, please contact Oxford City Hall at (770) 786-7004 or comments@ oxfordgeorgia.org


Public Hearing Two - 12/14/2022


Public Input Session 2 - 06/01/2022
Public Input Session 3 - 06/13/2022


Public Input Session 4 - 07/11/2022
Public Input Session 5 - 07/27/2022


Property tax is tied to what a community builds and an important revenue stream for local governments in Georgia. Figure 1.1 on the right shows the significant role of property tax in Covington’s budget, making up 26% of the General Fund. Covington is unique in that it relies significantly on its utility revenue which comprises 38% of the General Fund. This is a stable revenue source currently, but our analysis questions how stable given the full lifecycle costs of all the city’s infrastructure.

The tax system in Covington is a straightforward process (Figure 1.2). Market values are assessed at 40%. All potential exemptions are removed. And the taxable value is multiplied by the current tax rate to generate the tax bill.
Step 1
Step 2
Market Value x 40% = Assessed Value -Exemptions Taxable Value x Tax Rate % = Tax Bill
Step 3
Mapping property tax production is tantamount to understanding how Covington pays for municipal services and infrastructure. When government revenue generation varies geographically, we can draw comparisons to other spatially relevant facts, such as patterns of development, demographics, and public investment. Put simply, how land is used directly affects its tax productivity and ability to pay for the services it needs. As such, analyzing the source of government revenues, and the patterns they come from, is critical to planning a strong financial future.


When you look at the Total Taxable Value of Newton County (Figure 1.1), large valuable parcels stand out as warmer colors on the value scale. Large non-taxable parcels are displayed in gray because the value they add to the community simply isn’t paying taxes. While many of those parcels are valuable they are also extremely large parcels. Smaller downtown parcels read as less valuable even though they provide a high value with smaller space. In order to make apples-toapples comparisons of various parcels, we look at the Taxable Value per Acre (Figure 1.2). When we do this, we notice large parcels shift into lower categories of value per acre while some small parcels rise into warmer colors or higher value per acre. The next page shows what we can see when looking at value per acre in 3D. Comparison


Urban3 uses the Value per Acre analysis to help clearly illustrate which specific parcels and land uses are providing the most value to the city. The metric of comparison matters greatly when looking at a city, the same way that it matters when we look at vehicle efficiency. Comparing properties by overall parcel value is like comparing vehicles by miles per tank. If that were the case, we would all be driving Ford F150’s because they have a 26 gallon tank. But as we all know, when making this type of comparison, you have to find a common metric in order to fairly compare objects. Just like we compare cars by miles per gallon, Urban3 compares property by value per acre.

Covington is located in Newton County, GA, just at the eastern edge of the Atlanta Metropolitan Area. We begin our analysis at the county level (Figure 3.1) The county is 89% taxable, but large portions of it have a relatively low value per acre. Covington stands out in the middle, with the higher peaks attributable to downtown and the recent Clark’s Grove development. Surprisingly, other cities, such as Mansfield or Porterdale, are not as visible as newer, unincorporated developments on the western edge of the county.
In general, the higher value per acre a property is, the more property tax revenue it generates for city services it consumes, such as roads, utilities, schools, civic spaces, etc. With each new development, or redevelopment, Covington has an opportunity to generate tax revenue on existing infrastructure liabilities or with minimal new liability.
The areas with the best value per acre are concentrated in Downtown Covington and Clark’s Grove. Aside from some new housing developments, the rest of Covington has a much lower value per acre. It may be surprising to see that the Walmart has a relatively low value per acre. While it generates property tax revenue, it requires a much larger parcel than businesses downtown.

Non-taxable areas do not pay taxes that fund services but add other non-monetary benefits to a place. Newton County has only 11% of all its land occupied by non-taxable property, while the City of Covington has nearly double that rate at 21% (Figure 4.1). The city’s non-taxable property is a mix of uses for government services, utilities, and parks. These uses are necessary to provide services to the community, but the city has to ensure that taxable areaa are generating enough revenue to cover the cost of non-taxable areas.


A large portion of the west and south side of Covington hosts Newton County Turner Lake Park and the city’s Central Park, both large non-taxable areas for recreational uses. The north end of the city is occupied by the airport which also takes up a large share of non-taxable land. The city is also home to several non-taxable Newton County educational and social service buildings.
Downtown Covington in particular has a large share of land devoted to nontaxable uses (Figure 4.2). A significant portion of this is for municipal offices, including city hall, the city’s engineering department, city and county court, and the county sheriff’s annex office. Because these buildings are all one story, they take up a large share of downtown property. Since downtown is potentially the most productive area of the city, these parcels may be powerful tools for the public entities to meet their service goals and support more tax production from the highest potential areas.
Street networks and roads are often some of the most challenging to keep up with from a maintenance perspective. Roads have predictable maintenance schedules, typically needing minor work like overly every decade and full replacement every 50 years. Covington should be proactive in planning for regular maintenance and replacement, and cautious when building new roads that add to that cycle. Focusing on infill development, rather than greenfield development which requires all new roads and utility networks, will allow Covington to increase its budget without increasing the amount of roadways it is responsible for maintaining.

Many cities struggle to cover the cost of their infrastructure without extra financial support from the state and federal government. As we know, this is not a sustainable financial plan. Needed spending is based on lifecycle costs that estimate how much maintenance, repair, and replacement will have to be funded over and over again through the future. In order to maintain all their roads properly, the city will need to hurdle a significant budget gap. When comparing current spending to needed spending, Covington can only afford to keep up with 46% of its roads (Figure 5.2).

It isn’t just roads Covington has to worry about. The city also owns and operates water, sewer, and storm water systems, as well as gas and electric systems for energy consumption. All of these systems are spatially expansive (Figure 6.1). Extending them to new areas creates long-term liabilities. If land uses are less productive in those areas, they are less able to pay for the infrastructure they use. More productive uses are then on the hook to subsidize that infrastructure. While infill development might require improving existing infrastructure, it is less costly than extending infrastructure to accommodate greenfield development.
Estimating from recent costs and general replacement schedules, the city’s entire infrastructure system is worth $1.1 trillion in lifecycle costs (Figure 6.2). This cost for the entire lifecycle of each infrastructure system requires $91 million annually to be properly maintained. By putting these systems and their price tags on the map, we can better understand how development patterns and land use decisions impact Covington’s ability to operate and maintain this infrastructure for the public’s benefit. Paired with our value per acre maps, the subsidy of infrastructure in low value areas becomes clear.


Spatially distributing costs and revenue in Figure 7.1 show where the city is making enough money to pay for roads. Revenue includes income from property tax, sales tax, utility fees, SPLOST, and grants, which is shown in green. Costs include general government expenses and annual lifecycle costs for the road system, shown in red. Both revenues and costs are extruded up, so the visible green spikes are parcels that can cover their share. Some areas clearly generate enough revenue to cover road costs. Others are barely getting by and some areas are completely in the red.
Figure 7.2 subtracts costs from revenues to determine if a development comes out positive, in the black, or negative, in the red. Positive values extrude up and negative values extrude down. Downtown and Clark’s Grove stand out the most. Some suburban sites do fairly well, such as the Holiday Inn called out in the map. Many other sites have costs that exceed their revenues. When all these uses are combined the total net outcome for the city’s road system is still negative at around $8 million per year.


Some of these infrastructure systems generate revenue that currently pays for expenses (Figure 8.1). When we consider the total life cycle cost, however, everything but Stormwater and Gas exceed their current revenues. While Water, Sewer, and Electric have less revenue than lifecycle costs, they all have the opportunity to increase their utility rates to produce a consistent form of revenue. Roads themselves have no revenue. They rely on SPLOST funds, state and federal grants, and transfers from utility funds. When considering lifecycle costs, roads are massively underfunded and without any clear revenue stream to meet that need.

The city also needs to be aware that its budget currently relies on millions of dollars transfered from excess utility revenue to pay for basic services (Figure 8.2). If these utilities need to reclaim that money, how will the city accommodate that financial deficit? Covington has the opportunity to become more financially resilient by pursuing land use patterns that can generate consistent revenue streams from property and sales tax that exceed infrastructure costs, like Downtown and Clark’s Grove do now.

Downtown Covington is home to many historic buildings that are incredibly productive (Figure 9.2). Most of the buildings in the eight blocks surrounding Covington Square were built in the late 1800s, and they are higher in value per acre than any other area downtown. These buildings represent a timeless approach to urban design and land use planning. They have not only supported the social and cultural environment of downtown for centuries but they have also continued to provide a great return on investment. These eight blocks produce far more value per acre than is needed to maintain infrastructure. If Covington is to ask what financially sustainable development looks like, they need look no further than their own downtown.
While Covington has grown and changed, the eight historic blocks around Covington Square have persisted. Today they remain more financially productive than nearly any other neighborhood in the city.

Clark’s Grove is another incredibly productive neighborhood. Comparing its productivity to the Covington Gallery shopping mall, it uses a fraction of the space to produce the same value (Figure 9.1). Occupying less space means less infrastructure to maintain, and more value means more revenue for the city to maintain the services the land uses.

While downtown has some of the highest values per acre in the city, it maintains quite a large area of surface parking. If parking demand was managed so that supply could be reduced, these parking lots would become prime sites for infill development. Because of their location, they would offer a tremendous increase in value to the city’s tax roll (Figure 10.2). By filling in these sites, the city could make downtown more walkable, vibrant, and economically productive. As the I-278 Community Improvement District is seeking to become more compact and multi-modal, this creates an opportunity for downtown to also thicken up and offer enhanced connections between the two areas.

Downtown is currently home to some incredibly productive blocks that create lots of value, but it still has room to grow. By filling in surface parking lots with small-scale infill reminiscent of the eight historic downtown blocks, Covington could add around $12 million in value, or an additional $92,000 in property tax revenue.

Newton County’s school site represents one of the largest shares of non-taxable land near Covington’s Downtown. It is home to Newton County Theme School, the County’s School District Office, a gymnasium, a stadium, and an older school building no longer in use.

As the old school on this site faces demolition, the city might be interested in envisioning what could replace this parcel as a taxable use. The projections in Figure 11.1 show two options. One is a suburban infill that resembles the East Haven development just west of the site and south of Williams Street, adding a projected $20 million in value, or $155,000 in annual property tax revenue. The other is urban infill that resembles the city’s historic downtown blocks, adding a projected $26 million in value, or $201,000 in annual property tax revenue.
These examples illustrate both how large this site is and how much potential it contains for generating additional revenue. The second option, however, is not only more valuable but more walkable. Sitting just south of I-278, this site offers another option for connecting to parcels along the I-278 corridor that may be

The Neely Farms site, east of downtown along Covington Bypass Road, is undergoing a number of redevelopment proposals. This is a large, 84 acre site that has access to two major roads and contains a former quarry. Since part of this site has yet to be finalized, Urban3 looked at a few different development scenarios (Figure 12.2).

The first scenario, “Business As Usual,” assumes development consistent with what currently exists along Covington Bypass Road, such as big box stores, drivethroughs, and low-rise, single-family housing. This type of greenfield development would be worth about $22 million in value, or $175,000 in annual property tax revenue. The next scenario, “Clark’s Grove Clone,” projects what Clark’s Grove would look like replicated in this area, producing a whopping $88 million in value, or $670,000 in annual property tax revenue. The final scenario models a compromise between the former two, with a Clark’s Grove style development on the north end and suburban, commercial development on the west and south sides of the site. Even in this “Mix N’ Match” scenario, this type of development would still be over twice as valuable as “Business As Usual,” worth $53 million in value, or $400,000 in annual property tax revenue. Because of the size of this site, there is a huge opportunity to create value through proper site planning and urban design.

The total potential value added to the city for all these projections is a huge number. It’s much smaller, however, when put in the context of the city’s total value. And over the course of the next five or ten years, a seven percent increase in value becomes a much more reasonable prospect.

The metric of comparison matters greatly when looking at a city, the same way it matters when we look at vehicle efficiency. Comparing properties by overall parcel value is like comparing vehicles by miles per tank. If that were the case, we would all be driving Ford 150s because they have a 26 gallon tank. But as we all know, when making this type of comparison you have to find a common metric in order to fairly compare objects. Just like we compare cars by miles per gallon, Urban3 compares property by value per acre.
The metric of comparison matters greatly when looking at a city, the same way that it matters when we look at vehicle efficiency. Comparing properties by overall parcel value is like comparing vehicles by miles per tank. If that were the case, we would all be driving Ford F150’s because they have a 26 gallon tank. But as we all know, when making this type of comparison, you have to find a common metric in order to fairly compare objects. This is why we compare cars by miles per gallon, Urban3 compares property by value per acre and why we should all be driving 1955 BMW


50/70 mpg


380 miles per tank

$20,000,000 Tax Value

For 40 years this building remained vacant…… its tax value in 1991 was just over $300,000
0.2

$11,000,000
For 40 years, this building in downtown Asheville (above) remained vacant. In 1991 its tax value was just over $300,000. Over a number of years a development firm, Public Interest Projects, redeveloped the building to mixed use. Today the building is valued at over $11,000,000. An increase of over 3,500% in 15 years. While this was a great project that created new tax revenue for the city, its total taxable value is less than the Asheville Walmart. While that may be true at face value, (Walmart is valued at $20,000,000) thats not the end of the story. The Asheville Walmart property is 34 acres, where as the downtown building is less than 1/5 acre. When you compare value per acre or total property taxes per acre, the downtown building is far more efficient at creating value. It generates more city sales tax per acre, houses more residents, and employs more people per acre. By increasing density you can generate more value for your city, while consuming less land.

For 40 years, this building in downtown Asheville (above) remained vacant. In 1991, its tax value was just over $300,000. Over a number of years, a development firm, Pubic Interest Projects, redeveloped the building to mixed use. Today the building is valued at over $11,000,000—an increase of over 3,500% in 15 years. While this was a great project that created new tax revenue for the city, its total taxable value is less than the Asheville Walmart. While that may be true at face value (Walmart is valued at over $20,000,000), that is not the end of the story. The Asheville Walmart property is 34 acres, whereas the downtown building is less than 1/5 acre. When you compare value per acre or total property taxes per acre, the downtown building is fare more efficient at creating value. It generates more city sales tax per acre, houses more residents, and employs more people per acre. By increasing density, you can generate more value for you city while consuming less land.
$6.5K $634K $48K $84K
Total Property Taxes/Acre
Residents/Acre


OWN CHILDREN AND EMPLOYMENT STATUS
Source: U.S. Census Bureau, 2015-2019 American Community Survey
Esri


Data Note: N/A means not available Population by Ratio of Income to Poverty Level represents persons for whom poverty status is determined. Household income represents income in 2017, adjusted for inflation
2015-2019 ACS Estimate: The American Community Survey (ACS) replaces census sample data. Esri is releasing the 2015-2019 ACS estimates, f ve-year period data col ected monthly from January 1, 2015 through December 31, 2019 Although the ACS includes many of the subjects prev ous y covered by the decennial census sample, there are significant differences between the two surveys including fundamental differences in survey design and res dency rules
Margin of error (MOE): The MOE is a measure o the variability of the estimate due to sampling error. MOEs enable the data user to measure the range of uncerta nty for each estimate with 90 percent confidence. The range of uncertainty is called the confidence interval, and it is calculated by taking the est mate +/- the MOE. For example, if the ACS reports an estimate of 100 with an MOE of +/- 20, then you can be 90 percent certain the va ue for the whole population falls between 80 and 120
Re iabi ity: These symbols represent threshold values that Esri has established from the Coefficients o Variation (CV) to designate the usability of the est mates. The CV measures the amount of sampling error relative to the size of the estimate, expressed as a percentage
H gh Rel ability: Smal CVs (less than or equal to 12 percent) are flagged green to indicate that the sampling error is smal relative to the estimate and the estimate is reasonably reliable
Medium Rel ab l ty: Estimates with CVs between 12 and 40 are flagged yellow-use with caution.
Low Rel ability: Large CVs (over 40 percent) are flagged red to indicate that the sampling error is large relative to the estimate. The estimate is considered very unreliable.
Source: U.S. Census Bureau, 2015-2019 American Community Survey Reliability: high medium low April 19, 2022 ©2022 Esr Page 8 of 8


Source: U.S. Census Bureau, Census 2010 Summary File 1. Esr forecasts for 2021 and 2026 Esri converted Census 2000 data nto 2010 geography.


1. Esr forecasts for 2021 and 2026 Esri converted Census 2000 data into 2010 geography.


Note: Households wi h children include any households with people under age 18, related or no Multigenerational households are families with 3 or more parentch ld re at onsh ps. Unmarried partner households are usually classified as nonfamily households unless there s another member of the household related to the househo der. Mul igenerat onal and unmarried partner households are reported only to he tract level. Esri estimated block group data, which is used to estimate polygons or non-standard geography.


Source: U.S. Census Bureau, 2015-2019 American Community Survey


Source: U.S. Census Bureau, 2015-2019 American Community Survey Reliability: high medium low April 19,


Data Note: N/A means not available
2015-2019 ACS Estimate: The American Community Survey (ACS) replaces census sample data. Esri is releasing the 2015-2019 ACS estimates, five-year period data co lected monthly from January 1, 2015 through December 31, 2019 Although the ACS includes many of the subjects previously covered by the decennia census sample, there are significant differences between the two surveys including fundamental differences in survey design and residency rules
Marg n of error (MOE): The MOE is a measure of the variability of the estimate due to sampling error. MOEs enable the data user to measure the range of uncerta nty for each estimate with 90 percent confidence. The range of uncertainty is called the confidence interval, and it is calculated by tak ng the estimate +/- the MOE. For example, f the ACS reports an estimate of 100 with an MOE of +/- 20, then you can be 90 percent certain the value for the whole population falls between 80 and 120
Reliability: These symbols represent threshold values that Esri has established from the Coefficients of Variation (CV) to designate the usability of the estimates. The CV measures the amount of sampling error relative to the size of the estimate, expressed as a percentage
H gh Re iability: Small CVs (less than or equal to 12 percent) are flagged green to indicate that the sampling error is small relative to the est mate and the estimate is reasonably reliable
Med um Re iabi ity: Estimates with CVs between 12 and 40 are flagged yellow-use with caution.
Low Rel ability: Large CVs (over 40 percent) are flagged red to indicate that the sampling error is arge relative to the estimate. The estimate is considered very unreliable.
Source: U.S. Census Bureau, 2015-2019 American Community Survey
Reliability: high medium low April 19, 2022
©2022 Esr Page 6 of 6


10/19/22, 12:40 PM H+T Fact Sheets
Trad tional measures of housing affordability ignore transportation costs Typically a household’s second-largest expenditure, transportation costs are largely a function of the characteristics of the neighborhood in which a household t ds with walkable streets and high access to jobs,
tation Costs areas peop e need to own more veh c es and re y upon farther distances wh ch also dr ves up the cost of iv ng Map data ©2022 Google Report a map error Housing Transportation Remaining Income


Transportation Costs

9.07 Tonnes 20% 23% 57%
https://htaindex.cnt.org/fact-sheets/?lat=33.5967815&lng=-83.8601827&focus=place&gid=5133#fs


2 2 Housing + Transportat on Costs % Income 43% Housing Costs % Income: 20% Transportation Costs % Income 23% Affordability Block Groups: 6 Househo ds 5,035 Popu ation: 13,517 Demographics Autos per Household 1 83 Annual Vehicle Miles Trave ed per Household 23,349 Transit Ridersh p % of Workers: 0% Annual Transportat on Cost: $13,180 Annual Auto Ownership Cost $9,945 Annual VMT Cost: $3,235 Annual Trans t Cost: $0 Annual Trans t Trips: 0 Average Month y Housing Cost: $940 Med an Se ected Month y Owner Costs: $921 Med an Gross Month y Rent $855 Percent Owner Occupied Housing Units: 45% Percent Renter Occup ed Hous ng Unit: 55% Annual GHG per Household 9 07 Tonnes Annual GHG per Acre: 7 16 Tonnes Household Transportation Model Outputs Housing Costs Greenhouse Gas from Househo d Auto Use Resident a Density 2010: 3 04 HHs/Res Acre Gross Household Density 0 50 HH/Acre Regiona Household Intens ty: 6 949 HH/m le2 Percent S ngle Fami y Detached Households: 68% Employment Access Index: 9 951 Jobs/mi2 Employment M x Index (0-100): 87 Transit Connect v ty Index (0-100 : 0 Transit Access Shed: 0 km2 Jobs Accessib e in 30 Minute Trans t Ride: 0 Availab e Transit Tr ps per Week 0 Average Block Perimeter: 1 551 Meters Average Block S ze : 25 Acres Intersection Density 53 /mi2 Environmental Characteristics H + T M e t r i c s © Copyr ght Center for Ne ghborhood Technology


