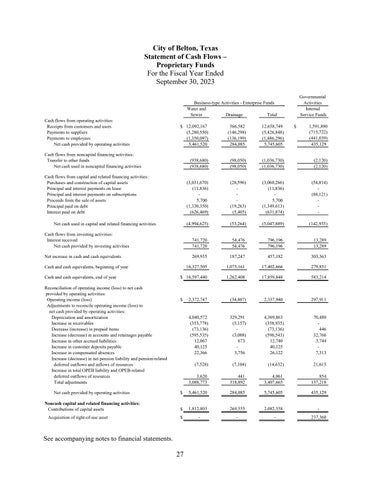
City of Belton, Texas Statement of Cash Flows – Proprietary Funds For the Fiscal Year Ended September 30, 2023 Governmental Activities Internal Service Funds
Business-type Activities - Enterprise Funds Water and Sewer Drainage Total Cash flows from operating activities: Receipts from customers and users Payments to suppliers Payments to employees Net cash provided by operating activities
1,591,890 (715,722) (441,039) 435,129
$ 12,092,167 (5,280,550) (1,350,097) 5,461,520
566,582 (146,298) (136,199) 284,085
12,658,749 (5,426,848) (1,486,296) 5,745,605
(938,680) (938,680)
(98,050) (98,050)
(1,036,730) (1,036,730)
(2,120) (2,120)
(3,031,670) (11,836) 5,700 (1,330,350) (626,469)
(28,596) (19,263) (5,405)
(3,060,266) (11,836) 5,700 (1,349,613) (631,874)
(54,814) (88,121) -
(4,994,625)
(53,264)
(5,047,889)
(142,935)
Cash flows from investing activities: Interest received Net cash provided by investing activities
741,720 741,720
54,476 54,476
796,196 796,196
13,289 13,289
Net increase in cash and cash equivalents
269,935
187,247
457,182
303,363
16,327,505
1,075,161
17,402,666
279,851
$ 16,597,440
1,262,408
17,859,848
583,214
2,372,747
(34,807)
2,337,940
297,911
4,040,572 (353,778) (73,136) (595,535) 12,067 40,125 22,366
329,291 (5,157) (3,008) 673 3,756
4,369,863 (358,935) (73,136) (598,543) 12,740 40,125 26,122
70,480 446 32,766 3,744 7,313
(7,528)
(7,104)
(14,632)
21,615
3,620 3,088,773
441 318,892
4,061 3,407,665
854 137,218
$
5,461,520
284,085
5,745,605
435,129
$
1,812,803
269,555
2,082,358
-
$
-
-
-
237,360
Cash flows from noncapital financing activities: Transfer to other funds Net cash used in noncapital financing activities Cash flows from capital and related financing activities: Purchases and construction of capital assets Principal and interest payments on lease Principal and interest payments on subscriptions Proceeds from the sale of assets Principal paid on debt Interest paid on debt Net cash used in capital and related financing activities
Cash and cash equivalents, beginning of year Cash and cash equivalents, end of year Reconciliation of operating income (loss) to net cash provided by operating activities: Operating income (loss) Adjustments to reconcile operating income (loss) to net cash provided by operating activities: Depreciation and amortization Increase in receivables Decrease (increase) in prepaid items Increase (decrease) in accounts and retainages payable Increase in other accrued liabilities Increase in customer deposits payable Increase in compensated absences Increase (decrease) in net pension liability and pension-related deferred outflows and inflows of resources Increase in total OPEB liability and OPEB-related deferred outflows of resources Total adjustments Net cash provided by operating activities Noncash capital and related financing activities: Contributions of capital assets Acquisition of right-of-use asset
$
See accompanying notes to financial statements.
27
$


