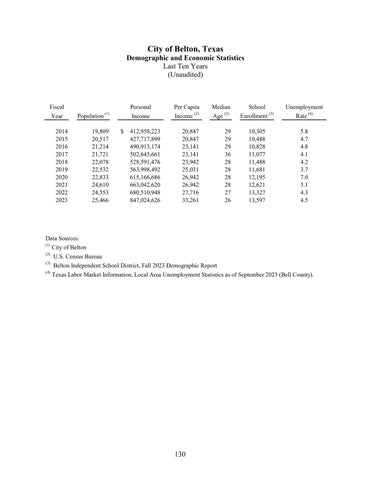
City of Belton, Texas Demographic and Economic Statistics Last Ten Years (Unaudited)
Fiscal Year
Population
2014 2015 2016 2017 2018 2019 2020 2021 2022 2023
Personal Income
(1)
19,809 20,517 21,214 21,721 22,078 22,532 22,833 24,610 24,553 25,466
$
412,958,223 427,717,899 490,913,174 502,645,661 528,591,476 563,998,492 615,166,686 663,042,620 680,510,948 847,024,626
Per Capita (2) Income
Median (2) Age
20,847 20,847 23,141 23,141 23,942 25,031 26,942 26,942 27,716 33,261
29 29 29 36 28 28 28 28 27 26
School (3) Enrollment
Unemployment (4) Rate
10,305 10,488 10,828 11,077 11,488 11,681 12,195 12,621 13,327 13,597
5.8 4.7 4.8 4.1 4.2 3.7 7.0 5.1 4.3 4.5
Data Sources: City of Belton
(1) (2)
U.S. Census Bureau Belton Independent School District, Fall 2023 Demographic Report (4) Texas Labor Market Information, Local Area Unemployment Statistics as of September 2023 (Bell County). (3)
130


