
1/89

Thousandsofideasarewovenintoamovingstory thatdemonstrateswisdomandknowledge.While theseinspirationsarefleeting,writingcanturn themintoeternalwisdom,transcendingtimeand spacetobringinfinitereverieandenlightenment.
OnExploreisarecordofresearchpapersand articlesIconductedandcreatedasateenager.
WheneverIlookatthesecreationsoverandover again,thesparkofideasisrekindledinmymind andinspiresmealongtheway.


LakeMead,avitalwater reservefortheColorado Basin,hasenteredadrought season,boycottingwater supplyformajorcities around,includingLas Vegas.Ourteamused severalmathematicsmodel topredictthefuture situation,anddeduced disturbingresults.
Weanalyzedthehydrographical situationoflLakeMead, identifyingtherelationship betweenwatervolumeandthe lake’swaterinput,output,and lossduringtransfer.
-Thenwedeterminedthefactors influencingthewaterdynamicof LakeMead
-Byfittingthehistoricaldatawith mathematicalmodels,we predictedofyear2025,2030, 2050.

-Inreactionttheproblemwe discovered,apossibleplanof waterreuseisproposedasan attempttoalleviatefuture shortage.
Accordingtothedatafittingmodel,we anticipatedthatthewaterlevelofLakeMead wouldcontinuetofall,exaggeratingthe currentdroughtsituation.Atthesametime, populationgrowswithindifferencetothe contractingwatersupply,thedemandfor waterresourcewouldstillincrease,leadingto adilemma.
Therefore,ourteamproposedapossiblewater recycleplanandrewardsystemformunicipal governmentbasedon‘fit-for-purposeresource allocation.’Wehopeourresearchcouldraise publicawarenessofthecurrentagencyand contributetotheproblem.
As the most extensively used reservoir in United States, Lake Mead has supplied more than 25 million people with water in three western states. [1] According to previous data, lake levels rose steadily through the 1980s, reaching 24.8 million acres in August 1985. But as of August 2010, Lake Mead held 10.35 million acre-feet, just 37 percent of the lake’s capacity. Because of increasing demand and persistent drought, Lake Mead has drastically shrunk its capacity in recent years. [2]
With the intention of addressing this environmental problem effectively and efficiently, we apply various models to investigate Lake Mead water level and volume. Furthermore, we lay down a water recycle plan and establish a water recycle system in the city.
Our final goal is to propose a scientific water recyclingplan that helps to address the water shortage problem in city. We can accomplish this goal in the following steps.
Task 1: Weneedtoidentifythe factorsofinflow,outflowandloss anddesignmodels to explore the relationships.We need to define symbols and create formulas to calculate the rate of inflow, outflow and change. We also need to design multiple integral models and coordinate a system to verify theelevation, area and volume of Lake Mead.
Task 2: Based on the data previously provided, we need to summarize them in a statistic model which enables us to find the overall patterns of water levels. Using this model, we also need to define the criteria for drought periods which include the beginning and ending points. The comparison between the recent one to that of the earlier one is needed. Furthermore, we need to estimate the water level from 2005-2020 and verify ourassumption that the pattern of the recent drought periods continues.
Task 3: We need to identify the factors that may influence the plan of recycling wastewater, including the decisions the local leaders would make and the priorities they might set. We also need to describe our plan and evaluate the impact of implementing it.
Assumption 1: the concentration (������������������������ ������������������������ ) remains the same in the Lake Mead. Since the variation of concentration isn’t significant, and it is a crucial variable in our inflow and outflow model, so we assume that it remains the same in the lake.
Assumption 2: the depth of the lake doesn’t change in a small area that we divide into. Since it is not possible to get the depth at every point of the lake, and the depth of the lake doesn’t vary a lot in a small area, so we consider the depth in a small area.
Assumption 3: The elevation data of the lake is predictable and have connection with time (year). It depends on time so we can do a fit test.
Assumption 4: The year average elevation of the lake is the sum of the month elevation of the lake in one year divided by 12. Annual numbers are smaller and easier to calculate than monthly numbers.
The Table 1 below defines all of the variables that have been used in this report:
For the volume and water level of Lake Mead, inflow, outflow and loss are important factors. For this reason, we have to identify and describe factors that impact inflow, outflow and loss. First of all, we should specify the components of Lake Mead’s inflow, outflow and loss. Then we determine the factors that impact these components, which are inflow, outflow and loss.
According to circular 1381 by U.S. Department of the Interior and U.S. Geological Survey [3], the inflow of Lake Mead is from four sources, including Colorado river, which is the main source of inflow, Las Vegas Wash, Virgin river, and the precipitation of the area. The Colorado River contributes about 96.9% of the amount of inflow, the Las Vegas Wash provides 2.2%, Virgin River supplies 0.8% The average annual precipitation at Lake Mead, based on data from several weather stations around the lake, is only 5.74 inch/year, and only provides 0.1% of the inflow. In general, we consider Colorado River the main source of inflow.
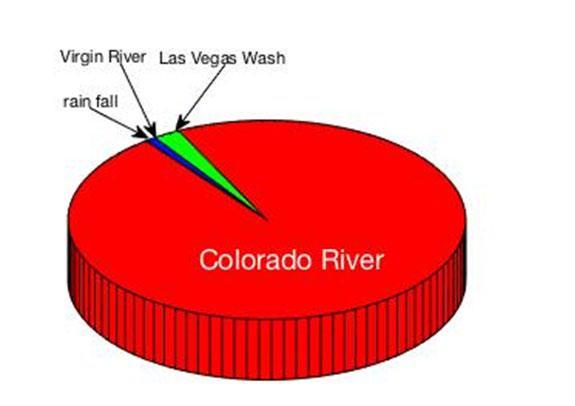
There are several factors that are indicative of the inflow. The amount of melting ice and rainfall in the rocky mountains, which is the most significant factor, climate change like drought, overuse or pollution of water and the conditions in the Colorado Basin such as the forest and farmland.
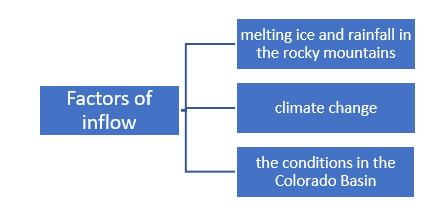 Figure 1 The components of Lake Mead’s inflow
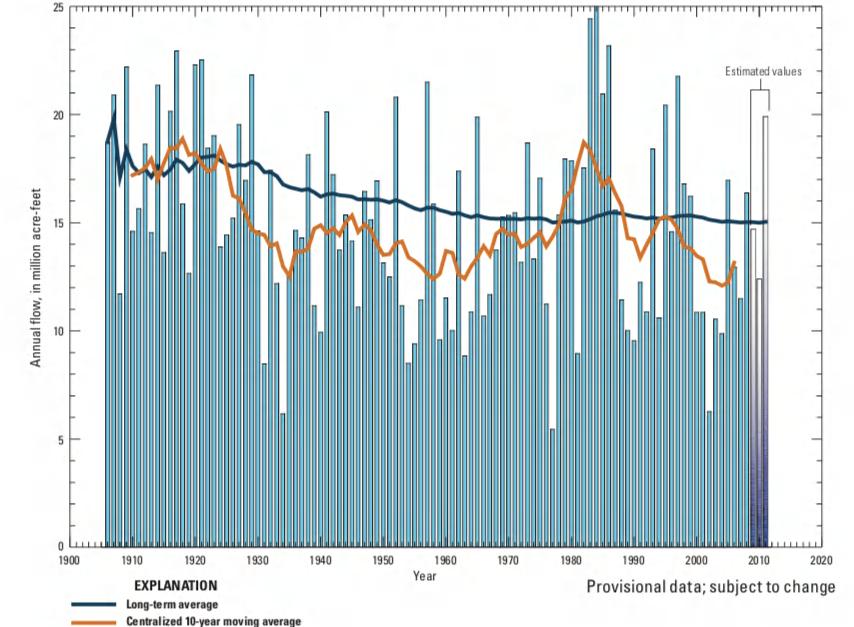
The water of Colorado River mostly comes from the melting ice of the Rocky Mountains and precipitation along the river, so the annual inflows vary a lot from year to year. From a 2018 report [4], “2018 wasn't the worst winter on record for the southern Rocky Mountain region, but it was close to it. It was an extreme year on the dry side, widespread across the Colorado River Basin,” says Greg Smith, a hydrologist at the Colorado Basin River Forecast Center (CBRFC) in Salt Lake City.
However, in 2019, another report [5] mentions that “Snowmelt fills Colorado River and other waterways in U.S. Southwest, easing drought fears.”
The outflow of the Lake Mead run to Hoover Dam, and from the data that we found, the amount of outflow is decreasing throughout the years.
The factors that impact Lake Mead’s outflow are the irrigation of the land and the water powerplant. The Hoover Dam promotes the irrigation of the agriculture and the
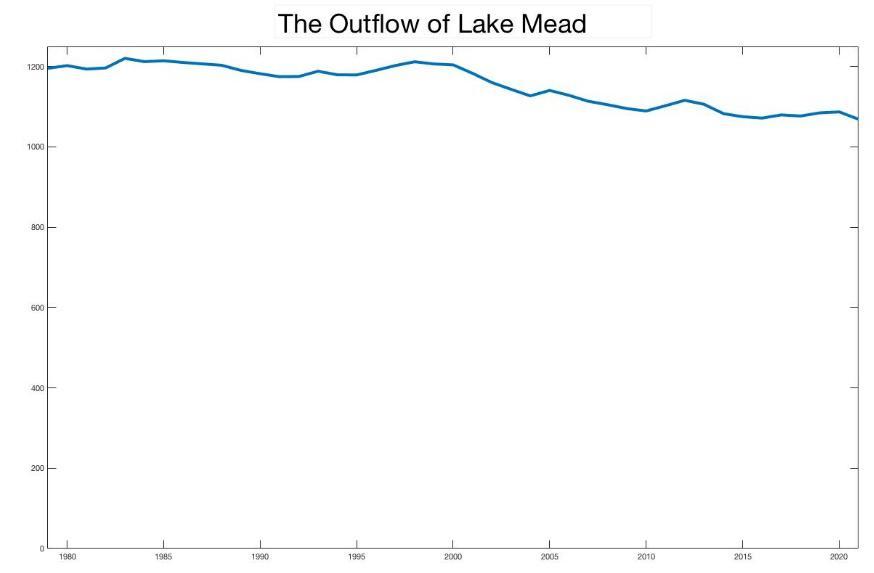 Figure3:The inflow from Colorado river
Figure4:TheoutflowofLakeMead
Figure3:The inflow from Colorado river
Figure4:TheoutflowofLakeMead
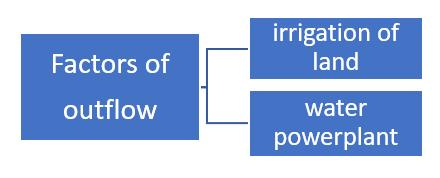
generation of electricity. Annual water deliveries from storage provided by Lake Mead helps to irrigate more than 2.5 million acres of land, and more than 80 percent are released through Hoover Dam for agriculture in California and Arizona.
The Hoover Powerplant is one of the largest hydroelectric installations in the US. There are 17 main turbines in the Hoover Powerplant, and every wing of the powerplant is 650 feet long, 150 feet above the water surface, and 299 feet above the powerplant foundation. The electricity generated from the Hoover Dam in an average year is enough to meet the use of nearly 1.4 million families.
The loss of Lake Mead is due to the evaporation and the water provided to SNWA municipal water. 10% of the lake water is evaporated and 4% is used for municipal water.
The factors that impact the loss of Lake Mead is the evaporation amount and the consumption of municipal water. 600,000-acre feet of water evaporate each year in Lake Mead [6], and it is about six vertical feet of water. Lake Mead contributes 90% of
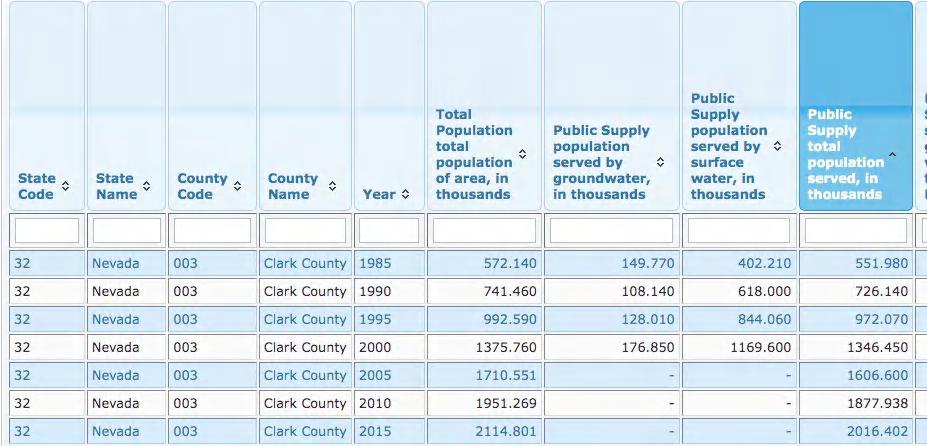 Figure 5:Factors that affect outflow from Colorado River
Figure 6:Amount of municipal water in Las Vegas and surrounding area
Figure 5:Factors that affect outflow from Colorado River
Figure 6:Amount of municipal water in Las Vegas and surrounding area
municipal water in Las Vegas municipal [7], and the amount of municipal water have increased rapidly since 1985.
The rate of change, at a certain time, is the difference between the rate of inflow and the rate of outflow.
�������� �������� = RC = RI RO (2.1)
where RC denotes rate of change, RI denotes the rate of inflow, and RO denotes the rate of outflow.
To get the RI, we can express it to [A T ], where A is the amount of substance, and T is the time. The equation below could be given, where VI denotes the volume of inflow.
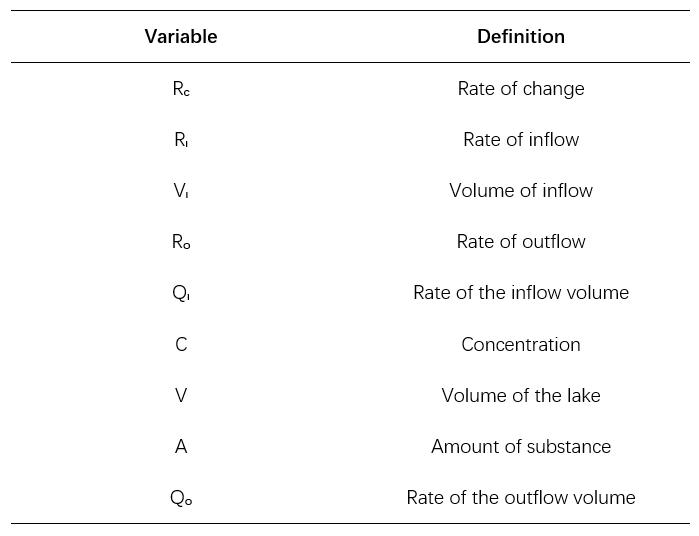 Table 2: VariableChart
Since [ �������� T ] denotes the volume flow rate of the inflow, and [ A V���� ] is the concentration. In this case, we consider the concentration is constant regardless of the position in the lake. Therefore, we could derive the equation below.
RI = QI × C (2.3)
Where RI denotes the rate of inflow, QI denotes the rate of the inflow volume of Lake Mead, and CI denotes concentration of the inflow.
This equation shows that the rate of inflow is the product of the volume rate of the water that flows in and the concentration, which yields the proportion of essential substance.
Similarly, we could use the same technique to express the rate of outflow. The rate of outflow is the product of the volume rate of the water that flows out and the concentration. We express the rate of the outflow volume as [���� ���� ], and concentration to [���� ���� ] , where QO denotes the rate of the outflow volume, A is the amount of and V denotes the volume of the lake. so we could get the equation below.
Since RO is the product of QO and C, we could derive the following equation, where A is the amount of substance in the lake, and V is the volume of the lake.
From the information above, we could get an equation about RC.
Then we transfer RC to the form of differentiation, which is �������� �������� , and we could get our final model of the inflow and outflow of the lake.
To test the effectiveness of AHP Model, we established two fictional characters named Tom and Mike and defined some subjective preference for each one of them. Tom thinks cost is the most important, while Mike thinks safety is the most important. The following is our calculation procedure for the verification process.
From the map of the lake, we could see that the shape of the lake is complicated. For this reason, we divide the map of the lake into small pieces, calculate the volume for each of them and add them together to get the final volume.

When calculating each piece, we have to know the area for the piece and the depth at each point.
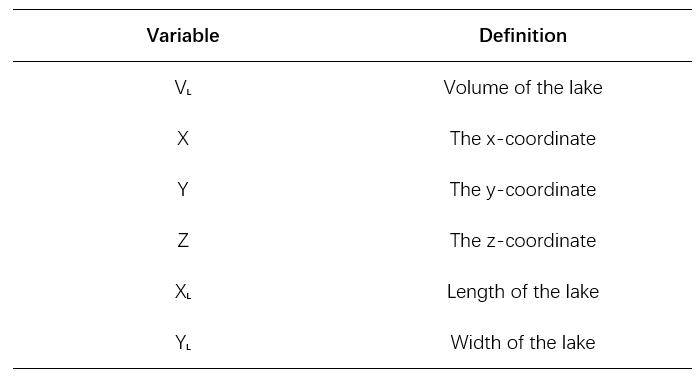
Using these data, we can create an x-y-z coordinate system. X and Y are the length and width of the surface, and Z is the depth. We create a plane for the bottom of the lake. Then we could use a double integral model to derive the volume of Lake Mead.
We first divide the volume into extremely small cuboids as shown in the graph, and assume that the depth doesn’t change at each cuboid.The sum of the volumes of all the small cuboids is the lake’s volume. The volume of each cuboid isthe productof length,width and depth. Since the depth doesn’t change in these small areas, we could calculate the sum as the equation below, where XL denotes the maximum X value, YL denotes the maximum Y value, VL denotes the volume of the lake, and Z(x,y) is the Z coordinate for (x,y), which represents the x and y position of any point in the lake.
Then we could fit the data of x,y and z into a fitted function Z=f(x,y)b y using the double integral and express the volume as the following equation.
This double integral allows us to calculate the volume between the x-y plane and the curved plane Z=f(X,Y).
We found a map [8]that shows the depth of the lake at different points. By putting the data in our model, the final result of the volume of the lake could be calculated.
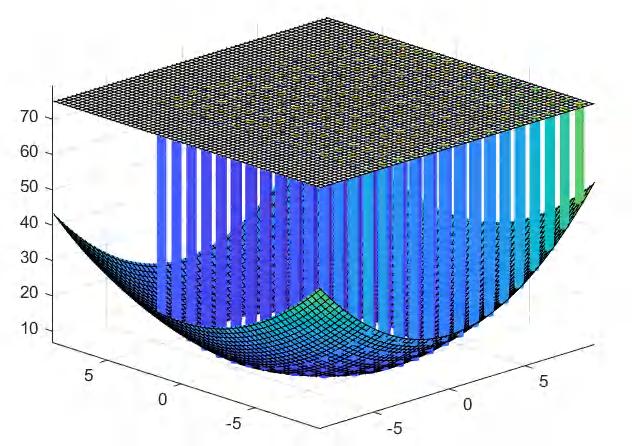 Figure 8: 3D model for Lake Mead
To define the drought period, we need to cluster the data into several types. In order to make this classification, we use the K-means algorithm. On one hand, the k of K-means is given, which means we can choose to class the data into types that we need. On the other hand, the algorithm itself has the function of optimization iteration, which revises and prunes the obtained clustering again to determine the clustering of some samples, and optimizes the unreasonable classification of the initial supervised learning samples. The K-means formula is shown below:
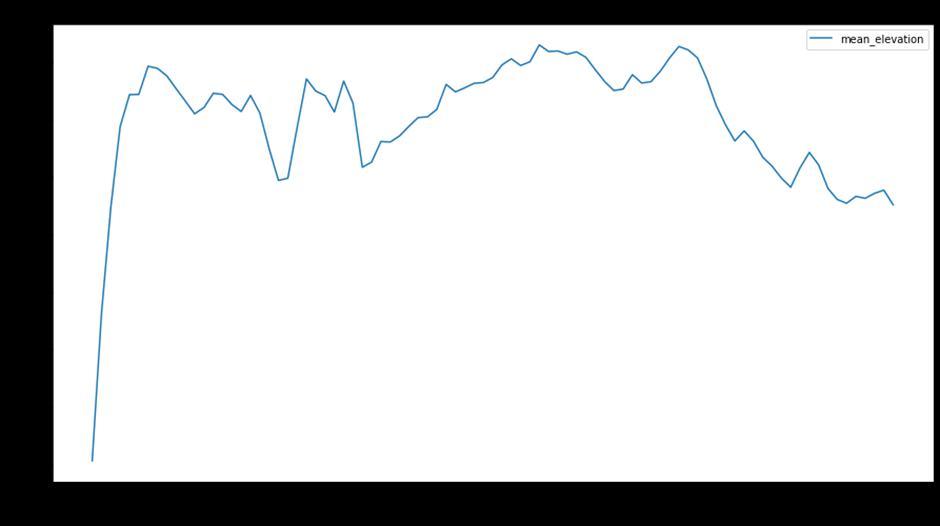
 Figure 9: A map shows depths at each point of Lake Mead
4. The Model for Lake Mead Water Level
4.1 Elevation Data Analysis and the Definition of Drought Period
Figure10:The year average water elevation-year diagram
Figure 9: A map shows depths at each point of Lake Mead
4. The Model for Lake Mead Water Level
4.1 Elevation Data Analysis and the Definition of Drought Period
Figure10:The year average water elevation-year diagram
Where the X is the sample collection of the average water elevation of the lake, U is the collection of the clusters, which refers to the “k” in K-means.
Where the E is the sum of square error, a is the mean vector of U. This formula describes the tightness of samples in the cluster around the mean vector of the cluster. The smaller the E value is, the higher the similarity of samples in the cluster is. It turns out that, as we reduce the magnitude of E, we have a more accurate classification.
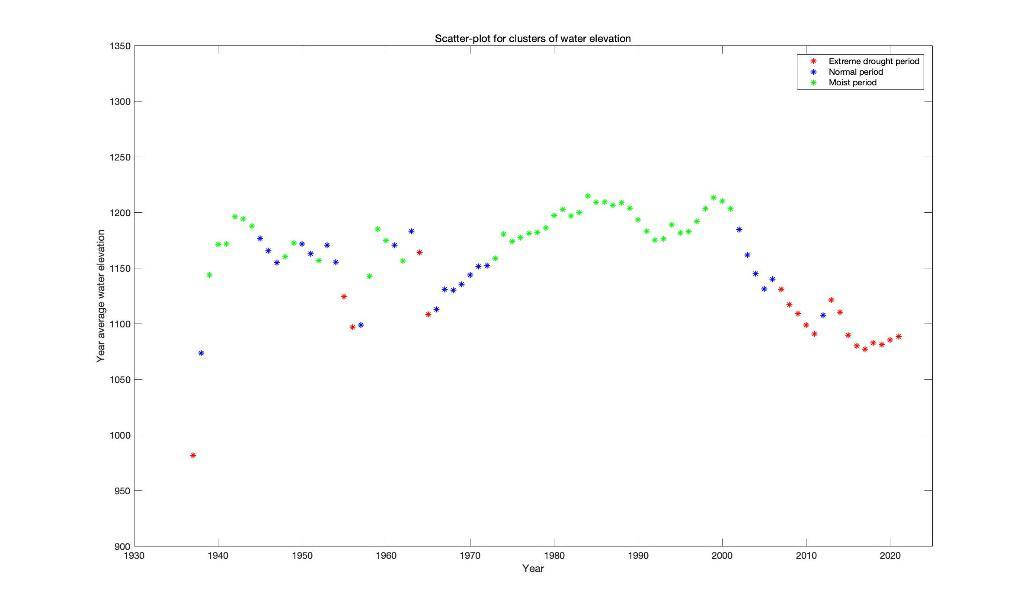
The data from the first year is regarded as an outlier, and the class in the red is defined as the drought period. Thus, the range of the drought period is:
Where L i is the water elevation belongs in the red class which is 1164.2 feet
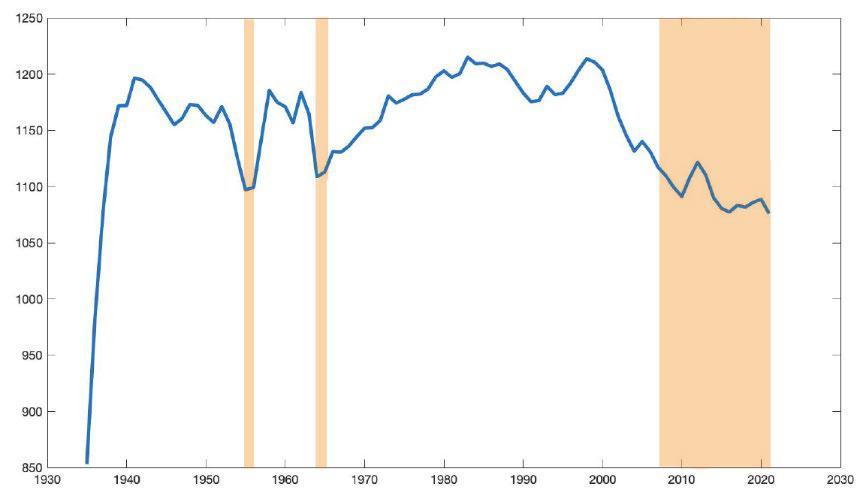
As Figure 12 shows, the shaded areas are the drought periods. Firstly, the overall trend in the data is decreasing from the yearly average Also, the drought period is lasting longer, as in 1955-1956 and 1964-1965, the drought periods only lasts two years. However, the most recent drought period (which is 20132021) lasts nine years and will be more. Consequently, the drought period is becoming longer and is a more serious problem.
The model 1 is considering data from only the most recent drought period and assume the most recent drought period's pattern continues. According to the classification, the most recent drought period is considered between 20132021.
even predict water levels in 2030 and
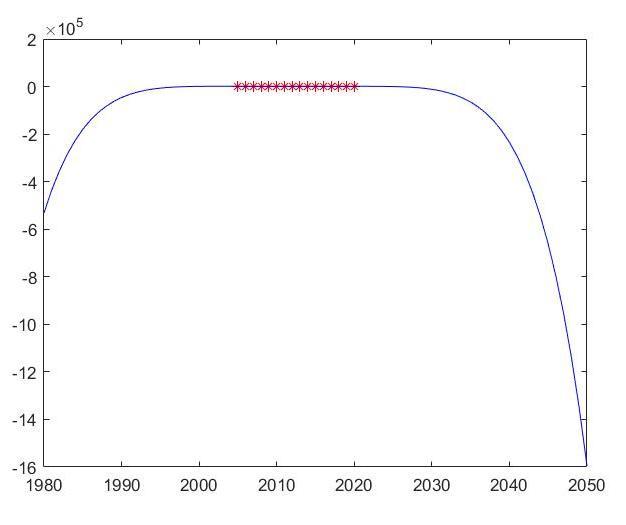
In this case, we use polynomial data fitting to predict the water elevation in the future. We take the average elevation data of 2013-2020 as the sample. The water elevation of year 2030 is 189.95 feet.The most recent drought period is too short compare to the time periodthat is needed to predict, thus the fitting data lacks accuracy and cannot 2050 (both of which are already negative).
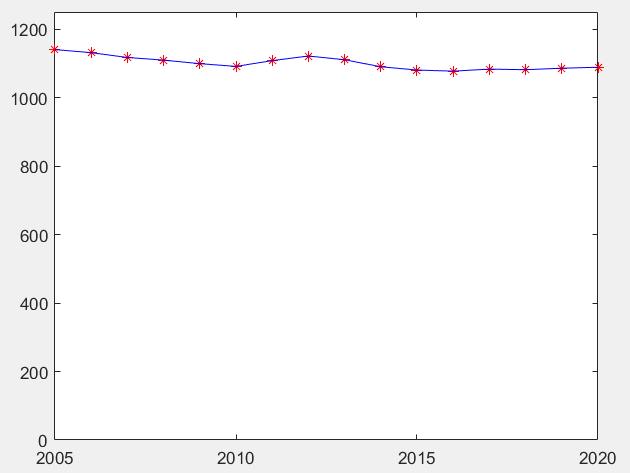
1 isusingwater level data from 2005 -2020 and assume this period's pattern continues. The average elevation data of 2005 -2020 as Figure14 shown.
 4.2 Prediction of Model 1
Figure 13: Fitting function predicted result
4.3 Prediction of Model 2
4.2 Prediction of Model 1
Figure 13: Fitting function predicted result
4.3 Prediction of Model 2
There is no clear trend in the water elevation data for these years, so we use one-time exponential smoothing in the time series model for prediction. The recurrence relation of the primary exponential smoothing method is as follows.
Where si is the value after smoothing on time step I, xi is the actual data on this time step α can be any value between 0 and 1
We get the prediction result as Figure 15 shown.
Figure 14:2005-2020 average water elevationThe water elevation of year 2030 is 191.28 feet. Same as above, the water level data from 2005-2020 is too short compare to the time period that is needed to predict, thus the fitting data lacks accuracy and cannot even predict water levels in 2030 and 2050 (both of which are already negative).
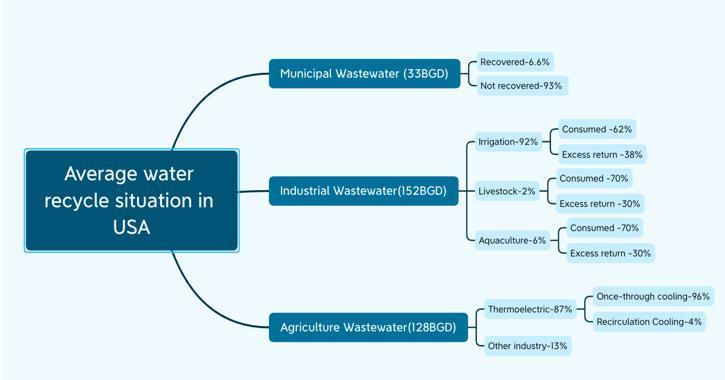
This section describes a possible model for establishing a water recycle system in a city, considering factors regarding local industrial structure, water reuse facilities, and the decision of local policy makers. The basic logic of the system is the Fit-for-Purpose Application of water reuse. It is described officially by the Environmental Protection Agency as “the treatment requirements to bring water from a particular source to the quality needed, to ensure public health, environmental protection, or specific user needs (EPA, n.d.).” Potential sources of water could originate from various aspects of a municipal economy; for instance, domestic, industrial, or agricultural wastewater. Accordingly, the demand for recycled water also has distinct requirements on the level of hygiene. Domestic use of water often requires higher level of wastewater treatment while the level of treatment for irrigation water is relatively lower.
The following departments of water usage are the possible sources for water recycling treatment. Each department has different efficiency of water recycling and corresponding applications.
Municipal wastewater, including domestic wastewater, is recycled through the sewage system to the treatment facilities. On average, only 6.6% of the usage is recovered and consumed again, according to the National Water Reuse Action Plan (2019). The rest of wastewater is discharged directly into the ocean or river.
Agricultural wastewater, including irrigation and livestock water usage, etc., has different ratio of recycle between agricultural types. Irrigation accounts for 92% of total usage, with 38% excess return flow. Similarly, livestock water withdrawal accounts for 2% while returning 30%; aquaculture withdraw 6% and return 30%.
Industrial wastewater, including water served as solvent of chemical effluent, is reused as a cooling device for the facilities since water have high specific heat. However, only 4% of water recycled is used as a recirculation cooling agent, which means it can be used multiple times.
The municipal power that is most significant for the case is their authority to
decide the local industrial structure. Different cities and towns have diversified major functions, and hence the total water recycle efficiency of the unique combination the three sectors mentioned above results in a different water reuse ratio.
In this section, a water recycle plan is proposed based on previous water recycle data. To maximize the incentive for the city to preserve and recycle scarce water resource, the plan includes a recycle evaluation method and a return flow reward system.
With help of the data gathered by the Environmental Protection Agency, we can estimate recycle efficiency from the industrial structure of water usage, as illustrated by Figure 16.
For municipal wastewater, 6.6% is recovered then redistributed to households. Therefore, the total recycle efficiency of this sector is 6.6%.
For industrial wastewater, 87% is withdrawn by thermoelectric industry. Furthermore, only 4% of the thermoelectric withdrawal could be reused as recirculation cooling. Hence, the final efficiency is calculated by 87%*4%, which is 3.48%.
For agriculture wastewater, each department would leave some excess water which could be recycled to a relatively low degree then reused onto that department once again. Therefore, the total efficiency is estimated to be 37.4%.
By using the total amount of water used and corresponding recycle efficiency, the predicted volume of water reused could be calculated using the following equation:
Figure16:Average Water Usage Data by EPAWhere �������� represents the predicted volume of water reused, �������� is the volume of water usage for the department i; �������� is the efficiency of water used of department i. Using the calculation, we can not only foresee the future water consumption, but also set different quota based on the economic situation of a certain city.
However, some cities may lack the necessary facilities to treat wastewater to a certain sanitation degree. Under these circumstances, municipal government could manage to dispose the sewage to the extent that would not cause harm to the river and its ecosystem. If the city could return excess treated water it cannot consume back to Lake Mead through tributaries, it would procure certain credit. Hence, the city could request higher water supply during the drought season, in proportion to the credit it gained.
Strengths and weaknesses of our model are summarized as follows:
Our model is fairly comprehensive, as it encompasses various categories of variables as well as multiple figures.
Our model is very objective, especially the inflow and outflow model, double integral and K-means model so there is little degree of error.
We collected various data from the reliable official websites, so the accuracy and quantity of the data and information in my model are significant.
We used two models to predict the water elevation, so it would be more precise.
We did not consider the inflow sources other than Colorado River when stating the factors that impact the inflow of the Lake Mead.
Some of our data is not updated because we did not find the updated data that are detailed enough.
Due to the small sample size, the use of time series methods does not predict the water level in 2030 and 2050.
7.�eferencelist:
[1]earthobservatory.nasa.gov.(2021).LakeMeadDropstoaRecordLow.[online]Available
at:https://earthobservatory.nasa.gov/images/148758/lake-mead-drops-to-a-record-low.
[2]Carlowicz,M.(2022).LakeMeadKeepsDropping.[online]earthobservatory.nasa.gov.
Availableat:
https://earthobservatory.nasa.gov/images/150111/lake-mead-keeps-dropping
[3]Rosen,M.,Turner,K.,Goodbred,S.andMeller,J.(2013).USGSCircular.1381:A SynthesisofAquaticScienceforManagementofLakesMeadandMohave.[online] pubs.usgs.gov.Availableat:https://pubs.usgs.gov/circ/1381/
[4]Runyon,L.(2018).AsRockyMountainSnowStartsToMelt,ColoradoRiverForecast Worsens.[online]KUNC.Availableat:
https://www.kunc.org/environment/2018-05-07/as-rocky-mountain-snow-starts-to-melt-co lorado-river-forecast-worsens
[5]Elliott,D.andPress,T.A.P.|T.A.(2019).SnowmeltfillsColoradoRiverandother waterwaysinU.S.Southwest,easingdroughtfears.[online]TheDenverPost.Availableat: https://www.denverpost.com/2019/06/13/snowmelt-colorado-river-drought/[Accessed14Sep. 2023].
[6]Nps.gov.(2016).EveryDrop:LakeMead’sWaterBudget-LakeMeadNational RecreationArea(U.S.NationalParkService).[online]Availableat:
https://www.nps.gov/lake/learn/water-budget.htm
[7]lvvwd.com(n.d.).LasVegasValleyWaterDistrict2019WaterQualityReport.[online]
Availableat:https://www.lvvwd.com/water-quality/reports/las-vegas-valley.html
[8]usa.fishermap.org.(n.d.).MeadLakenauticalchartandwaterdepthmap.[online]
Availableat:https://usa.fishermap.org/depth-map/mead-lake/#bottom-content[Accessed 14Sep.2023].
year_mean=zeros(87,1);
year_mean(1)=mean(MonthsLevel(1,2:12));
year_mean(87)=mean(MonthsLevel(87,1:9)); for i=2:86
year_mean(i)=mean(MonthsLevel(i,:)); end
%% % idx=kmeans(year_mean(2:87),3);
% year_index=1936;
% for m=1:86
% if idx(m)==1
% plot(year_index,year_mean(m),'r*');
% elseif idx(m)==2
% plot(year_index,year_mean(m),'g*');
% elseif idx(m)==3
% plot(year_index,year_mean(m),'b*');
% end
% hold on
% year_index = year_index+1;
% end
% plot(1935:2021,year_mean);
% axis([1935 2021 0 1250]);
ymean0520=year_mean(71:86); plot(2005:2020,ymean0520,'r*'); hold on plot(2005:2020,ymean0520,'b'); axis([2005 2020 0 1250]);
The essay mainly focuses on explaining the externalities of electric cars, the impact of government tax and subsidies, and the impact of electric vehicles on the labor market.At the same time, considering the existence of government failure, this paper also analyzes special situations such as the dependence of enterprises on government subsidies and the deceptionof subsidies for corruption.
2. Development of the electric car industry
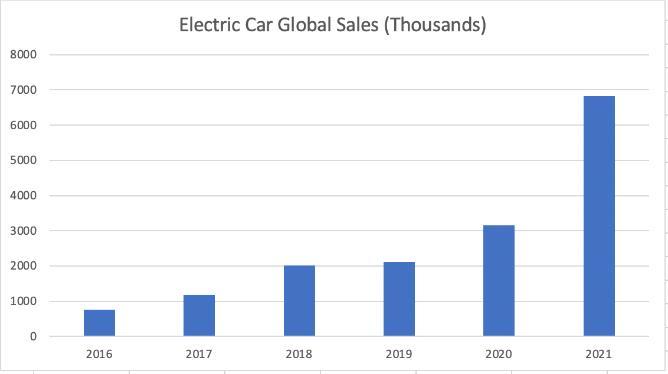
Technological developments converge human intelligence and instill the world with innovation and inspiration. Among the various kinds of technological products, electric cars acquirea great amount of popularity throughout the world.As shown in the diagram, from 2016 to 2021, global electric car sales increased from approximately 800 thousandto 6.6 million. With further technological investment, electric car sales are inclinedto increase, and the industry possessesa broader prospect for development.
3. The explanation of those economic theories that will be used in the following analysis paragraphs
3.1 Externalities
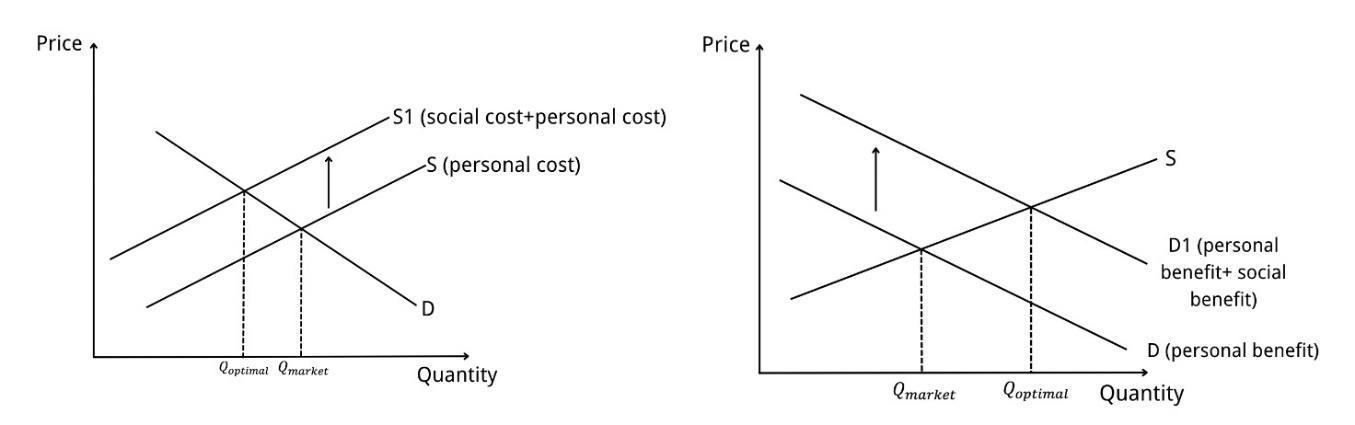
Externality refers to the situation that the actions and decisions of one person or a group of people cause additional damage or benefit to another person or group of people. If the impact on the bystanders is adverse, it is called a negative externality. If the impact on the bystanders is beneficial and has additional social value, it is called a positive externality. Therefore, when externalities exist,it often proves thatthe equilibrium ofthemarket is not the maximization of benefits, and there will be better choices in the market. Externalities can be solved automatically through private methods and markets, but sometimes they are ineffective. The most efficient way is government intervention, such as using taxes to limit products with negative externalities and subsidizing products with positive externalities.
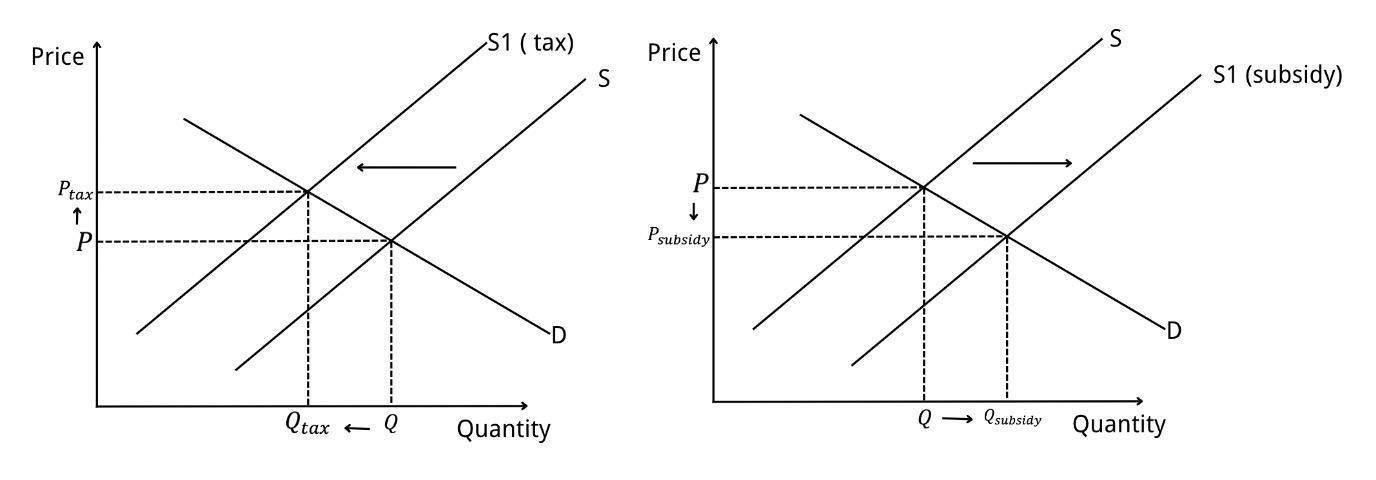
Tax revenue refers to the income that the state obtains from residents bythe law to provide public goods to society and meet the common needs of society. Tax is a very important policy, including both demand and supply tax. This policy can be imposed to limit the production of goods that have potential negative externalities and forced the market to make the most profitable decisions. Subsidies are direct payments made by governments to producers of goods and services. Therefore, a tax incidence or a subsidy cut would increase supply, which would shift the supply curve to the right, and vice versa.
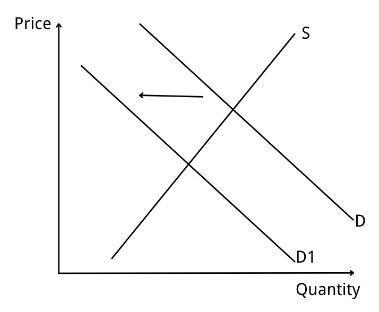
The labor force market is the place where various kinds of skilled workers get together and there will be a trade decided by the supply and demand of the labor force which is the people that can be employed.For example, according to the analysis in the table below, as the level of technology increases, the demand for labor in the industry will decrease, leading to an inward movement of the demand curve for the labor force.
There is no doubt that electric vehicles have positive externalities, and the social value they generate exceeds the private value. First of all, because the electric vehicle is the development of new technology, it creates knowledge for scientific research and application in other industries. Electric cars rely on the battery to run, which is completely
different from traditional vehicles which need petrol as the fuel, this new technology can also be applied to many other aspects to create more value for society. In addition, the emergence of electric cars has reduced the demand for conventionalvehicles,accordingtostatistics,electriccars,especiallythosethatrelyonnaturalgastogenerateelectricity, have arelatively weak ability to generate greenhouse gases. Duringthe process ofdevelopingthe technologytogenerate power by using renewable resources, the environmental damage caused by electric vehicle power generationwill be further reduced and had a positive impact on the environment. Due to the social value brought about by positive externalities, the optimal decision-making in the electric vehicle market is not the existing balance in the market, but rather the newequilibrium point on the outward-moving demand curve.
Electricvehicleswillbringsomenegativeexternalities,suchastheelectricalpollutioncausedbytheuseofbatteries, and the troubles of disposing of wasted batteries.First of all, the disposal of used batteries in electric vehicles is still trouble, because some of the raw materials, such as manganese and cobalt, are not environmentally friendly. Waste batteries can have negative externalities to the environment, causing water and air pollution, and inhibiting biological growth. Fortunately, electric vehicles have a very long lifespan, ranging from 10 to 15 years or even 20 years, which weakensthe negative externalities. In addition, there are some views that electriccars can lead to an increase in the number of vehicles on the road, leading to an increase in the negative externalities of congestion, and even lead to some unexpected problemsof reduced safety. However, the number of vehicles that can be used on the road is mainly limited by other government policies, the occurrence of electric cars will not increase the total amount of cars on the road, so the effect of this negative externality is also relatively low. Due to the generation of social costs, the currentbalance point in the electric car market is not the best, and the supply curve needs to move inward.
Government intervention is crucial to the development of the electric vehicle industry, which currently needs massive subsidies to scale up the industry so that it will not lose money or even make a profit. Given that most of the companies producing electric cars at this stage are privately owned, they operate in a profit-driven way. If there is no profit, there is no reason for them to continue to provide such a non-profitable product.Therefore, the government needs to invest a large number of subsidies or tax cuts to reduce the production cost of these enterprises, only in this way, enterprises have the incentive to produce electric vehicles. By takingindustry giant Tesla as an example, according to Linn (2021), it took 17 years for them to finally become profitable.
Therefore, government subsidies were a crucial part of keeping them going for 17 years, in addition to attracting investment.According to Tesla Inc. | Subsidy Tracker (n.d.), Tesla hadreceived about $2.5 billion in subsidies from the government over 17 years. But producing electric cars comes with a large industry barrier by nature. So we have reason to think that the industry has the conditions ofoligopoly, that is to say, the enterprises producing them are likely to achieve super profits after they get rid of losses. In this case, subsidies may result in x-inefficiency. As a result, companies are not operating in a way that maximizes their profits, and the value of subsidies is greatly diminished. In this case, other industries that also have positive externalities, including education, are more deserving targets.
In this part, the effect of the burgeoning electronic car industry on the labor force market will be discussed. There is data from seven factories in the table, including several of the world's leading automobile brand manufacturers, has been collected and analyzed, according to their employees' annual production of vehicles.
By dividing the number of cars produced by the number of employees, the labor cost required for each vehicle is ultimately obtained, and then the labor demand for electric cars and traditional cars is derived. It can be found that the average annual production of a single worker of a traditional automobile generally does not exceed 50, among which the value of German automobile only hovers around 14. By comparison, BYD, an electric-car brand, can produce an average of about 2 buses by one employee per year while making public buses is far more complex than making cars. The factory of Tesla in Shanghai, the world's largest car brand factory, produces an enormous 500 cars per employee per year.
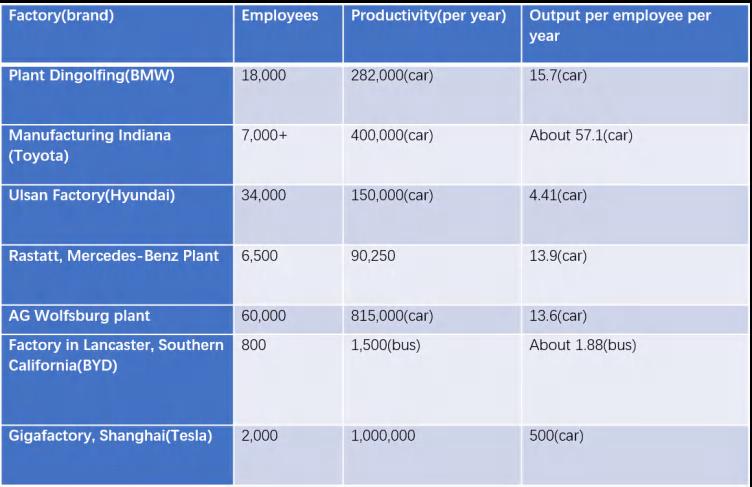
Through the above data, it can be found that the annual output per person of electric vehicles is much higher than that oftraditionalfuel vehicles.Thus,theproduction ofelectric vehicles requires far less labor than that of the traditional one. Thedemand for labor is a derivative product of the demand for matching goods. Therefore, when products like electric cars which do not require a large amount of labor gradually become more popular and occupy much proportion of the market, the demand for labor will reduce dramatically, leading to less employment and relatively lower prices.
In the short run, governments could reduce taxes on the electric vehicles industry and increase consumer subsidies. The policies can reduce the price and increase the purchasing number of electric vehicles by shifting the supply and demand curves.As the production cycle for electric cars is shorter than the traditional car industry, like Tesla's factories churn out an electric vehicle every two workers a day, and the materials are relatively easy to obtain, electric cars have a relatively elastic price elasticity of supply. So it is efficient for government to reduce the corporation tax.
In the mid-and-long term, the government could boost the supply of electric cars by subsidizing electric car manufacturers. Due to the electric car industry still developing, carmakers need incentives to keep investing in technology until it becomes profitable. However, there will be many electric vehicle companies cheating subsidies. For instance, according to Guo (2017), China's finance minister said five bus manufacturers had defrauded $146 million worth of subsidies in September 2016.
In the very long run, the government can provide free public charging stations and provide information to buyers to reduce information failures. These policies can help motivate consumers, but it needs to take a long time to achieve and has a significant opportunity cost. Moreover, the development of the electric car industry will lead to less demand for fuel and, therefore, less government tax on fuel. As the tax revenue on fuel accounts for a large proportion of the total tax revenue of all countries. For example, according to U.S. State and Local Motor Fuel Tax Revenue 2019 (n.d.),
data from 2018-2020 show that in the United States, fuel taxes accounted for 1.5 percentof total tax revenue. If the government strongly supports the push for electric cars, it will increase government spending and reduce tax revenues by a lot. Taxpayers will ultimately pay for the increase in government spending.
In a nutshell, if the government does not intervene, the electric vehicle industry will decline and many companies may go out of business or stop further research into the technology due to the lack of capital support. In this way, the country's entire electric vehicle industry will lag behind the world in the long term, and the supply of electricvehicles will highly rely on imports. Therefore, there will be a deterioration in the current account.
8. Possible government failures and solutions
8.1 Excessive subsidies. Producers in the electric car industry may overstate production costs to get more subsidies. This could lead to over-reliance on subsidies. The problem may also stem from the government's lack of understanding of the electric vehicle industry, thus overestimating production costs and giving excessive subsidies.
8.2 8.3 8.4
Lack of tiered subsidies. Subsidies based on the number of vehicles, regardless of the technology involved, may discourage firms from spending money on technological innovation
Subsidy fraud. According toCui (2017), twelve companies in China are suspected of defrauding government subsidies. This is a huge waste of government resources.
In this regard, the government should reduce subsidies moderately and strictlyrestrict the use of subsidy funds in addition toestablishinga punishment system includingbut notlimitedto fines.At the same time, the government should also conduct thorough due diligence on companies applying for relevant licenses to ensure that they are ableto produce electric cars.
In a nutshell, it is significant for the government to intervene in those industries which have externalities because in most cases, the supply and demand in the market of those industries will not automatically adjust to the point where the social profits are greatest and the social costs are the lowest. Regarding the degree of involvement, because the electric vehicle industry hasrelatively more positive externalities, this industry should be supported by increasing subsidies and reducing taxes. However, because of the government’sfailure and some companies will cheat for the subsidy without making any improvements, the governments should supervise the firms usingthe money to focus on developing the technology.Also, governments should make better standards to restrict the number and scale of the companies that can join the electric cars industry to prevent the waste of resources.
However, the government should not intervene excessivelyin this industry,such asnationalizingit. Because electric vehicles are a private good, the cost of nationalization will be extremely high and the effect is not obvious.At the same time, electric vehicles also cause some problems, such as an increase in unemployment. Therefore, in the short term, the government should provide new training and unemployment benefits to those victims of the electric vehicle industry. In the long run, the government should actively explore new employment opportunities related to electric car production.
19/03/2023
29/89
10. References List:
1.BMW GROUP. (n.d.). BMW Group Plant Dingolfing. Www.bmwgroup-Werke.com. Retrieved March 17, 2023, from https://www.bmwgroup-werke.com/dingolfing/en.html
2. Careers – Tour Toyota Dev Site. (n.d.). Toyota. Retrieved March 17, 2023, from https://tourtoyotabisig.com/careers/
3 Cui, H. (2017, May 30). Subsidy fraud leads to reforms for China’s EV market. International Council on Clean Transportation. https://theicct.org/subsidy-fraud-leads-to-reforms-for-chinas-ev-market/
4 Guo, S. (2017, October 11). Just the beginning Chinese Automaker Brings 1,200 Jobs to U.S. China General Chamber of Commerce - USA. https://www.cgccusa.org/en/just-the-beginning-chineseautomaker-brings-1200-jobs-to-u-s/
5 Hyundai Motor: production volume Ulsan South Korea 2020. (n.d.). Statista.
https://www.statista.com/statistics/1176271/hyundai-motor-company-production-volume-ulsansouth-korea/
6.Infographic: Global Electric Car Sales Doubled in 2021. (n.d.). Statista Infographics. Retrieved March 19, 2023, from https://www.statista.com/chart/26845/global-electric-carsales/#:~:text=While%202021%20was%20another%20difficult%20year%20for%20the
7. Jones, P. (2022, October 9). 5 Common Problems With Batteries In Electric Cars (Explained). Motorandwheels.
https://motorandwheels.com/electric-car-battery-problems/
8 Lambert, F. (2023, February 1). Tesla plans to ramp up Giga Shanghai production after surge in orders, report says. Electrek. https://electrek.co/2023/02/01/tesla-plans-ramp-up-giga-shanghai-productionafter-surge-orders-report/
9 Linn, J. (2021, April 15). Who Benefits from EV Subsidies? The Complicating Role of Zero-Emissions
Vehicle Standards. Resources for the Future. https://www.resources.org/common-resources/who-
19/03/2023
benefits-from-ev-subsidies-the-complicating-role-of-zero-emissions-vehicle-standards/
10 Movement, Q. ai-Powering a P. W. (2022, September 8). Tesla Stock Breakdown: By The Numbers, How Does Tesla Make Money In 2022? Forbes. https://www.forbes.com/sites/qai/2022/09/08/tesla-stockbreakdown-by-the-numbers-how-does-tesla-make-money-in-2022/?sh=d5aea0032c75
11 Newcomb, T. (2017, January 5). 7 of the World’s Largest Manufacturing Plants. Popular Mechanics; Popular Mechanics. https://www.popularmechanics.com/technology/infrastructure/g2904/7-of-theworlds-largest-manufacturing-plants/
12 Rapson, D., & Muehlegger, E. (2022, January 24). The Not-So-Certain Economics of Electric Vehicles. Milken Institute Review. https://www.milkenreview.org/articles/the-not-so-certain-economics-ofelectric-vehicles
13 Rastatt, Mercedes-Benz Plant. (n.d.). Mercedes-Benz Group. https://group.mercedesbenz.com/careers/about-us/locations/location-detail-page-5203.html
13.Tesla Inc. | Subsidy Tracker. (n.d.). Subsidytracker.goodjobsfirst.org. https://subsidytracker.goodjobsfirst.org/parent/tesla-inc
15.TESMANIAN. (2002, February 22). Tesla Giga 3 Phase 2 in Shanghai Major Preparatory Project, Gov Helps Resumes Production. TESMANIAN. https://www.tesmanian.com/blogs/tesmanian-blog/teslagiga-3-phase-2-in-shanghai-major-preparatory-project-gov-helps-resumes-production
16 U.S. state and local motor fuel tax revenue 2019. (n.d.). Statista. https://www.statista.com/statistics/249129/usstate-and-local-motor-fuel-tax-revenue/
17.Volkswagen AG Wolfsburg plant. (n.d.). Volkswagen Newsroom. https://www.volkswagennewsroom.com/en/volkswagen-ag-wolfsburg-plant-6811
18. Yan, Q. (2017, February 5). Seven Chinese automakers punished for electric-vehicle subsidy fraud - CGTN. News.cgtn.com. https://news.cgtn.com/news/3d51544e77496a4d/share_p.html
Across-sectionalstudyoftheassociation betweenenvironmentalawarenessand EVpurchasinginclination

AuthorsName/sper1stAffiliation(Author) line1(ofAffiliation):deptnameoforganization line2-nameoforganization,acronymsacceptable line3-City,Country line4-e-mailaddressifdesired
AbstractWiththeadventofelectricvehicle(EV),more peoplechoosetopurchasethiskindofvehicle.However,their purchasingmotivesmayvarygreatlyamongdifferentgroupsof peopleInthisstudy,stated-choiceexperimentisappliedtofind theeffectofenvironmentalawarenessaswellaseconomyonEV purchasinginclination,anddemographicvariablesare investigated,usingmultivariatelogisticregressionmodelThe studyshowsthatEVpurchasinginclinationismorepositively associatedwithenvironmentalawarenessthaneconomicreason; AmongallreasonsforpurchasingEV,believingEVshavegood ancillaryfacilityispositivelyassociatedwithpurchasingEV(� =1.21,p=0.05);FamiliarwithEV-relatedpolicypositivelyaffects purchasingEV(�=1.96,p<0.001);Forpeoplelivingindifferent cities,thosewholiveinthesecond-tiercityaremorelikelyto purchaseEV(�=2.93,p<0.001).
Keywordscomponent;EVpurchasinginclination;statedchoiceexperiment;logisticregressionmodel;
Greenhousegasesposeseriousharmonglobalclimateand airquality[1].Moreover,oneoftheUnitedNationsustainable developmentgoals(SDG)aretoensurethatcleanand affordableenergyisaccessibleuniversally.Althoughtheworld isstrivingtoapproachthisgoal,thepaceisstilllow[2].Under thiscontext,becauseelectricitycomesfromrenewableenergy, electricvehicle(EV)couldcontributetothereductionof greenhousegasesemission[3].Severalpoliciessupporting EVsareimplementedinthemarketstopromoteEVadoption overthelastdecadeHowever,230millionEVsarerequiredto beputonroadin2030toaccomplishtheIEASustainable DevelopmentScenario[4]
SeveralfactorscouldaccountfortheEVpurchasing inclinationPro-environmentalbehaviorcouldbeoneofthem, whichreferstotheactionofprotectingtheenvironmentand contributingtoasustainableenvironment[5]Othersprefer EVsbecausetheyarecostsavingUnderdifferent circumstances,peoplefocusondifferentnotions
Severalstudieshavebeenconductedtofindtheunderlying reasonofpurchasingEV.EVadoptionbehaviorand satisfactiondegreearecomparedbetweenChinaandKorean
AuthorsName/sper2ndAffiliation(Author) line1(ofAffiliation):dept.nameoforganization line2-nameoforganization,acronymsacceptable line3-City,Country line4-e-mailaddressifdesired
buyersduetodifferentculturalbackgroundThestudyfound thatKoreanbuyersfocusmoreoneconomicreasonthanthey doonenvironmentalprotection[6]Butdemographicfactors withinthesamecountryarenotincludedinthestudyAnother studywasalsocarriedouttoevaluatetheeffectofpolicyon theadoptionofEVbyusingTranstheoreticalModelofChange (TTM),acommonprocessofchangecouldbeexpressedby summarizingagreatvarietyofhealthbehaviors[7],and ProtectionMotivationTheory(PMT),theanalysisofindividual responseswhenoneexperiencesapotentialharm[8],which showsthatpolicyispositivelyassociatedwithEVadoption andpeoplewithhigherself-efficacyshowsmoretendencyto adoptEVs[9]However,littleattentionwasplacedonhow otherfactors,otherthanpolicyincentives,influencepeople’s purchasinginclinationThisstudyfocusesonhow demographicvariables,reasonsforandmeritsofpurchasing EV,angwhetherpeoplearefamiliarwithEV-relatedpolicy haveanimpactonEVpurchasinginclination
AStudydesignanddatacollection
Thiscross-sectionalstudyobtaineddatafrom224peoplein ChinaThedatawascollectedonSojumpplatformthroughthe formofquestionnaire,whichwasspreadinseveralWeChat groupscontainingpeoplelivinginthefirst,second,andthird tiercityinChinaThequestionnaireincludesthreetypesof questionsgapfillingaboutthenumberofeducationyears, single-choicequestionaboutlivingplace,gender,agerange, incomerange,whetherpeoplearefamiliarwithEVpolicy,and whetherpeoplearewillingtobuyEVorconventionalcar,and multiple-choicequestionwhereparticipantscanselectmore thanoneoptionaboutthereasonandmeritforpurchasingEV Theresultsofindividualquestionnairewerethenpresentedon Sojumpplatformforfurtheranalysis.
Inthisstudy,thereisonedependentvariable:whether consumersarewillingtopurchaseEVorconventionalcarThe dependentvariablewasrecordedintobinaryresultsas:‘1’=
willingtopurchaseEVand‘0’=willingtopurchase conventionalcar.
Fifteenindependentvariablesareconsideredinthisstudy. Thesevariableswereclassifiedintothreetypes:(1)whether peoplearefamiliarwithEV-relatedpolicy,(2)reasonsfor purchasingEV,and(3)meritsofpurchasingEVThe independentvariableswereselectedbasedonrelatedtheories Theindependentvariableforthefirsttypewasrecordedinto binaryresultsas:‘1’=familiarwithEV-relatedpolicyand‘0’= unfamiliarwithEV-relatedpolicy;Theindependentvariables forthesecondandthirdtypewererecordedintobinaryresults as:‘1’=thepersonthinkstheelementcontributestothe decisionofpurchasingEVand‘0’=thepersonthinksthe elementdoesnotcontributetothedecisionofpurchasingEV.
Fivedemographicvariables(gender,age,educationyears, income,andlivingplace),asdemographicvariables,are includedinthisstudy.
Whencategoricalresponseisavailable,logisticregression modelisusedtoestimatetheeffectofvariousfactorsInthis study,Y1iisthebinaryresultofwhetherpeoplearewillingto purchaseEVstheithparticipant,respectively.Thebinary responseYmi,wheremisusedinthreedifferentmodels (reasons,merits,policy),explanatoryvariablesX,andthe logisticregressionmodelisshownbelow[9]:
Consideringtheelementsofmeritsoforreasonfor purchasingEVandwhetherpeoplearefamiliarwithEVrelatedpolicyasindependentvariablesissufficienttorunthe logisticregressionmodelButdoingthiswouldignorethe impactofdemographicvariablesonwhetherpeoplechooseto purchaseEVTosolvethisproblem,demographicvariables withindependentvariablesarealsoincludedinthemodelto comparewiththeeffectofonlyindependentvariables.Andthe modelfurtherexplorestherelationshipbetweenwhether peoplearelikelytopurchaseEVwithonlydemographic variables.
RStudioisresponsibleforimportingandorganizingthedata aswellasconductingtheanalysisbyapplyingthepackageof VGAM[10],whichwasgeneralizinglinearfactors.
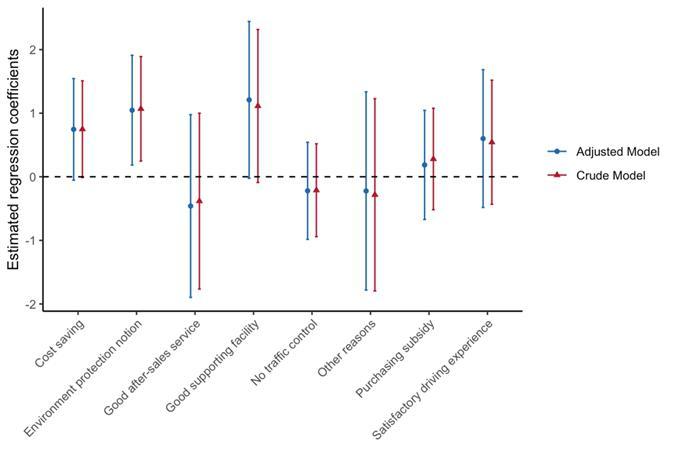
Fromfigure1,theeightelementsofreasonsforpurchasing EV,environmentalprotectionnotionisthesignificantandis secondlypositivelyrelatedwithwhetherpeoplearelikelyto purchaseEVcomparedwithgoodsupportingfacility,whichis notsignificantenough;Costsaving,goodsupportingfacility, purchasingsubsidy,andsatisfactorydrivingexperienceare moderatelyrelatedwiththedependentvariable,butallofthem experiencealargerdegreeofestimatingerrors;Goodaftersalesserviceandnotrafficcontrolarenegativelyrelatedwith thedependentvariableandbearalargeestimatingerror. Furthermore,theresultofadjustedmodelismostlycoherent withthatofcrudemodel,meaningthatthedemographic variablesimposelittleimpactontheoutcome.
purchasingEV(Y1i)whenothercovariatesXaregiven
Thelogistic(logodds)thatshowthelinearrelationshipwith explanatoryvariablescanbewrittenas:
Inthisregressionmodel,thenullhypothesis,whichmeans that�equals0,claimsthattheprobabilityofsuccessdoesnot dependoncovariateXStatisticsgivenbyβ/seˆ(βˆ)isusedto detectthesignificanceofeachfactor,havingasignificant portionofthenormaldistributionInlogisticregressionmodel, oddsratioisameasurementwhichshowstherelationship betweencategoricalvariablesTheoddsratioisgivenby:
Figure1Estimatedregressioncoefficientsofeightreasonsfor
Whentheoddsratioiscloserto1,itmeansthatless dependencyexistingbetweenindependentanddependent variables
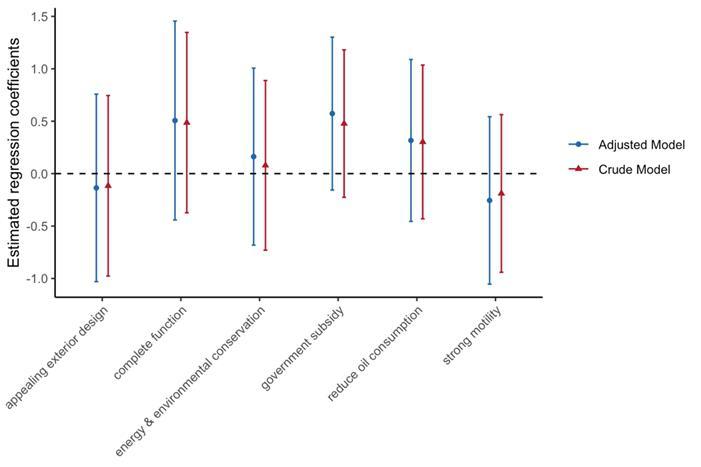
Fromfigure2,thesixelementsofmeritsofpurchasingEV,all ofthefactorsarenotprominentenoughandbearalarge estimatingerror.Completefunction,energyandenvironmental conservation,governmentsubsidy,andreductionofoil consumptionarepositivelyrelatedwithwhetherpeopleare likelytopurchasingEVinaweakerdegree;Appealingexterior designandstrongmotilityarenegativelyrelatedwiththe
dependentvariabletheresultofadjustedmodelismostly coherentwiththatofcrudemodel,meaningthatthe demographicvariablesimposelittleimpactontheoutcome
Fromthetable2,peoplewhoarefamiliarwithEV-related policyaremorelikelytopurchaseEV.Andtheadjustedmodel doesnotvarymuchfromthecrudemodel,sotheimpactof demographicvariablesislow.
TABLEIITHEIMPACTOFWHETHERPEOPLEAREFAMILIARWITHEVRELATEDPOLICYWITHWHETHERPEOPLEARELIKELYTOPURCHASEEV
Figure2.Estimatedregressioncoefficientsofsixmeritsof purchasingEV
Fromtable1,cityclassistheonlydemographicvariable whichissignificanttorejectthenullhypothesis.Peopleliving insecondandthird-tiercityaremorelikelytopurchaseEV Additionally,peoplelivinginthesecond-tiercityshowsmore tendencytochooseEVthanthoselivinginthethird-tiercity.
Fromtable2,cityclassistheonlydemographicvariablewhich issignificanttorejectthenullhypothesisPeoplelivingin secondandthird-tiercityaremorelikelytopurchaseEV. Additionally,peoplelivinginthesecond-tiercityshowsmore tendencytochooseEVthanthoselivinginthethird-tiercity
Fromthedatacollectedfrom224participants,wecansee thatonlythebarofenvironmentalprotectionnotioninFigure1 showsastrongassociationbetweentheindependentand dependentvariablesOtherbarsfailtopassthethresholdmeans thattheyareinsignificantOneoftheexplanationisthelackof dataWhenthedataissufficient,thetrendismorelikelyto becomeprominentTheresulthasshownthatwhetherpeople arelikelytopurchaseEVsaremorelikelyassociatedwith environmentalawarenessthaneconomicreasons,whichis consistentwiththeresultin2017[1]
WhetherpeoplearelikelytopurchaseEVsismore associatedwithenvironmentalawarenessthaneconomic reasons;BelievingEVshavegoodancillaryfacilityis positivelyassociatedwithpurchasingEV;FamiliarwithEVrelatedpolicypositivelyaffectspurchasingEV;Inaddition, peoplelivinginsecond-tiercityaremorelikelytopurchaseEV thandopeoplelivinginothercitiesFuturestudywouldalso includemorecomplexfactors,otherthandemographicfactors, toexplorethepeople’sinclinationofpurchasingEV
[1]Degirmenci,KandBreitner,MH(2017)Consumerpurchase intentionsforelectricvehicles:Isgreenmoreimportantthanpriceand range?TransportationResearchPartD:TransportandEnvironment,51, pp250–260doi:https://doiorg/101016/jtrd201701001
[2]UnitedNations(2015)THE17GOALS|SustainableDevelopment [online]sdgsunorgAvailableat:https://sdgsunorg/zh/goals
[3]IEA(2021)Policiestopromoteelectricvehicledeployment–Global EVOutlook2021–Analysis[online]IEAAvailableat: https://wwwieaorg/reports/global-ev-outlook-2021/policies-to-promote -electric-vehicle-deployment
[4]Krajhanzl,J.(2010)EnvironmentalandPro-environmentalBehavior.
[5]Mimiaga,MJ,Reisner,SL,Reilly,L,Soroudi,NandSafren,SA (2009)Chapter8-Individualinterventions[online]ScienceDirect Availableat:https://wwwsciencedirectcom/science/article/pii/ B978012374235300008X
[6]Shillair,R(2020)ProtectionMotivationTheoryTheInternational EncyclopediaofMediaPsychology,pp1–3doi:https://doiorg/10 1002/9781119011071iemp0188
[7]Chu,W,Im,M,Song,MRandPark,J(2019)Psychologicaland behavioralfactorsaffectingelectricvehicleadoptionandsatisfaction:A comparativestudyofearlyadoptersinChinaandKoreaTransportation ResearchPartD:TransportandEnvironment,76,pp1–18 doi:https://doiorg/101016/jtrd201909009
[8]Langbroek,JHM,Franklin,JPandSusilo,YO(2016)Theeffectof policyincentivesonelectricvehicleadoption.EnergyPolicy,[online]94, pp94–103doi:https://doiorg/101016/jenpol201603050
[9]AgrestiAAnintroductiontocategoricaldataanalysis:JohnWileyand Sons;2018
[10]ThomasYFittingvectorgeneralizedlinearandadditivemodelsusing VGAMPackageofRRetrievedApril2020
A H e t e r o g e n e o u s G r a p h N e u r a l N e t w o r k M o d e l f o r E l e c t r i c V e h i c l e P u r c h a s e P r o p e n s i t y P r e d i c t i o n
,

W o r k s C i t e d [ 1 ] L a M o n a c a S , R y a n L . T h e s t a t e o f p l a y i n e l e c t r i c v e h i c l e c h a r g i n g s e r v i c e s –A r e v i e w o f i n f r a s t r u c t u r e p r o v i s i o n , p l a y e r s , a n d p o l i c i e s [ J ] R e n e w a b l e a n d s u s t a i n a b l e e n e r g y r e v i e w s ,
7 3 3

:
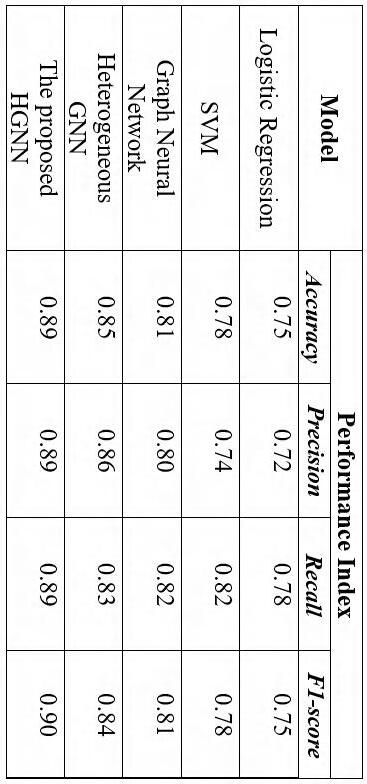
C o n c l u s i o n ü O u r p r o p o s e d H G N N m o d e l o u t p e r f o r m s a l l o t h e r m o d e l s , a c h i e v i n g a n a c c u r a c y o f 8 5 % a n d a n F 1s c o r e o f 0 . 8 4 . T h e H G N N m o d e a l s o a c h i e v e s t h e h i g h e s t p r e c i s i o n o f 0 . 8 6 , i n d i c a t i n g t h a t i t i s b e t t e r a t i d e n t i f y i n g t r u e p o s i t i v e s c o m p a r e d t o t h e o t h e r m o d e l s ü T h e p r o p o s e d m o d e l h a s p r a c t i c a l i m p l i c a t o n s f o r m a n u f a c t u r e r s a n d p o l i c y m a k e r s t o d e v e l o p e f f e c t i v e m a r k e t i n g s t r a t e g i e s a n d i n c e n t i v e s t o e n c o u r a g e E V a d o p t i o n F u t u r e w o r k i n c l u d e s e x p l o r i n g t h e e f f e c t i v e n e s s o f o t h e r d a t a s o u r c e s a n d i m p r o v i n g m o d e l i n t e r p r e t a b i l i t y
1 T h i s p a p e r b u i l d s a H e t e r o g e n e o u s I n f o r m a t i o n N e t w o r k ( H I N ) t o r e p r e s e n t v a r i o u s e n t i t i e s i n a n o n l i n e p l a t f o r m , s u c h a s u s e r s , p r o d u c t s , a n d s t o r e s , a n d t h e r e l a t i o n s h i p s a m o n g t h e m
2 T h i s p a p e r i n t r o d u c e s f a c t o r s s u c h a s b r a n d r e c o g n i t i o n , e d u c a t i o n a n d a w a r e n e s s , a n d l o c a l p o l i c i e s , a n d a c c o r d i n g l y p r o p o s e s a h e t e r o g e n e o u s g r a p h n e u r a l n e t w o r k s t r u c t u r e m o d e l f o r e l e c t r i c v e h i c l e p u r c h a s e p r o p e n s i t y p r e d i c t i o n
3 T h e p r o p o s e d H G N N m o d e l c o n s i s t s o f : ( 1 )
D a t a d e s c r i p t i o n
O u r s o l u t i o n n T h e d a t a s e t u s e d i s c o l l e c t e d f r o m t h e o n l i n e c a r f o r u m a n d d a t a p r o v i d e d b y s o m e c a r s e l l e r s T h e d a t a s e t c o n t a i n s s e v e r a l f e a t u r e s s u c h a s c h a r g i n g i n f r a s t r u c t u r e , e n v i r o n m e n t , e c o n o m i c b e n e f i t s , b r a n d r e c o g n i t i o n , e d u c a t i o n a n d a w a r e n e s s , a n d o c a p o l c i e s . n T h e d a t a s e t c o n s i s t s o f 1 0 , 0 0 0 s a m p l e s w t h 8 f e a t u r e s a n d a b i n a r y l a b e l i n d i c a t i n g w h e t h e r t h e p e r s o n i s l i k e l y t o p u r c h a s e a n E V o r n o t n W e t h e n s p l i t t h e d a t a s e t i n t o t r a i n i n g a n d t e s t n g s e t s u s i n g a 7 0 : 3 0 r a t i o T h e d a t a s e t w a s s e p a r a t e d b y 7 0 % f o r t r a i n i n g , 1 5 % f o r v a l i d a t i o n a n d 1 5 % f o r t e s t i n g
2 4 % o f g l o b a l e n e r g yr e l a t e d C O 2 e m i s s i o n s , m a k i n g i t o n e o f t h e l a r g e s t c o n t r i b u t o r s t o c l i m a t e c h a n g e l T h e a d v a n t a g e s o f e l e c t r i c v e h i c l e s i n c l u d e l o w e m i s s i o n s a n d h i g h e f f i c i e n c y , b u t l i m i t e d r a n g e , h i g h c o s t a n d t h e n e e d f o r c h a r g i n g i n f r a s t r u c t u r e l C o n s u m e r a t t i t u d e s t o w a r d E V s a r e i n f l u e n c e d b y a r a n g e o f f a c t o r s , i n c l u d i n g v e h i c l e p e r f o r m a n c e , c o s t , c h a r g i n g i n f r a s t r u c t u r e , a n d e n v i r o n m e n t a l c o n c e r n s
l M a c h i n e l e a r n i n g a n d d e e p l e a r n i n g t e c h n i q u e s h a v e b e e n w i d e l y u s e d t o p r e d i c t E V p u r c h a s e p r o p e n s i t y
R e l a t e d w o r k s u T h e i d e a o f u s i n g n e u r a l n e t w o r k s f o r g r a p hs t r u c t u r e d d a t a d a t e s b a c k t o t h e e a r l y 2 0 0 0 s , w h e n n e u r a l n e t w o r kb a s e d g r a p h m a t c h i n g a l g o r i t h m s w e r e i n t r o d u c e d u A m e s s a g ep a s s i n g f r a m e w o r k s p r o p o s e d t h a t i t e r a t i v e l y u p d a t e s n o d e r e p r e s e n t a t i o n s b y a g g r e g a t i n g a n d t r a n s f o r m i n g i n f o r m a t i o n f r o m n e i g h b o r i n g n o d e s i n t h e g r a p h I n t h e c o n t e x t o f G N N s , a m e s s a g e p a s s i n g f r a m e w o r k i s u s e d t o i t e r a t i v e l y u p d a t e n o d e r e p r e s e n t a t i o n s u H e t e r o g e n e o u s g r a p h s a r e g r a p h s w i t h d i f f e r e n t t y p e s o f n o d e s a n d e d g e s , a n d t h e h e t e r o g e n e i t y o f s u c h g r a p h s c a n b e h a n d l e d b y l e a r n i n g d i f f e r e n t e m b e d d i n g f o r d i f f e r e n t t y p e s o f n o d e s a n d e d g e s u H e t e r o g e n e o u s g r a p h d a t a i s a k i n d o f g r a p h d a t a i n w h i c h n o d e s a n d e d g e s h a v e d i f f e r e n t t y p e s a n d m e a n i n g s H e t e r o g e n e o u s g r a p h d a t a i s c o m m o n i n m a n y r e a lw o r l d a p p i c a t i o n s , s u c h a s r e c o m m e n d e r s y s t e m s , s o c i a l n e t w o r k s , a n d k n o w l e d g e g r a p h s B a c k g r o u n d R e s e a r c h l T h e t r a n s p o r t s e c t o r a c c o u n t s f o r a p p r o x i m a t e l y
1stGivenNameSurname line1(ofAffiliation):deptnameof organization line2:nameoforganization line3:City,Country line4:e-mail:name@xyz.com
2ndGivenNameSurname line1(ofAffiliation):dept.nameof organization line2:nameoforganization line3:City,Country line4:e-mail:name@xyzcom
AbstractElectricvehiclesaregainingpopularityasan environmentallyfriendlyalternativetogasoline-powered vehicles.Predictionsofpropensitytopurchaseelectricvehicles canprovidevaluableinsightsfortheautomotiveindustry, policymakers,andenergysuppliers.Atpresent,thereisno comprehensivequantitativeresearchontheinfluencingfactors ofelectricvehiclepurchaseintention,andthereisalsoalackof explainablecorrelationbetweenelectricvehiclepurchase intentionandtheseinfluencingfactors.Inthispaper,we proposeaheterogeneousgraphneuralnetworkmodelfor electricvehiclespurchasepropensityprediction.Thismodel usesaheterogeneousgraphstructuretoprocessvarioustypes ofdataincludingcharginginfrastructure,environmental factors,brandrecognition,etc,andencodesbyanalyzingthe characteristicsofdifferentnodestoachievedifferentgroup embeddingandobtainthefinalnodeembedding.Theproposed modeloutperformsseveralstructuresonreal-worlddatasets, demonstratingitseffectivenessinelectricvehiclespurchase propensityprediction.
Keywordselectricvehicles,GraphNeuralNetwork, HeterogeneousGNN,purchasepropensity
GreenhousegasesaregasesintheEarth'satmospherethat trapheatfromthesunandcausetheplanettoheatup,which isknownasthegreenhouseeffectMajorgreenhousegases includecarbondioxide(CO2),methane(CH4),nitrousoxide (N2O)andothersCarbondioxideaccountsformorethan three-quartersofglobalgreenhousegasemissions,followed bymethane,nitrousoxideandfluorinatedgasesGreenhouse gasemissionsaretheemissionsofthesegasesintothe atmosphere,mainlyfromhumanactivitiessuchasburning fossilfuels,deforestationandagricultureSincetheIndustrial Revolution,globalCO2emissionsfromfossilfuel combustionandindustrialprocesseshaveincreasedfrom approximately1billionmetrictonsperyeartoover36 billionmetrictonsperyear[1]Theseemissionscontribute toclimatechange,witharangeofnegativeimpactsonthe environmentandhumansocietyTheglobalaverage temperatureisalready1.0°Cabovepre-industriallevels,and theParisAgreementaimstolimitthisincreaseto1.5°Cor 2.0°C.Toaddressgreenhousegasemissionsandclimate change,manycountrieshavesetemissionreductiontargets andcommittedtoshiftingtocleanerenergysourcesand moresustainablepracticesinsectorssuchastransport, agricultureandindustry.Thetransportsectoraccountsfor approximately24%ofglobalenergy-relatedCO2emissions, makingitoneofthelargestcontributorstoclimatechange.
Electricvehicleshavebeenaroundsincethe1800s,but theirpopularitydeclinedintheearly1900sduetotheadvent
3rdGivenNameSurname line1(ofAffiliation):dept.nameof organization line2:nameoforganization line3:City,Country line4:e-mail:name@xyzcom
oftheinternalcombustionengineTheadvantagesofelectric vehiclesincludelowemissionsandhighefficiency,but limitedrange,highcostandtheneedforcharging infrastructureTypesofelectricvehiclesincludebattery electricvehicles(BEV),hybridelectricvehicles(HEV)and fuelcellvehicles(FCV)[2]Atthetime,BEVshadatypical rangeof50-100milespercharge,whileHEVshadarangeof 200-300milespertankoffuelAtthetime,lead-acid batterieswerethemostcommonlyusedbatterytypefor electricvehicles,butnewerbatterytechnologiessuchas nickel-metalhydrideandlithium-ionhademerged
Today,electricvehicles(EVs)aregainingpopularity, andtheavailabilityofcharginginfrastructureisakeyfactor forEVadoptionEVchargersincludeLevel1,Level2,and DCfastchargers,whichvaryinchargingtimeandpower outputThedifferentplayersinvolvedinprovidingEV charginginfrastructureincludeutilities,chargingnetwork operators,automakers,andgovernmentagencies,with strategiesandbusinessmodelsrangingfrompublic-private partnershipstosubscription-basedchargingservices Interoperabilityandstandardizationintheelectricvehicle chargingindustryisimportantbecausedifferentcharging standardscancreatechallengesforEVdrivers[3]Policies andregulationsfortheEVchargingindustryinclude incentivesforcharginginfrastructuredeployment,zoning regulations,andutilityratestructures,andpolicyframeworks canplayakeyroleinacceleratingthedeploymentofEV charginginfrastructure.TheEVchargingindustryneeds morehigh-powerchargerstosupportlonger-rangeEVs,the potentialforvehicle-to-gridservices,andtheemergenceof newplayerssuchasenergystoragecompaniesandridesharingplatforms.
ConsumermotivationsandattitudestowardsEV adoptionvaryindifferentregionsoftheworld,and consumerattitudestowardEVsareinfluencedbyarangeof factors,includingvehicleperformance,cost,charging infrastructure,andenvironmentalconcerns.Forexample,the mainmotivationsforIndianconsumerstoadoptEVsinclude environmentalconcerns,economicbenefits,convenience, andsocialimpact[4].Environmentalconcernsarethemost importantfactordrivingtheadoptionofelectricvehiclesin India,whileeconomicbenefitsandconveniencearealso importantdriversConsumerattitudestowardsEVsare generallypositive,butthereisstillalackofawarenessand understandingofthetechnology
InChina,althoughconsumersinlargecitiesgenerally haveapositiveattitudetowardsEVs,theyarelesssatisfied withthecharginginfrastructure[5]Moreinvestmentin charginginfrastructureisneededtomeetChina'sgrowing
demandforelectricvehiclesTheimportanceofconvenience andaccessibilityofEVcharginginfrastructureisthat consumersvaluetheavailabilityofconvenientlylocated chargingstationsandtheabilitytoeasilyobtaincharging servicesPolicymakersandindustrystakeholdersneedto focusonimprovingtheconvenienceandaccessibilityof charginginfrastructurewhilestrengtheninginteroperability andstandardizationinChina'sEVchargingindustry Policymakersandindustrystakeholdersneedtostandardize EVcharginginfrastructuretoimproveuserexperienceand accelerateEVadoptionInaddition,thetransparencyand fairnessofelectricvehiclechargingservicepricingalsoneed tobefurtherimproved,andconsumersareworriedabout chargingcostsandthepossibilityofpricediscrimination Policymakersandindustrystakeholdersshoulddevelop transparentandfairpricingpoliciestoincreaseconsumer trustandconfidenceintheEVchargingindustry
Inrecentyears,machinelearninganddeeplearning techniqueshavebeenwidelyusedtopredictEVpurchase propensityHowever,mostexistingmethodsfocusonusing asingletypeofdata,suchasuserdemographicsorvehicle characteristicsDespitethefactthatseveralstudieshave examinedthedeterminantsofelectricvehiclesales,suchas charginginfrastructure,environmentalconsiderations,and economicbenefits,thesedeterminantshavenotbeen comprehensivelyandquantitativelyinvestigated,andthereis alackofcorrelationbetweentheintentiontopurchaseanEV andthesedeterminants.Thispaperpresentsamodelfor examiningtherelationshipbetweendeterminants,aswellas introducingadditionalfactorssuchasbrandrecognition, educationandawareness,andlocalpolicies.TopredictEV purchasepropensityaccurately,aheterogeneousgraphneural networkstructuremodelisproposed,whichanalyzesthe characteristicsofdifferentnodes,encodesthem,and implementsdifferentgroupembeddingtoobtainthefinal nodeembedding.
Therestofthepaperisorganizedasfollows:thesecond sectiongivestherelatedworkofHeterogeneousGraph NeuralNetwork;thethirdsectionintroducesthe heterogeneousgraphneuralnetworkstructuremodel proposedinthispaperforthepredictionofelectricvehicle purchasepropensity;thefourthsectionistheexperimental resultsandanalysis;Thelastistheconclusion
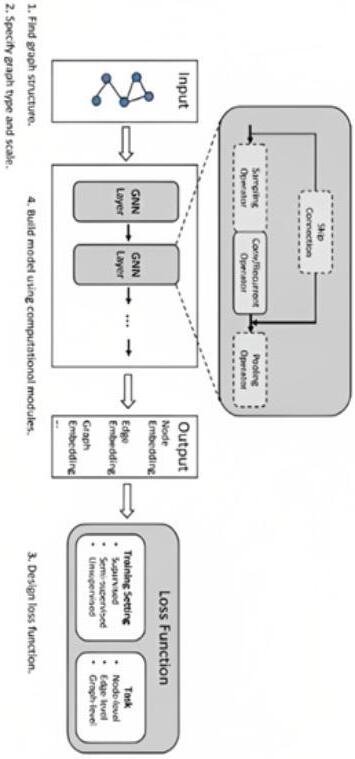
Theideaofusingneuralnetworksforgraph-structured datadatesbacktotheearly2000s,whenneuralnetworkbasedgraphmatchingalgorithmswereintroducedHowever, itwasnotuntil2014thatScarsellietalproposedthefirst GraphConvolutionalNetwork(GCN),whichusesthe Laplacianmatrixofthegraphtodefinetheconvolution operation[6].Overthenextfewyears,manyvariantsof GCNswereproposedGraphConvolutionalNetworks(GCN) usethegraphLaplaciantodefineconvolutionoperationson graphs,whichallowthenetworktolearnrepresentationsfor nodeswhiletakingintoaccounttheirneighborhoods.Graph AttentionNetwork(GAT)usesanattentionmechanismto computeaweightedsumofanode'sneighbors,allowingthe networktolearndifferentweightsforeachneighbor.A typicalGNNmodelisshowninFig.1,whichincludes convolution,loop,samplingandskipconnections,and pooling.Thesearchitectureshavebeenusedinvarious
applicationsincludingnodeclassification,linkprediction, graphclassification,andrecommendersystems
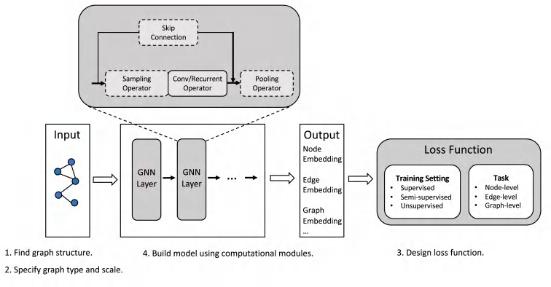
Fig1ThegeneraldesignpipelineforaGNNmodel
Generallyspeaking,inamessagepassingframework eachnodereceivesmessagesfromitsneighbors,processes thosemessages,andthensendsnewmessagestoits neighbors.Inthepaper[7]amessage-passingframeworkis proposedthatiterativelyupdatesnoderepresentationsby aggregatingandtransforminginformationfromneighboring nodesinthegraph.InthecontextofGNNs,amessage passingframeworkisusedtoiterativelyupdatenode representationsIneachiteration,nodesinthegraph exchangemessagesaccordingtosomepredefinedrules. Messagesareusuallycomputedbasedonthecharacteristics ofthesendingandreceivingnodesandthecharacteristicsof theedgesconnectingthem.Afterreceivingmessagesfrom itsneighbors,eachnodeupdatesitsownrepresentationby aggregatingthereceivedmessagesandapplyinga transformationfunctionTheprocessofmessagepassingand representationupdatingisrepeatedforafixednumberof iterationsoruntilconvergenceTheGNNconsiststhe parameter�and��thatcloseinthelearningdataset,which shownintheEq.1inthegraph-centrictasksas:
where�isthelearningfunction,��isthenumberof��The messagingframeworkprovidesaflexibleandextensibleway toprocessgraph-structureddatabycapturinglocal interactionsbetweennodesinthegraphExperimentalresults onvariousdatasetsdemonstratetheeffectivenessofthe GNNapproachcomparedtootherstate-of-the-artmethods
BHeterogeneousGNN
Heterogeneousgraphsaregraphswithdifferenttypesof nodesandedges,andtheheterogeneityofsuchgraphscanbe handledbylearningdifferentembeddingfordifferenttypes ofnodesandedges.AHeterogeneousGraphNeuralNetwork (HAN)consistsoftwolayers[8]:anode-levellayeranda type-levellayer.Thenode-levellayerusesacombinationof self-attentionmechanismandconvolutionalneuralnetwork tolearnnodeembeddingTheself-attentionmechanismand theoutputoftheCNNarethenconcatenatedtoformthefinal nodeembeddingThetype-levellayeraggregatesnode embeddingobtainedfromthenode-levellayertoobtain embeddingforeachtypeofnodeandedgeTheembedding obtainedfromthetypelayerarefedintotheclassification layerforpredictionAmulti-tasklearningframeworkisused tojointlytraintheHANmodelonmultipletasks,including nodeclassificationandlinkpredictionAcombinationof cross-entropylossandbinarycross-entropylossisusedto trainthemodel
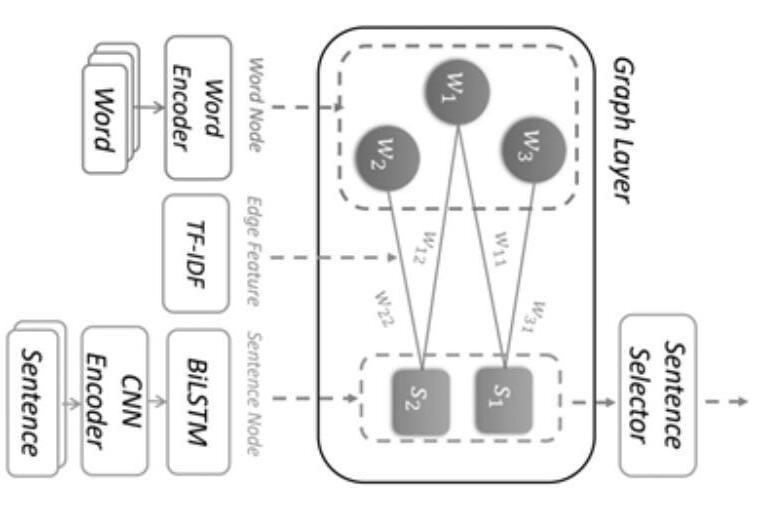
Thetaskofextractingdocumentsummariescanbe accomplishedusingaHeterogeneousGraphNeuralNetwork (HGNN)[9]Byrepresentingdocumentsasheterogeneous graphs,wherenodesrepresentdifferenttypesofentities, suchaswords,sentences,andnamedentities,andedges representrelationshipsbetweenthem,HGNNmodelsare trainedtolearntheimportanceofeachnodeinthegraphfor summarizationtasks,Bothlocalandglobalinformationof thegraphareconsidered,asshowninFig2This heterogeneousgraphconstructionapproachincludesa hierarchicalattentionmechanismthatallowsthemodelto focusondifferentlevelsofabstraction,andanewloss functionthatencouragesthemodeltoselectmore informativesentencesTheproposedmethodoutperforms othermethodsontwostandardbenchmarkdatasetsfor summarization,demonstratingtheeffectivenessofthe proposedHGNNmodel

differenttypesofintermediariescontributetotheplatform's success,asmeasuredbymetricssuchassalesanduser engagementBothindividualusersandstorescanplay importantintermediaryroles,butthemostsuccessful intermediariesarethosewithhightrustandsocialcapital withintheplatformcommunityTherefore,itcanbe consideredthatGNNhasamoreobviousroleinanalyzing complexsocialnetworksinonlineplatforms
Inanotherexample,themainroleofheterogeneousgraph neuralnetwork(HGNN)istoimprovetheperformanceof machinelearningmodelsonheterogeneousrelationaldata [12]Heterogeneousrelationaldataarenetworkswithnodes andedgesofmultipletypesorproperties,whicharecommon inmanyreal-worldapplications,suchassocialnetworksand knowledgegraphsHGNNisdesignedtohandlesuchdataby modelingtherelationshipbetweendifferenttypesofentities inthegraph,sothatthemodelcanbettercapturethe complexinterdependencebetweenentitiesUsingHGNNs canimprovetheaccuracyoftaskssuchasmulti-label classification,multi-tasklearning,andlinkpredictionfor heterogeneousrelationaldata
ByusingHeterogeneousGraphNeuralNetworks (HGNN)inrecommendersystems,biasamplificationin recommendersystemscanbemitigated[13]GNNscan propagatethebiaspresentintheinitialuser-iteminteraction graphtothelearnedembeddingofusersanditems ComparedwithsimilarGNNs,heterogeneousgraphneural networkscaneffectivelyreducebiasamplificationbyusing multipleedgetypestocapturedifferenttypesofrelationships betweenusersanditems.TheresultsshowthatHGNNcan improvetheaccuracyandfairnessofrecommendersystems bybettermodelingthepotentialrelationshipbetweenusers anditems.ThemainroleofHGNNistosolvetheproblem ofbiasamplificationinrecommendersystems,whichisan importantprobleminensuringtheaccuracyandfairnessof thesesystems.

Heterogeneousgraphdataisakindofgraphdatain whichnodesandedgeshavedifferenttypesandmeanings Heterogeneousgraphdataiscommoninmanyreal-world applications,suchasrecommendersystems,socialnetworks, andknowledgegraphs[10]TheHGTarchitectureisbased ontheTransformerarchitectureandhasachievedstate-ofthe-artresultsinnaturallanguageprocessingtasks.HGT consistsofmultipleattentionlayers,eachprocessing informationofdifferentnodetypesinparallel.Theattention mechanismallowsthemodeltolearntheimportanceof differentnodetypesandtherelationshipsamongthem.The authorsevaluateHGTonseveralheterogeneousgraph datasets,includingalarge-scaleknowledgegraphdataset. TheyfoundthatHGToutperformsstate-of-the-artmethods onavarietyoftasks,includingnodeclassification,link prediction,andentityalignment.HGTisapromising approachtomodelingheterogeneousgraphdata,whichhas thepotentialtoadvancethefieldofgraphrepresentation learning
Thepaper[11]buildsaHeterogeneousInformation Network(HIN)torepresentvariousentitiesinanonline platform,suchasusers,products,andstores,andthe relationshipsamongthemGNNsareusedtoanalyzeHINs andidentifykeyintermediariesintheplatform,ieusersand storesthataremostimportantinconnectingdifferentpartsof thenetworkGNNshavealsobeenusedtoanalyzehow
Althoughsomestudieshaveanalyzedtheinfluencing factorsofelectricvehiclesales,includingcharging infrastructure,environment,economicbenefits,etc.,these influencingfactorshavenotbeencomprehensivelyand quantitativelystudied,andthereisalsoalackofcorrelation betweentheintentionofelectricvehiclepurchaseandthese factors.Amodelforanalyzingtherelationshipbetween factors.Inadditiontotheaboveinfluencingfactors,this paperintroducesfactorssuchasbrandrecognition,education andawareness,andlocalpolicies,andaccordinglyproposes aheterogeneousgraphneuralnetworkstructuremodelfor electricvehiclepurchasepropensitypredictionByanalyzing thecharacteristicsofdifferentnodesEncodeandimplement differentgroupembeddingtogetthefinalnodeembedding tofurtherimprovetheaccuracyofpurchaseintention prediction
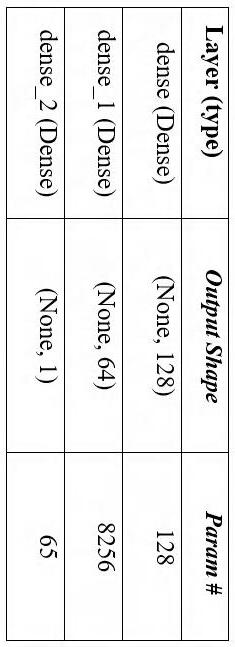
Fig2Themodelsforextractivedocumentsummarization Fig3TheproposedheterogeneousGNNmodelTheproposedHGNNmodelconsistsof:(1) heterogeneousgraphstructure,(2)graphconvolutional network(GCN)layer,and(3)multi-layerperceptron(MLP) layer,whichisshowninFig3Theheterogeneousgraph structureisusedtorepresentvarioustypesofdata,including charginginfrastructure,environmentalfactors,brand recognition,educationandawareness,andlocalpolicies Eachtypeofdataisrepresentedasanodeinthegraph,and theedgesbetweennodescapturetherelationshipbetween differenttypesofdataGCNlayersareusedtolearn representationsfornodesinthegraphAtthesametime, modifyingthelastlayerofthemodelcanimprovethe adaptabilityofthemodeltodifferenttasks,sotheregression layerisusedtorealizeEVpurchasetrendpredictionAs showninTab1,theregressionlayerconsistsofasingle outputnode,whichproducesacontinuousvalueasthe predictedoutputandbescaledortransformedasrequired
thedatasetintotrainingandtestingsetsusinga70:30ratio Thedatasetwasseparatedby70%fortraining,15%for validationand15%fortestingWethenusedthetrainingset totraintheHGNNmodelandotherstate-of-the-artmodels, includinglogisticregression,SVM,andGNN-basedmodels
TheHGNNmodelusedinthisstudyisacombinationof graphconvolutionalnetworksandfeedforwardneural networksTheGCNlayerwasusedtoextractthefeatures fromthegraphstructure,andtheFNNwasusedtomakethe finalpredictionWealsouseddropoutregularizationto preventoverfittingTheevaluatedtheperformanceofthe proposedHGNNmodelandotherstate-of-the-artmodels usingaccuracyandF1-scoreTheresultsarepresentedin Tab1
TheGCNlayeraggregatesthefeaturesofneighboring nodesandlearnsahiddenrepresentationforeachnode.The learnedrepresentationsarethenpassedtotheMLPlayerfor prediction.Inthisheterogeneousgraphnetworkstructure,the GCNlayerisresponsibleforaggregatinginformationfrom adjacentnodesinthegraph,andmultiplepoolinglayersare addedtoprocessinformationofdifferenttypesandregions Forexample,charginginfrastructuremainlyincludes geographiclocationtypeinformation,andbrandrecognition andeducationalbackgroundmainlyincludetexttype information.Differentpoolinglayersarerequiredtoprocess thesedifferenttypesofinformation,andcorrespondingloop layersandattentionmechanismsareusedtocapturethe potentialdependenciesinthedata
WeevaluatetheproposedHGNNmodelonarealdataset collectedfromtheonlinecarwebsiteanddataprovidedby somecarsellersThedatasetusedinourstudyiscollected fromtheonlinecarforumanddataprovidedbysomecar sellersThedatasetcontainsseveralfeaturessuchascharging infrastructure,environment,economicbenefits,brand recognition,educationandawareness,andlocalpoliciesThe datasetconsistsof10,000sampleswith8featuresanda binarylabelindicatingwhetherthepersonislikelyto purchaseanEVornot
ToevaluatetheperformanceoftheHGNNmodel,we adoptedthefollowingexperimentalprocess:Data preprocessing:Cleaningandnormalizationofthedataset Datasplitting:Splittingthedatasetintotraining,validation, andtestsetsModeltraining:TrainingtheHGNNmodelon thetrainingsetHyperparametertuning:Tuningthehyper parametersoftheHGNNmodelonthevalidationsetModel evaluation:EvaluatingtheperformanceoftheHGNNmodel onthetestsetandcomparingitwithotherexistingmodels Wefirstpreprocessedthedatasetbyscalingthefeaturesto ensurethatallfeatureshaveasimilarrangeWethensplit
Ascanbeseenfromthetable,ourproposedHGNN modeloutperformsallothermodels,achievinganaccuracy of85%andanF1-scoreof0.84.TheHGNNmodelalso achievesthehighestprecisionof0.86,indicatingthatitis betteratidentifyingtruepositivescomparedtotheother modelsTheexperimentalresultsshowthattheproposed HGNNmodeloutperformsallthebaselinemodelsinterms ofpredictionaccuracyandrobustness.
Inthispaper,weproposeaheterogeneousgraphneural networkmodelforEVpurchasepropensityprediction,which combinesmultipledatasources,includingcharging infrastructure,environment,economicbenefits,brand recognition,educationandawareness,andlocalpoliciesWe evaluatetheproposedmodelonareal-worlddatasetand showthatitoutperformsothermodelsintermsofpredictive accuracyandrobustnessTheproposedmodelhaspractical implicationsformanufacturersandpolicymakerstodevelop effectivemarketingstrategiesandincentivestoencourage EVadoptionFutureworkincludesexploringthe effectivenessofotherdatasourcesandimprovingmodel interpretability
[1]RitchieH,RoserM,RosadoPCO₂andgreenhousegasemissions[J] Ourworldindata,2020
[2]ChanCCAnoverviewofelectricvehicletechnology[J] ProceedingsoftheIEEE,1993,81(9):1202-1213
[3]LaMonacaS,RyanLThestateofplayinelectricvehiclecharging services–Areviewofinfrastructureprovision,players,andpolicies[J] Renewableandsustainableenergyreviews,2022,154:111733
[4]SahooD,HarichandanS,KarSK,etalAnempiricalstudyon consumermotivesandattitudetowardsadoptionofelectricvehicles inIndia:Policyimplicationsforstakeholders[J]EnergyPolicy,2022, 165:112941
[5]ChenY,LinBAreconsumersinChina’smajorcitieshappywith charginginfrastructureforelectricvehicles?[J]AppliedEnergy,2022, 327:120082
[6]ZhouJ,CuiG,HuS,etalGraphneuralnetworks:Areviewof methodsandapplications[J]AIopen,2020,1:57-81
[7]ScarselliF,GoriM,TsoiAC,etalThegraphneuralnetwork model[J]IEEEtransactionsonneuralnetworks,2008,20(1):61-80
[8]ZhangC,SongD,HuangC,etalHeterogeneousgraphneural network[C]Proceedingsofthe25thACMSIGKDDinternational conferenceonknowledgediscovery&datamining2019:793-803
[9]WangD,LiuP,ZhengY,etalHeterogeneousgraphneuralnetworks forextractivedocumentsummarization[J]arXivpreprint arXiv:200412393,2020
[10]HuZ,DongY,WangK,etalHeterogeneousgraphtransformer[C] Proceedingsofthewebconference20202020:2704-2710
[11]ChenZ,CaoH,XuF,etalUnderstandingtheroleofintermediaries inonlinesociale-commerce:anexploratorystudyofbeidian[J] ProceedingsoftheACMonHuman-ComputerInteraction,2020, 4(CSCW2):1-24.
[12]MohammadiZBetterUtilizationofRelationalDatainMachine Learning[J]2021
[13]ChizariN,ShoeibiN,Moreno-GarcíaMNAComparativeAnalysis ofBiasAmplificationinGraphNeuralNetworkApproachesfor RecommenderSystems[J]Electronics,2022,11(20):3301

CINDYHUANG2023-06-27PUBLISHEDINBEIJING
Welcometotheexhibition!HaveyouheardofBeijing-HangZhou GrandCanal,Oneofthemostfamouscanalintheworld?


TheGrandCanalexhibitiontakesthelaststeepkilometerof Beijing-HangzhouCanalasthemainline,introducingtheepicof scientistGuoShoujingfromtheYuanDynastyoffindingwaterfor thecanal,settingup24locksalongtheway,andrealizingtheboat steeringagainstthecurrent.TonghuiRivertransportedallthefood andresourcesfromTongzhouandbeyondtotheYuancapital. Beijingistherebynamed“thefloatingcity”.
CanthememoryoftheGrandCanalberememberedagain?This questionhasledtofurtherthinkingandreflectiononthe transformationofthecanaleconomyinthenewera.


1.Whydidtheydigcanalsinancienttimes?Can'tweusenatural rivers?
Historiansgenerallybelievethatthe earliestcanalduginChinawasthe HangouCanaldugbyKingFuchai ofWuin486B.C.toconquerQiin thenorthHangouCanalwasthe
earliestcanalinChina,connectingYangzhouonthebankofYangtze RiverandHuai'anonthebankofHuaiheRiver,bridgingtheYangtze andHuaiheRiversystems,andwastheearliestsectionofthe Beijing-HangzhouGrandCanaltobedug.Thefunctionsofthe GrandCanalincludetransportingsoldiers,grain,saltandsoon.
ThedestinationofthehistoricGrandCanalwasthenationalcapital, whichmeansthefloatingdirectionofcanalwasdeterminedbythe locationoftheancientcapital.
2.WhatwasthesituationofwatertransportationinBeijing beforetheGrandCanalwasopened?

Inthedamriver,themodeof "backwardtransportingbydam" wasadopted.Afterthecanal boatsmarchedtotheeasternmost firstdam(Shengoudam),the

kongmencarriedthegraintotheemptyboatswaitinginthewest, andcontinuedtotheseconddaminthewest(upstream),and transporteditbydamtothedockofGuangxiGateinDadu.The methodoftransportationisveryinefficientandincredibly labor-intensive.
Inthe30thyearoftheYuanDynasty(1293),thescientistGuo ShoujingbuilttheTonghuiheRiver,andtheDamRiveraddedsome ofthewaterfromBaifuWengshanMountain,sothatitcould continuetoplayitsroleasawaterway

Beijinghaslongbeensufferingfromwatershortage,andtheremust besufficientwaterinthecanaltokeeptheboatsmovingproperly LeadingtenspringswhichconfluenceWongshanbo.Tothe28th yearoftheYuan(1291),GuoShoujingafternearly30yearsof investigationofwaterresourcesinBeijing,proposedthediversion
ofwhitefloatingspringstofeedthecanal,theconstructionofthe lastsectionoftheBeijing-HangzhouGrandCanalTongzhou-Dudu canal.

Seconddifficultyisovercomingthedifferenceinterrainheight. Beijingishigherinthenorthwestandlowerinthesoutheast,which meansthetopographyoftheYuancapitalishigher,andthe topographyofTongzhoucityislower,withadropofmorethan30 metersbetweenthetwoplacesInordertosailfromTongzhouto thecapitalcity,theboathadtoclimbonthewaterGuoShoujing wasthefirsttoproposetheconceptof"elevation"intheworld, morethan560yearsbeforetheGermanmathematicianGauss.
[Sailingagainstthecurrent]24lockswerebuiltalongthewayto controlthewaterlevelinsectionstoachieverowingagainstthe current.Currently,theThreeGorgesDam,PanamaCanal,andother artificialcanalsallusethisprinciple.
41South-NorthWaterTransferProject
4.ExplorationontheTransformationofCanalEconomy

 4.2GrandCanalandXihaiziPark
4.3GrandCanalForestPark
4.2GrandCanalandXihaiziPark
4.3GrandCanalForestPark
Well,pleasedon'tbeonlysurprisedbyitsmagnificence,it'smore importanttofeelwhatisbehindandbeyondthisgrandbeauty.
"Behind"
whatliesunderneathisthelegendhistoryofGrandCanalanditspower topromotetheeconomy.Pleasevisitmywebsitebelowandexplore whatyouarenotfamiliarwiththisGrandCanal.
Mywebsite:https://xinruhuang.wixsite.com


“Beyond”
Asthephysicprinciplegoes,"forcewillnotdisappear,butonlytransfer fromoneobjecttotheanother".Canaleconomyfunctionsasthesame way:Althoughtransportingfuntiondisappearsduetotheemergence ofshipandtrain,tourismandculturalindustriesareneworgans supportedbythevesselofriver.Asorganskeeprefreshingthebody, theseindustriescontinuetorevivetheeconomy.


Our strategy is to fulfill three key client considerations that we have identified, related to Nichole’s scholarship ambition, her intergenerational wealth ambition, and her personal interests and passions. In order to do this, we have used a filter-based approach, which systematically eliminates stocks from consideration to create Nichole’s final portfolio. The three filters we use are: industry analysis, a qualitative framework unique to each industry, and a quantitative scoring approach.
Our strategy’s filter-based approach sets us apart,as it allows us to consistently analyze a very wide range of stockswhileensuring that the stocks we finally invest in are analyzed in extensivedetail. Whilst most teams probably focus onone of these two aspects, ourfilter approach allows us to ensure that we are hitting both detail and a wide range, andso ensuring that we get the best ideas and confirm they work for Nichole.
Nichole’s inspiring ambitions require three important considerations:
Key consideration 1: A large portion of her portfolio requires a one to ten-year time horizon, with the aim of attaining sufficient funds for a $5000/year scholarship. As such, lower risk investment providing a steady return should be considered for this aspect of the portfolio.
Key consideration 2: The remainder of her portfolio should have a decades-long time horizon, as it aims to provide for the education of Nichole’s nieces and nephews, as well as her legacy of intergenerational wealth. For this, Nichole requires investments with unconstrained potential for providing huge returns, and therefore less emphasis on risk.
Key consideration 3: Nichole has clear interests and passions, and her investments should reflect that. Whilst her investments need to achieve healthy returns and adequate risk management and diversification, Nichole would also benefit if those returns were generated by capital that benefits her interests, such as by improving access to opportunities for women of color
Our unique strategy to achieve Nichole’s aims
Our strategy uses a series of three filters in order to identify the best stocks for achieving each of the key considerations that we have identified for Nichole.
Filter 1: Industry and sector analysis – Firstly, we choose which industries should move forward for stock-specific analysis by considering whether key trends in economics and politics lend themselves towards good performance for those industries, either in the medium or long-term.
Filter 2: Qualitative Framework – The next step in our framework is to analyze the
remaining stocks using qualitative analysis to consider factors that will affect risk, expected return and client fit. We assess each company using the following framework in this sense:
While all of the factors above can potentially be factored into the analysis, certain characteristics are more important for each industry. The next section will detail the specific factors we considered the most in our stock selection on an industry-by-industry basis. Filter 3: Quantitative Scoring – As a result, we are left with several stocks from which to pick around 15 for investment. This is done using the following Expected Return and Risk formulae:
We consider each stock’s return and risk score holistically, alongside our qualitative analysis and portfolio fit considerations in order to make our final investment decisions.
In this section, we outline the analysis framework we used for each industry and the weight places on each factor and describe the key aspects of these to our stock selection.
Industry 1: Consumer Discretionary
Market Trends (35%): The high degree of competition in the Consumer Discretionary (CD) industry means that market trends are a big growth driver As such, we consider which stocks are positively exposed to key market trends (such as cost-cutting in the retail sector), and also consider which are best placed to adapt their business to these trends
Product Quality (35%): Product quality is the key method of differentiation in the CD industry When pursuing a ‘blue ocean’ strategy is not possible, products need to be able to compete in a fierce marketplace Product quality can be assessed qualitatively by considering user reviews and innovative aspects, and quantitatively by looking at metrics such as gross margin.
Marketing (30%): In addition to product quality, differentiation also requires adequate communication with potential consumers about the benefits and features of product offerings. As such, we looked at the marketing campaigns of each in order to ascertain each company’s success in reaching many potential customers with target advertisements. The rise of social media and personalization is extremely vital in this respect.
Industry 2: Financials
Solvency (20%): Financial services are particularly exposed to macro risks and the possibility of insolvency if there is a large decline in their asset values. As such, we consider solvency ratios to be particularly important in this industry.
Market Position (30%): Scale is often vital in financial services, and as such securing sufficient market share is vital for success. Therefore, we investigate several ratios and indexes to ensure that they are in the leading position in the market or at least they are developing in a positive direction. For example, in the insurance industry, the net income of MetLife Inc in the three quarters of 2021 grew year on year by 124.12%, while most of its competitors experienced a contraction in net income by -35.35%
Product Quality (40%): As companies in this sector mainly engaged in financial products and insurance services, their product quality and customer satisfaction are one of the most important factors to be considered. Employee satisfaction and liquidity also affect a company’s overall service quality.
ESG (10%): According to our client’s social media (namely, Instagram and Twitter), she has a strong sense of social responsibility. ESG score can evaluate a company's social morality directly Financial services are under increased pressure to invest with ESG principles, and these principles also have a huge impact of the social fabric of society themselves.
Industry3:Health Care Technology(50%): The patents of biochemical products are essential for acompany’s development since it takes up much of the profit. The speed ofinventing new productscan also guarantee the stable status of acompany in a fiercelycompetitive marketspace. We chose companies with creativity and advanced technologywhich fits the demand of customersin the market.
Regulation(30%): The return of a health care company is strongly influenced bythe policies oftheFood and Drug Administration
(FDA)since the quality of products is required
to reach certain high standards. Exposure to regulator decisions and their likely outcome is thus a key consideration to factor into analysis.
Management (20%): Management plays a huge role in determining the ability of Health Care companies to foster innovation whilst maintaining tight control of costs. We researched the structure inside each company from official websites to see whether it has efficient management.
Brand (40%): CS companies are highly reliant on brand recognition and reputational strength Boycotts can seriously harm revenues when reputational issues are raised, as seen recently with the controversy around Kellogg’s union disputes. We considered both brand recognition metrics and qualitative reputational issues in order to assess this factor.
Cost-efficiency (30%): Since revenues tend to be stable in CS companies, it is vital for them to maintain a healthy profit margin through tight control of costs. As such, we considered time series analyses of company costs and qualitative consideration of key cost drivers to evaluate the likely future direction of profit margins.
Product (30%): The products’ quality in this sector are of great importance, and consumers are mostly loyal. We searched on the official websites of these companies to see the diversified degree of products and the comments of some customers, and we also focused on the source of materials and the production process.
Commodity Prices (50%): Basic Materials’ company’s revenues are driven mostly by volatile global commodity prices, and as such an assessment of the level and direction of
these prices is vital. For each company, we identified the key commodities prices that they were exposed to and assessed the likely direction of these.
Costs (25%): Since basic materials are typically not differentiated, generating profit requires a better cost structure relative to competitors. As such, we considered time series analyses of company costs and qualitative consideration of key cost drivers.
Volume (25%): Apart from pricing, the other driver of revenues is volume. Basic materials are constrained by numerous external factors when trying to achieve scale, and so we analyzed such issues carefully for each of the stocks we examined.
Industry 6: Industrials
Product Quality (45%): The key consideration driving pricing points for most industrial companies are the quality of their products relative to their competitors We looked at R&D spend and effectiveness in order to consider the future direction of product quality for companies within this industry.
After-sale Service (30%): Consumer durables products require continued interaction between the customer and company after initial sale. When there are product issues, a key aspect of overall quality is the company’s ability to efficiently provide services such as repair or upgrades in order to maintain both relevance and customer loyalty.
Company Reputation (25%): Kahneman’s consumer psychology research shows that, when people make decisions on purchases of ‘big ticket’ items, such as those produced by the Industrials industry, they tend to consider far more carefully between alternative options. As such, strong reputational integrity is required to ensure the attainment of customer confidence.
Innovation (50%): In the increasingly fierce competition of modern technology, innovation is vital to keep up with the pace of change and win over increasingly demanding consumers. We investigated the product offering and pipeline of each company as well as the techniques that each company utilized for their work effectiveness. We also utilized R&D statistics to consider future growth.
Risk (30%): In addition to the quantitative risk scores we calculated for every company, the technology industry required special consideration for more qualitative, discretionary risks. For example, data privacy, cybersecurity and disruptive innovations all pose existential threats for many technology companies.
Market Position (20%): Especially important for established companies, market position determines a technology company’s ability to reap the huge profit margins that often characterize the industry
Political Issues (50%): We considered how the macro political environment and related laws can affect the industry and determined its risk. Since utilities tend to be heavily regulated, the main revenue risk emanates from the possibility of changes to regulatory controls.
Cost Efficiency (30%): Given the stability of revenues, driving profit requires cost efficiency in the utilities industry. As such, we considered time series analyses of company costs and qualitative consideration of key cost drivers.
Management (20%): We considered whether the internal tasks and staff were allocated adequately to ensure maximum efficiency.
A challenge we experienced together through the project was working together online. We held online meetings for at least two hours every week in order to make team decisions efficiently. We expressed our views in the group meetings, discussed strategy, and constantly improved our analysis and reports.
In the beginning, we divided our tasks based on the sectors that we were in charge of. After the mid-term, we specialized in particular tasks according to our skills and interests, such as data collection, quantitative analysis, qualitative analysis, and data visualization. In both our midterm and final reports, all the decisions were made collaboratively by all our team members.
This competition has allowed all of us to make huge strides in the development of an investment mindset. Before undertaking the curriculum offered by Wharton, we had little understanding of investment management practice. Having completed our Final Report, our team can reflect not only on our much-expanded understating of the investment analysis process, but also more broadly: we have greatly broadened our horizons in world business and economics.


We develop four-term investment strategy: long-term and medium-term use value investment; short-term and ultra-short-term use growth investment. Under each investment term, we conduct macroeconomic, industry, and company analysis. We believe this method would minimize risk and enable the cash to be continuously invested in industries and companies which fit in Peter’s interest and future development trend.
Unlike conducting macro analysis first, industry second, and company third, we perform research on these three levels of analysis under the framework of four-term investment strategy. We believe this method better ensures that one investment term is not influenced by the other and demonstrates his interest.
Takeaways: Invincible Bang is the team with innovative business idea and the ability to develop them into a comprehensive analysis and strategy. The most exciting part is that everyone comes up with their own thoughts emphasizing on different prospect. Conflict is inevitable, and it is great that we finally come to a thorough conclusion after doing trade-off. However, most of the time when we conduct analysis is initially hard, because of lack of extensive business knowledge and research. This meaningful competition enables everyone to acquire knowledge while applying them to writing report. And we are planning to apply the things we have learnt in the experience to future study and research.

The diagram below shows our team decision making process.
Based on this process, we select 3 trading notes to analyze.
1. Buying 15 stocks of China Petroleum & Chemical Corporation. We think this company is in the sector which is the focus of current society Energy
2. Selling 15 stocks of China Petroleum & Chemical Corporation. Although this company is in the important sector, the fall of the stock price is over 8%, which does not fit in our trading rule in the tracking system
3. Buying 20 stocks of AMD. Firstly, this company generates steady return, which fits in our long-term investment principle. Furthermore, this company is in the information technology sector, which makes contribution to the progress of society.
To create a thorough portfolio for our client Peter, we first conduct client analysis.
Then, based on Peter’s financial goal, we develop 4-term investment strategy (longterm, midterm, short-term, and ultra-short-term); Centered around his interests, we develop unique stock selection system. These will be further illustrated in the following paragraphs.

l Client Analysis
Based on the Peter’s background case, we write our analysis in the table below.
l Long-term investment
Firstly, we perform research on industry selection because we think choosing an industry that fits in Peter’s interest and social developing trend and further deciding the country to invest in is more important in long-term investment.
We choose health industry to be the primary industries to invest in based on our value investment decisioning. Peter focuses on health care, and technology is always the primary productive force for innovation. In the pandemic, health care system now has a promising future in account of its rapid technology development, which would ensure a continuous and stable development of value growth for at least twenty to thirty years.

In this section, we analyze different macroeconomic environment and summarize thee information in the table below.
Johnson & Johnson:
It is the world's largest diversified healthcare and consumer care products company. Furthermore, the relationship between company and customers ensures its sustainable development, which fits with our prospect of value investment. Our team believe that
*Table 2: Macroeconomic Analysis on America and UKJohnson and Johnson have formed a comprehensive network in its production; Therefore, we’ve decided to purchase in a great share of the companies’ stocks.
Smith & Nephew:
An international manufacturer of advanced wound management products, arthroscopic products, trauma and clinical treatment products and orthopedic reconstructive products. The whole network of key supplement productions helps the company to soon recover from losses in pandemic. We will invest in the company for long-term holding in account of the company’s dominant role in global medical production and its sustained growth.
GlaxoSmithKline
In contrast to the previous two companies, GlaxoSmithKline PLC focuses more on medical treatments combining with technological advancement to cure people, which corresponds with our value in stock selection. We would like to invest in the company for its innovative medicine and we hold optimistic view on the future of the company
While long-term investment focuses on value investment, for midterm investment, we concentrate more on current macroeconomy, which facilitates us to conduct stock selection. We perform research on PESTLE analysis of America and list the different aspects in the table below.

First, we do not consider industries with cyclical growth, such as the real estate industry, where fluctuation trends are cyclical and vulnerable to policies that are not conducive to medium-term stable and sustainable growth. Apart from this, we want medium-term investments with high returns, so we choose S&P 500 as both an index and criteria, which reflects broader market changes, and consider sectors with annualized returns higher than the S&P 500. Meanwhile, we prioritize sectors with a large industry

weighting. Based on the U.S. macro background research, we have selected the following sectors for our medium-term investments: InformationTechnology, Health Care, and Consumer Staple.

Company Selection
Next, we develop SWOT scoring system to merge quantitative data with SWOT analysis. The firm’s expression is rated in three degrees: "1” for absolute, “0.5” for comparative, and “0” for none. We multiply each score by the weight they belong to.The formula we use is: ∑[(S*weight)+(O*weight)]/∑[(W*weight)+(T*weight)]

we adopt criteria of various standardized ratios and data in the economical part, including the P/E ratio, ROE, market capitalization, concentration rate(based on the l Short term Investment


Inconclusion,thisfour-term investmentstrategy helpsto satisfied Peter ’s Financial goaland demonstrates his interest.


