

CHRIS MURPHY
Master of Landscape Architecture (MLA)
One Arroyo - Part 1
MLA Capstone Project [ongoing]
Return of La Cienega
MLA Spring 2024
Salt Marsh Synergy
MLA Fall 2023 Part 2
Walnut Overcrossing
01
one arroyo - part 1
Professors: Weimin Li & Jade Hunter
Fall Semester, 2024 | Cal Poly Pomona Pasadena, CA
The One Arroyo Project is a part of the year-long MLA Masters Capstone studio and is conducted by four students (all work presented is from my contributions). The team partners with the City of Pasadena Parks, Recreation, and Community Services Department to address key challenges facing the Arroyo Seco at the channel, community, and watershed scale.
Once a naturally flowing tributary to the Los Angeles River, the Arroyo Seco was dammed in 1920 and channelized in 1934, degrading the Arroyo Seco’s riverscape alongside an urbanizing watershed. The engineering solutions of the past pose an opportunity for channel and ecological restoration while unifying the community and region for public use.
To address the current challenges facing the river, the team developed a framework that outliness layered goals for channel restoration, ecological diversification, park programming, and regional connectivity and access to achieve a unified Arroyo. This semester focused on research, data analysis, and modeling to inform the design phase occurring during the Spring semester, 2025. My contributions focused on hydrology, hydraulics, geomorphology, and flood modeling. To be continued….


Context
The Arroyo Seco is naturally flowing throughout the mountainous terrain of the upper watershed before it reaches the Devil’s Gate Dam. As it makes its way to the alluvial/urban lowlands of the coastal plain, it discharges into a concrete channel before merging with the Los Angeles River.
Figure 1.1: Arroyo Seco Watershed and stream order
Figure 1.2: channel observations
upper-watershed

upper/mid-watershed

mid-watershed

lower-watershed


Challenges
The Arroyo Seco is characterized by flash floods and high sediment yield. Debris flows from higher elevations and flooding poses a risk to the surrounding communities.
Figure 1.3: watershed hydrology models
Figure 1.4: watershed geology map


Existing Groundwater
Extensive groundwater pumping combined with a lack of rainfall and infiltration from the river has led to declining groundwater levels over the past 100 years.
Figure 1.5: groundwater movement

Groundwater Suitability
To inform design solutions, a groundwater suitability model was developed by combining groundwater depth, infiltration rate, and landcover data.
Figure 1.6: groundwater vulnerability
Flood Modelling
Three reaches of the Arroyo Seco were selected for flood modeling. Different storm and baseline scenarios were applied to the model to understand flood risk of the current channel.


Figure 1.7: HEC-RAS flood models
60’ trapezoidal

Relative Elevation Model
50’ trapezoidal
100’ trapezoidal
100’ trapezoidal
1.8: velocity and channel type analysis
The lowest points of the channel were identified to measure a relative elevation from that point. This model identifies flat areas surrounding the channel to delineate the rivers natural flood plain.


Figure
Figure 1.9: flood plain delineation - relative elevation model
Geomorphology
Changes in impervious surfaces prior to channelization were measured to understand channel responses to urbanization.


Understanding the natural channel evolution of the Arroyo Seco can serve as a tool for restoration.
Figure 1.10: channel evolution in relation to urbanization

02 return of la cienega
Professors: Melissa Guerrero & Meagan Yellott
Spring Semester, 2024 | Cal Poly Pomona Los Angeles, CA
The ‘Return of La Cienega’ is a schoolyard greening project for Baldwin Hills Elementary School in Culver City rooted in stormwater management. The name is inspired by the historic watershed conditions before European settlement and the mass urbanization that followed. What is now Culver City was once a freshwater wetland mosaic formed by relic hydrological conditions. It was called ‘La Cienega’ by early surveyors, meaning “the swamp”.
At the site scale, the project attempts to mimic these watershed conditions by dividing the site into watershed fractals where water will flow into seasonal vernal pools, ‘wet meadow’ retention basins, bioswales, and cisterns for irrigation. Onsite green infrastructure is accommodated with native planting and provides students with opportunities for ecology and watershed-based outdoor learning and new types of play.
At the community scale, the project creates new access points, walking trails, and rec-center amenities that increase accessibility to green space in the surrounding community.
At the regional scale, the site improves the relationship of Ballona Creek with the Ballona watershed, capturing and releasing stormwater before it makes its way to Ballona Creek and the Pacific Ocean.
Studio outline:
research, outreach, site analysis, concept design, and final design.


Preliminary Research
Before breaking off into individual design and analysis, the studio began with group research and outreach. My contributions included site and regional analysis and mapping of environmental justice issues. The analysis included existing oil drilling activity, traffic impacts, impaired waterbodies, and active cleanup sites surrounding Baldwin Hills Elementary School.

Figure 2.1: oil map
Figure 2.2: water quality map
Figure 2.3: traffic impacts map
Figure 2.4: historic map
Community Outreach
Each group worked together to develop an engagement plan for different Baldwin Hills Elementary classes and grades. Comprehensive engagement helped the teams reach a diverse audience, gaining input across multiple age groups and faculty. The figures to the right are my contribution to the outreach plan.


Figure 2.5: outreach activity
Figure 2.6: outreach results
Figure 2.7: outreach photos
Site Analysis


The site is in a liquefaction zone. Per City code, green infrastructure cannot infiltrate stormwater.
Figure 2.8: high level site analysis poster
Figure 2.9: vegetation, circulation, and hydrology site analysis
Concept Design


Figure 2.11: initial concept process diagramming
Figure 2.10: regional stormwater and open space connections
Schematic Design


2.13: watersheds and hydrology diagram
Figure
Figure 2.12: stormwater concept diagram

1. New entry from Jefferson Blvd.
2. Vernal pools
3. Play mound/ground
4. Themed gardens
5. Yard pools
6. Lawn path/space
7. Oak woodland
8. Stormwater mound
9. Swales/play
10. Play mound
11. Adjacent path connection
12. Outdoor learning
13. Stormwater planters
Section cuts
Stormwater Design
The project fractures the site into multiple watersheds to calculate the Stormwater Quality Design Volume (SWQDV) of each watershed. Stormwater management on site has been designed per City and County LID standards to withstand a 100-year design storm.


Figure 2.15: oak woodlands perspective section
Figure 2.16: oak woodlands bloom diagram
Figure 2.17: vernal pool bloom diagram pipe in gravel 2:1
‘wet meadow’ vernal pool gabion spillway


Figure 2.18: stormwater design at rec center section
Figure 2.19: seasonality of stormwater design
‘wet meadow’
vernal pool pipe in gravel
gabion spillway wetland bench pathway

Seasonality
The seasonality of the vernal pools features native flowers and herbs that die in the winter as the impermeable pools fill with stormwater creating water-dependent ecosystems. In the summer and fall, these herbs and wildflowers bloom.

Figure 2.20: rec center play mound and plaza
Figure 2.21: schoolyard gardens and outdoor learning

vernal pool
3” of soil geomembrane liner
amphitheater impermeable clay layer

Figure 2.22: vernal pool section
Figure 2.23: schoolyard amphitheater and play
Cat-eyed Western Spadefoot Toad Spea hammondii Fairy Shrimp Branchinecta sandiegonensis
03 salt marsh synergy
Professor: Barry Lehrman
Fall Semester, 2023 | Cal Poly Pomona
Long Beach, CA
The Design for Change Studio was broken up into two separate projects during the semester, the second focusing on a design project related to stormwater, flooding, or wetland restoration and sea level rise over 10 weeks.
The Salt Marsh Synergy project is located in the Los Cerritos Wetlands on an approximately 120-acre active oil field site in Long Beach, California. The main goal of the project is to restore the land to its original salt marsh habitat. The project identifies historic wetland data and satellite images to guide channels and landform configurations.
The local tidal datum measures inundation and is used to develop mudflats, low, and mid-high marsh habitat elevations, and slope. Worst-case scenario Sea-level-rise scenarios influence the project’s upland elevations. The result is a restored ecosystem that adapts to sea level rise by migrating its habitats upwards and absorbing the impacts of sea-level rise.


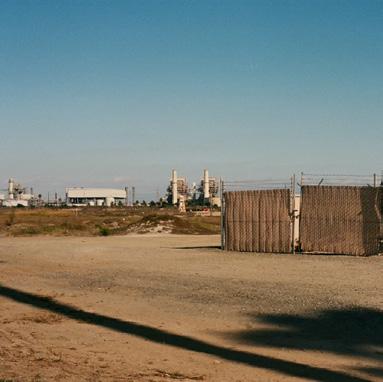


Figure 3.2: site context and existing conditions
Figure 3.3: site photos and sketches
Figure 3.1: Long Beach sea-level-rise map


Common pickleweed
Sarcocornia pacifica (1)


Coastal Sage Scrub Variety of species
Parish’s glasswort Arthrocnemum subterminale (2) (1) (2)


uplands (16’) mid-high marsh (10’)
low marsh (6’)
mean lower low water (0’) mudflats (5’)


3.4: habitat diagram

Figure
Figure 3.5: historic ecosystems of the San Gabriel River
dune (24’)
Pacific cordgrass Spartina foliosa
Sandpiper Scolopacidae Sea lettuce Ulva lactuca
Bivalve Bivalvia
California Halibut Paralichthys californicus
California least tern Sterna antillarum browni

Habitats
Subtidal channels - permanently inundated below the mean lower low water line. Intertidal mudflats - inundated twice daily. The low marsh - inundated on the mean higher high water. The mid-high marsh - inundated on king tides.
Existing ‘ruderal uplands’ - Composed of non-native species with poor soil quality. The project reintroduces coastal sage scrub uplands that existed prior.
Figure 3.6: sea-level-rise and tidal diagram
2100 H++ sea-level-rise scenario + MHHW ~16’
2050 H++ sea-level-rise scenario + MHHW ~8’
(HAT) ~7’
(MLLW) ~0’

Grading
Original topography on site was relatively flat due to past filling to allow oil drilling.

Existing soil will be cut to create new channels while filling in other areas to create new marsh elevations.

Sea Level Rise
original elevation profile
new channels
new elevation profile
Upland habitats are based off the extreme risk aversion sea level rise scenario for 2100 in Los Angeles (9.9’ of sea-level rise) plus the mean higher high water (~6’) to get a combined elevation of ~16’. Upland habitats reach a maximum elevation of 28’, allowing room for marsh habitats to migrate as the sea rises.
Figure 3.7: grading diagram


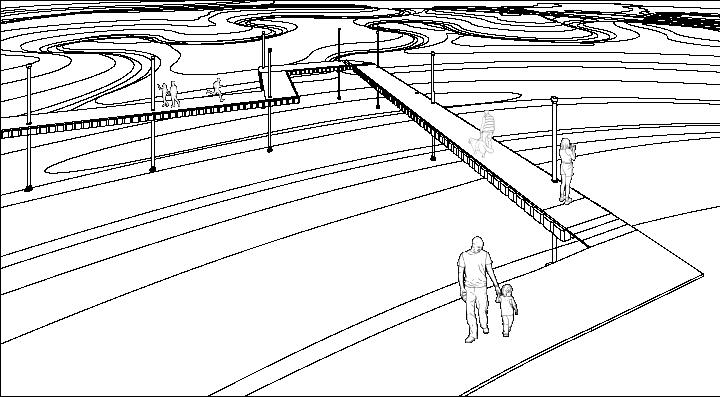

Figure 3.8: pontoon bridge and detail
1. New subtidal channels reintroducing tidal flows
2. New elevations determined by tides and future sea-level-rise scenarios (intertidal and upland marsh habitats)
3. Existing chemical storage tanks repurposed as shade structures
4. Elevated dune habitat for nesting California least tern
5. Retention basin
6. Floodable, tide/sea level rise adaptable steps. -Repurposed pipeline as railing
7. New Sidewalk
8. Swales and planting along perimeter
9. New pathway
10. Entry points
11. Floating pontoon bridge
Section cuts

Figure 3.9: site plan


Figure 3.10: north view section
Figure 3.11: dune habitat, walking pat h, and coastal sage scrub
marsh and tidal elevations


Figure 3.12: west view section
Figure 3.13: floodable step design
marsh and tidal elevations
04 walnut overcrossing
Professor: Adrienne Greve
Undergraduate Project, 2021 | Cal Poly San Luis Obispo
San Luis Obispo, CA
The Walnut Overcrossing addresses past and present problems through active transportation and urban design interventions. The City of San Luis Obispo shares a similar history with many cities across the United States: poorly placed freeways that divide communities.
In February 2020, the City of San Luis Obispo published an active transportation plan that addresses gaps in the City’s bicycle and pedestrian network. While an extensive roadway system connects the City, it lacks the connectivity and infrastructure for cyclists and pedestrians. Approximately 60 percent of San Luis Obispo’s population is uncomfortable biking or walking along major arterial roadways (City of San Luis Obispo 2020).
San Luis Obispo is subject to Highway 101, which runs directly through neighborhoods comprising of large student and lower-income populations. It is adjacent to the City’s downtown, eliminating safe connectivity for cyclists and pedestrians.
The Walnut Overcrossing identifies a grade-separated crossing, unimpacted by the highway, to relink two densely populated neighborhoods in San Luis Obispo that have been scarred by Highway 101.


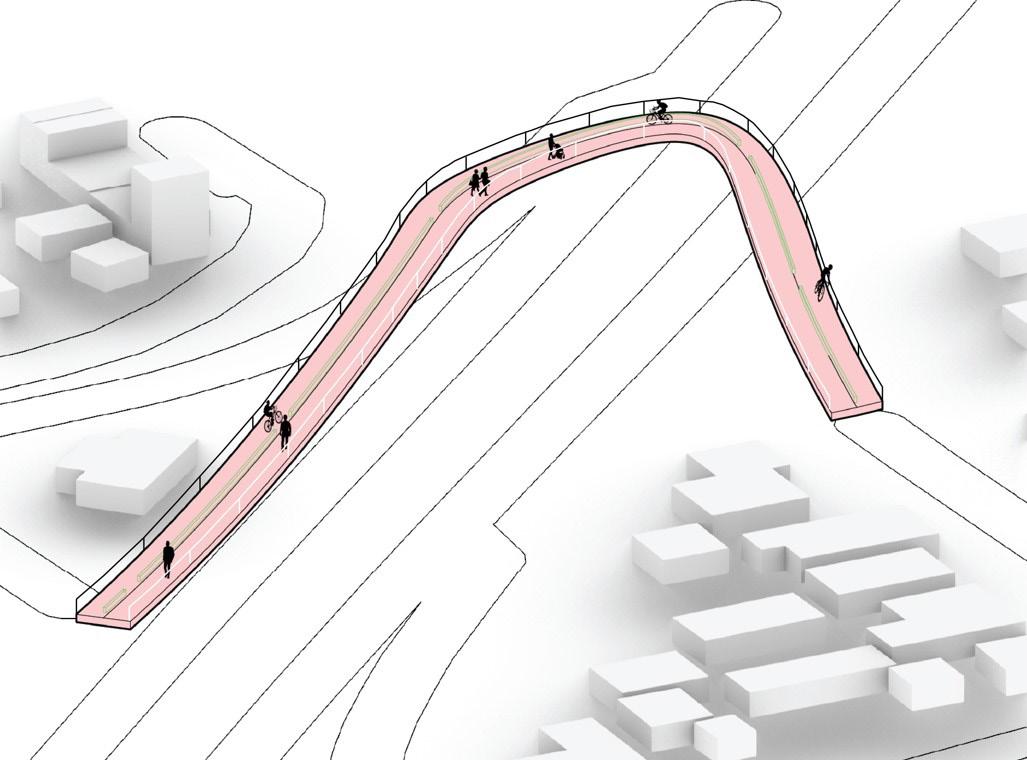


separated multimodal paths
Figure 4.1 concept diagrams
Figure 4.2 design elements
Figure 4.3 north section
benches
planters
seatwalls
planters
stairs/ ramp
shade structure
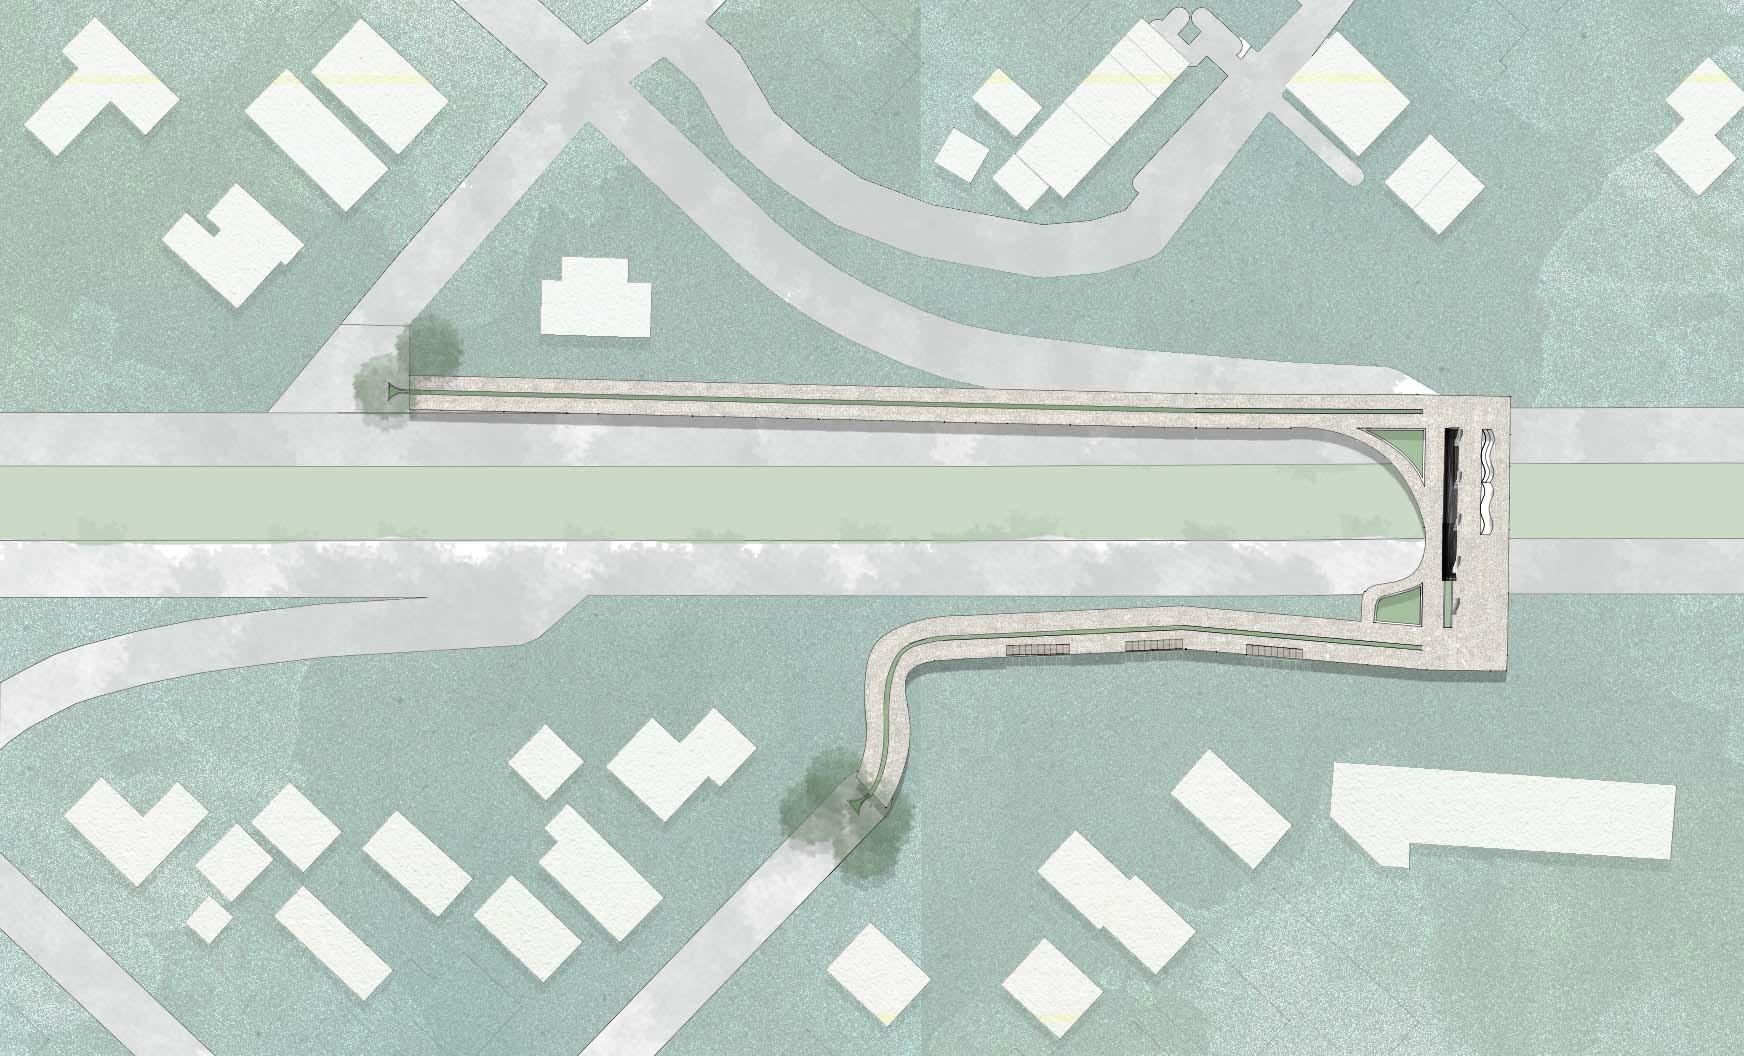


Figure 4.4 site plan
Figure 4.5 site analysis site
Santa Rosa Park streets land use bike network views train existing buildings prevailing wind
lo s a n g eles

05
LA and the freeway folly
Professor: Barry Lehrman Fall Semester, 2023 | Cal Poly Pomona Los Angeles, CA


Part 1 of the Design for Change Studio began with a data visualization project to practice systems thinking and analysis. Each student picked a system to map and tell a story about how this system works and its influence on the built or natural environment.


5.1 inset maps showing redlining, structures and highways by year built
The ‘Los Angeles and the Freeway Folly’ project analyzes past and present highway impacts in Los Angeles County. The project uses racial demographics, vehicle emissions and noise data, and the relationship between redlining and the year freeways and buildings were constructed to visualize the impacts of the Los Angeles County freeway system on communities.

5.2 LA Redlining and Highways by year built

Figure 5.3 traffic impacts greater than 80th percentile and race and ethnicity
Figure
Figure
06 personal work
2021-2025 all over
01 Garden Design
2024-present
Over the summer of 2025 my roommate and I received permission to garden a section of our neighbor’s backyard that had become overgrown with weeds. The planting concept included a mix of vegetables and herbs, native shrubs and flowers, and succulents.
02 Illustrations
2024-2025
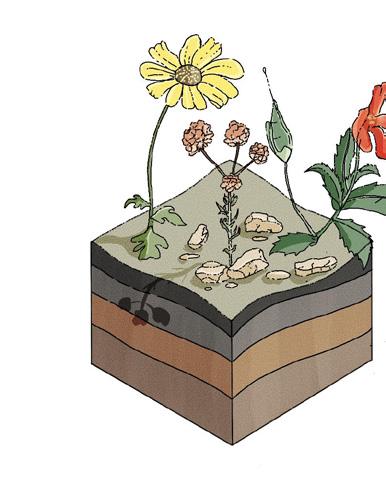
Plant ecology research expressed through digital illustration.
03 Bike Basket
2021
Grocery basket for my bike that features a fitted stand attached to a bike rack that locks onto the basket. I used Rhino 3D to draw the concept and photoshopped and sketched it for fun before building it.
04 Sketches
2022-2024
A series of outdoor and referenced sketches.
Weeding and Terracing


Planting


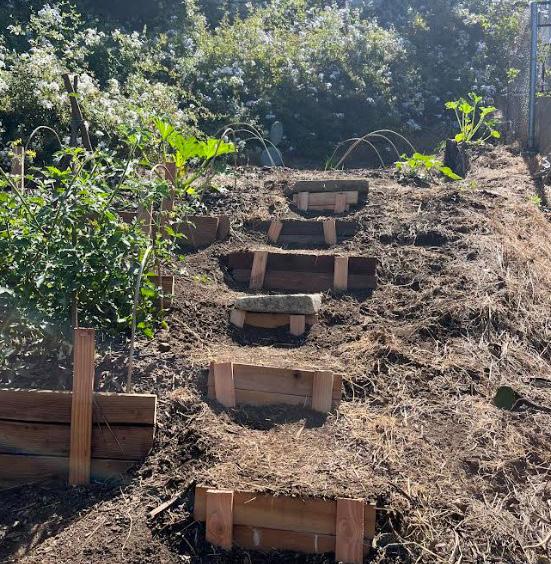


01 Garden Design
The site was sloped and covered in English ivy and periwinkle. Weeding, terracing, and mulching began before planting. All vegetables and herbs were grown from seeds. Encelia Californica was propagated from the local park in early summer and planted months later.
Illustrations


03 Bike Basket
04 Sketches