PLANNING THESIS


UNDERSTANDING THE ROLE OF URBAN FORM ON ACHIEVING BETTER SOCIAL SUSTAINABILITY: A CASE STUDY OF BHUBANESWAR
❑ ECONOMIC SUSTAINABILITY

❑ ENVIRONMENTAL SUSTAINABILITY
SOCIAL SUSTAINABILITY
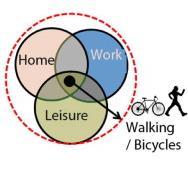
Living spaces
Is achieved through meeting the basic needs of people in basically in both:Work Place

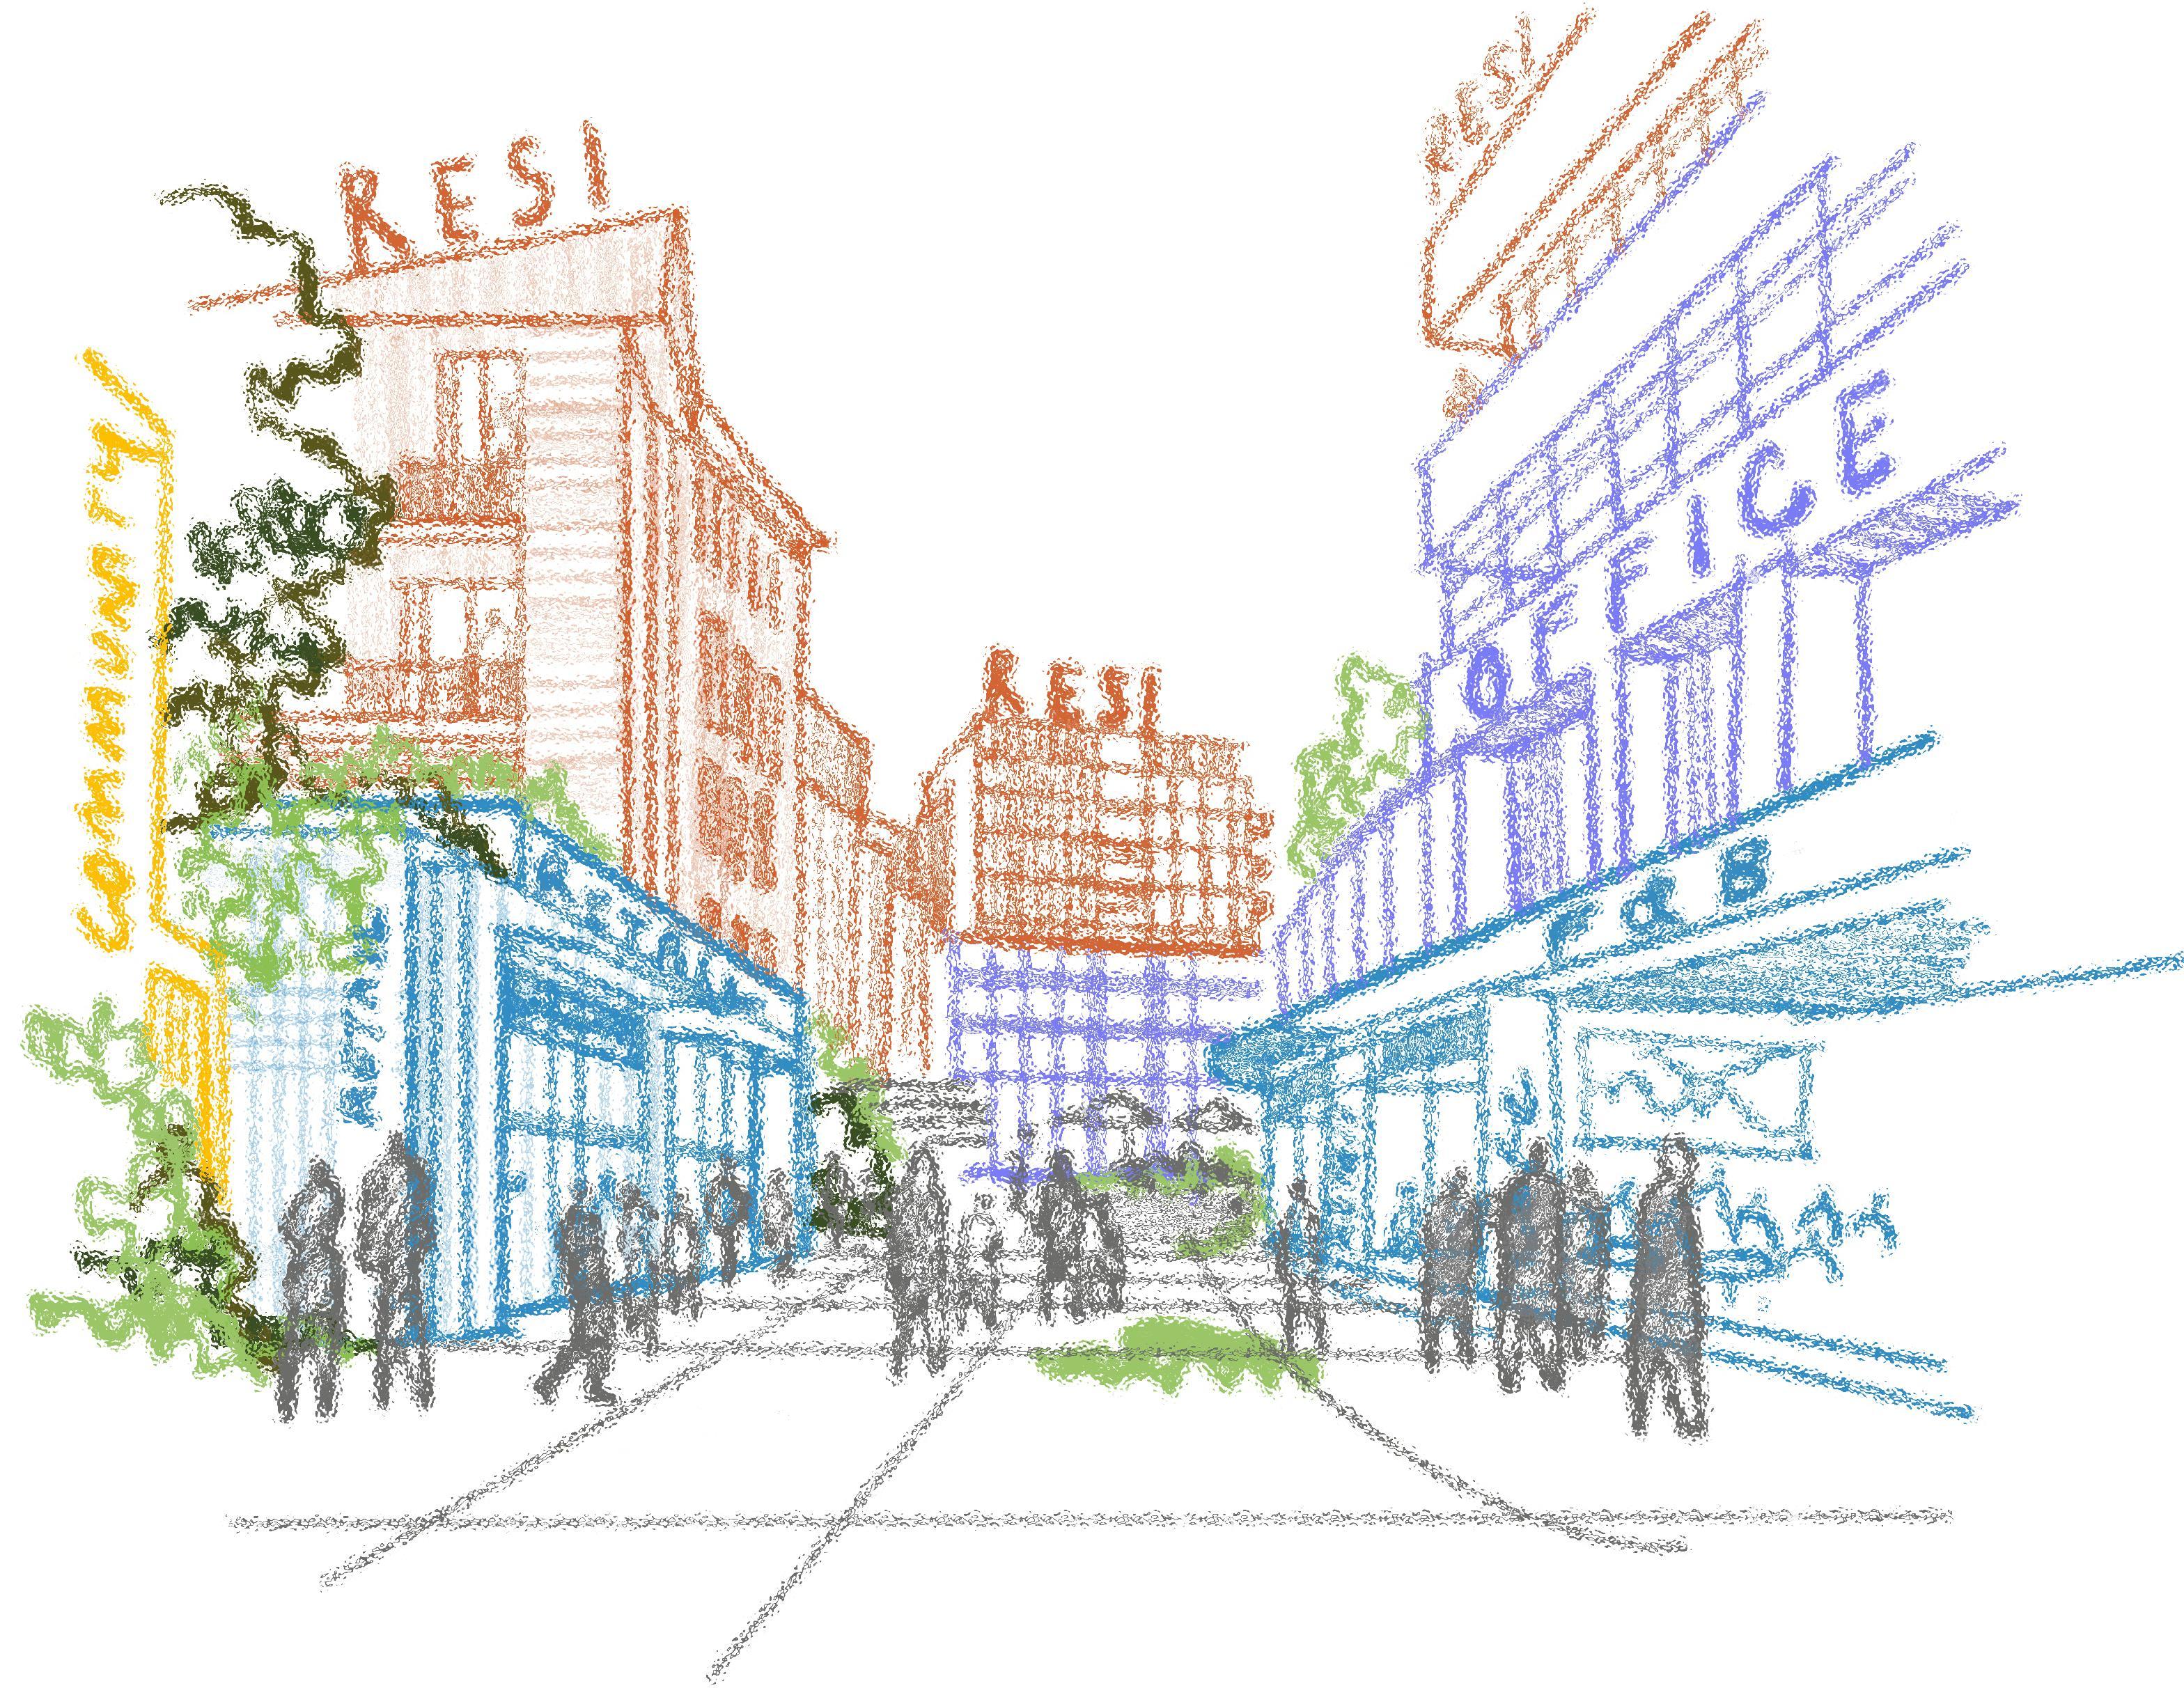
Urban Forms can be described as the physical environment of the city
Forms the canvas on which Human Societies are built.
Population Density and distribution over a spatial area directly influence its social sustainability.
Urbanisation has taken place rapidly in the city and the dynamics of city’s urban form has changed and evolved from time to time.
Type and pattern of urban forms in the cities influence the human communities and has influence on social sustainability of a place
To understand the way urban form has its impact on the two dimensions of Social Sustainability:
▪ Sustainable Communities
▪ Social Equity
Components of Urban Form include Density, Open Spatial Network, Lanudse, Blocks and Built Components
SELECTION OF STUDY AREA
Based on the Population of different cities in Odisha
METHODOLOGY
EVALUATING THE EFFECT OF URBAN FORM ON SOCIAL SUSTAINABILITY
NEED OF THE STUDY
FORMULATION OF AIM
To understand the extend of urban form influence on communities to achieve social sustainability in Bhubaneswar
FORMULATION OF OBJECTIVES
✓ To study the urban form and social dimensions of sustainability and the relationship between both
✓ To analyze the influence of urban form components on the aspects of social sustainability using both quantitative and qualitative methods.
✓ To propose a social sustainability framework at two different levels of planning i.e., policy level and community level.
AIM OF THE STUDY
To understand the extend of urban form influence on communities to achieve social sustainability in Bhubaneswar
OBJECTIVES
▪ To study the urban form and social dimensions of sustainability and the relationship between both
▪ To analyze the influence of urban form components on the aspects of social sustainability using both quantitative and qualitative methods.
▪ To propose a social sustainability framework at two different levels of planning .e., policy level and community level.
Sub Parameters considered for measuring Sustainability In Ease of Living Index Framework
❑ Environment
❑ Green Spaces and Buildings
❑ Energy Consumption


❑ City Resilience
GLANCE AT STUDY AREA
AREA UNDER BMC:186 KM²


ZONES IN BMC: 3 ZONES


NO OF WARDS: 67 Wards
LITERACY RATE : 91 7
FEMALE POPULATION: 3,97,198

MALE POPULATION: 4,46,204
PULATION DENSITY: 4521

SEX RATIO: 841
UNDERSTANDING
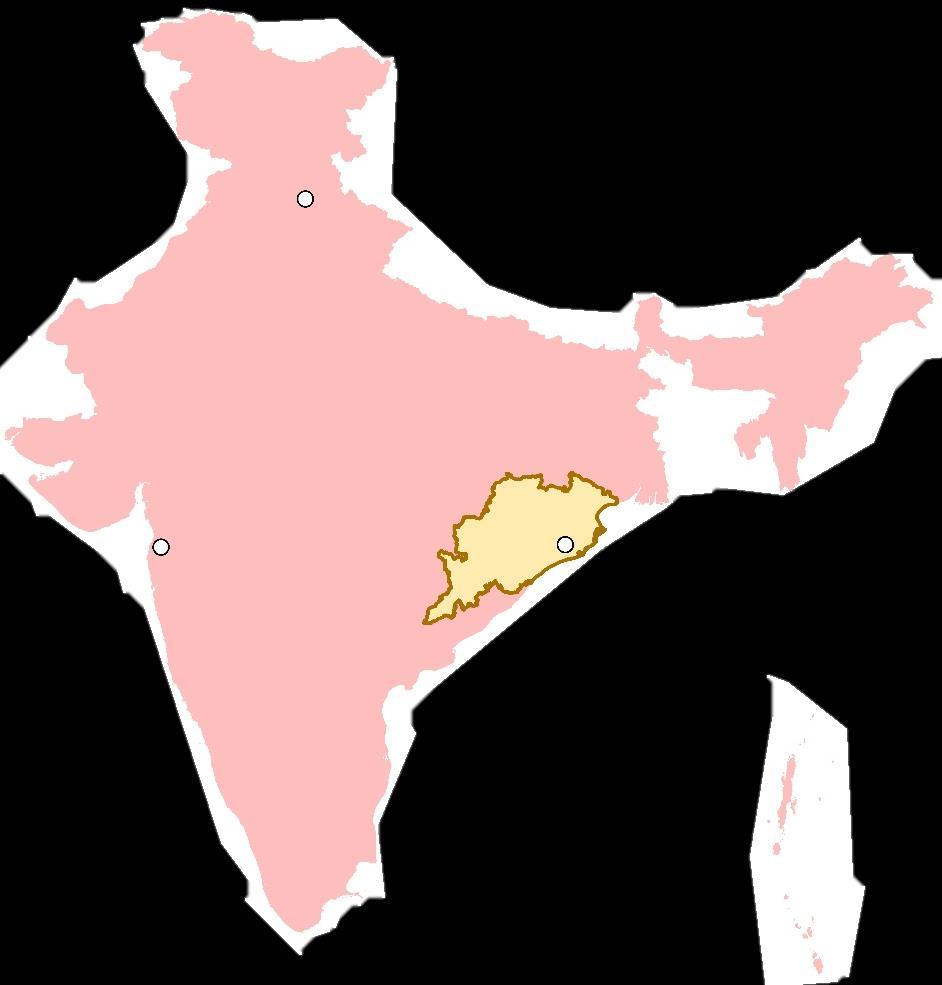
Odisha
UNDERSTANDING THE SCOPE & LIMITATION

LITERATURE STUDY
CONCEPTUAL LITERATURE EMPERICAL LITERATURE
Theories, Concepts, Models Journals, Case Studies
SCOPE OF THE STUDY
▪ It is useful to understand the need and concept of flexible neighbourhood in terms of social inclusivity.
▪ Provides evidence about influence of urban forms on social sustainability at neighbourhood scale
▪ Forms a knowledge base for urban designers, planners and policy makers engaged in design of sustainable cities in India.
LIMITATION OF THE STUDY
▪ Time constraints.
▪ Slum areas are not considered in the Study.
EXPECTED OUTCOMES
▪ Social sustainability framework at policy level, implementation level and community level.
▪ Cities will become a more socially sustainable place to live in.
DATA COLLECTION
PRIMARY DATA COLLECTION SECONDARY DATA COLLECTION
Questionnaire
Field Observation Research Paper Govt. Records


DATA ANALYSIS
RECOMMENDATION & PROPOSALS
Bhubaneswar
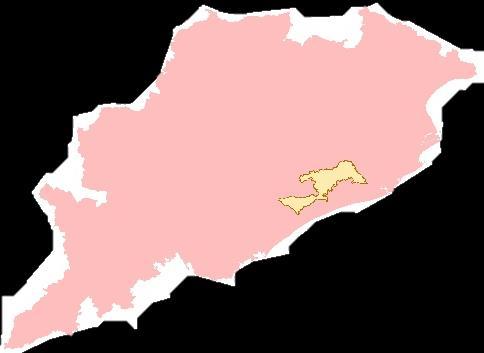
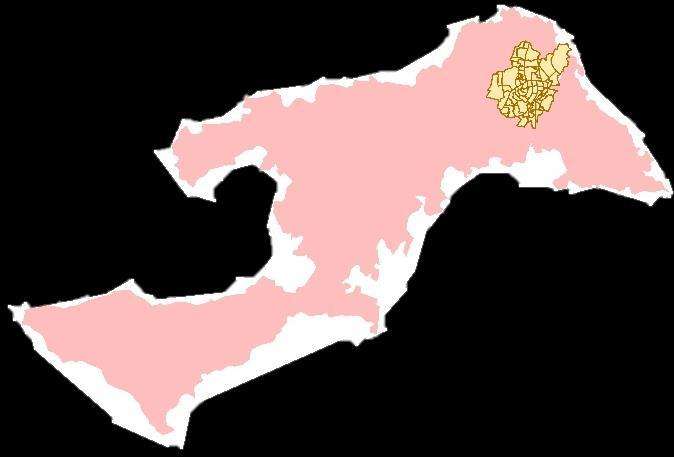
Map 1.1: India Map Map 1.2: Odisha Map
Map 1.3: Khordha Map
CONTEXTUAL
❑
BACKGROUND
NEED OF STUDY
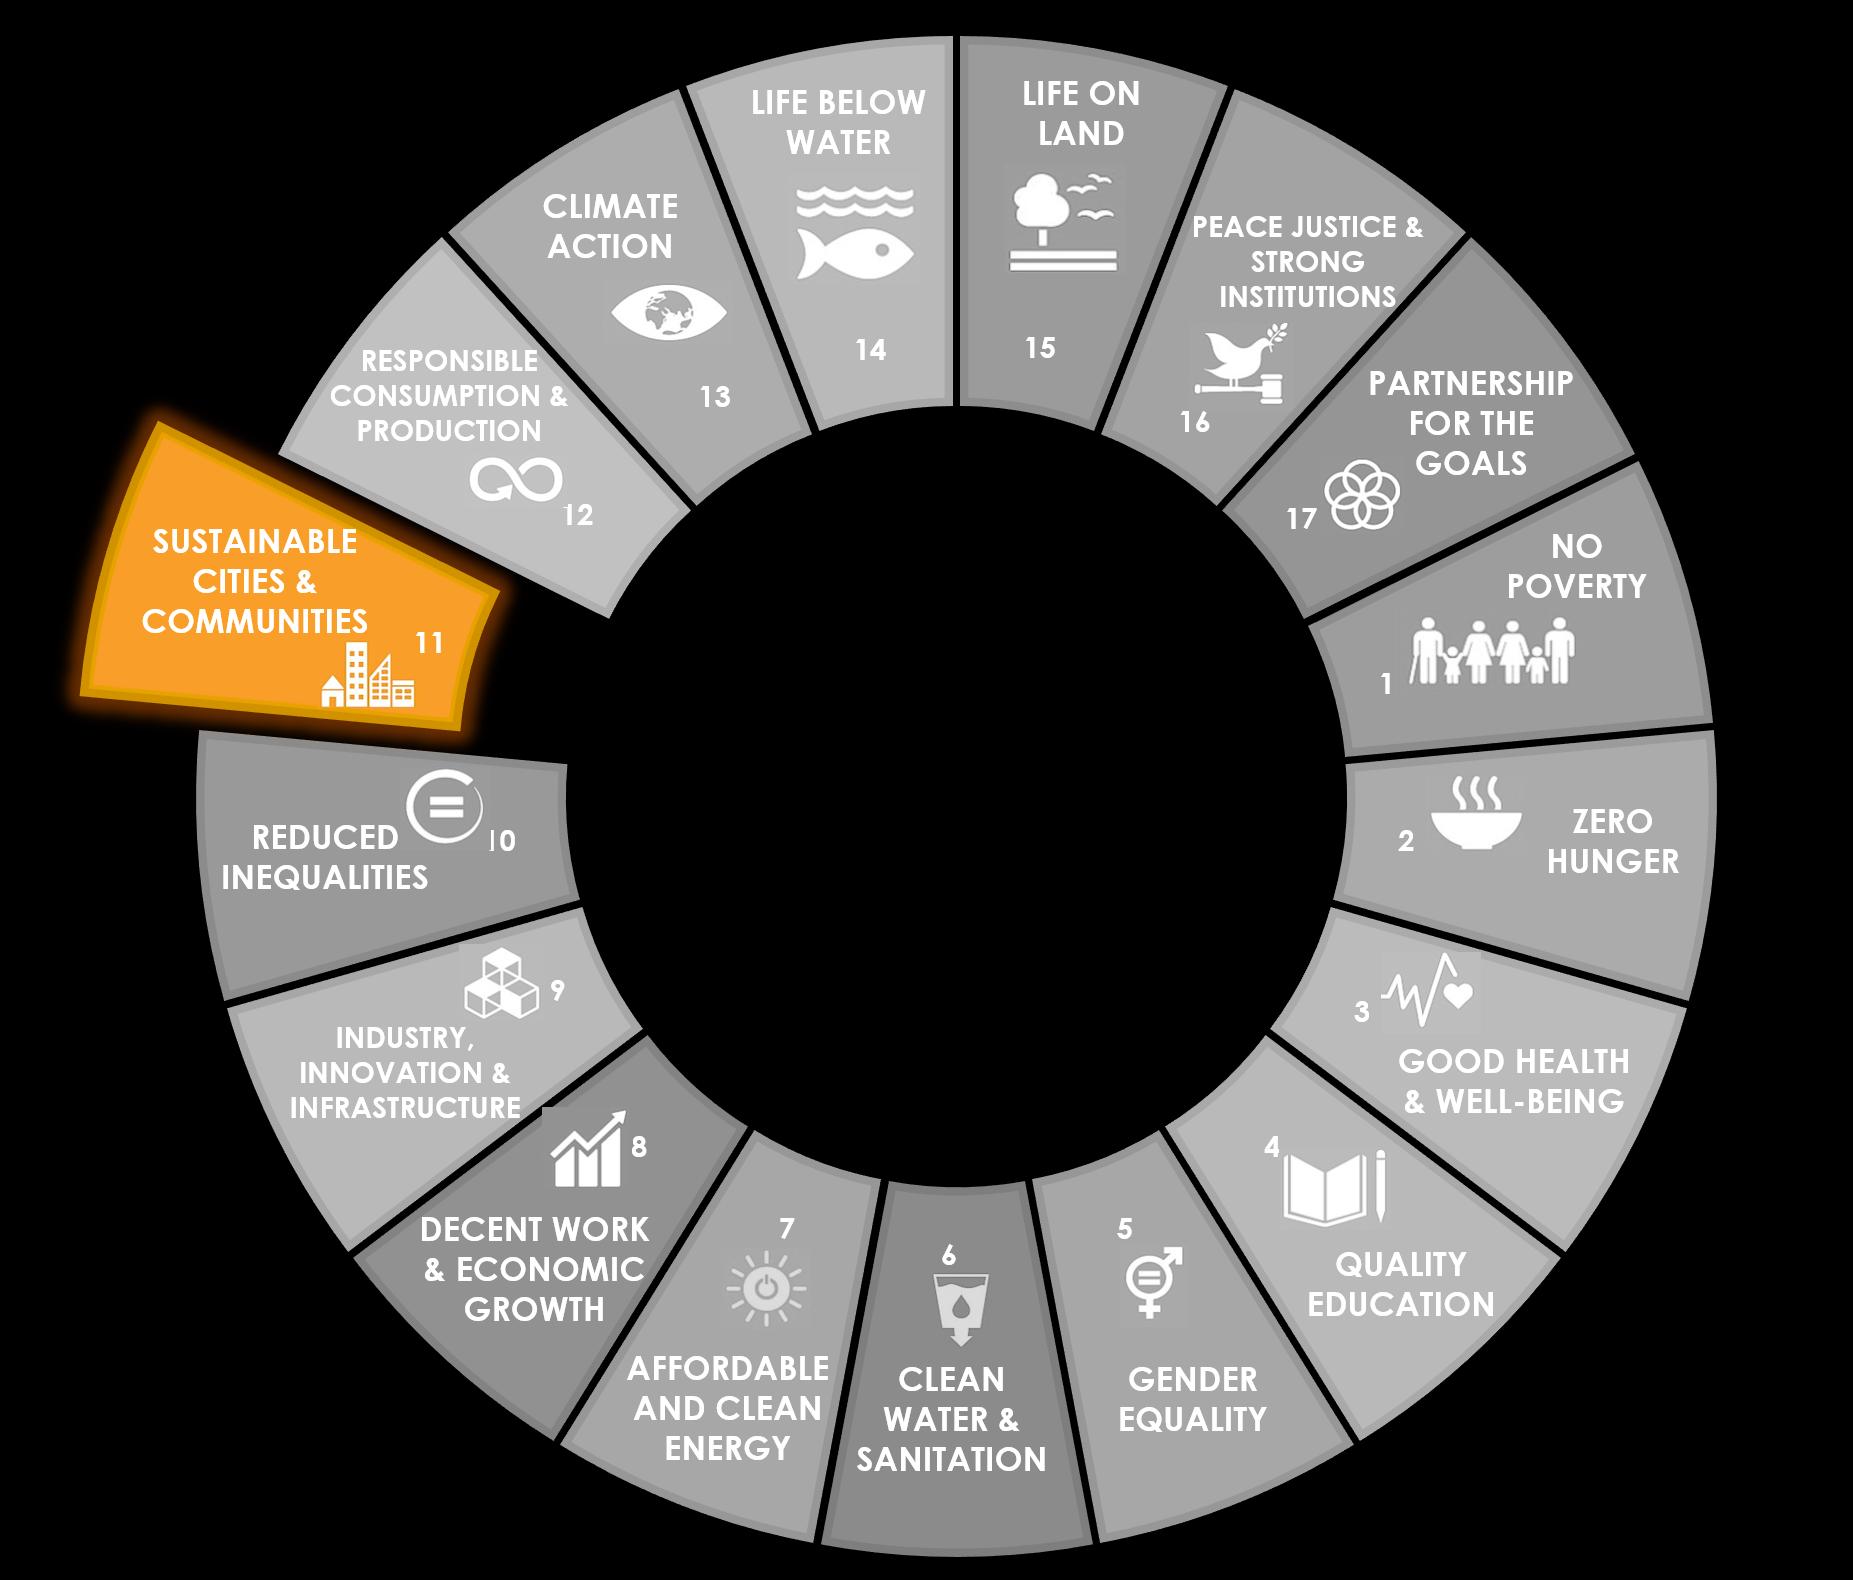
Fig 1.1: Sustainable Development Goals (Source: United Nations)
Particulars
Rank Quality of Life 51.79 29 Sustainability 57.77 11
Table 1.2: Scores and Rank of Bhubaneswar
Score
(Source: GIS, Ease of Living Index Report 2020, MoHUA & Census of India 2011)
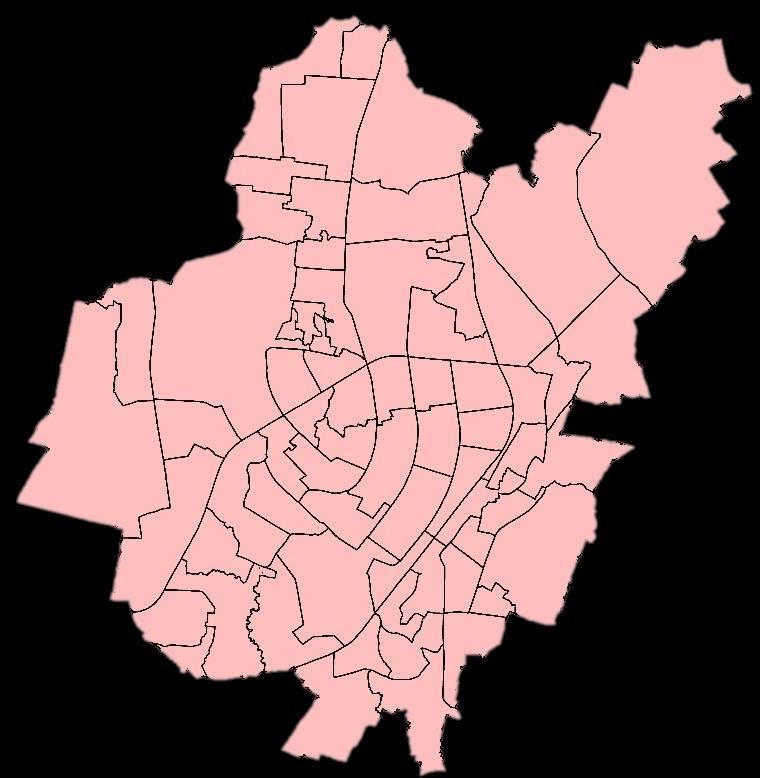
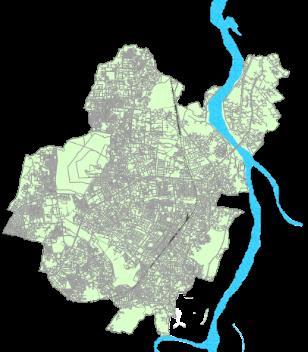
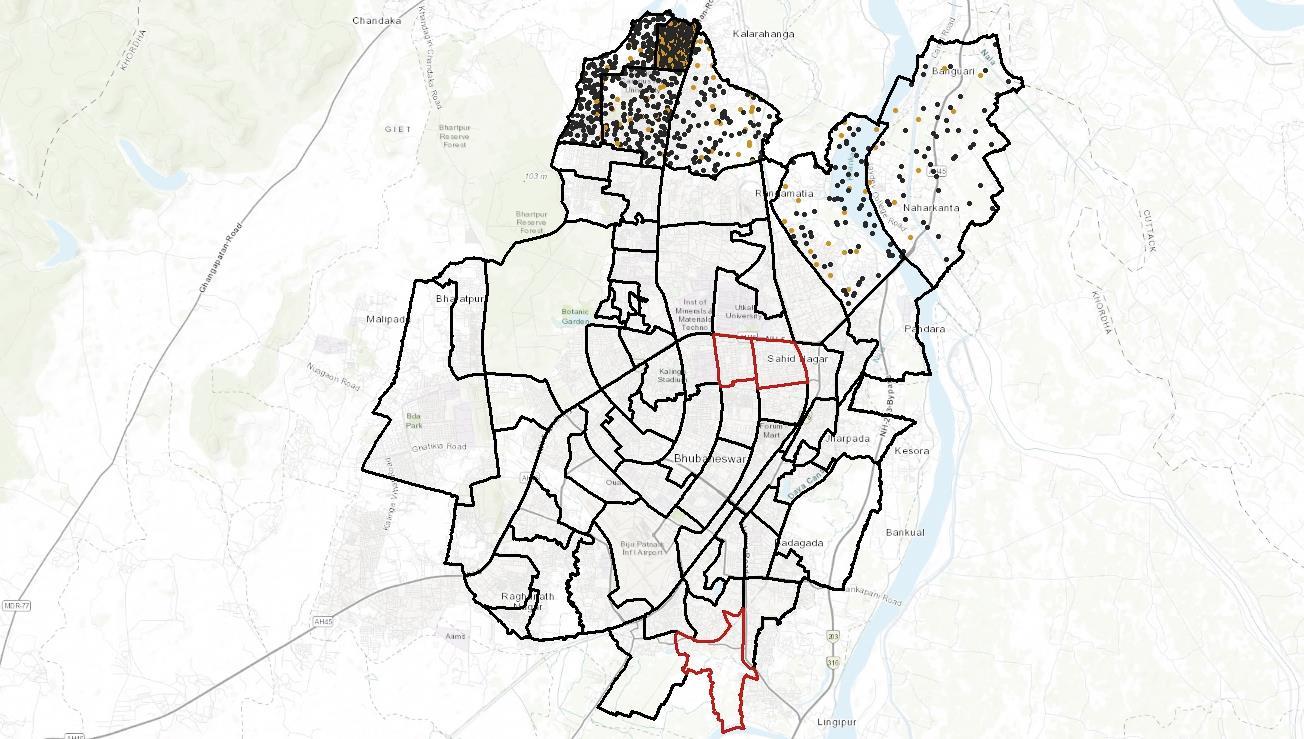
Map 1.4: Bhubaneswar Municipal Area
Cities of Odisha Population (in lakhs) 2011 2022 Rourkela 2.72 3.64 Bhubaneswar 8.43 11.28
PLANNING THESIS
Table 1.1: Comparison of Population of Bhubaneswar and Rourkela
DEPARTMENT OF PLANNING
University of Technology and Research, Ghatikia, Bhubaneswar
NO: 01 SYNOPSIS SUBMITTED BY PRITI CHHATOI 1920106033
THE ROLE OF URBAN FORM ON ACHIEVING BETTER SOCIAL SUSTAINABILITY: A CASE STUDY OF BHUBANESWAR
SHEET
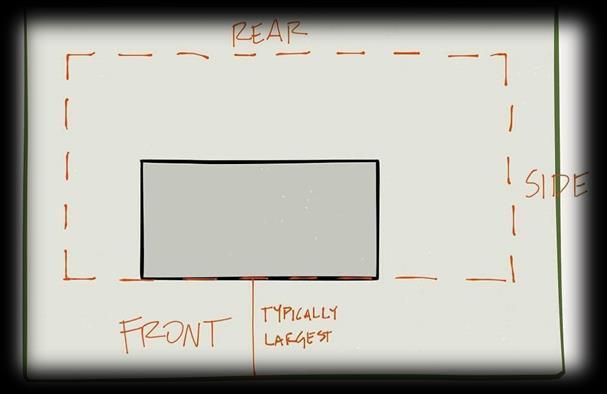
Open Spatial-Network Street Network Landuse Includes Mixed Landuse Density Population Density, Household Density Blocks Defined as a smallest area, Space for buildings surrounded by streets or other open spaces Built-Components attributed by orientation, frontage, coverage, enclosure, typology
Fig 1.2: Components of Urban Form
SOCIAL SUSTAINABILITY:
ONE AMONG THE THREE PILLARS OF SUSTAINABILITY
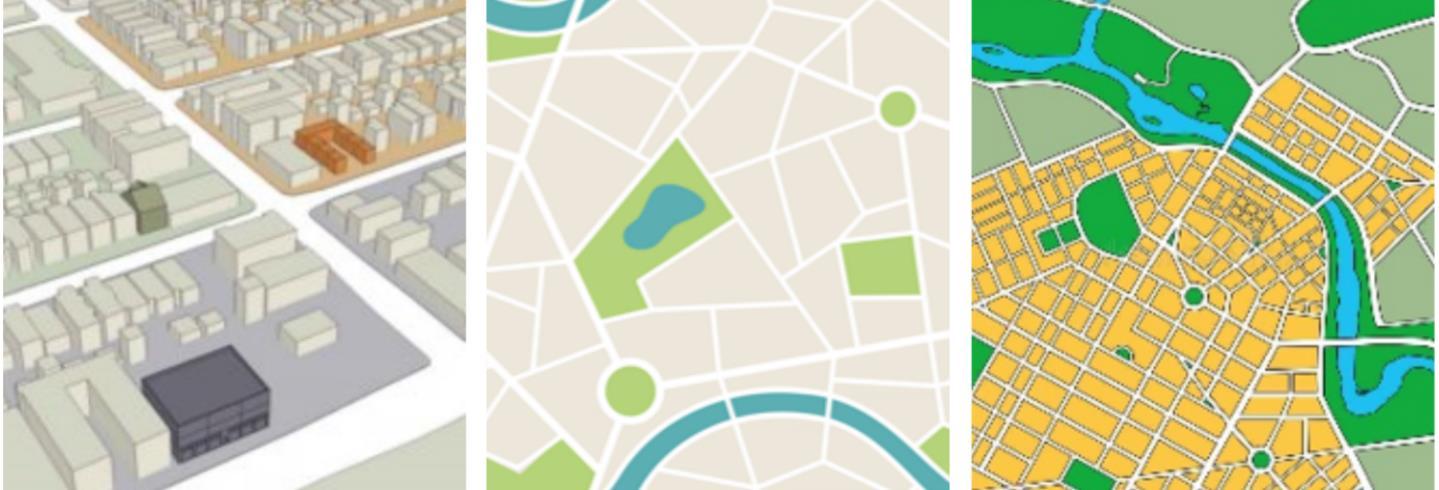
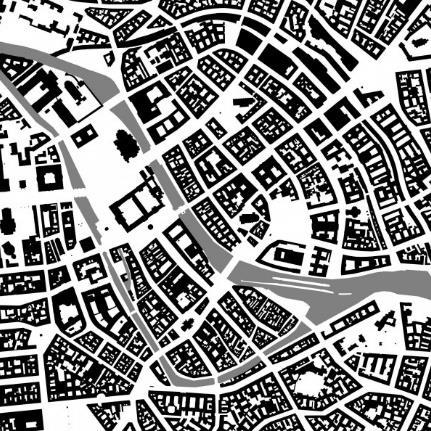
▪ Organic Urban Form: This form is developed naturally
▪ In-organic Urban Form: These are planned areas and developed according to specific guidelines and norms.
Factors that influence Urban Form
PLANNING REGULATIONS STREET PATTERN
SUSTAINABLE COMMUNITIES
ENVIRONMENTAL ENVIRONMENTAL
ENVIRONMENTAL ECONOMIC
Urban Form is basically classified into following two types : SOCIAL SOCIAL SOCIAL ECONOMIC ECONOMIC
Urban form components are interdependent and each component requires some level of integration with other components to produce a combined positive effect on social sustainability
Sustainability of community involves social interaction between community members; the relative stability of the community the existence of, and participation in, local collective institutions, formal and informal; including issues of security from threats; and pride in the community.
SOCIAL SUSTAINABILITY
Convergence of both the Concepts
Bottom UP Approaches
Revival of interest in the idea of ‘local community’ and building Sustainable Neighbourhoods
URBAN FORM
(The way urban form grows; reflects about the attitudes, beliefs, lifestyles, and influences of people who live there and thus indicates the sustainability of the place )

Negative Impacts of Urban Form on Social Sustainability
SOCIAL EQUITY
Social equity is related to social and environmental inclusion. An equitable society is one in which there are no ‘exclusionary’ or discriminatory practices hindering individuals from participating economically, socially and politically in society.
ACT, POLICY OR GUIDELINES AIM OBJECTIVE INFERENCE
▪ Adequate, safe, and affordable housing and basic services
▪ Safe, affordable, accessible, and sustainable transport systems.
Sustainable Development Goals (SDG)


SDG 11- Sustainable Cities and Communities
(United Nations General Assembly in 2015)
▪ To promote inclusiveness and sustainable urbanization so that the cities can be productive, accessible places that attract talent, encourage innovation and create economic growth
▪ It lays down a framework to ensure capacity building for better governance
▪ Enhance inclusive and sustainable urbanization and capacity for participatory, integrated and sustainable human settlement planning and management in all countries
▪ Strengthen efforts to protect and safeguard the world’s cultural and natural heritage.
▪ Reduce the number of deaths and the number of people affected by disasters and decrease the direct economic losses relative to global gross domestic product caused by disasters

▪ Reduce the adverse per capita environmental impact of cities, including by paying special attention to air quality and municipal and other waste management
▪ Provide universal access to safe, inclusive and accessible, green and public spaces.
▪ Different sub targets under SDG 11.
▪ The correlation of SDG 11 and other remaining SDG Goals that needed to achieve for achieving SDG 11
Form Based Codes
(Ministry of Housing and Urban Affairs 2019)
▪ The FBC guide book aims to function as a reference document for cities who are willing to initiate/adopt the FBC planning codes to achieve a people friendly and inclusive development in the city.
▪ To educate the city governments on understand and evaluate the need for FBC codes for their cities
▪ To provide a step by step methodology to identify, design and implement FBC codes.
▪ To help gauge the amount of outside assistance (consultants) needed, financial and administration support required for the project.
▪ Organising principles for a sustainable development; including coordinated built form, complete streets, accessible public spaces etc.
Complete Streets Guidelines
(Ministry of Housing and Urban Affairs 2019)
▪ Aims to increase the use of walking, cycling, and public transport by creating a safe and pleasant network of footpaths, cycle tracks, greenways, and other facilities to serve all citizens in the metropolitan area
▪ The city will increase the mode share of walking and cycling by providing equitable distribution of street space.

▪ The city will aspire to create safe, comfortable, convenient and accessible street network for all road users irrespective of gender, age, ability etc
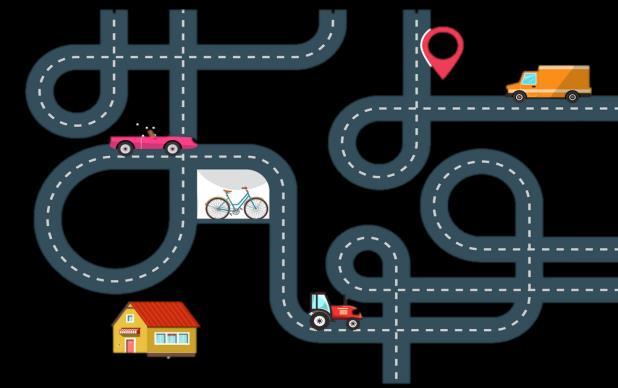
▪ The city will ensure that all streets are more vibrant, attractive and inclusive.
▪ To improve road safety and reduce injuries and fatalities
▪ To improve livability by improving ambient air quality.

UNDERSTANDING THE ROLE OF URBAN FORM ON ACHIEVING BETTER SOCIAL SUSTAINABILITY: A CASE STUDY OF BHUBANESWAR
DEPARTMENT OF PLANNING


Odisha University of Technology and Research, Ghatikia, Bhubaneswar
PLANNING THESIS
▪ Strategic guidance on the rationale for improving streets.
▪ Benefits of complete streets that includes improving safety, reduction in road congestions and increase the vibrancy of the streets.
SHEET NO: 02

CONCEPTUAL LITERATURE
URBAN FORM: THE PHYSICAL IMPRINT OF A CITY
POOR ACCESS TO OPEN SPACE
Fig 1.3: Stages of evolution of 3 pillars of Sustainability
1 3 2 LAND OWNERSHIP
POOR
UNSAFE
MENTAL & PHYSICAL HEALTH
STREETS
LITERATURE STUDY SUBMITTED BY PRITI CHHATOI 1920106033 DIMENSIONS OF SOCIAL SUSTAINBILITY
Name of the Journal: Improve Urban Form to Achieve High Social Sustainability in a Residential Neighborhood
Authors: Amr N Mohamed, Ashraf Abd Elfattah Elmokadem, Shimaa M Ali and Nancy Badawey
Key Learnings:
▪ Quantitative connection between the Urban Form Aspects and Social Sustainability in residential communities
Social Sustainability
Urban Form Relation between Aspects and Indicators
Aspects Indicators Aspects Indicators
Social Activities and Interaction
Mix-Use percentage and walkability
Safety and Security Walkability
Social Integration Spatial Connectivity
Mixed Landuse
Mixed-use percentage
Name of the Journal: Assessment of social sustainable development in urban India by a composite index
Authors: Sudha Panda, Manjari Chakraborty, S K Misra
Key Learnings:
▪ The drivers/themes under Urban Social Sustainability.
▪ A hierarchal framework of Urban Social Sustainability by obtaining the indicators under each of the themes
DRIVERS/ THEMES OF URBAN SOCIAL SUSTAINBILITY
Urban Pattern
Street Percentage and block clusters Arrangement
Quality of Center Green open spaces percentages
Fig 1.4: Inter-relationship between components of Urban Form and Social Sustainability
Relevance to the Study:
More mixed land use, Higher levels of Social Activities and Interaction
More people walking around means more eyes on the street which improves safety.
Well-connected space will create well integrated neighbours
ACCESS
▪ Developing a matrix between Social Sustainability and Urban form aspects to establish the relationship in accordance to the study area
Name of the Journal: Influence of Urban Forms on Social Sustainability
Authors: Shruti Hemani, Amarendra Kumar Das
Key Learnings:
▪ Social Sustainability in built environment nurtures the 4'S', social capital, social cohesion, social inclusion and social equity, whilst appreciating people’s diverse needs and desires from the places they use.
Social Interaction
Individual Attributes
Socio-demographic Factors
Length of Stay


Trust Reciprocity
Fig 1.5: Inter-relationship between components of social capital and social cohesion
Relevance to the Study:
Perception of Safety
EDUCATION
Relevance to the Study:
▪ Identification of the drivers/themes of Social Sustainability in accordance with Urban Form.
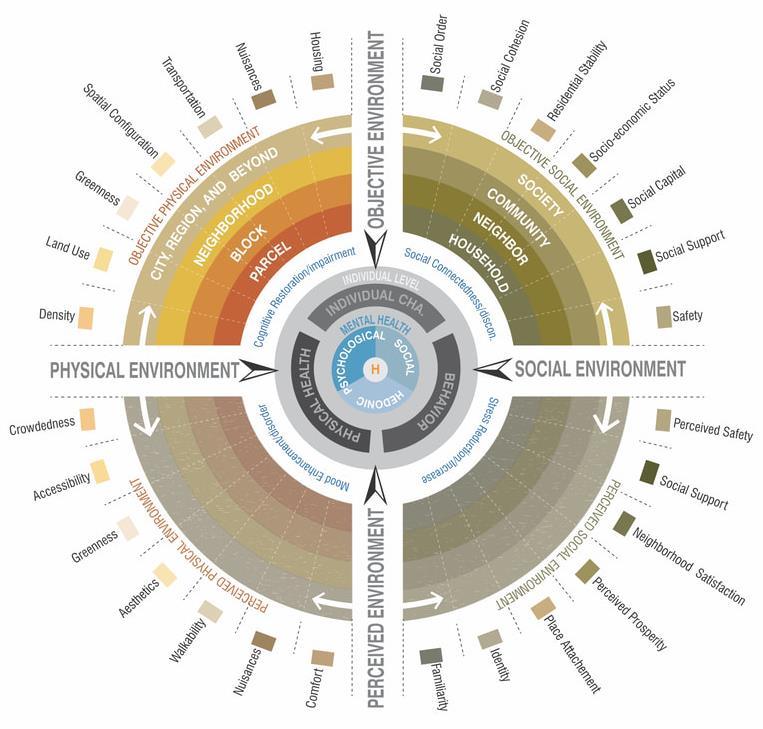
Name of the Journal: Urban form and mental wellbeing: scoping a theoretical framework for action
Authors: Amir Hajrasoulih, Vicente del Rio, James Francis and Jessica Edmondson
Key Learnings:
▪ Urban form plays multiple roles in the perceived and objective social environment, and the social environment has an impact on the social-well-being of individuals.
▪ The Centers for Disease Control and Prevention identified the social elements of mental wellbeing as social acceptance, beliefs in the potential of people and society as a whole, personal self-worth and usefulness to society, and sense of community (CDC, 2016)
▪ Conceptual Framework of the Relationship Between Urban Form and Mental Well-Being
Relevance to the Study:
▪ To understand the perspective of people with respect to the place they live, way they interact and participate in decision making and other cultural events.
▪ Various physical and social dimension of Urban Form is identified
UNDERSTANDING THE ROLE OF URBAN FORM ON ACHIEVING BETTER SOCIAL SUSTAINABILITY: A CASE STUDY OF BHUBANESWAR
Odisha
EMPERICAL LITERATURE: JOURNALS, RESEARCH
PAPERS
SERVICES
TO BASIC
DEMOGRAPHY SAFETY EQUITY HEALTH POVERTY HOUSING
Place Attachment Pride In Place Social Network Active Public Participation
PLANNING THESIS
DEPARTMENT OF PLANNING
University of Technology and Research, Ghatikia, Bhubaneswar
STUDY
BY PRITI CHHATOI 1920106033
SHEET NO: 03 LITERATURE
SUBMITTED
PLANNING TOOL
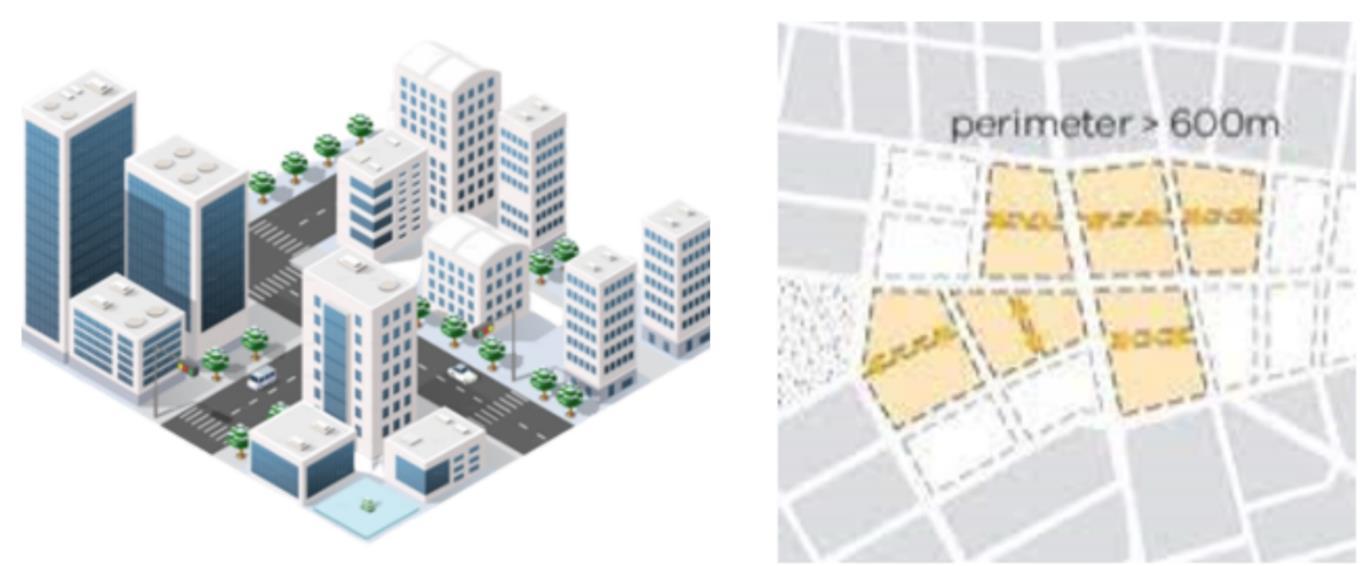
Designed to operate at three levels; city center, periphery and neighborhood level.
Development of adequate open spaces & green areas
Maintaining uniformity in skyline, heights and self sustained neighborhood unit.
1. Bida Bin Ammar Neighborhood, Al Ain City
Background:
▪ The Plan Al Ain 2030 (ADUPC, 2009) shows areas appropriate for densification development.
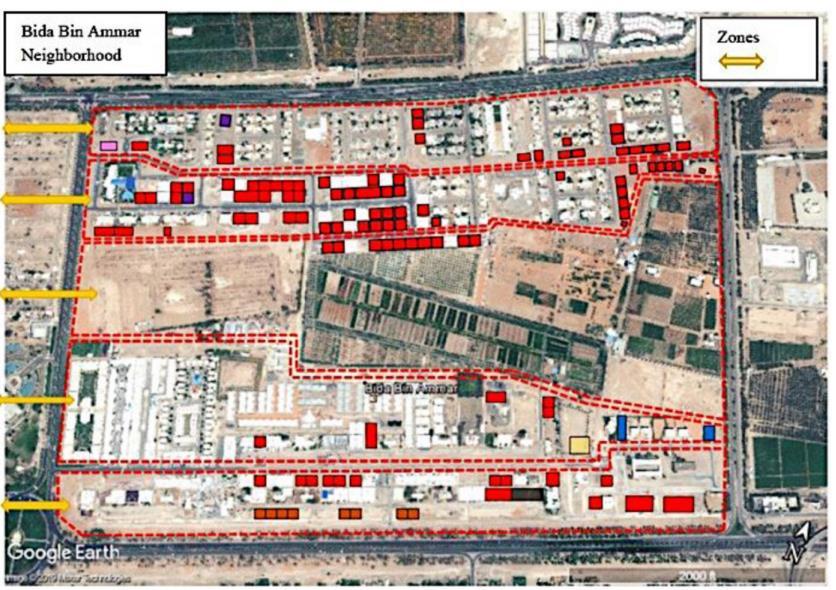
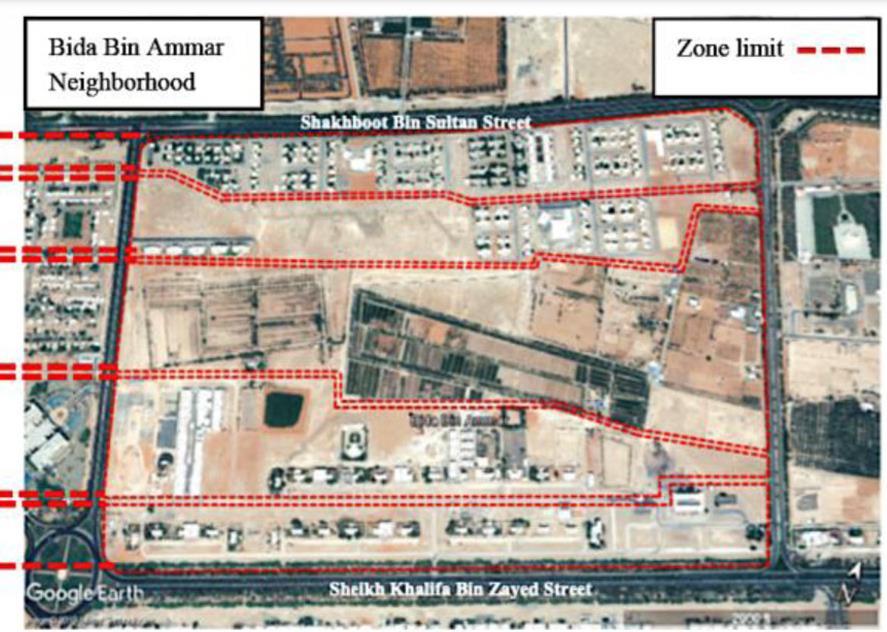
▪ Bida Bin Ammar neighborhood in Asharej district has been the pioneering model of neighborhoods with urban sprawl forms that have experienced densification transformation as per the Plan Al Ain 2030.
Techniques:
▪ Dividing the study area in to different zones
▪ Infill Development.
▪ Principle of vertical expansion
Results:
Gross population density of the neighborhood in 2010 was equal to 14.07 pph, and in 2030 is expected to reach to only 22 70 pph
Inference: Vertical Expansion and infill development can lead to accommodate high population density and mixed use of land and further promoting accessibility.
PARAMETERS IDENTIFIED FROM LITERATURE
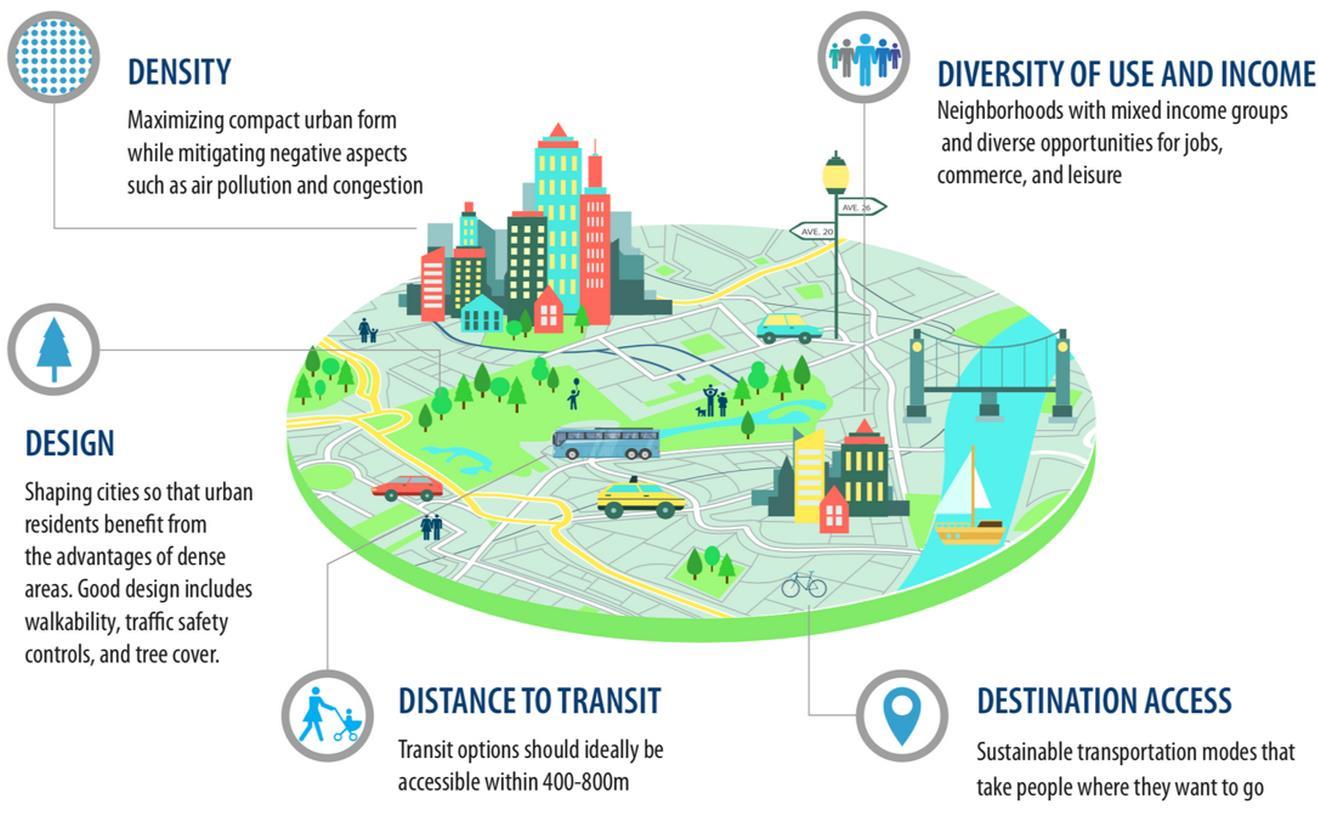
Availability: Presence of non-negotiable basic services, neighborhood facilities and amenities that support the residents every-day needs.
Accessibility: Safe and easy access to destinations that encourages walking, cycling and use of public transport, suggesting not only type of mobility but also type of sociability with other neighbors for every social groups
Connectivity: Connected and integrated network of streets that provide many routes for movement thus, reducing congestion and journey distances encouraging walking and use of alternative modes of transport Residential streets designed to reduce traffic and focus on community spaces
Density: Culturally accepted levels of higher residential densities that provide critical mass to support and sustain mass transit and increase the safety in a neighborhood
Diversity: In housing, & socio-economic mix that make urban form more inclusive and communities more tolerant. Diverse built forms that give interest and richness to a neighborhood and in increase its cultural richness
Recreational Areas: Availability of parks, playgrounds and open spaces in adequate percentage increases the mental and physical health of residents
Legibility: Legible design (more variety less monotony) and smaller blocks that makes it easier for the people to find their way around and understand the neighborhood
INFERENCE
Intended to strongly control the aesthetic of the city and its each component..
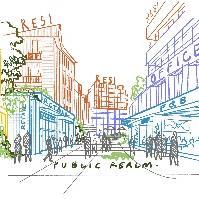
Focus was to develop integration of built form with public realm
Role of City Administration is vital for developing a planned urban form
Mixed Landuse: Balance in mixed use of buildings in urban neighbourhood make the places more lively and liveable in cities Neighborhood as a Place to Live: Privacy, Ventilation and regular maintenance of the neighborhood makes it more livable
Public Participation: Residents as active participants in the design of neighborhoods and its spaces reflecting their functional needs, desires and socio-cultural aspects
UNDERSTANDING THE ROLE OF URBAN FORM ON ACHIEVING BETTER SOCIAL SUSTAINABILITY: A CASE STUDY OF BHUBANESWAR SHEET NO: 04
DEPARTMENT OF PLANNING
Odisha University of Technology and Research, Ghatikia, Bhubaneswar
PLANNING THESIS
LITERATURE STUDY SUBMITTED BY PRITI CHHATOI 1920106033 EMPERICAL LITERATURE: CASE STUDY
ZONE F ZONE A ZONE B ZONE C ZONE D ZONE E ZONE F ZONE A ZONE B ZONE C ZONE D ZONE E
.
Fig 1.6: Satellite Image of the Neighbourhood 2002
Fig 1.7: Satellite Image of the Neighbourhood 2019
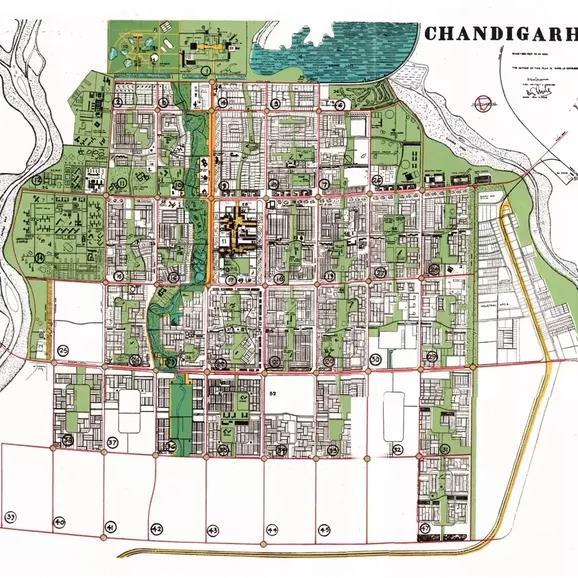
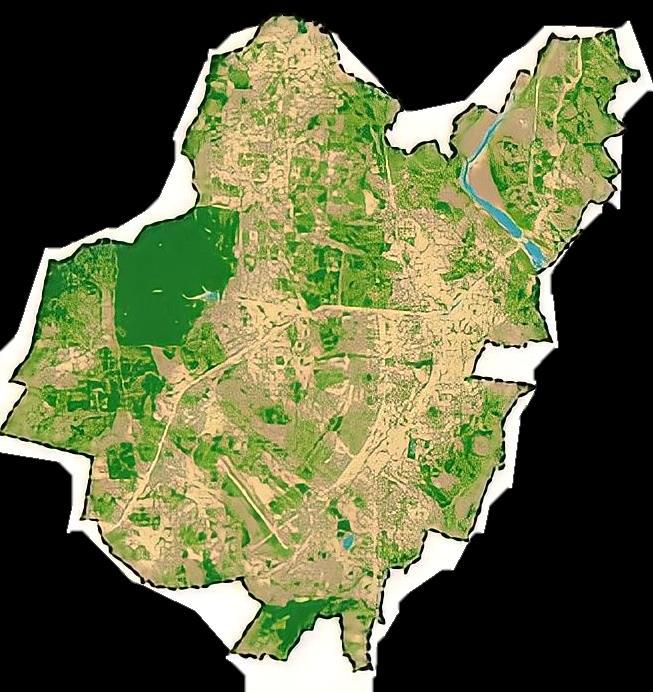
2. Chandigarh, India
▪ Bhubaneswar derived its name from Tribhubaneswar, which literally means the Lord (Eeswar) of the Three World (Tribhuban), which refers to Shiva. along with the old town, the present day Bhubaneswar has often been illustrated as the Ekamra Khetra (Temple City)
▪ The planning concept adopted to design the city was ‘NEIGHBORHOOD UNIT PLANNING’.
▪ Konigsberger designed a linear pattern for the city, which had main administrative bodies in the main artery, and the neighborhood units were attached to it.

1946
Otto Konigsberger planned Bhubaneswar
2022 Present Bhubaneswar: A Smart City
1956-1976 Growth of Institution
UPTO 1948
The Temple Town
1948-1956


The New Capital
1976 Onwards Development in Organised Sectors
▪ Bhubaneswar has a tropical savanna climate.
▪ Bhubaneswar City (BMC Area) comprises of nine planning zone as delineated by Bhubaneswar Development Authority
▪ These zones are Tamando (Extensive Development Zone), Aigania (Extensive Development Zone), Bhubaneswar New Town (Intensive Development Zone), Old Town (Restricted Development Zone), Sisupal (Sensitive Development Zone), Sribantapur (Sensitive Development Zone), East Kuakhai (Sensitive Development Zone), Chandrasekharpur (Extensive Development Zone), Bharatpur (Sensitive Development Zone).
Population Projection (as per Census 2011) 2022(Present) 2026 2030

11.2 Lakhs 12.6 Lakhs 14.2 Lakhs
Table 1.3: Projected Population till 2030 (Source: Census 2011)
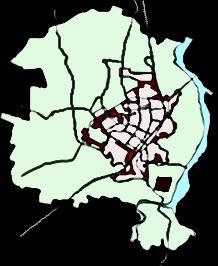
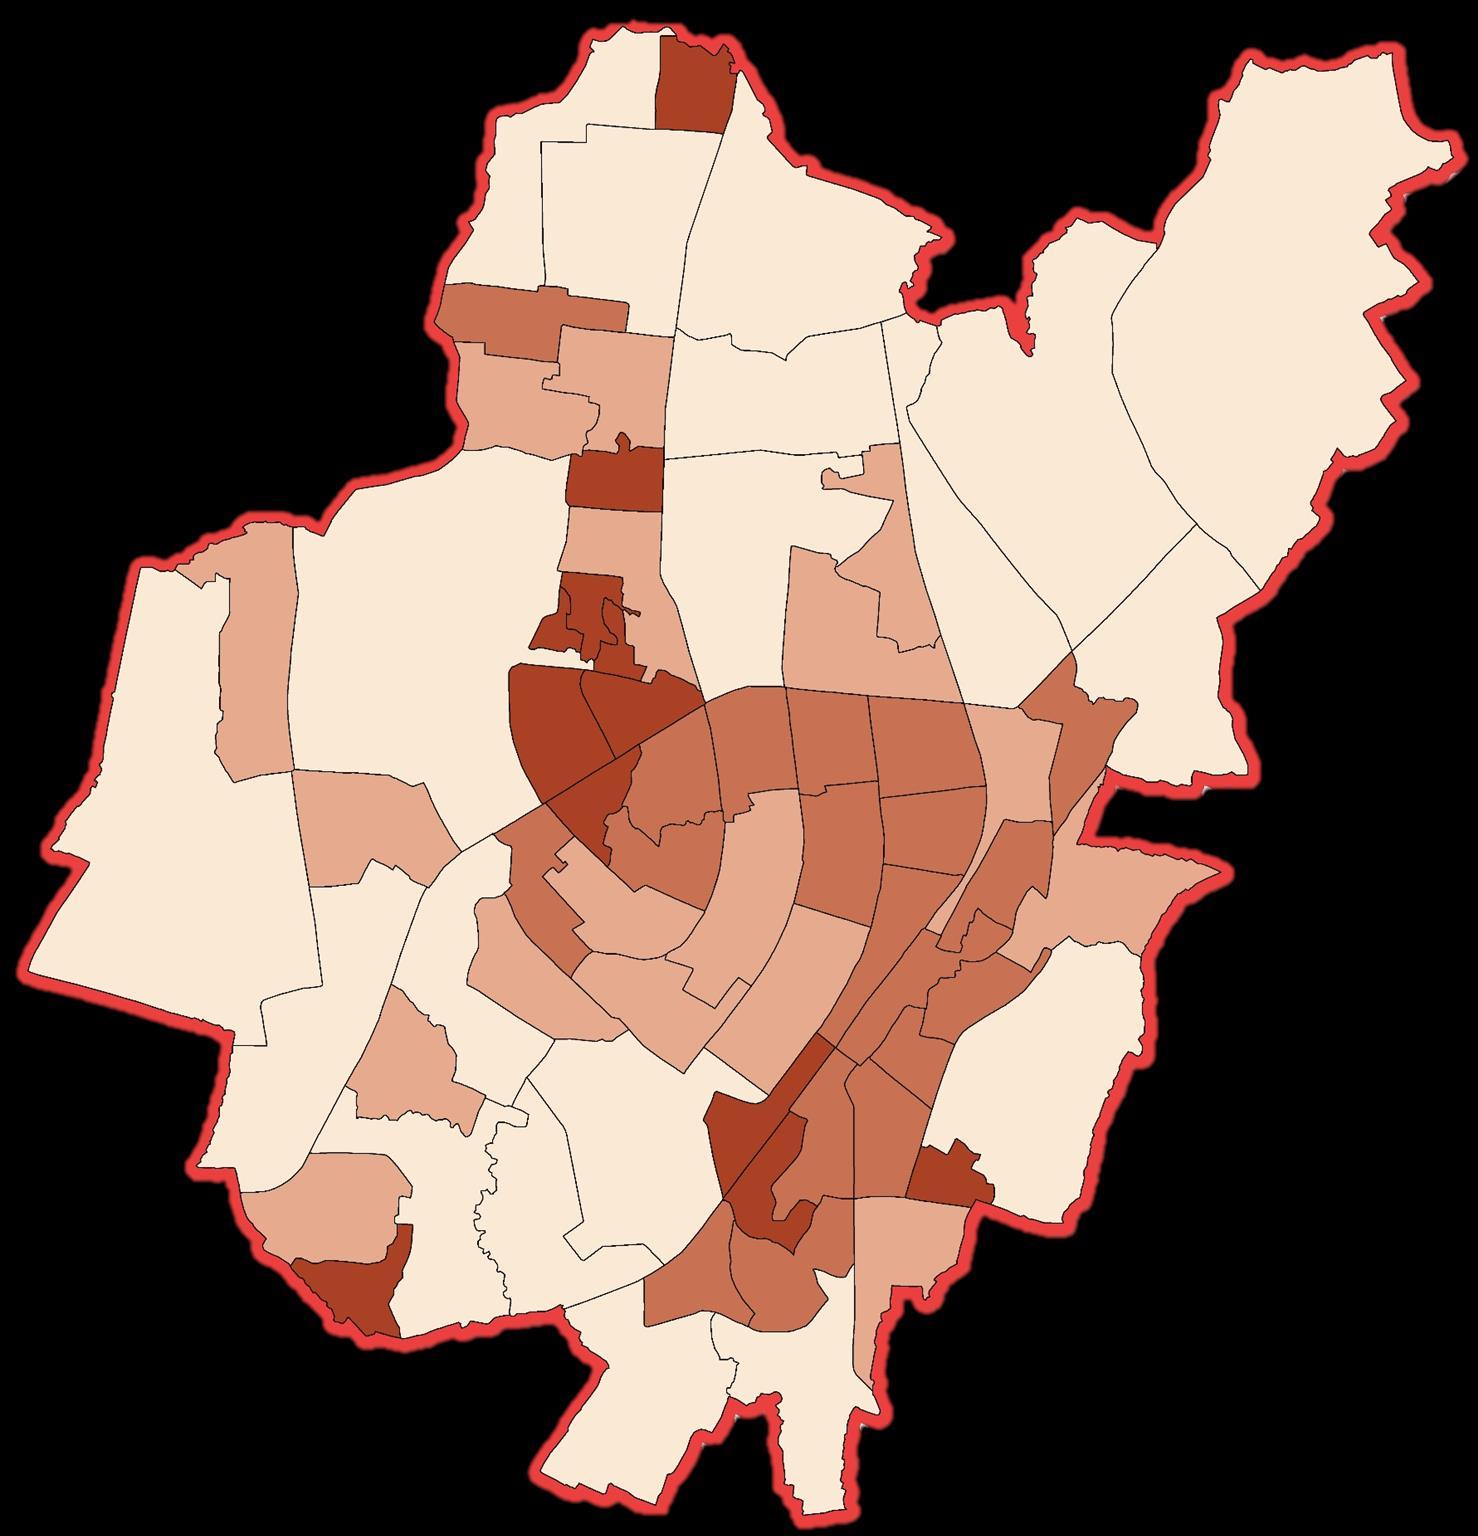
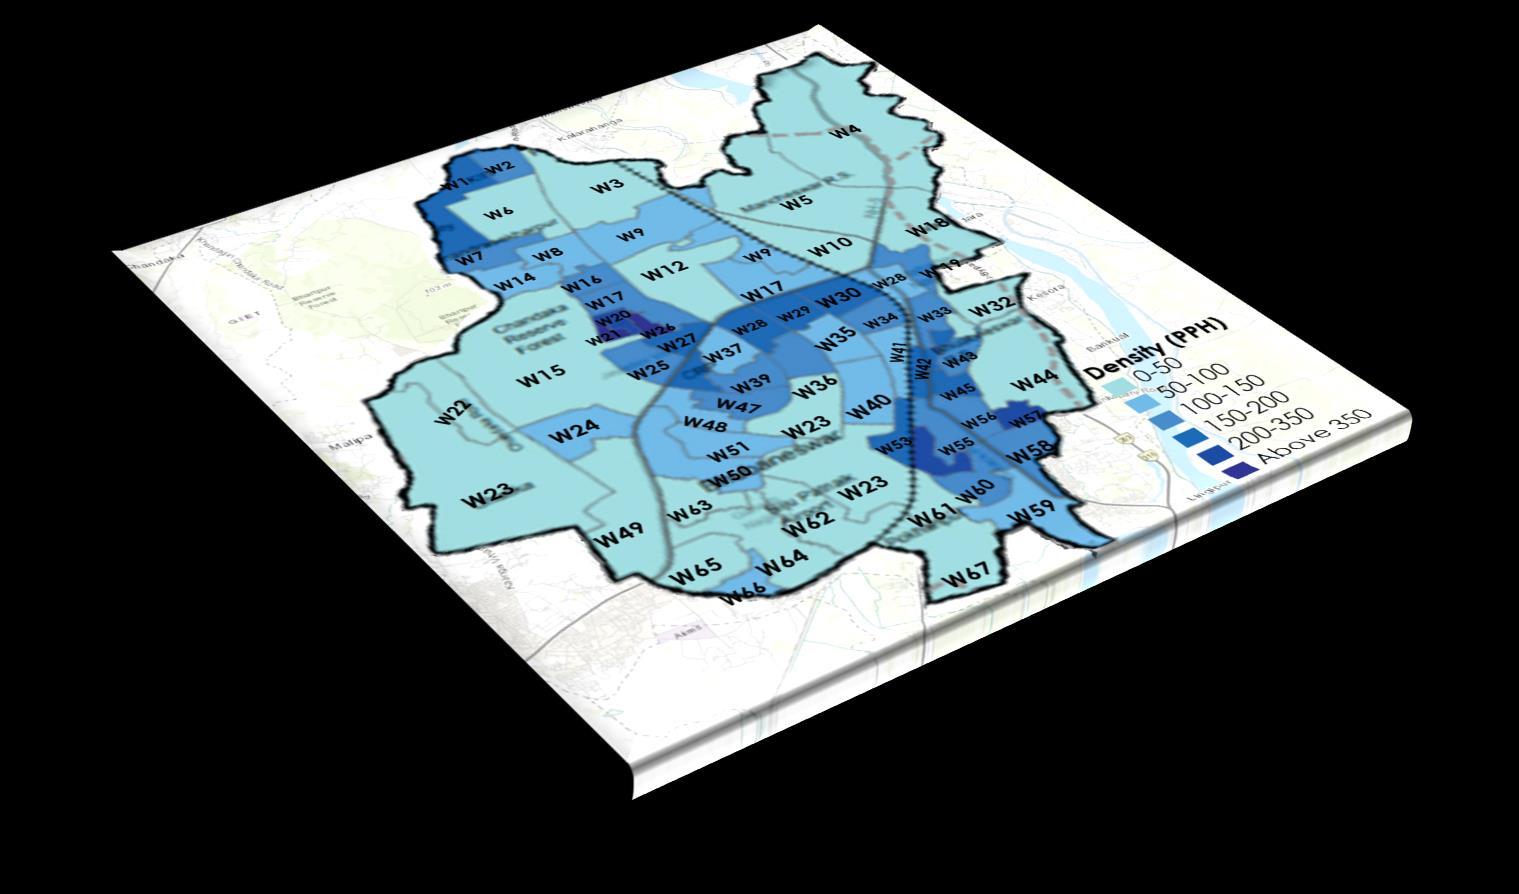
▪ Population density is higher in Ward 20, Ward 21 and Ward 26.
High
Low
UNDERSTANDING THE ROLE OF URBAN FORM ON ACHIEVING BETTER SOCIAL SUSTAINABILITY: A CASE STUDY OF BHUBANESWAR
Odisha University of Technology and Research, Ghatikia, Bhubaneswar
CITY PROFILE
SUBMITTED
CITY PROFILE
Fig 1.8: Stages of Development of Bhubaneswar (Source: City Development Plan)
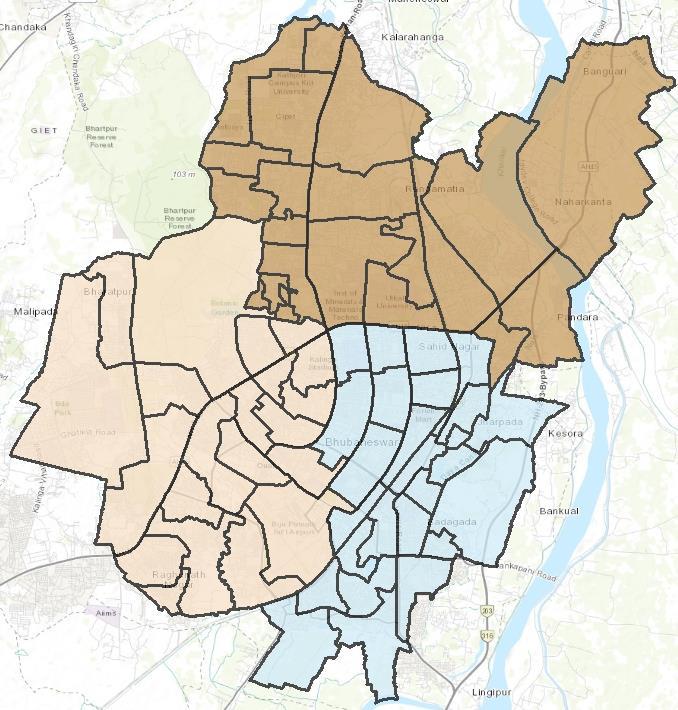
ADMINSTRATIVE ZONES AND WARDS OF CITY CONNECTIVITY MAP OF CITY EVOLUTION OF BHUBANESWAR URBAN BLUE AND GREEN MAPPING OF CITY
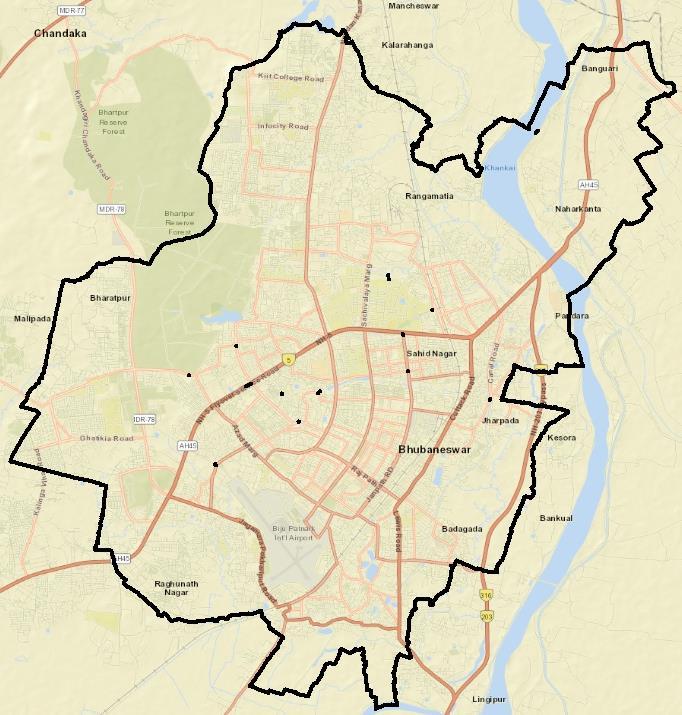
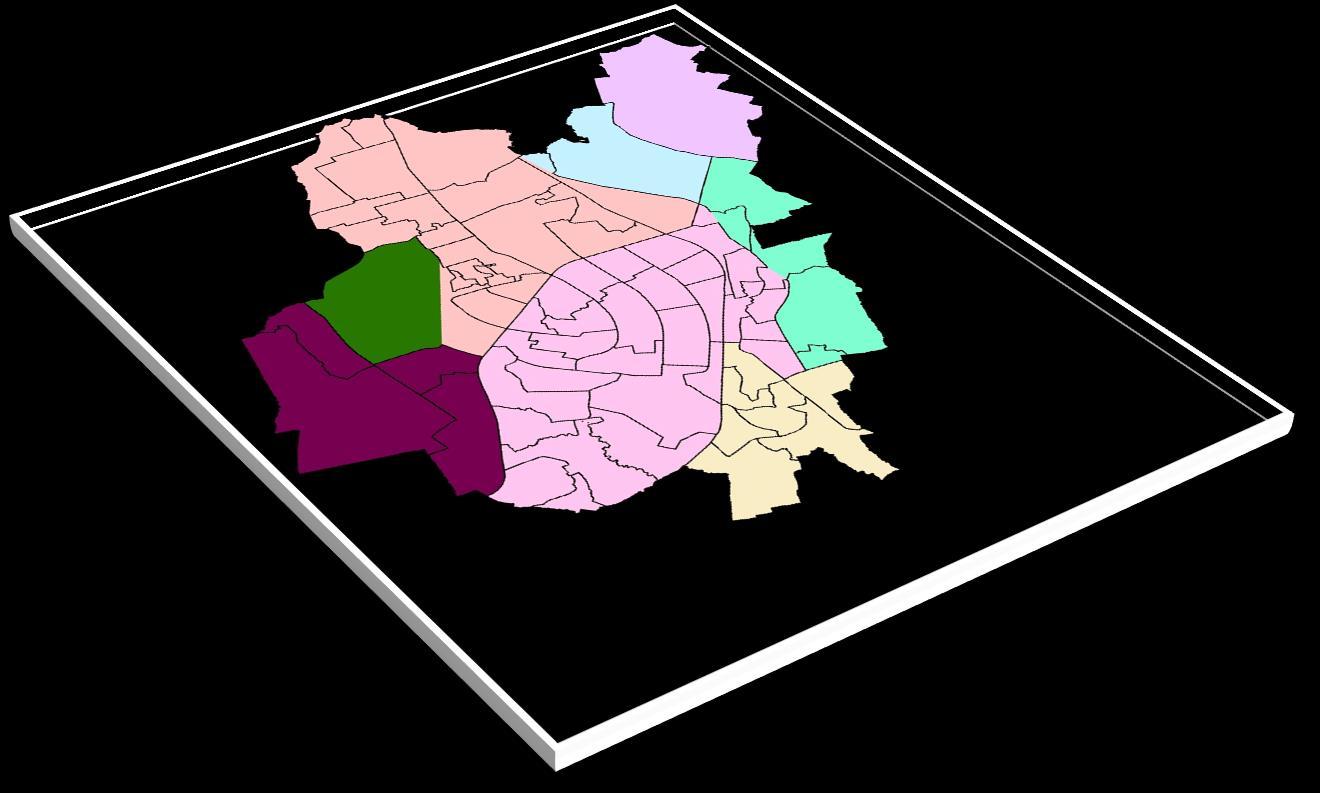
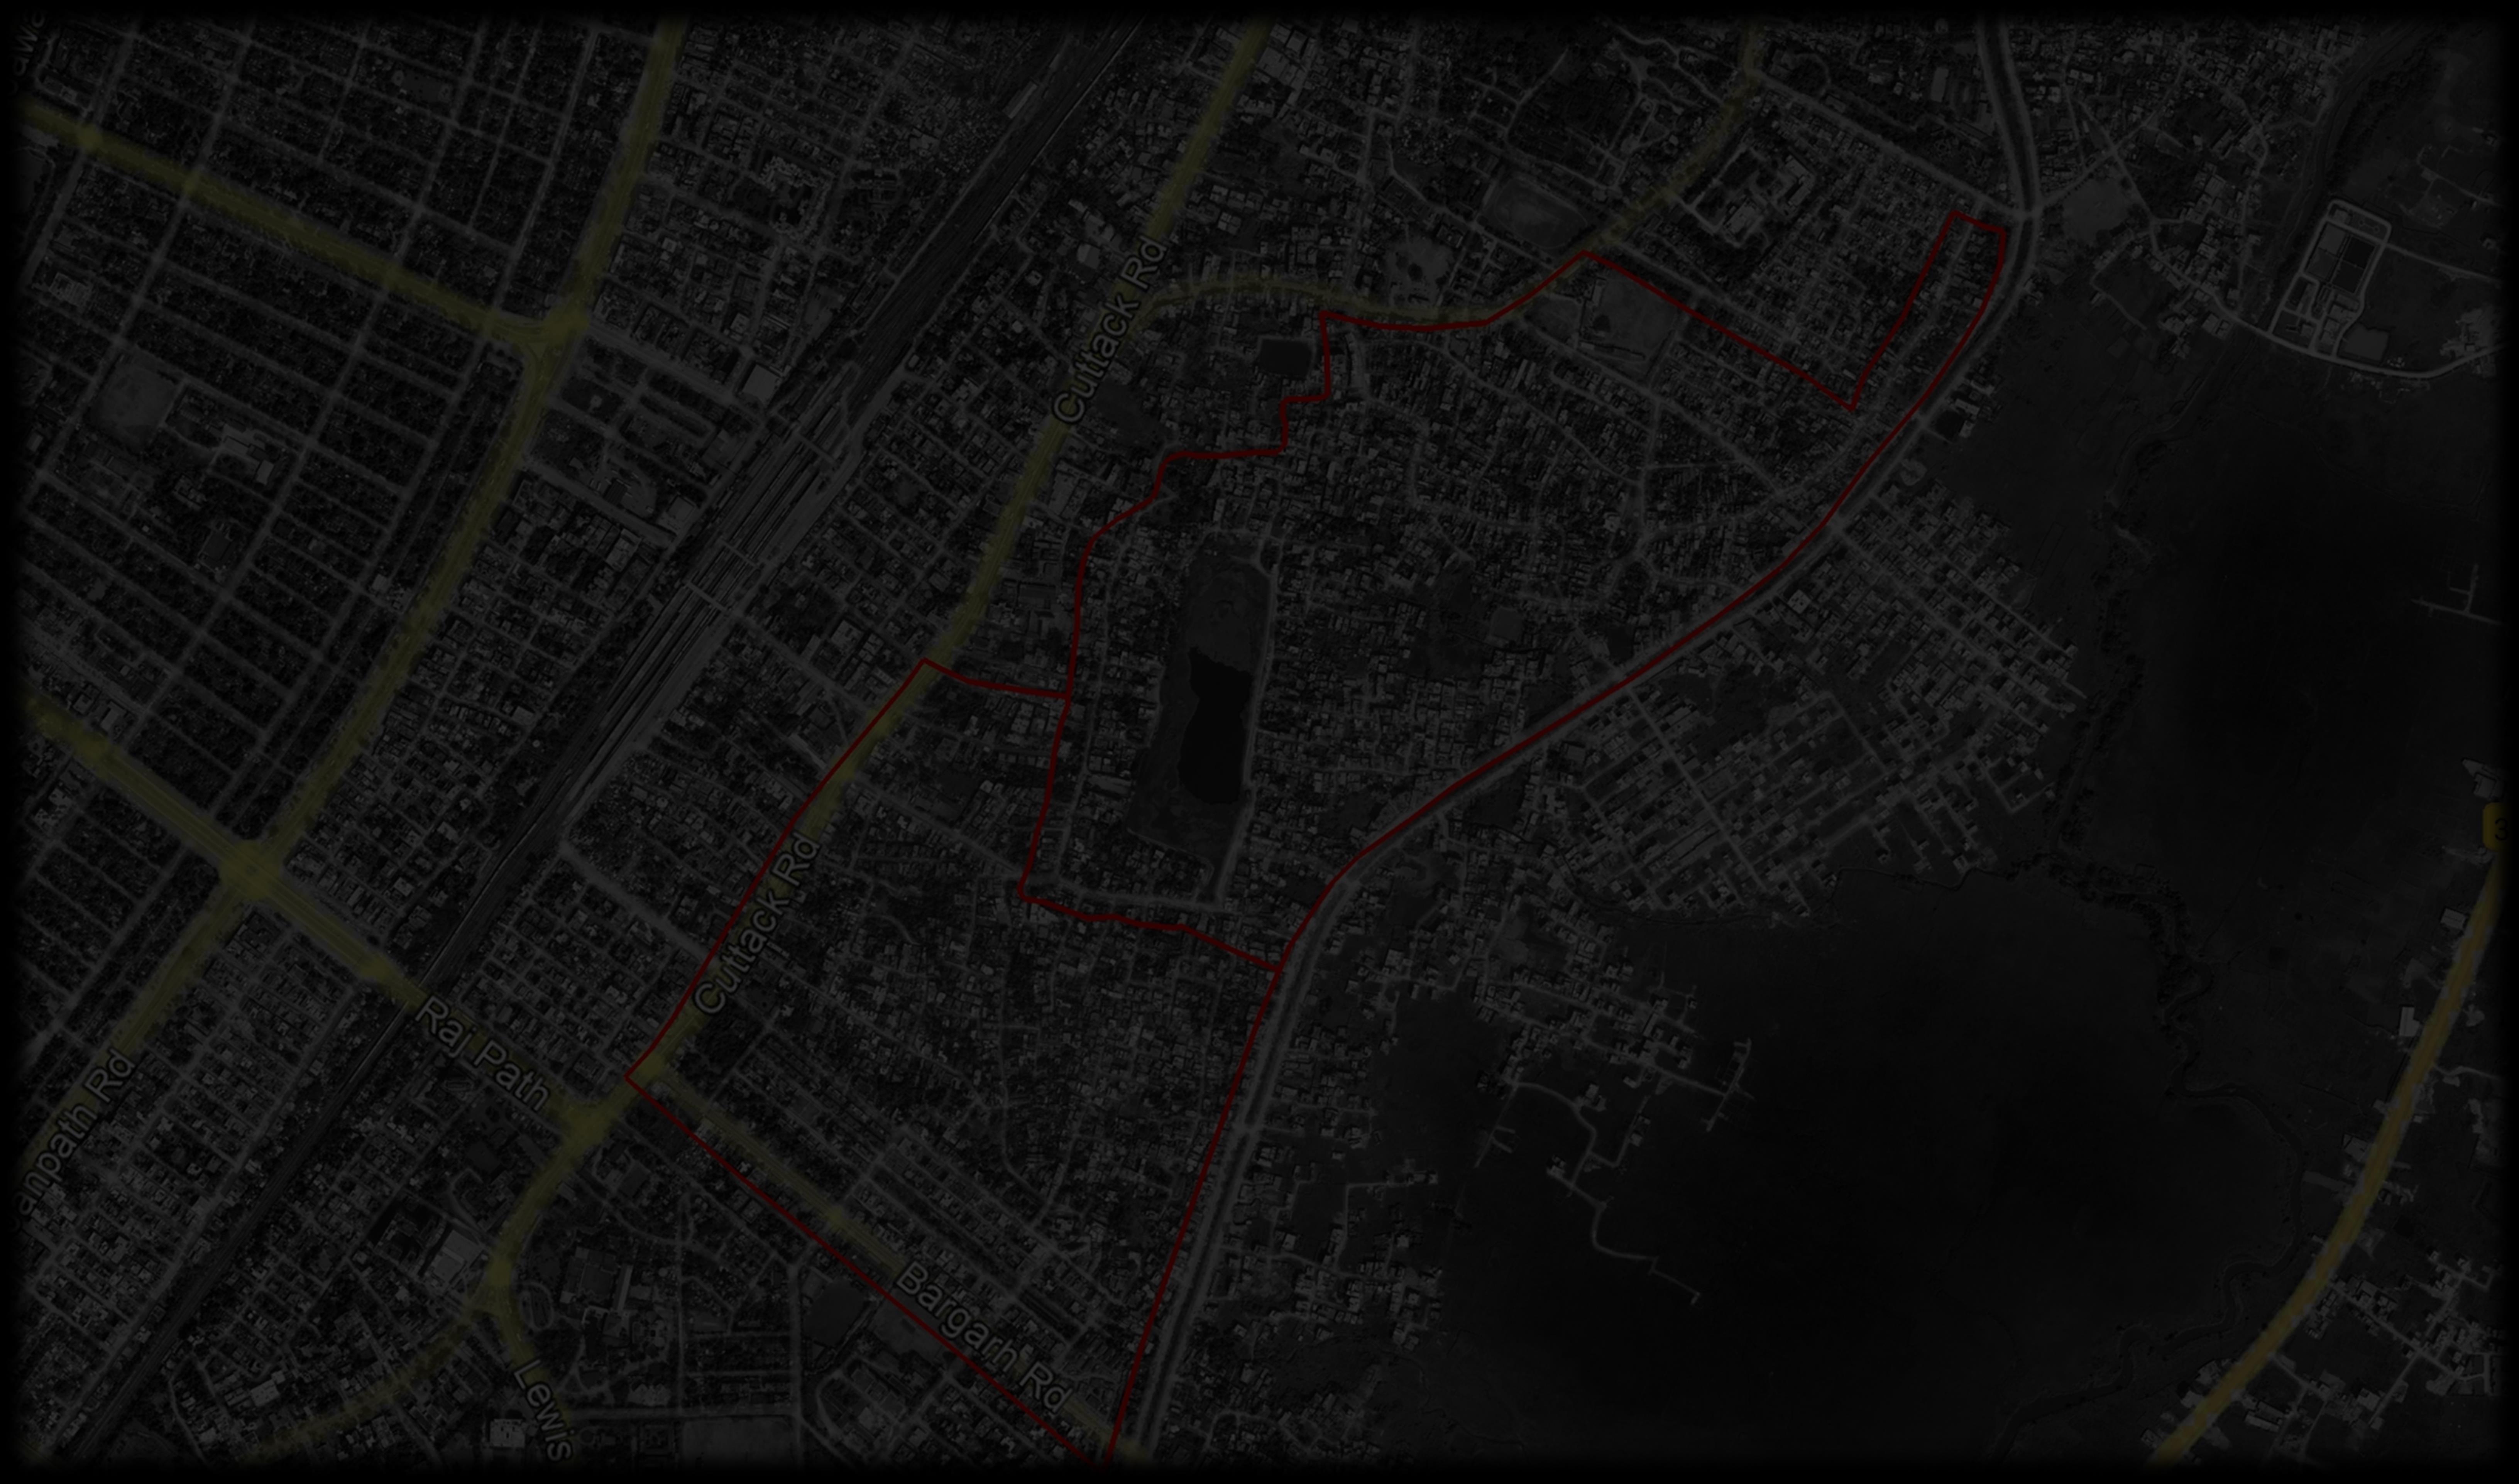
Map 1.5: Administrative Map of Bhubaneswar Municipal Corporation (Source: BMC, GIS)
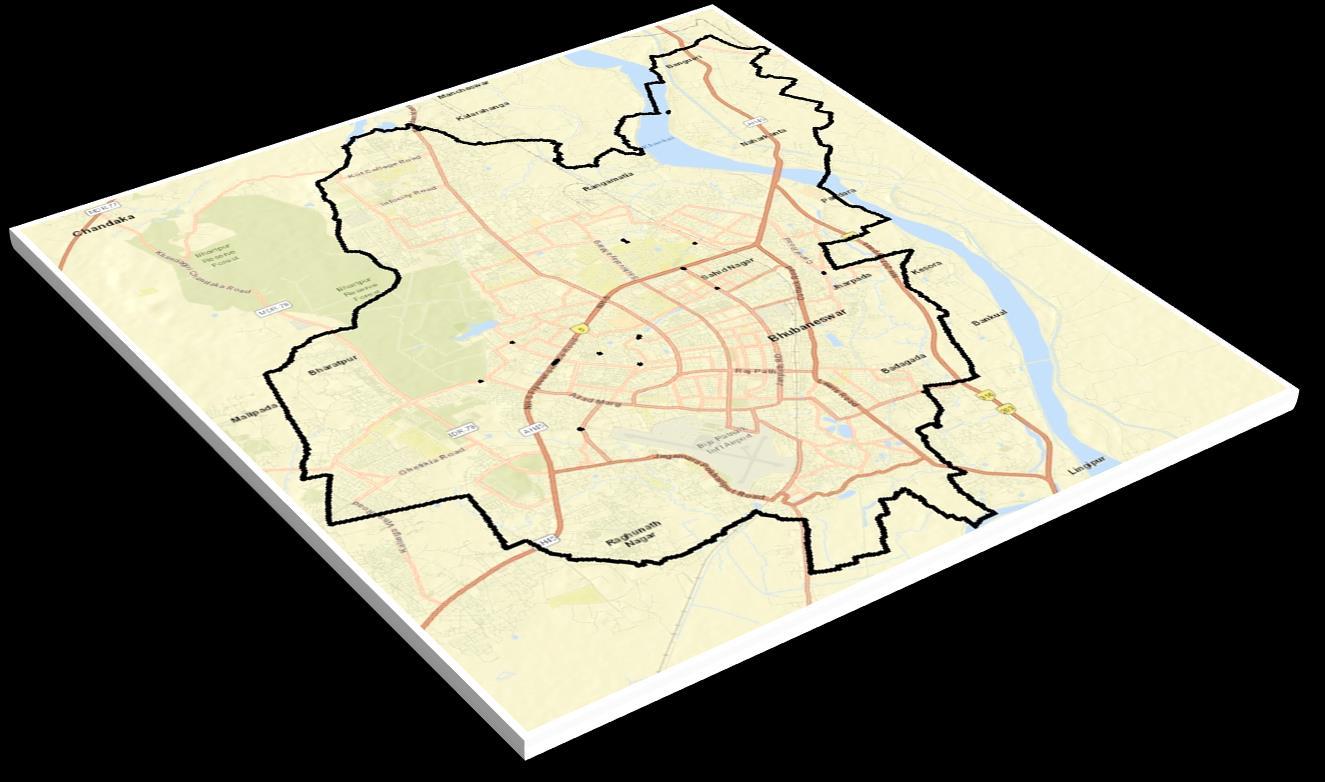
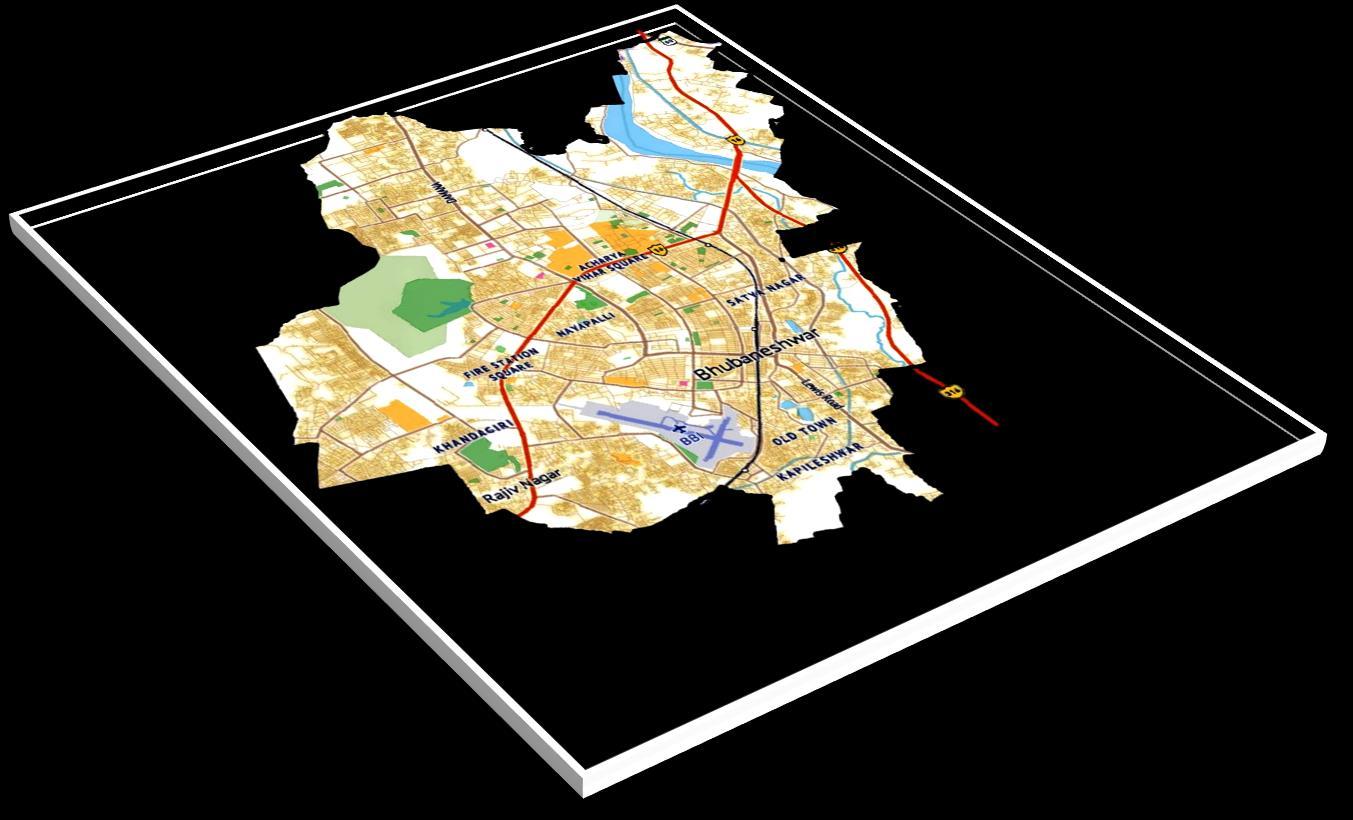
Map 1.6: Connectivity Map of Bhubaneswar Municipal Corporation (Source:, GIS Basemaps)
Map 1.7: Ward wise Population Density of Study Area (Source:, Census, GIS)
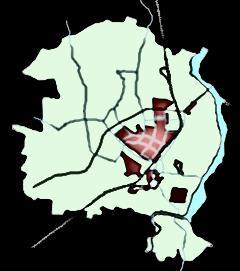
BUILT UP DENSITY OF CITY POPULATION DENSITY OF CITY
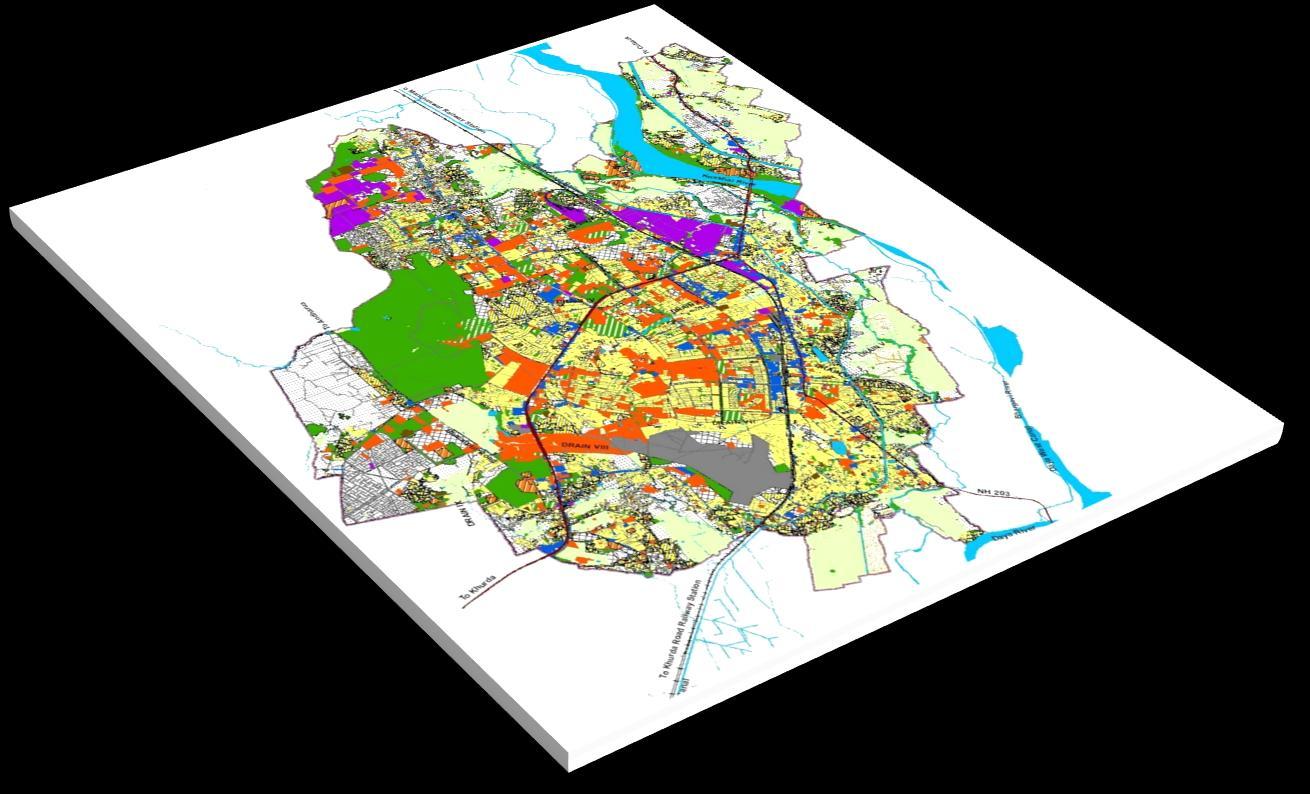
Map 1.8: Urban Blue and Green Mapping (Source: Google Earth, GIS)
Map 1.9: Connectivity Map of Bhubaneswar Municipal Corporation (Source: Bhubaneswar Municipal Corporation)
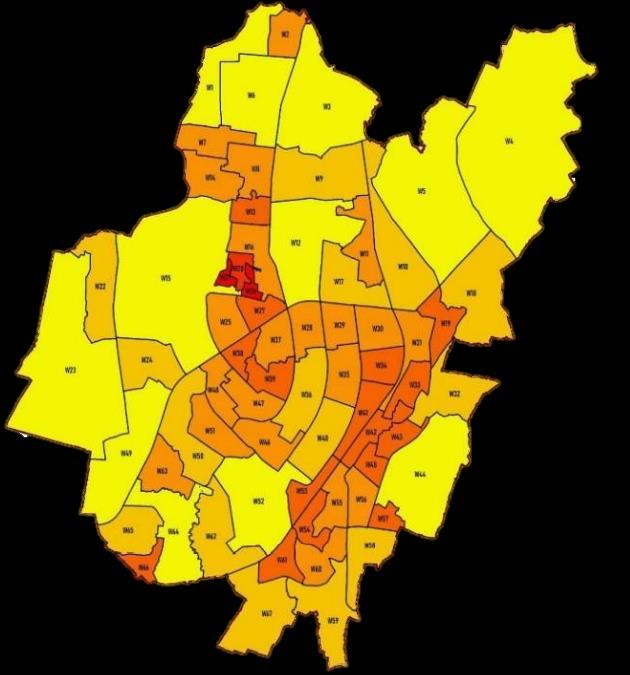
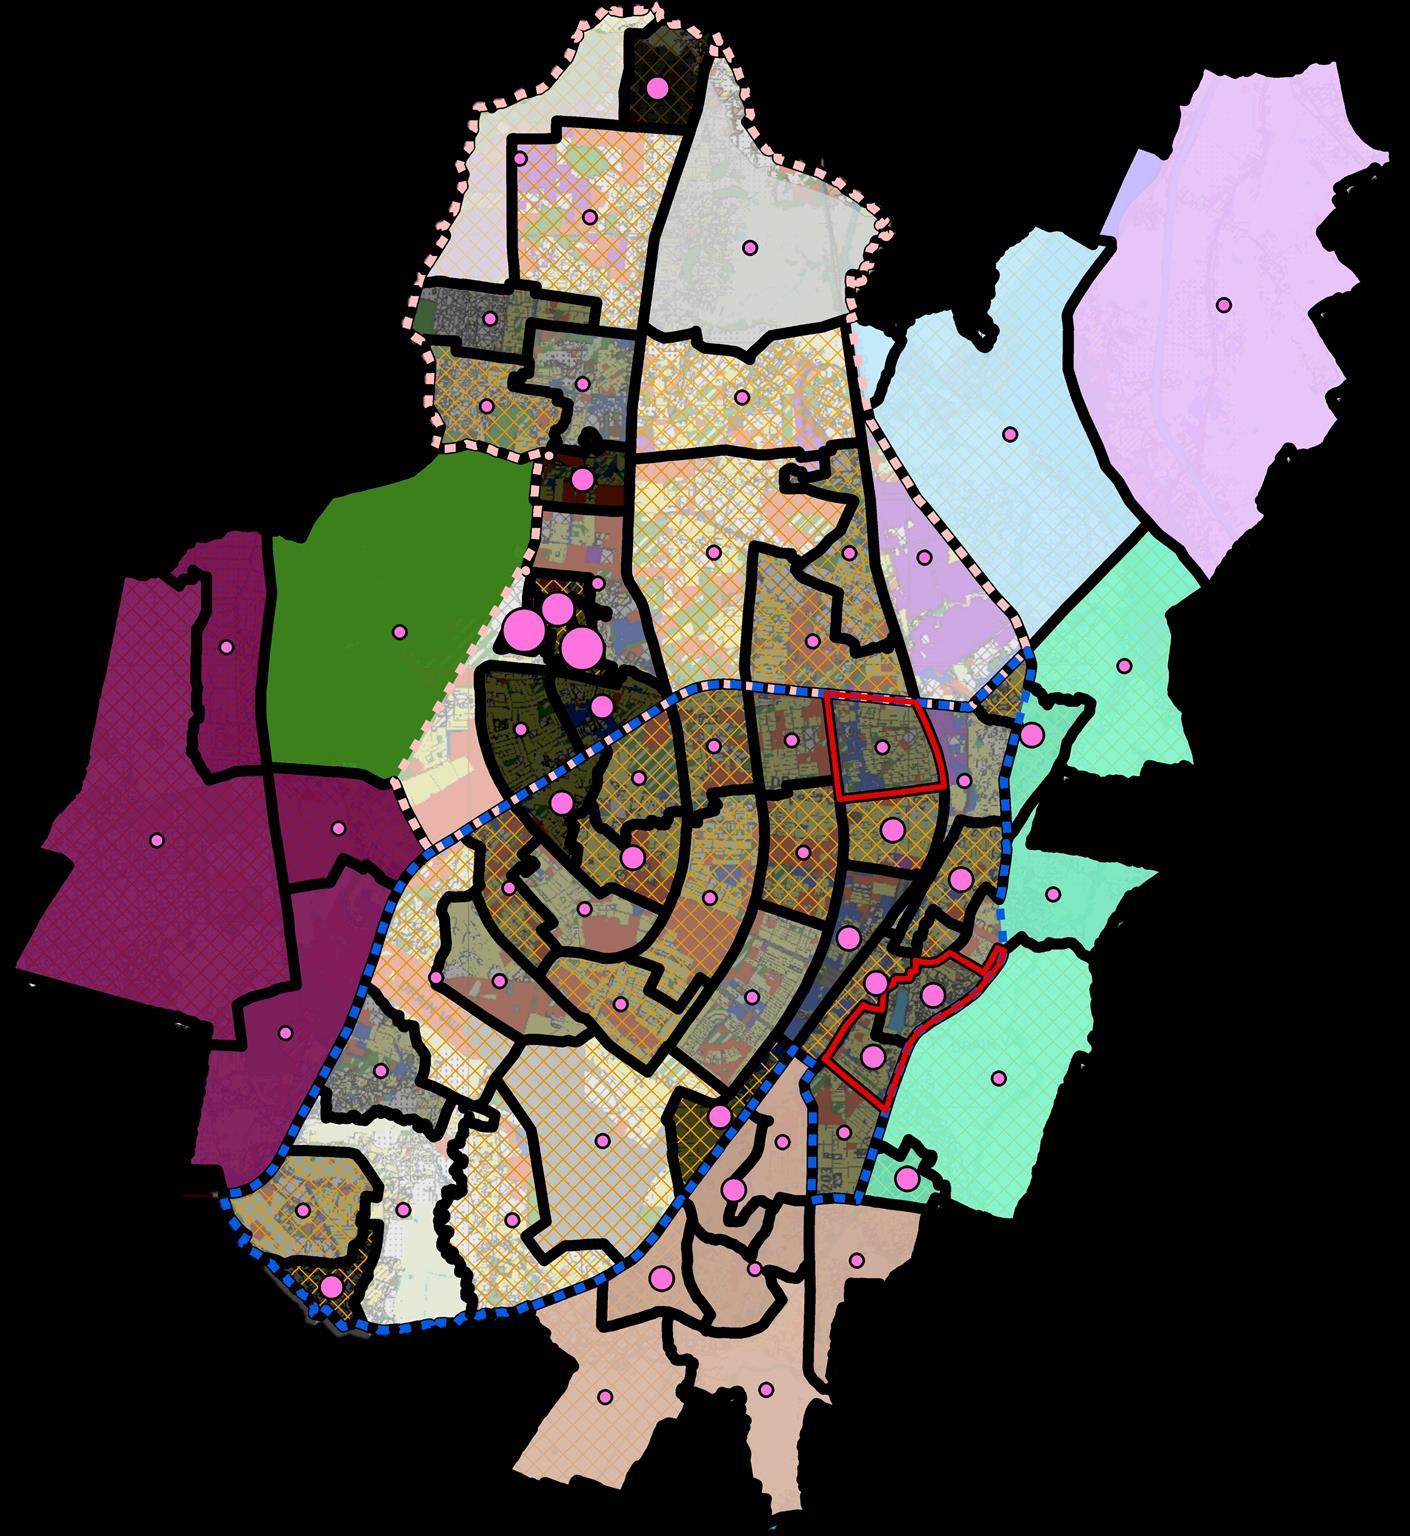
<5000 5000-10000 10000-15000 >15000 200-800 801-1900 1901-3000 3001-7000 7001-12000 12001-16000 Density Building Density W23 W15 W24 W49 W65 W64 W62 W23 W23 W66 W12 W3 W4 W18 W 19 W5 W10 W17 W30 W58 W56 W55 W53 W34 W29 W28 W28 W33 W43 W45 W37 W39 W51 W50 W63 W25 W27 W17 W6 W2 W1 W7 W8 W14 W16 W9 W9 W57 W20 W26 W21 W23 W15 W24 W49 W65 W64 W62 W23 W23 W66 W12 W3 W4 W18 W 19 W5 W10 W17 W30 W58 W56 W55 W53 W34 W29 W28 W28 W33 W43 W45 W37 W39 W51 W50 W63 W25 W27 W17 W6 W2 W1 W7 W8 W14 W16 W9 W9 W57 W20 W26 W21 W23 W15 W24 W49 W65 W64 W62 W23 W23 W66 W12 W3 W4 W18 W 19 W5 W10 W17 W30 W58 W56 W55 W53 W34 W29 W28 W28 W33 W43 W45 W37 W39 W51 W50 W63 W25 W27 W17 W6 W2 W1 W7 W8 W14 W16 W9 W9 W57 W20 W26 W21 North Zone South West Zone South East Zone
Dense Vegetation
▪ Built-up density is higher in Wards W20, W26, W21, W34 and W48. Dense Vegetation Water Body
PLANNING THESIS
DEPARTMENT OF PLANNING
BY PRITI CHHATOI 1920106033
SHEET NO: 05
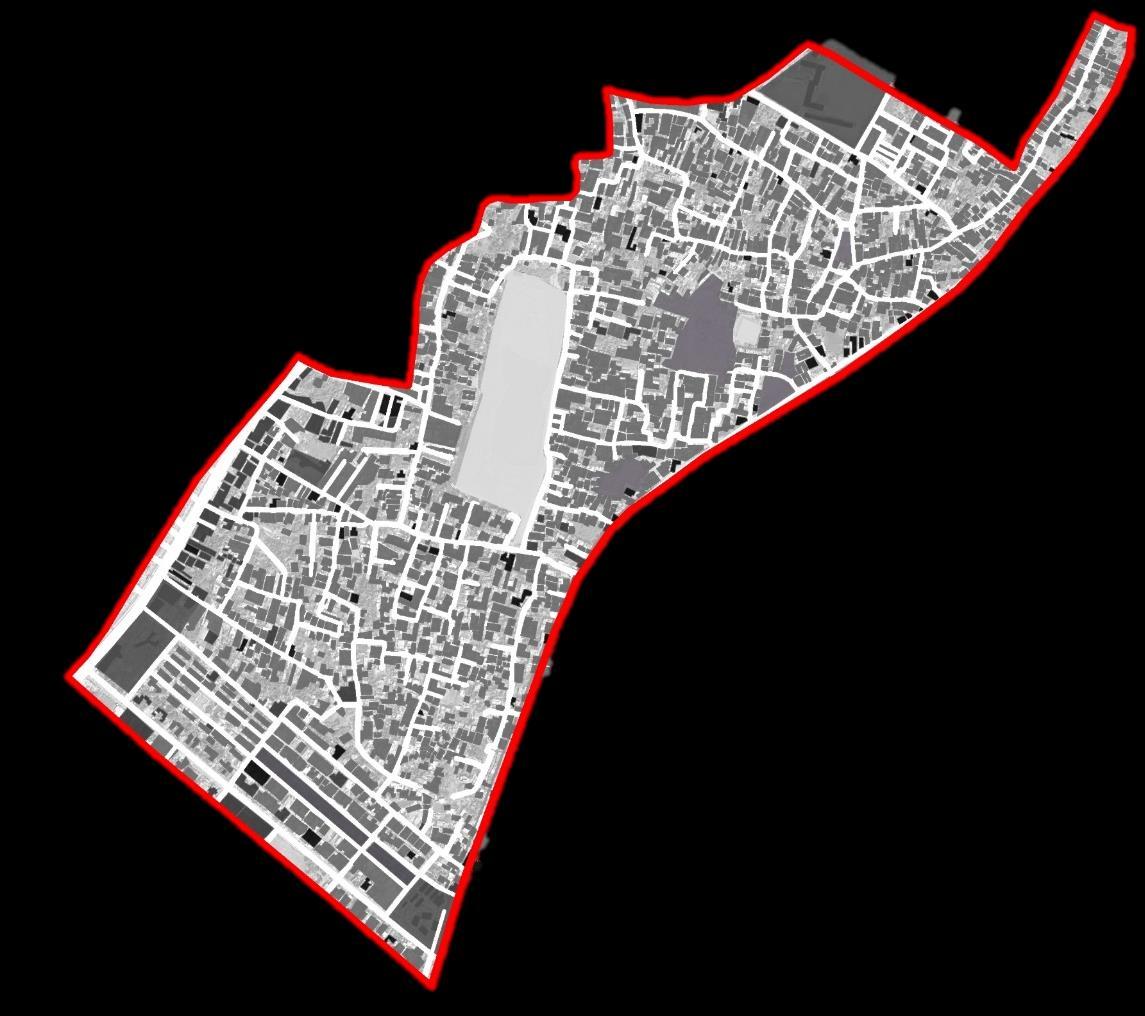
Population Density: Number of inhabitants at the neighborhood on the total area. Dwelling Footprint: represents the spatial area occupied by the dwelling units in the urban fabric.


Housing Typology: Includes Slums, plotted residential, government quarters/ apartments, flats, unplanned residential growth
Connectivity: Accessibility to different amenities & public spaces.
Planning Zones
Chandrasekharpur
Bhubaneswar New Town Old Bhubaneswar
Aigania
East Kuakhai Sribantapur Sisupal Bharatpur
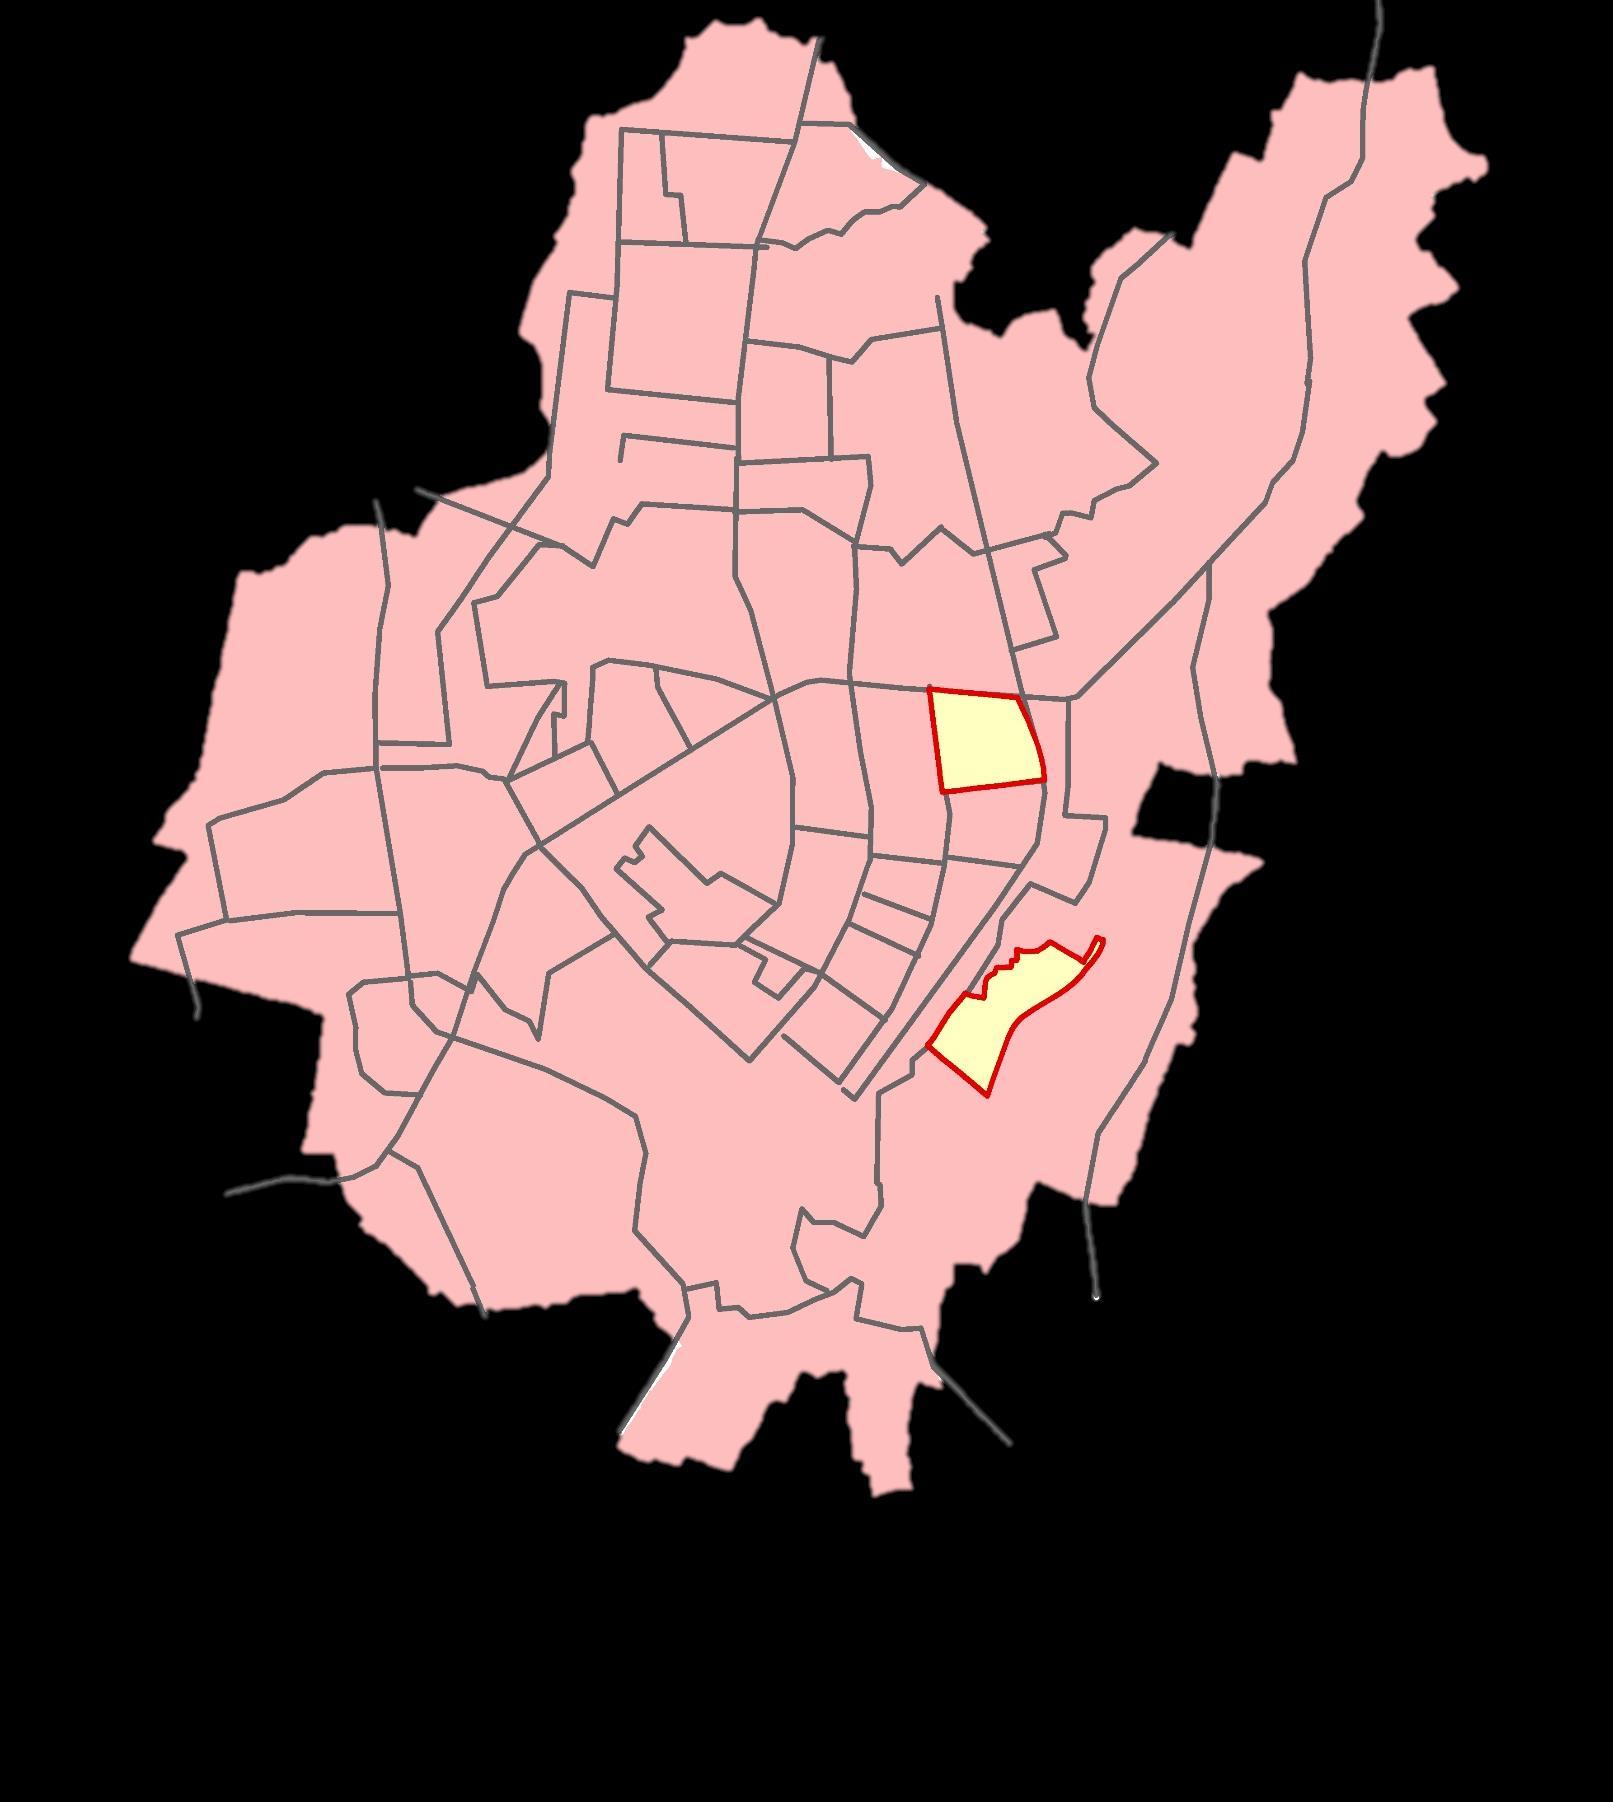
For selecting the neighbourhood the population should be between 5000 15000. The study area that is to be selected should be between km
Wards that satisfies the area criteria are: W , W25, W27, W63, W51 W , W47, W30, W31, W56, W41, W29 W13, W , W45 W43 W38

Landuse: Various different use of land determines the physical environment. Mixed Landuse forms an important aspect
Planning Zones of BMC Area: Bhubaneswar Municipal Area is divided into 6 planning zones where in the New Town Area and Chandrashekarpur zone the residential landuse percentage is higher when compared to other zones

DEPARTMENT OF PLANNING


Odisha University of Technology and Research, Ghatikia, Bhubaneswar
• Medium population density.
• Dominant landuse at the neighbourhood level needs to be residential. Depending upon the landuse distribution and housing
two
identified for analysis in the study
NO: 06
SITE SELECTION
PLANNING THESIS
SITE SELECTION SUBMITTED BY PRITI CHHATOI 1920106033 SELECTION CRITERIA
UNDERSTANDING THE ROLE OF URBAN FORM ON ACHIEVING BETTER SOCIAL SUSTAINABILITY: A CASE STUDY OF BHUBANESWAR SHEET
< 3000 3000-6000 6000-9000 > 9000 <5,000 5,000-10,000 10,000-15,000 >15,000 Slums Residential Building Density Population Density Legend Ward Boundary Study Area
W23 W15 W24 W49 W65 W64 W62 W52 W46 W66 W12 W3 W4 W18 W 19 W5 W10 W17 W30 W58 W56 W55 W53 W34 W29 W28 W31 W33 W43 W45 W37 W39 W51 W50 W63 W25 W27 W16 W6 W2 W1 W7 W8 W14 W13 W9 W9 W57 W20 W26 W21 W38
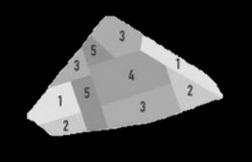
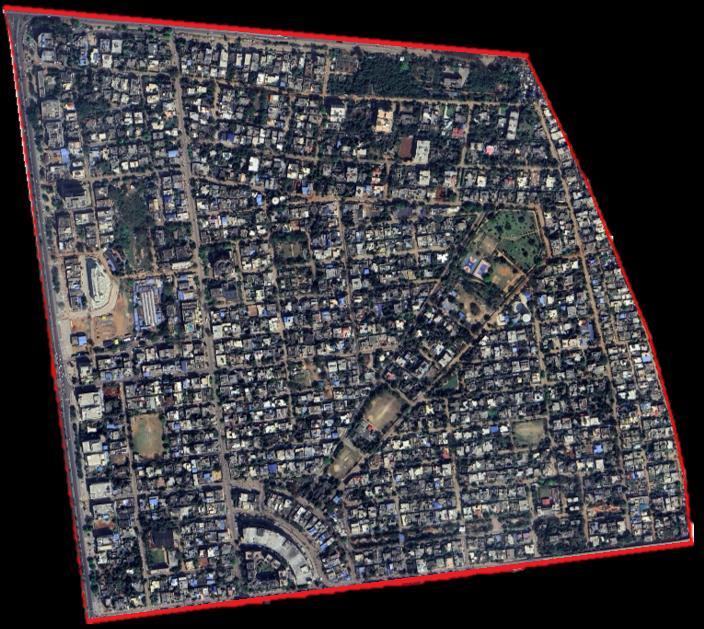
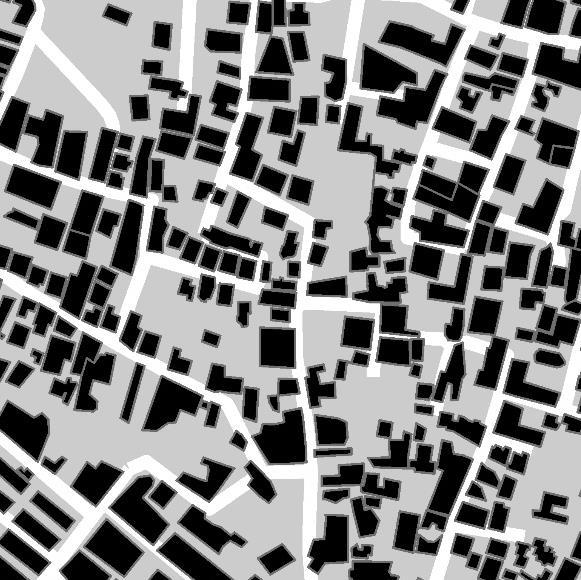
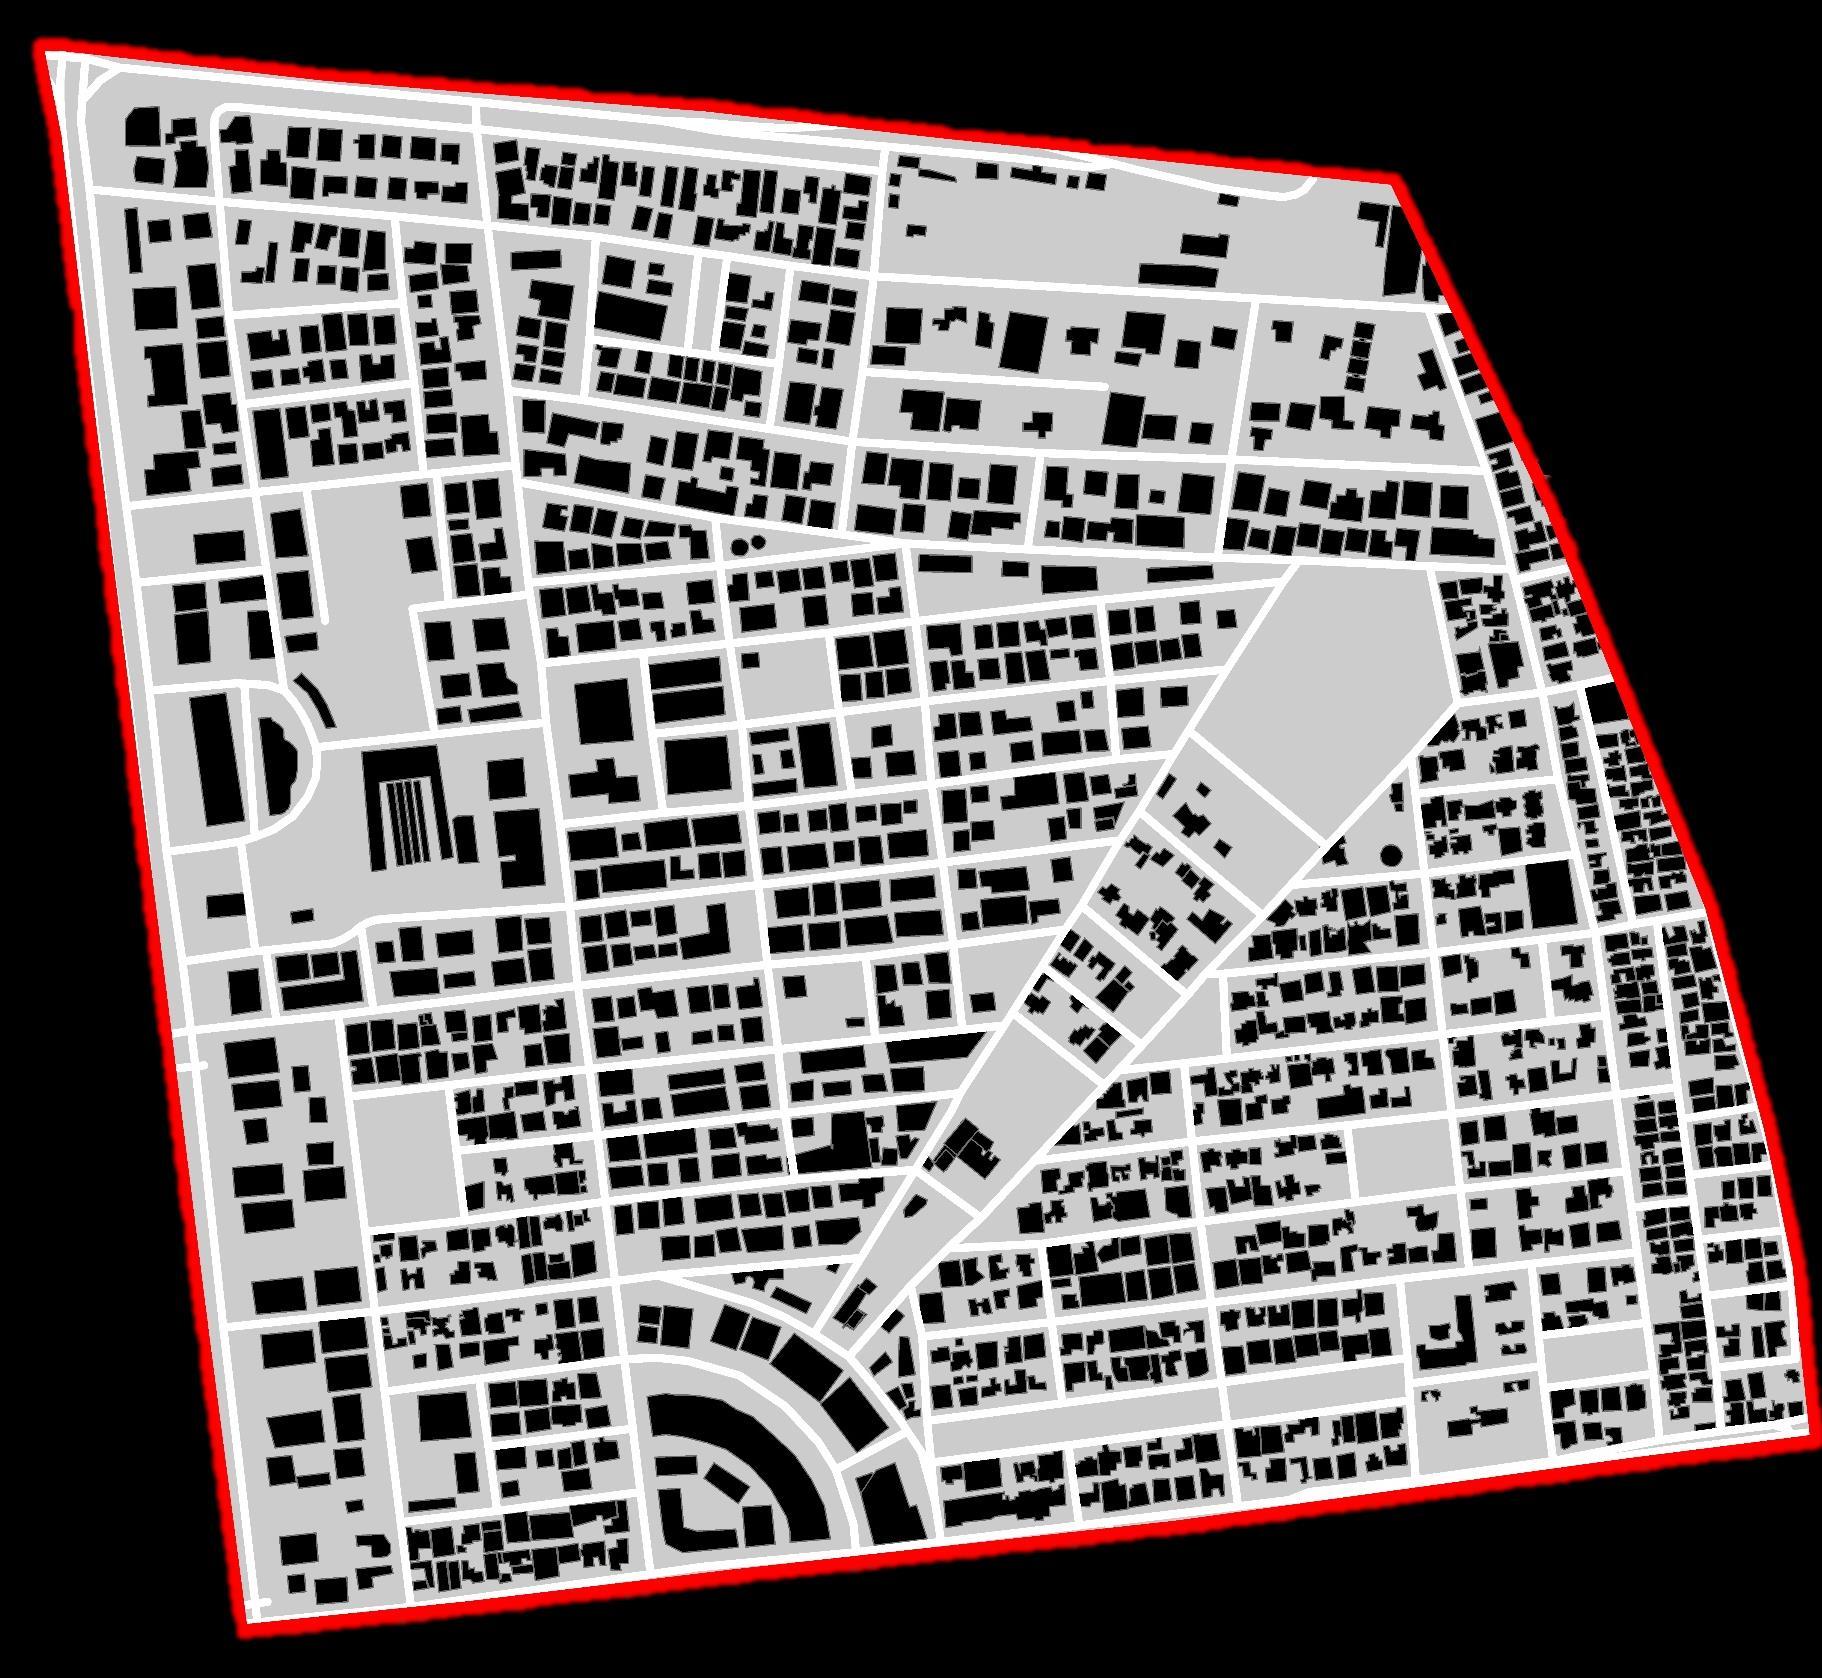
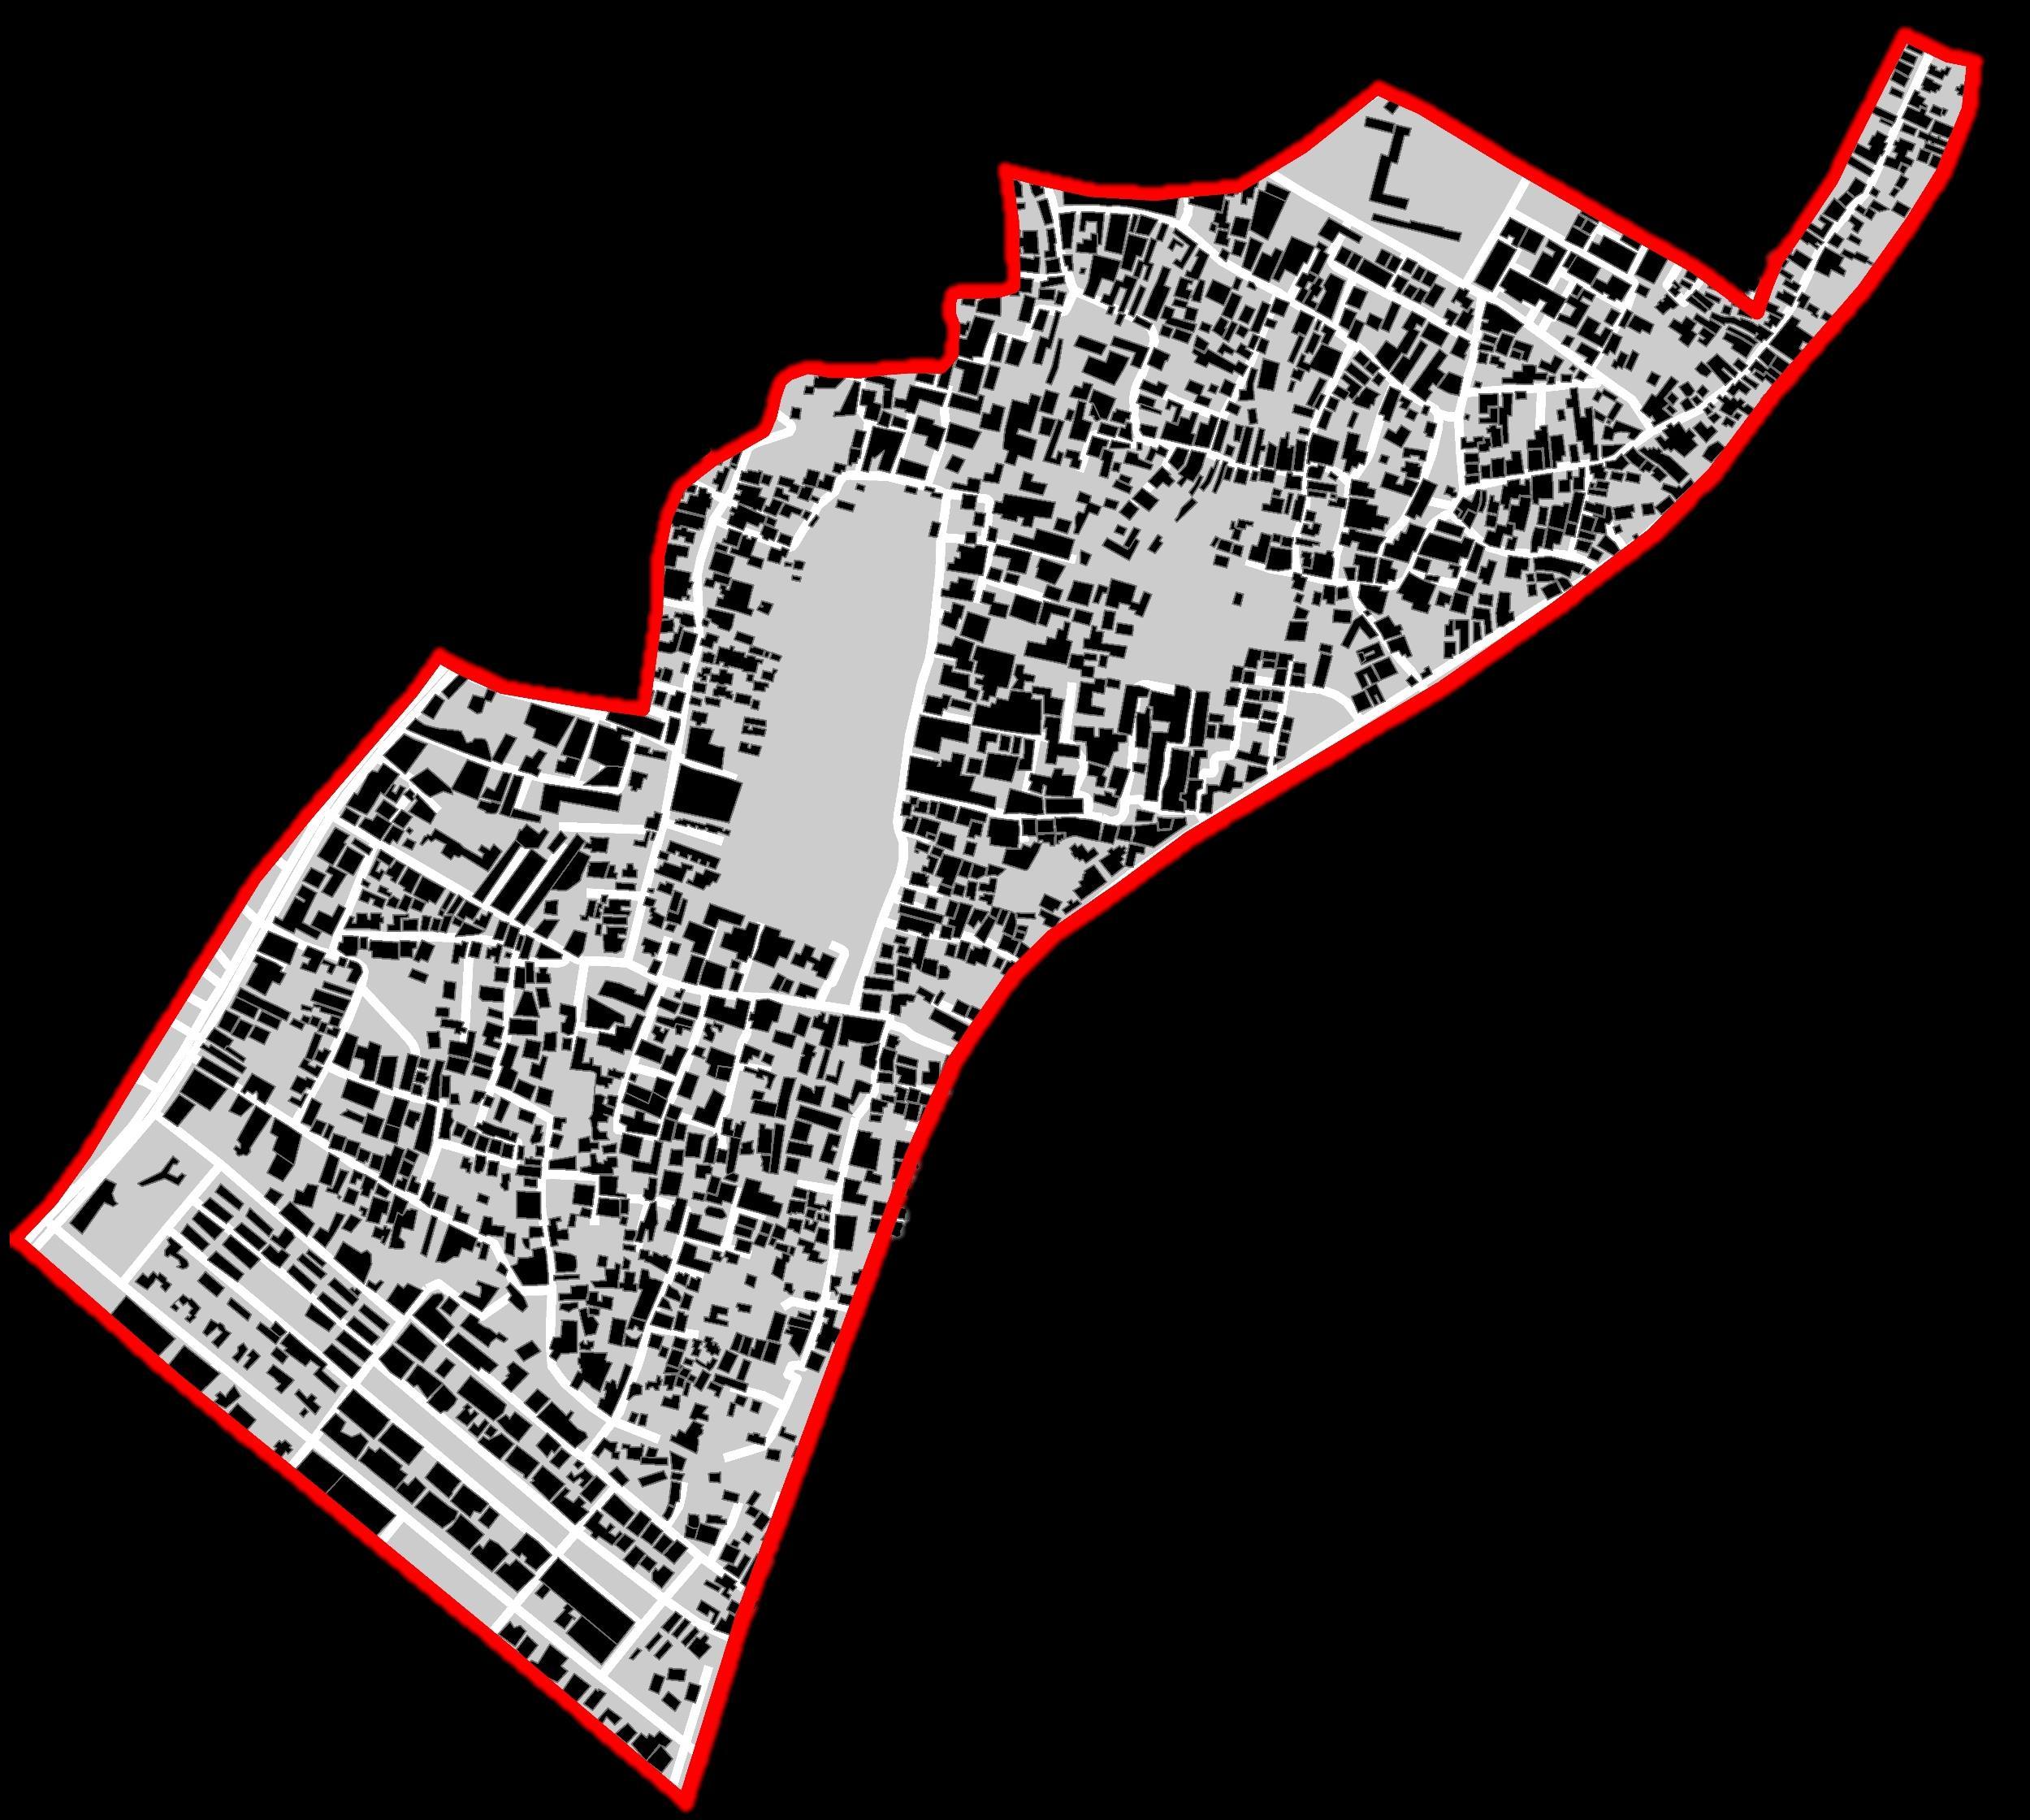
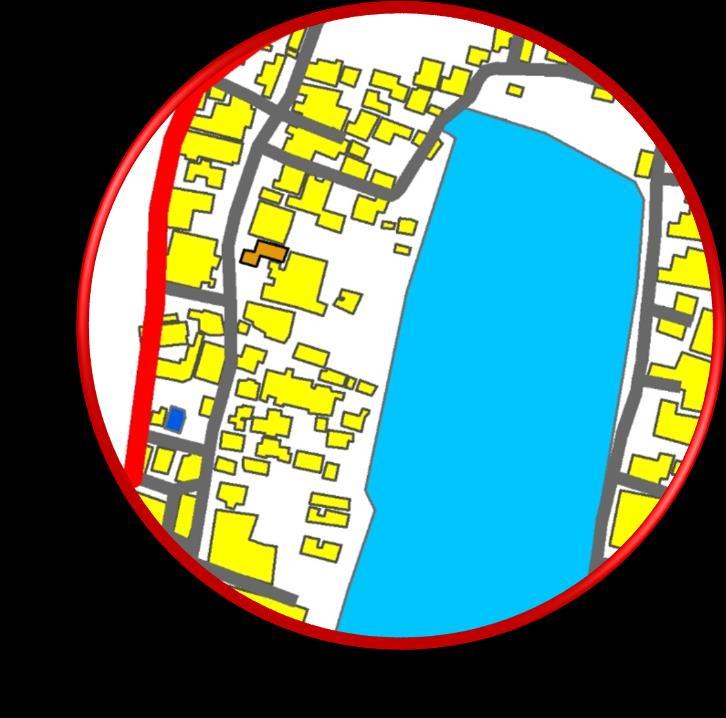
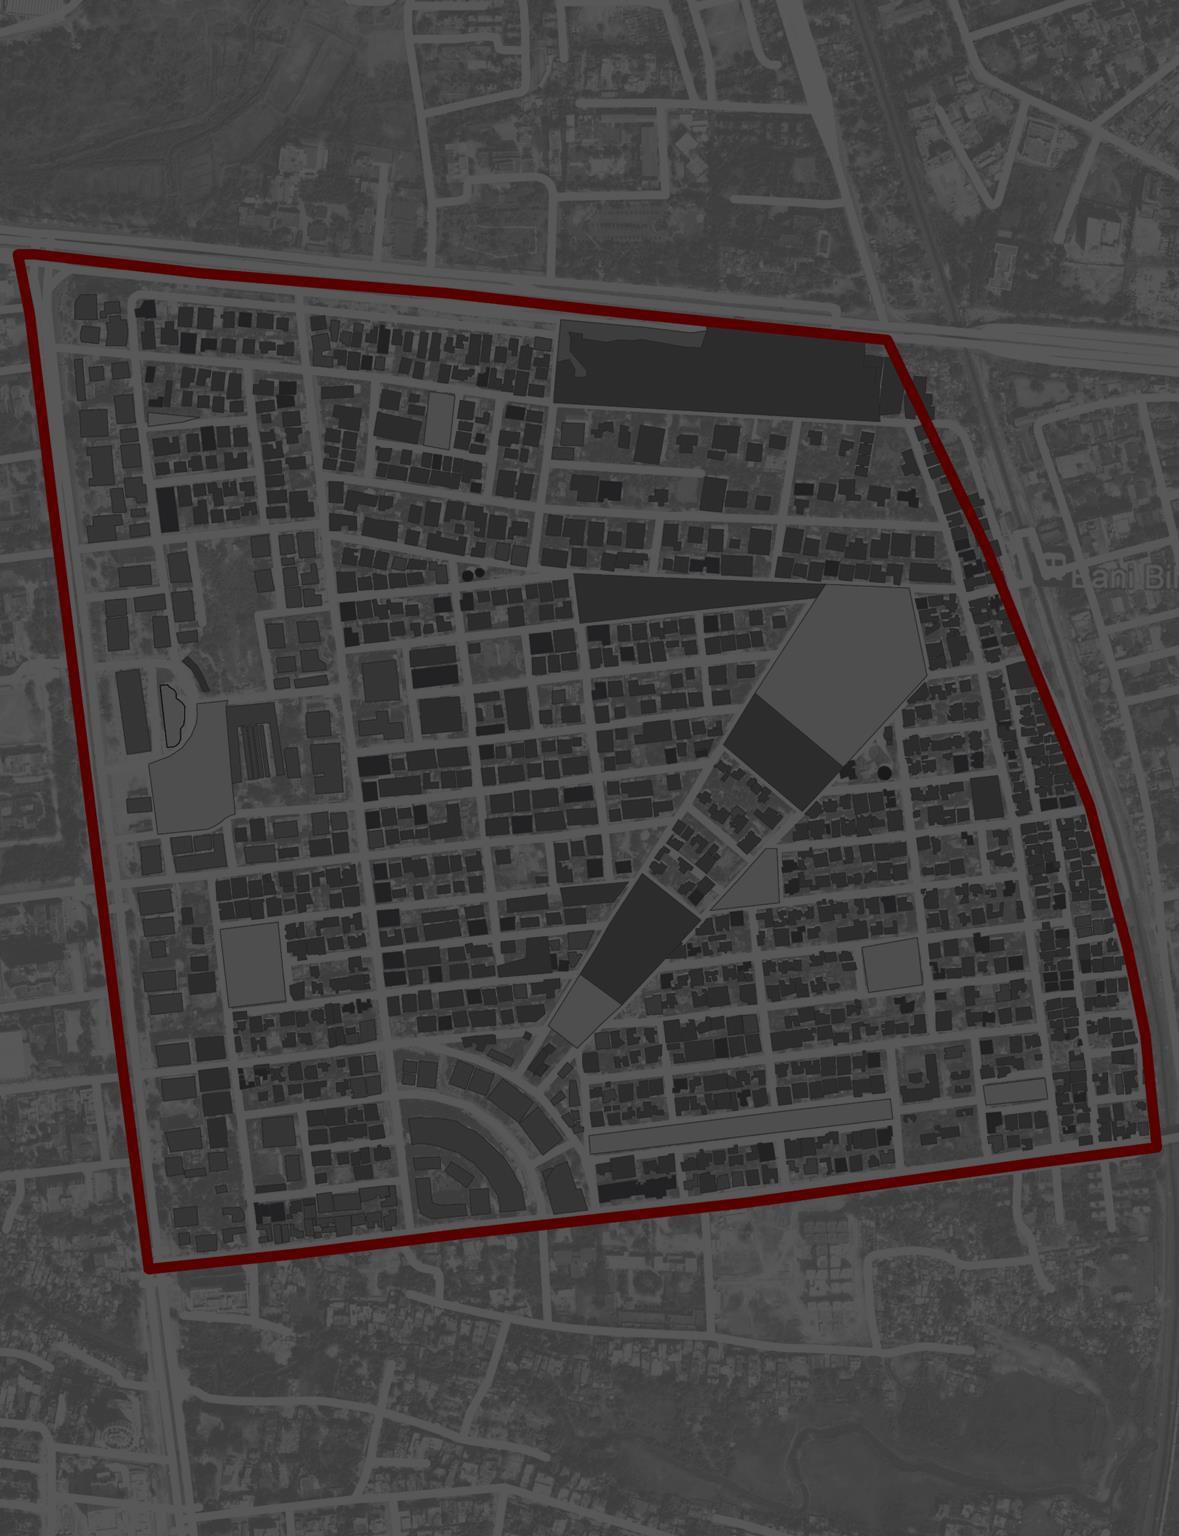
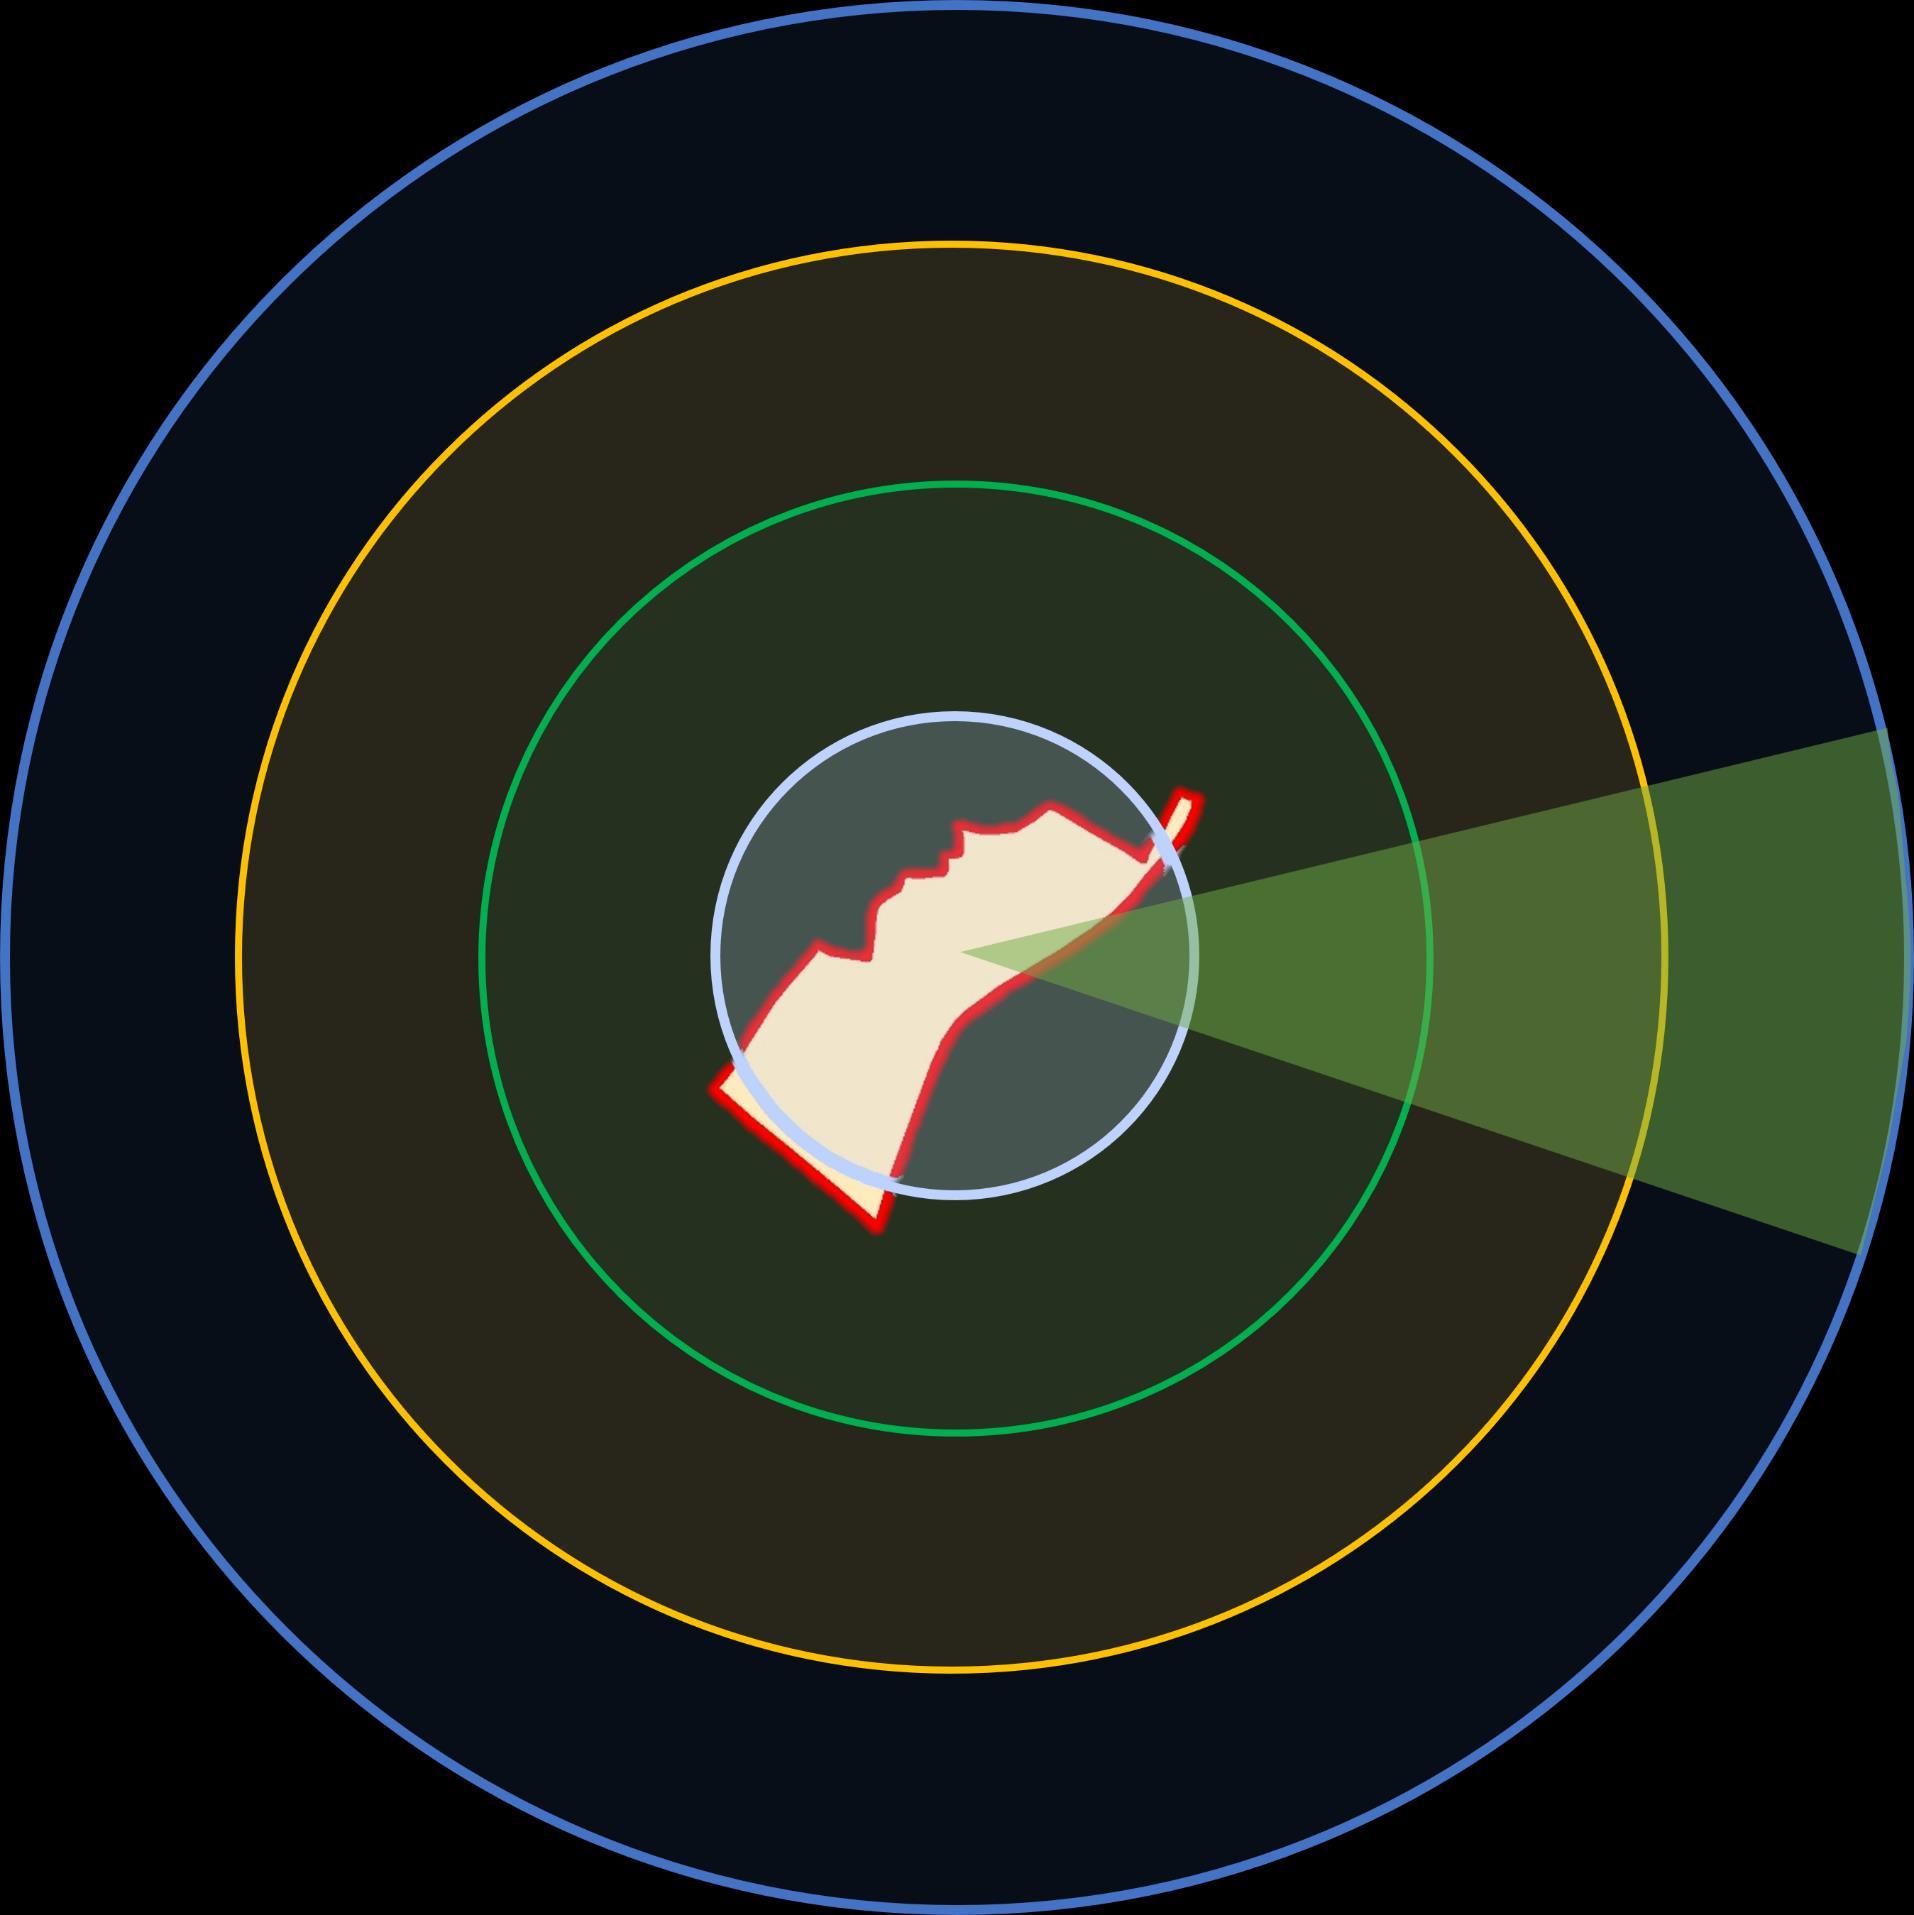
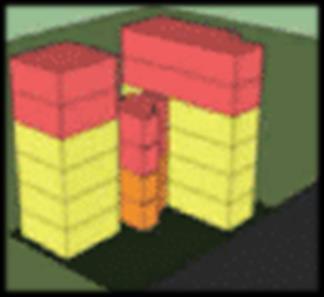
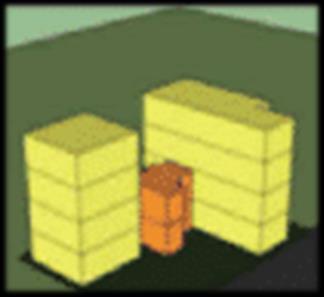
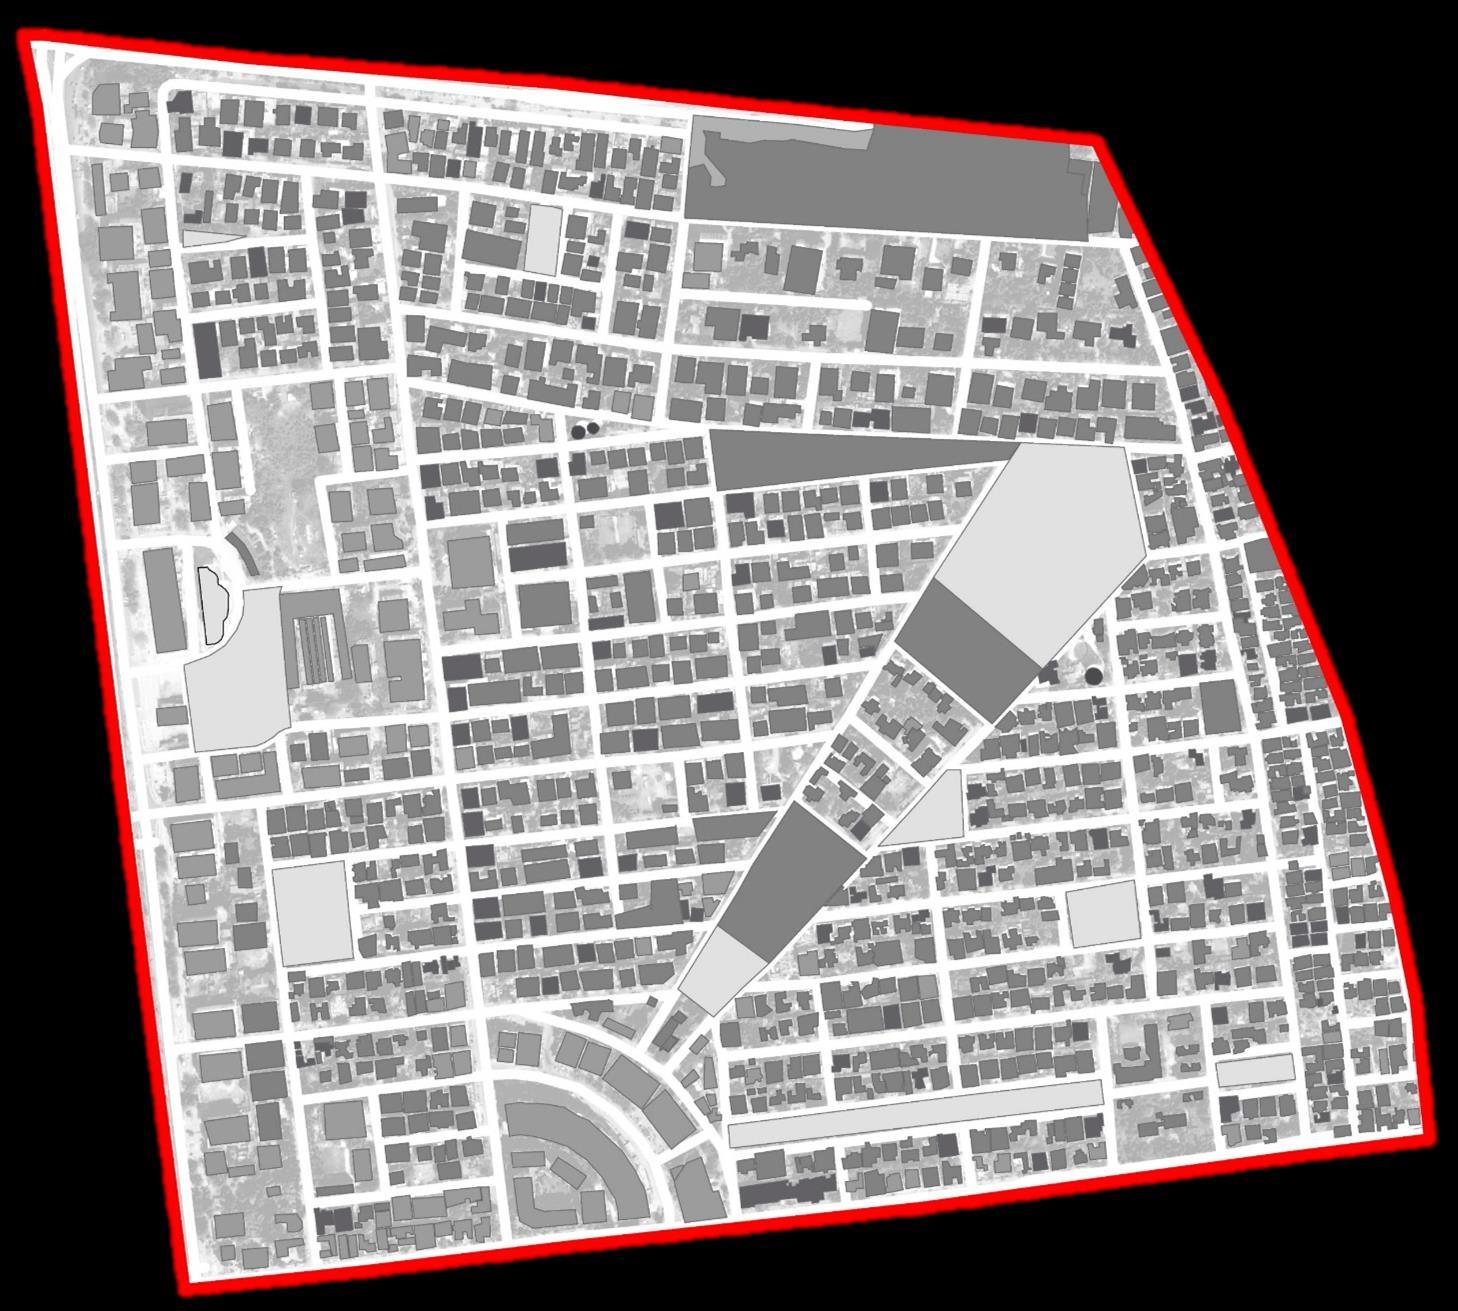
Fig 1.9: Dwelling Footprint (Source: Google Earth)
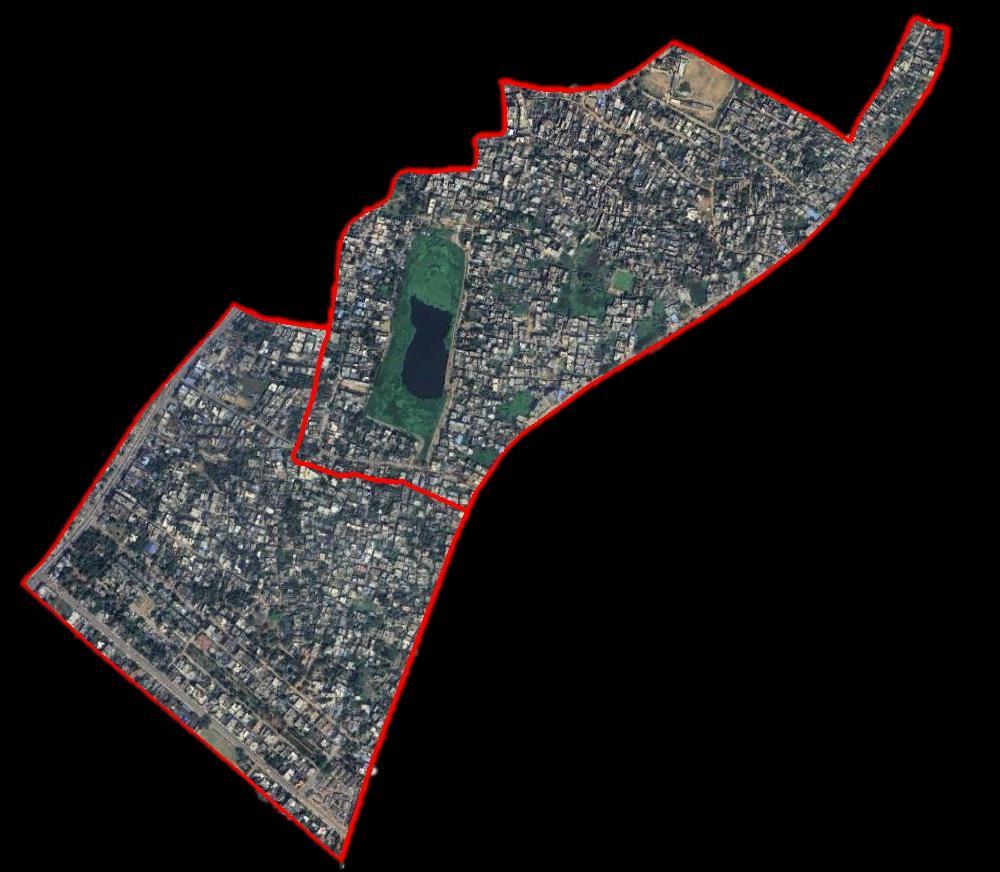
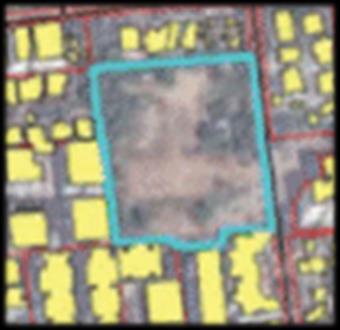
Map 1.10: Identification of Study are by Site Analysis (Source: GIS, Google Earth, CDP 2030)
3 5 1 2 6 4
Fig 1.10: Dwelling Footprint (Source: Google Earth)
typology
areas has
On a increasing scale of level of Satisfaction of different parameters of the aspects of Social Sustainability, the impact of Urban Form is measured in both the selected Study Area
Highly Unsatisfied Unsatisfied Neutral Satisfied Highly Satisfied
Survey Type: Household Survey Sample Technique: Simple Random Sampling Sample
20


✓ Type of Urban Form: In-Organic (Planned)


✓ Nature of Urban Form: Compact Characteristics of the Urban Form of Study Area
✓ Type of Urban Form: Organic (unplanned)
UNDERSTANDING THE ROLE OF URBAN FORM ON ACHIEVING BETTER SOCIAL SUSTAINABILITY: A CASE STUDY OF BHUBANESWAR SHEET NO: 07
2 1 51% 17% 6% 11% 6% 9%
THESIS
OF
of Technology and
Bhubaneswar
PLANNING
DEPARTMENT
PLANNING Odisha University
Research, Ghatikia,
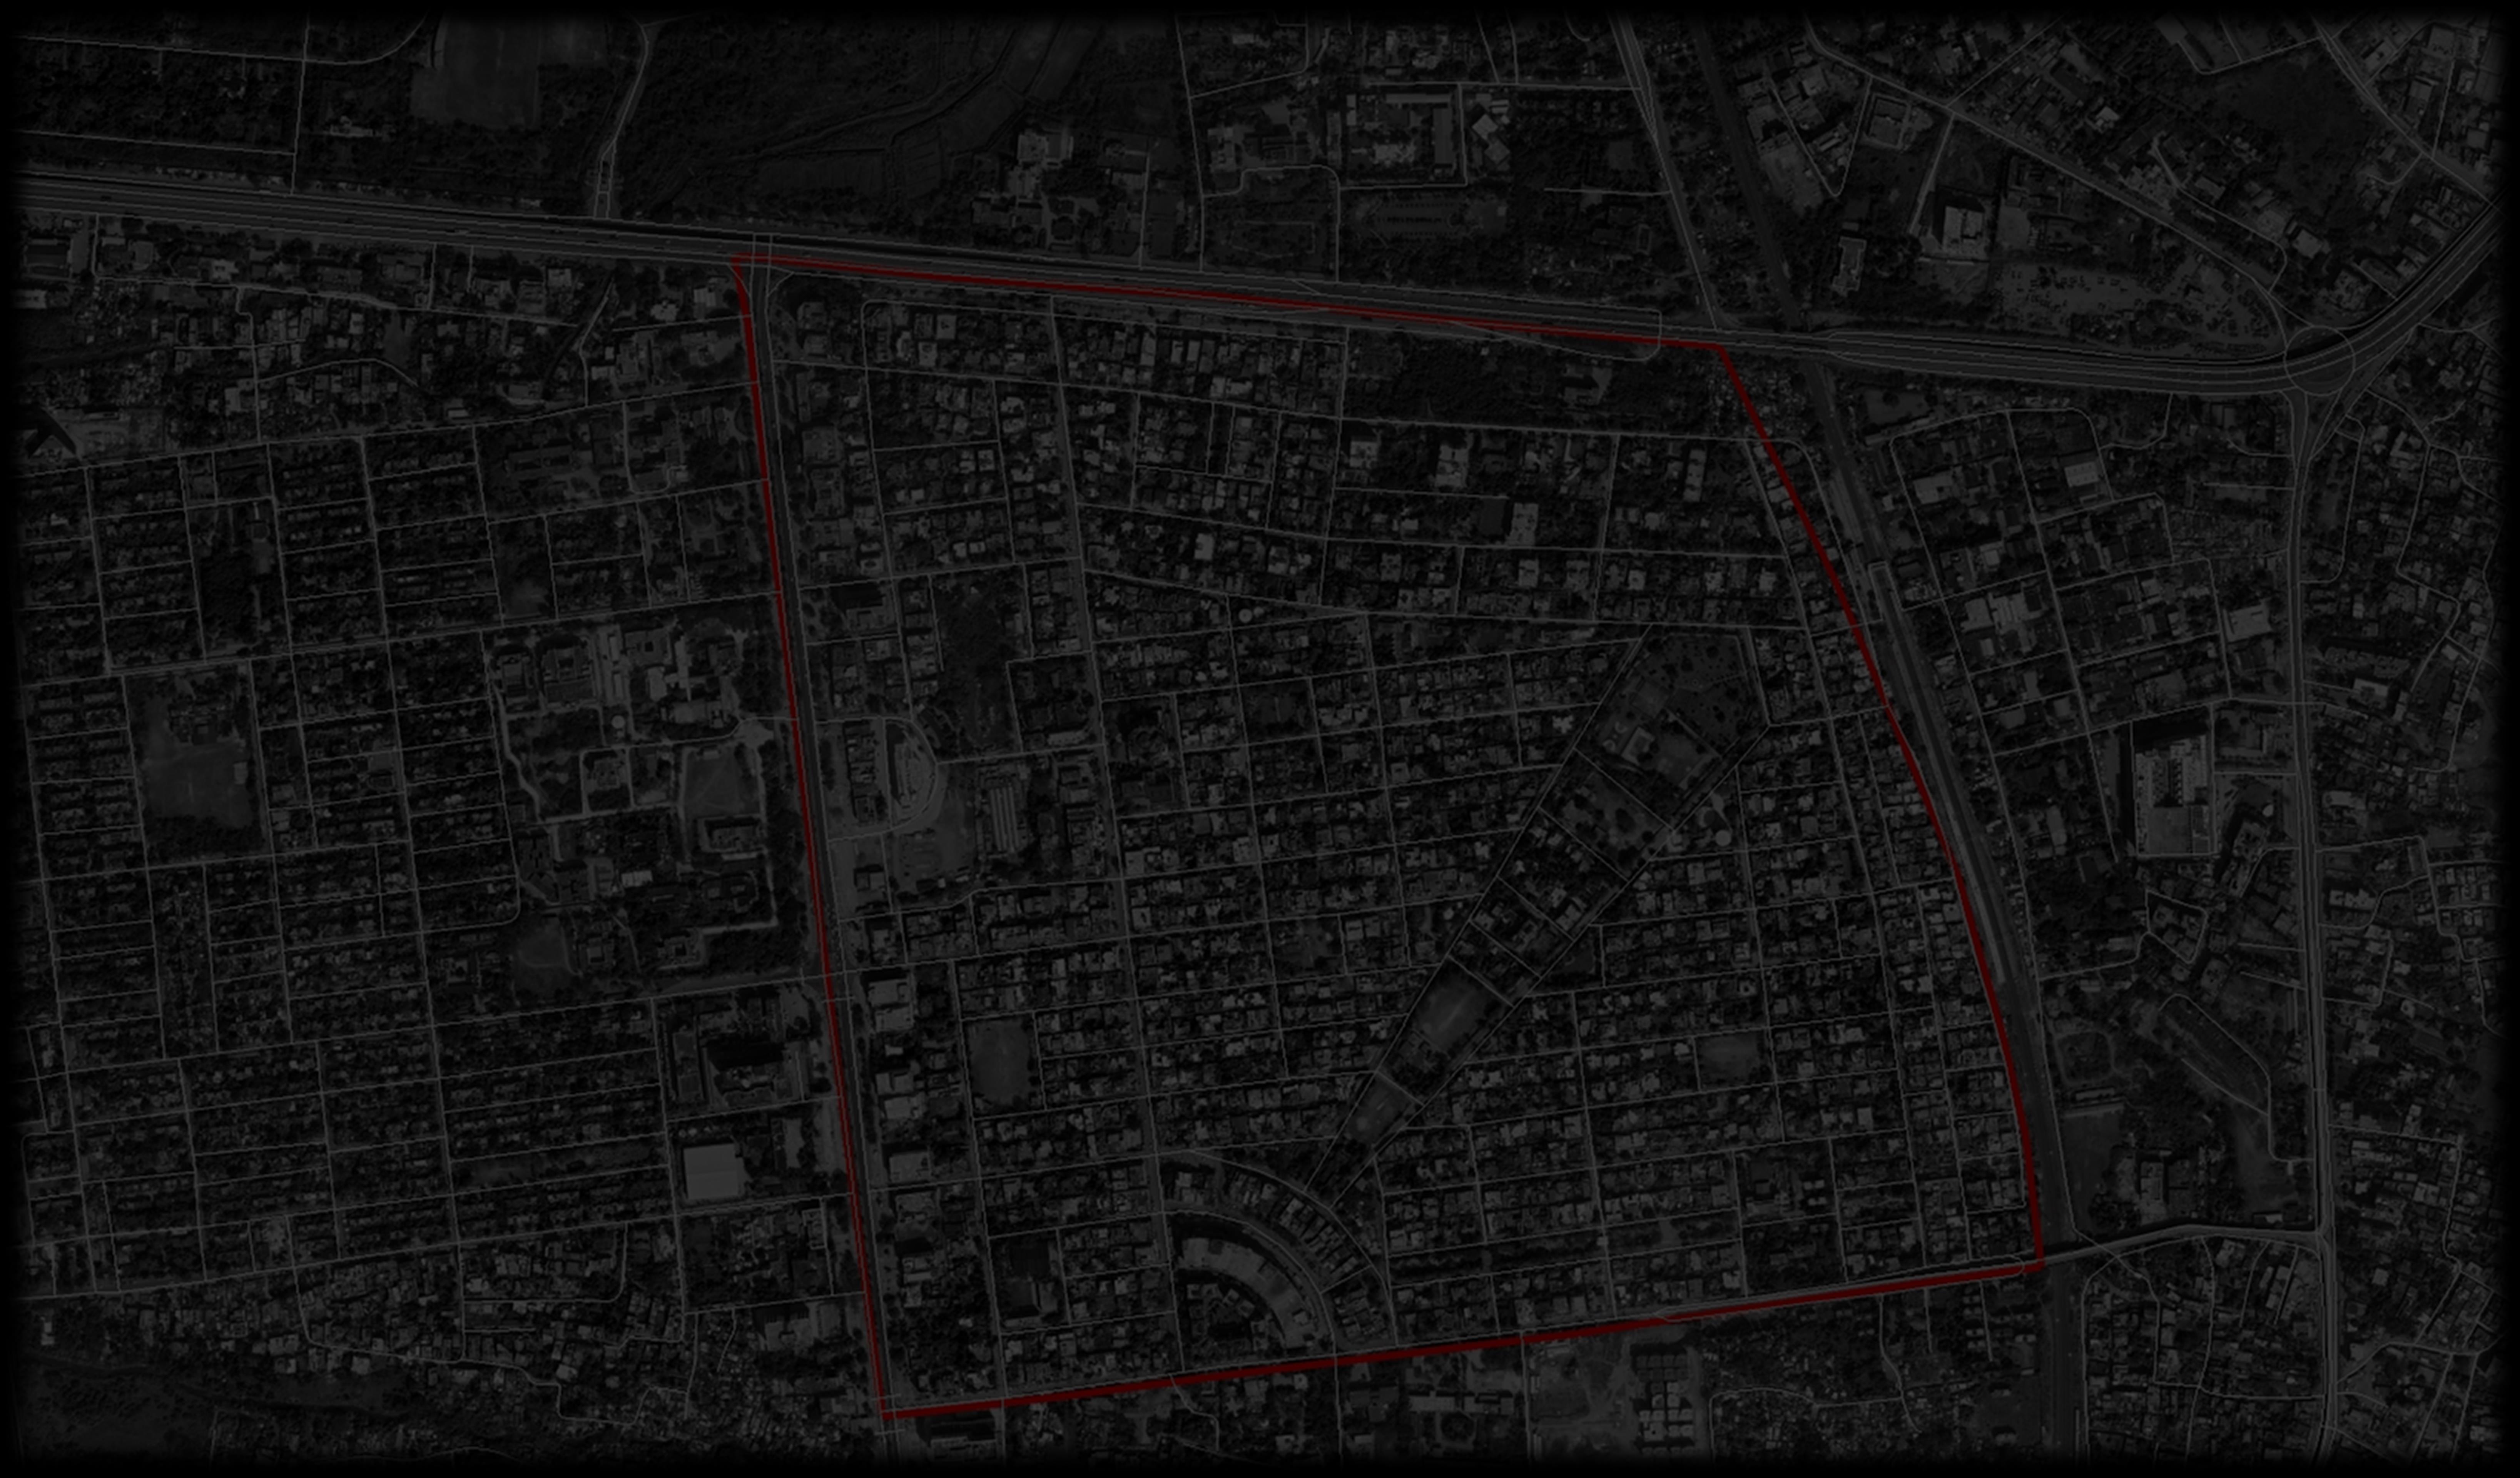
DATA COLLECTION & ANALYSIS SUBMITTED BY PRITI CHHATOI 1920106033 BMC AOI Major Roads Legend ASPECTS OF SOCIAL SUSTAINBILITY • Social Integration • Safety • Neighbourhood as a Place to Live Sustainable Communities Parameters 1 Social Equity Parameters • Access to Services • Availability of Open Spaces and Parks • Availability of Transportation Services 2 STUDY AREA PROFILE AND THE URBAN FORM CHARACTERISTICS 1 2 3 4 5
SCORING SCALE & SAMPLING
Characteristics of the Urban Form of Study Area
64% 8% 4% 10.5% 1.5% 5% 4% 3%
Size:
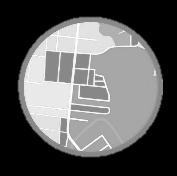
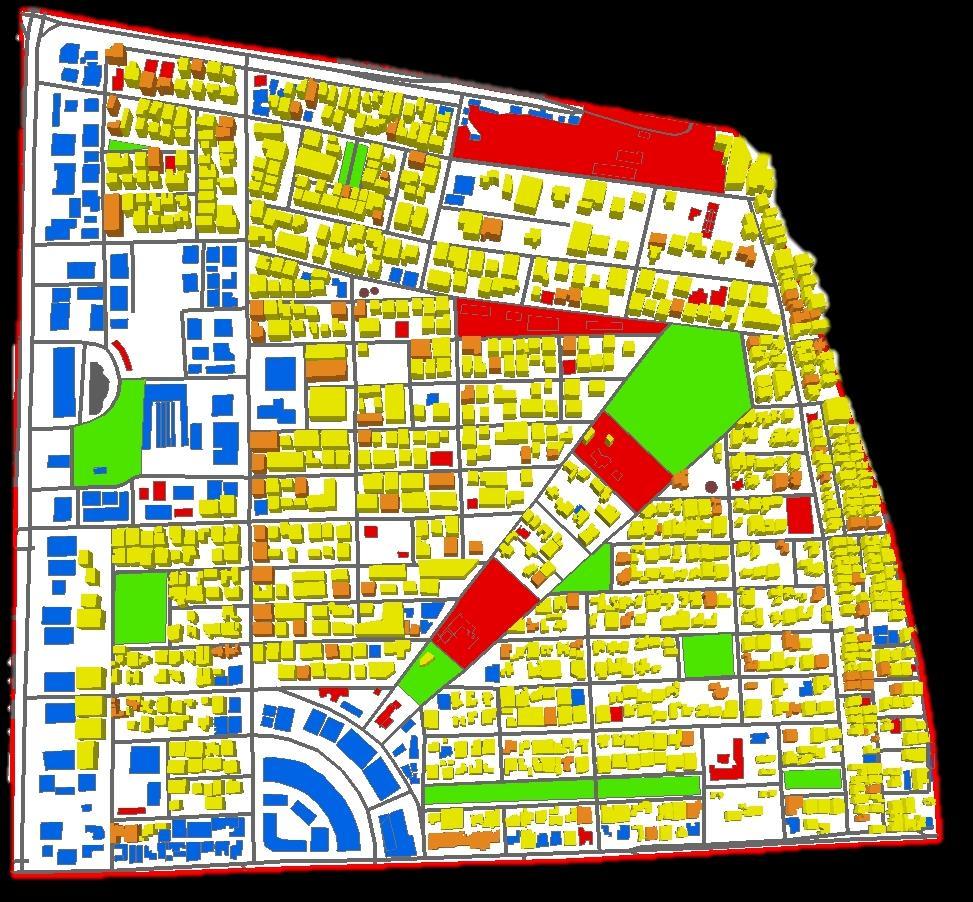
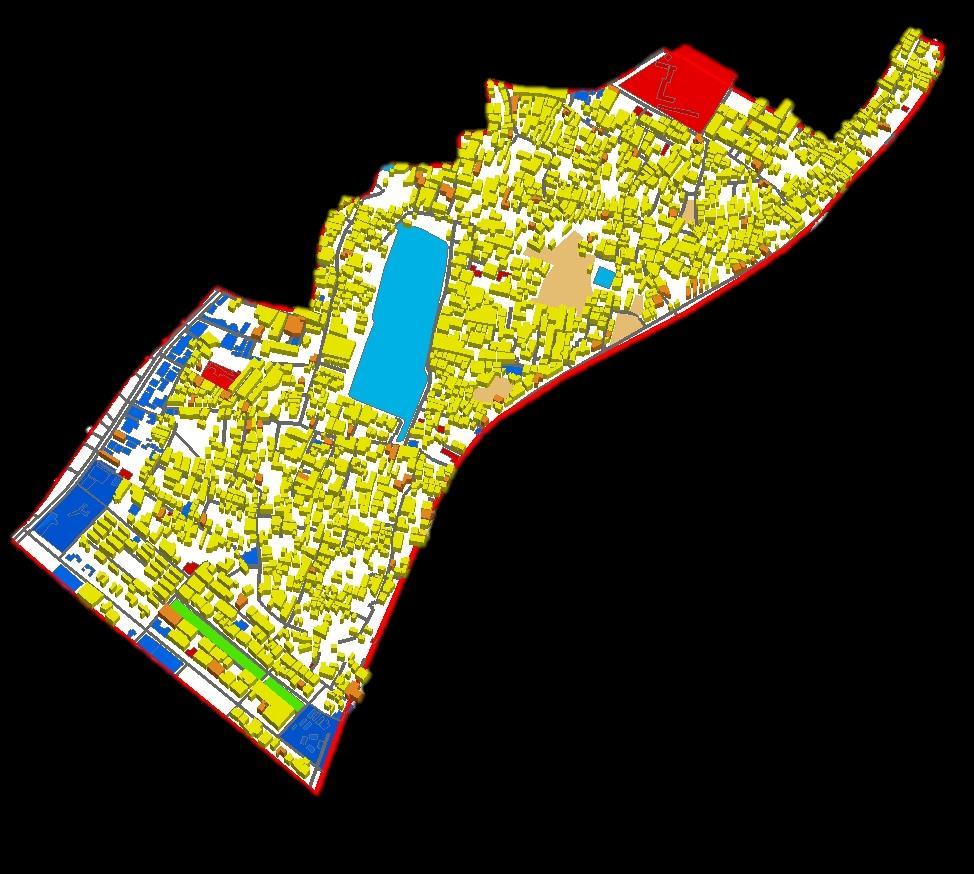
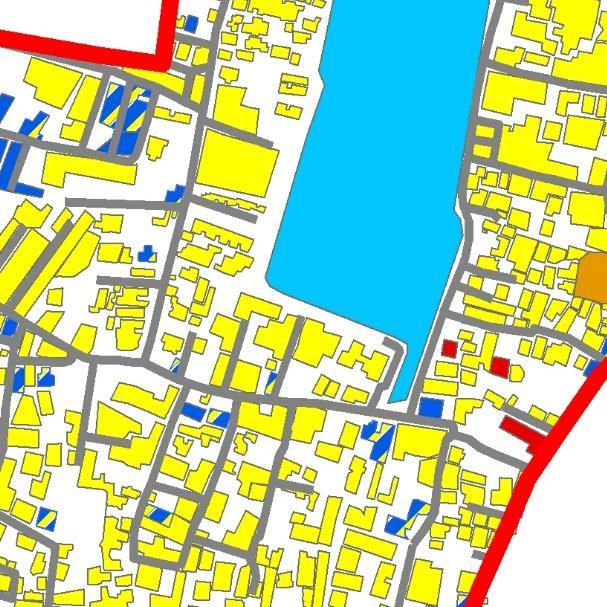
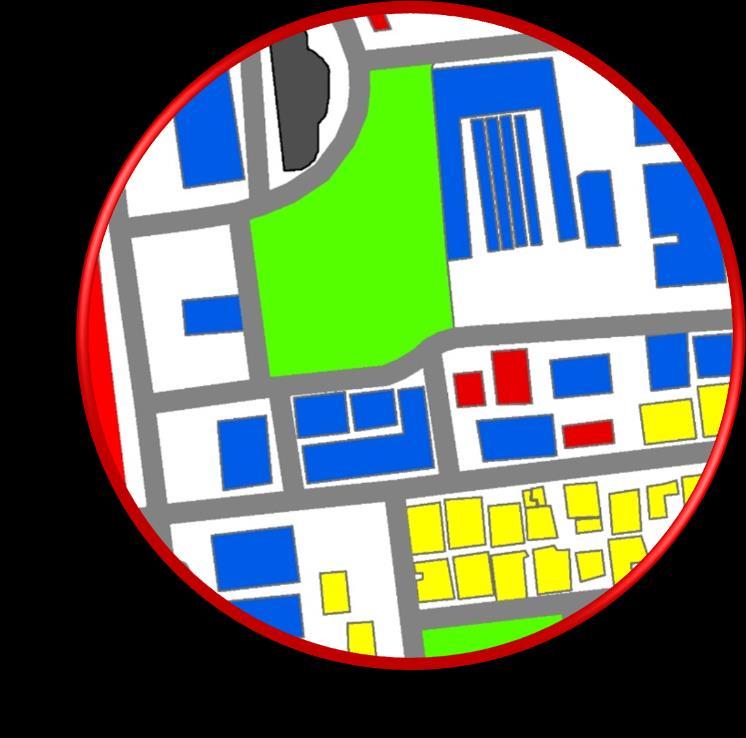
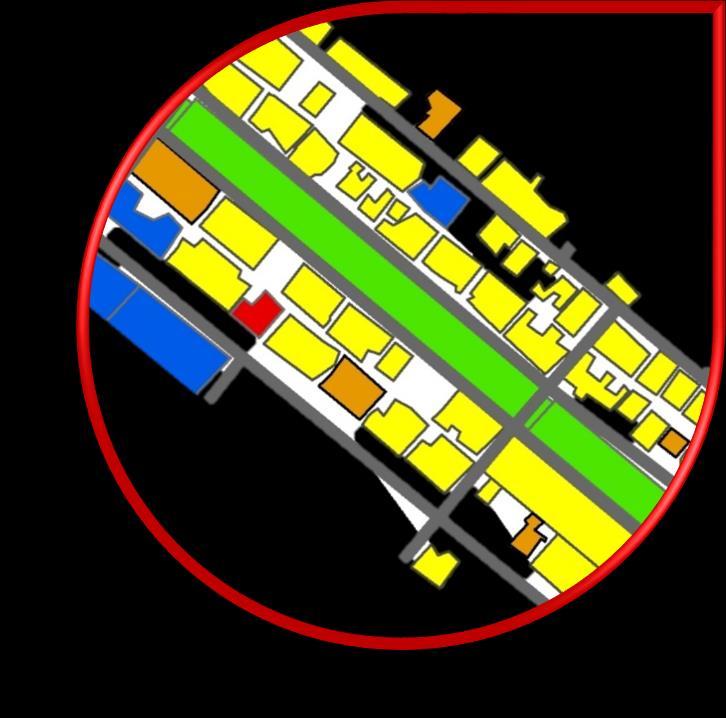
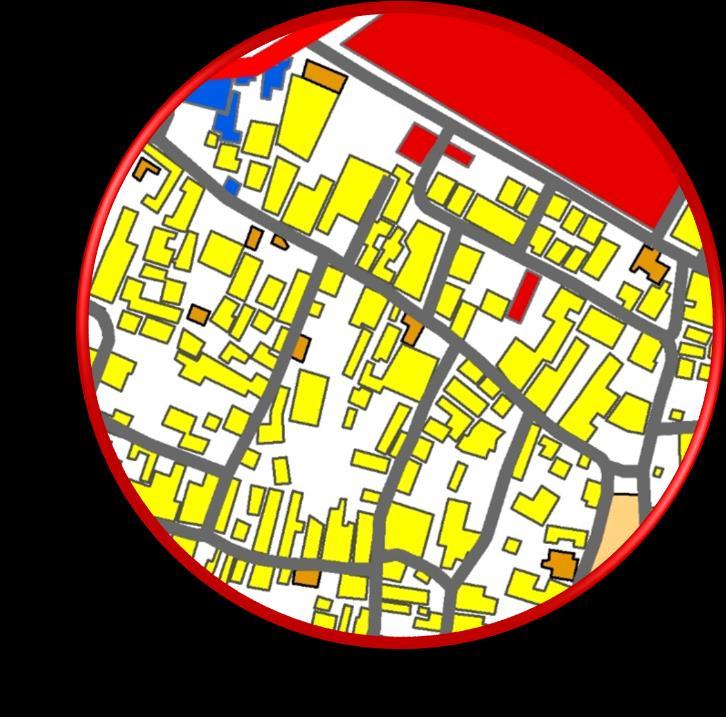
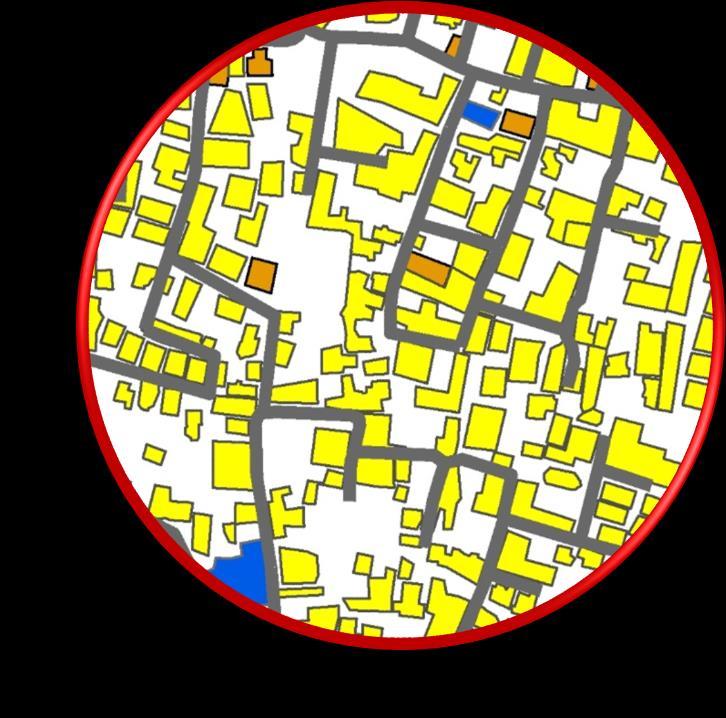
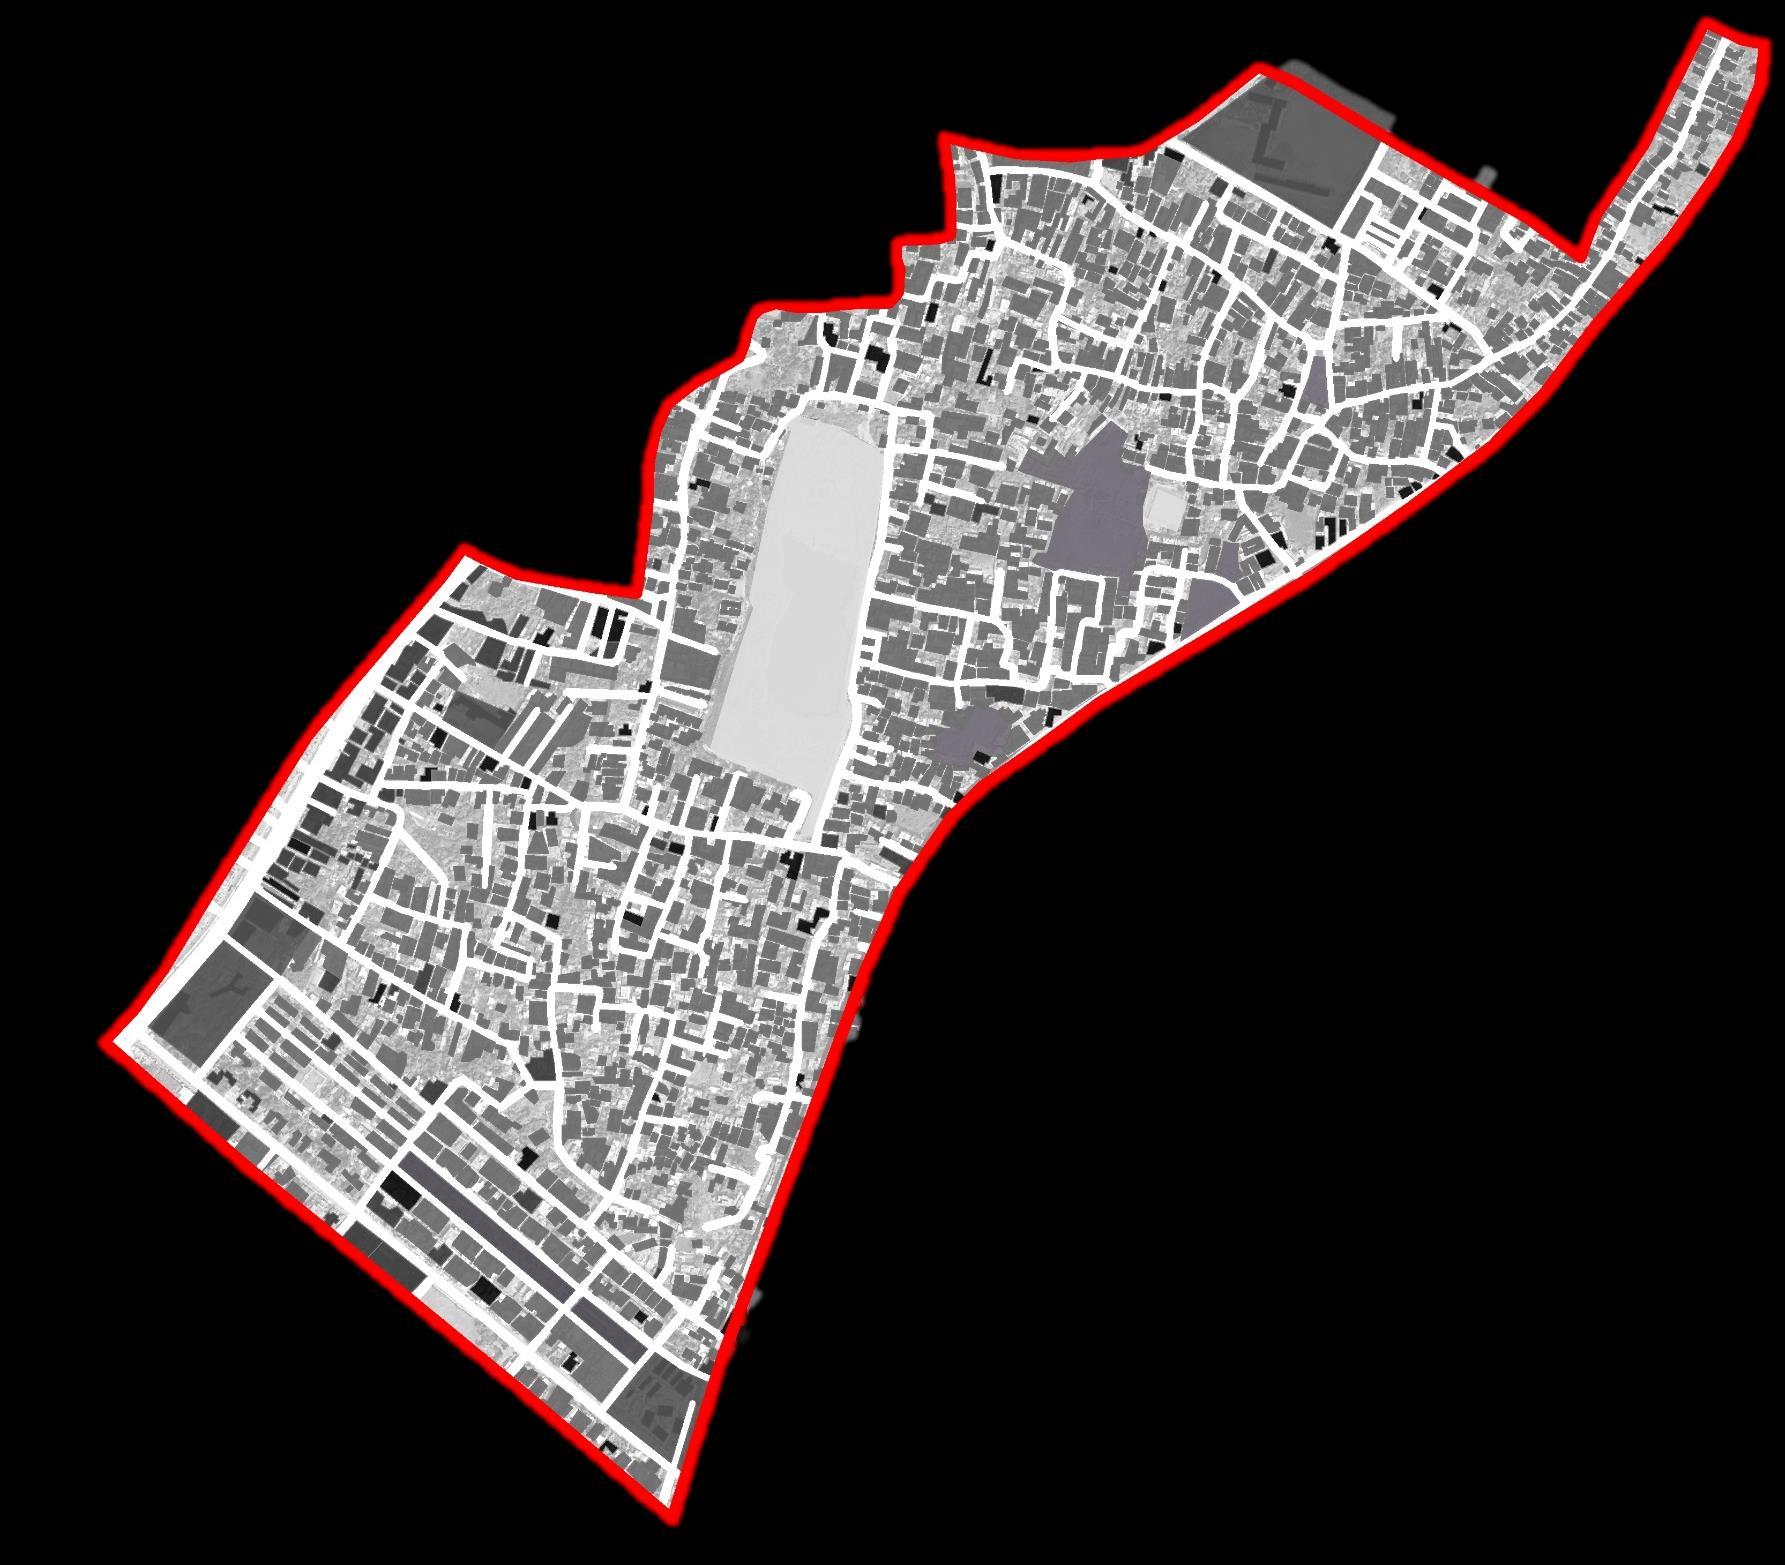
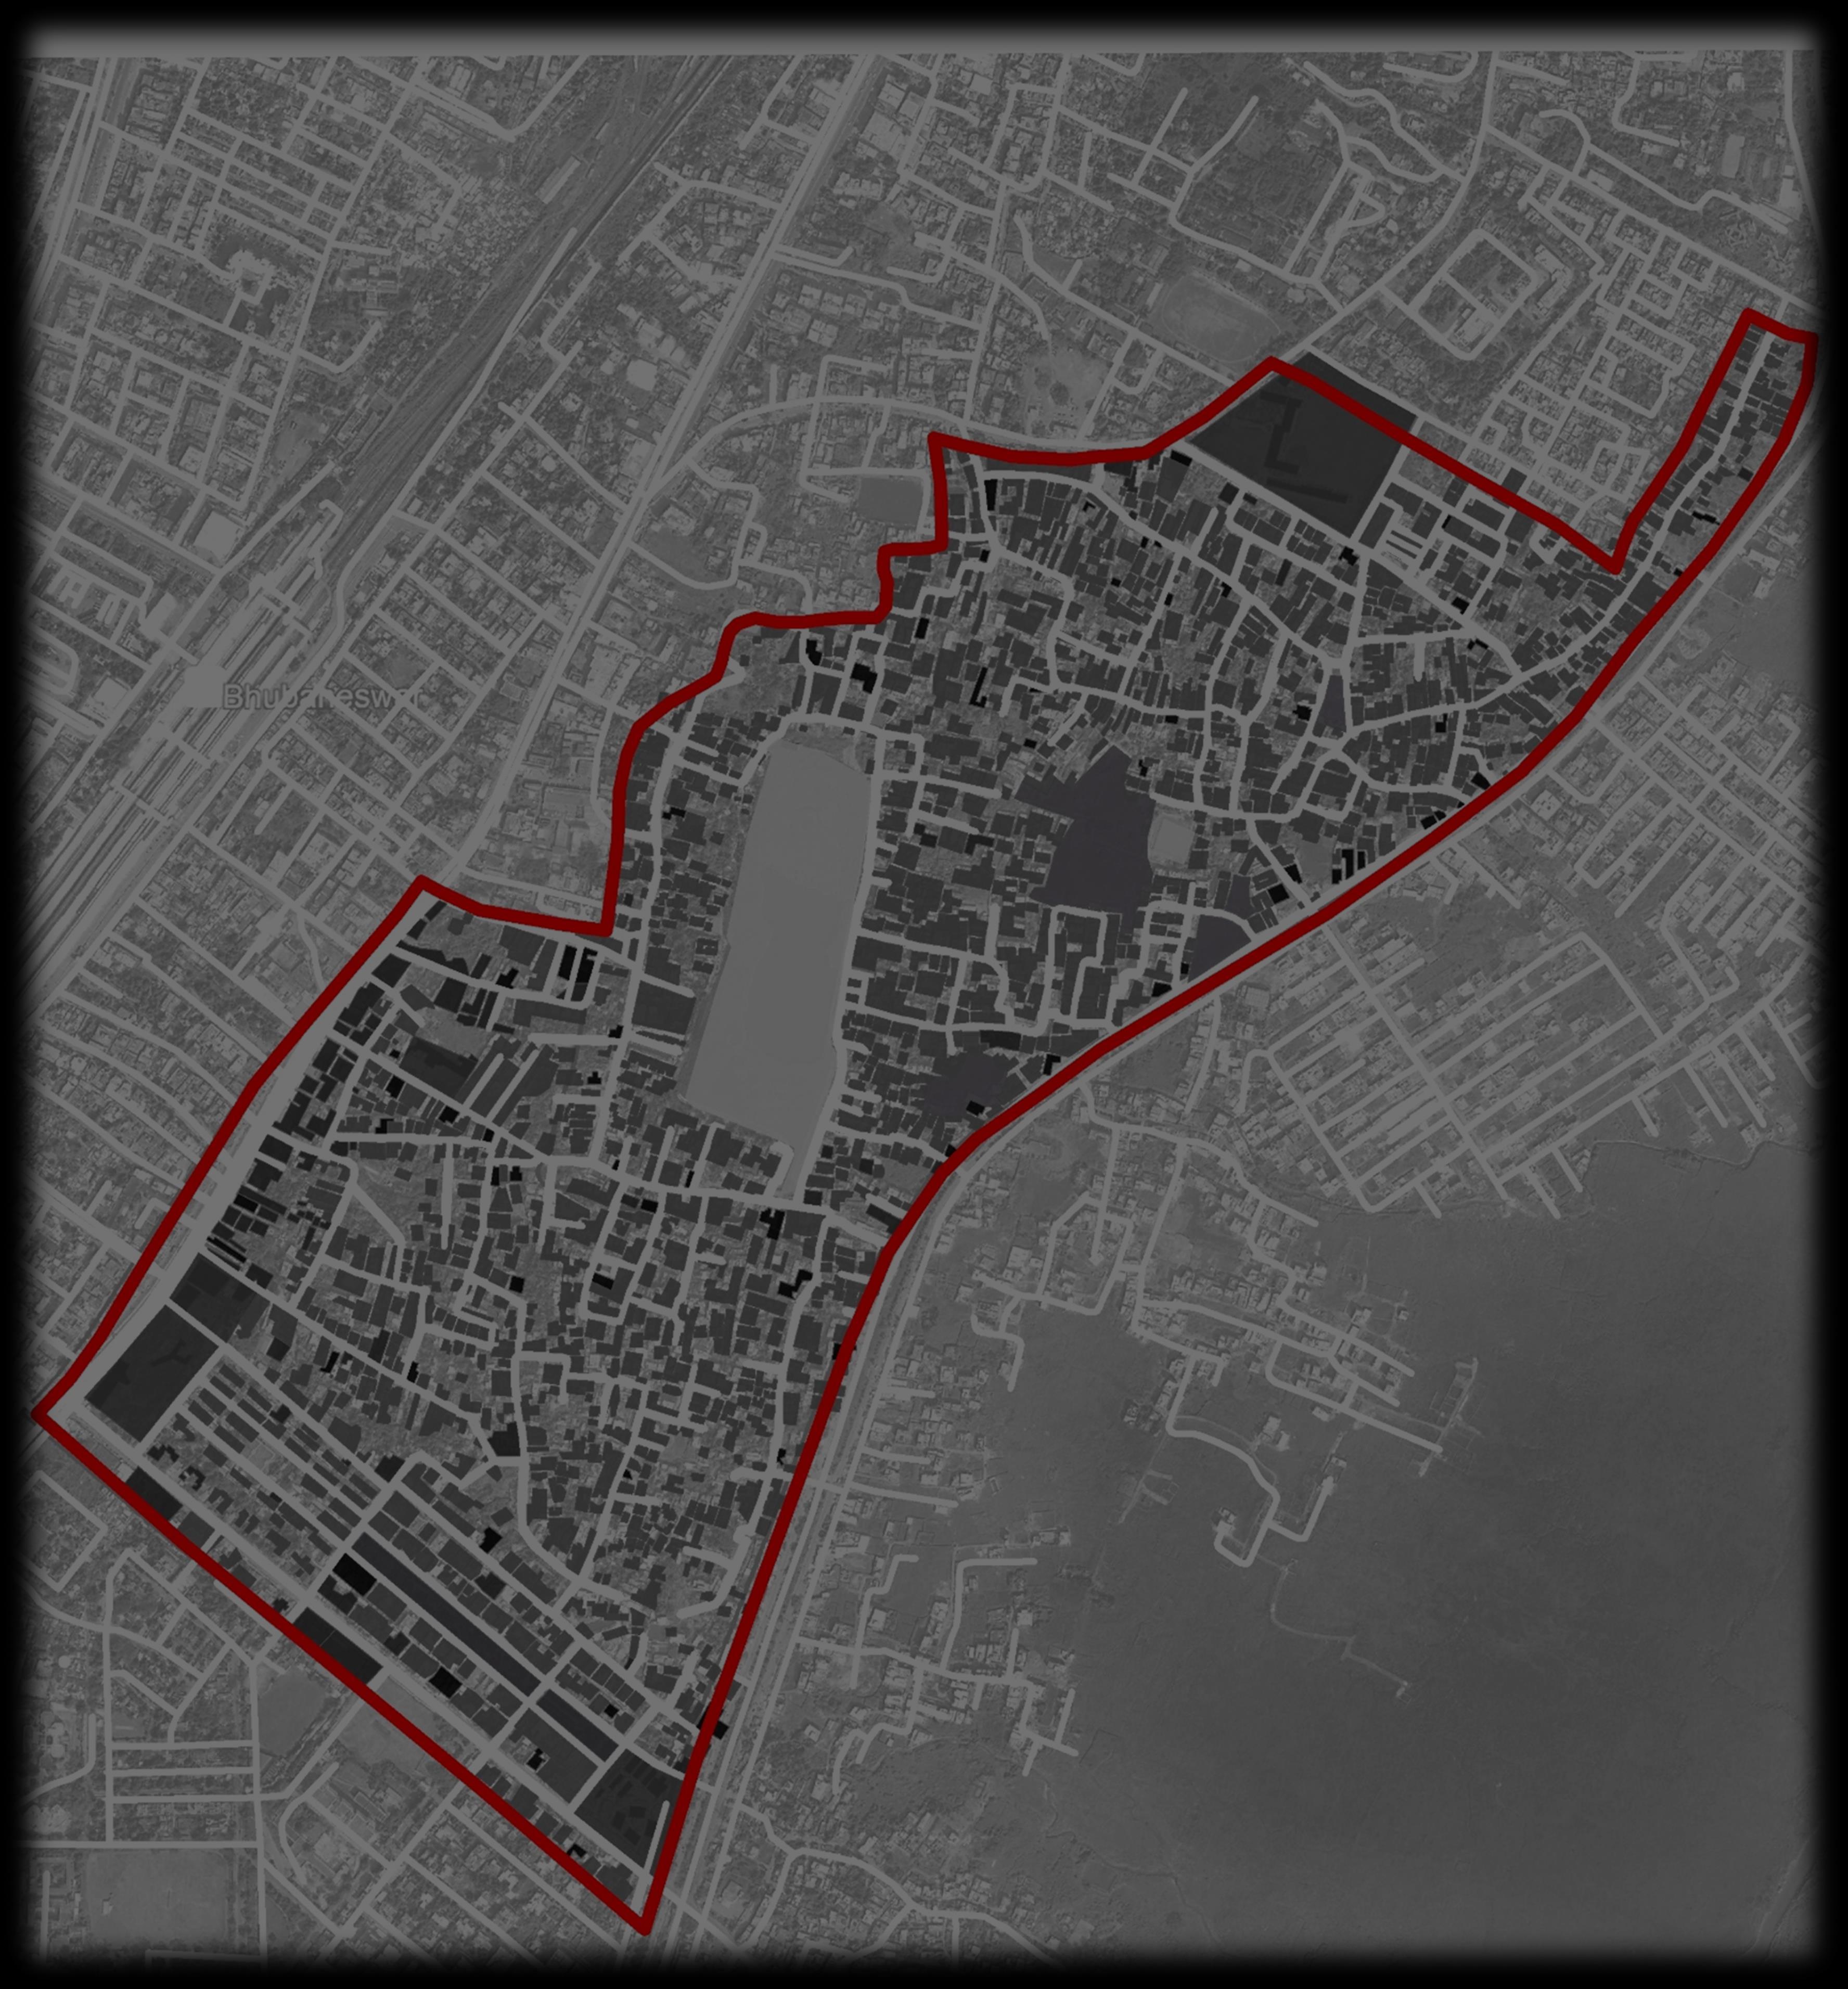
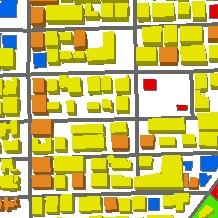
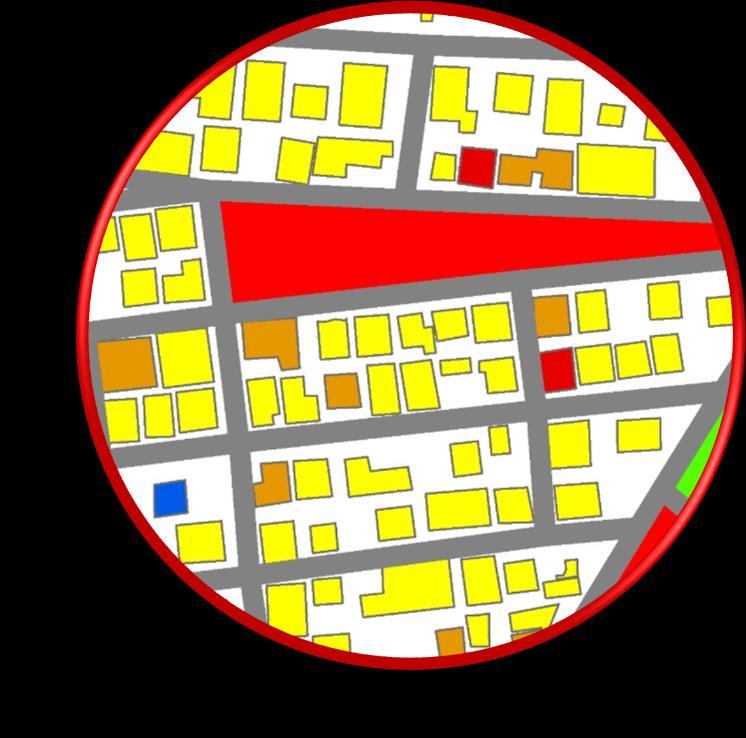
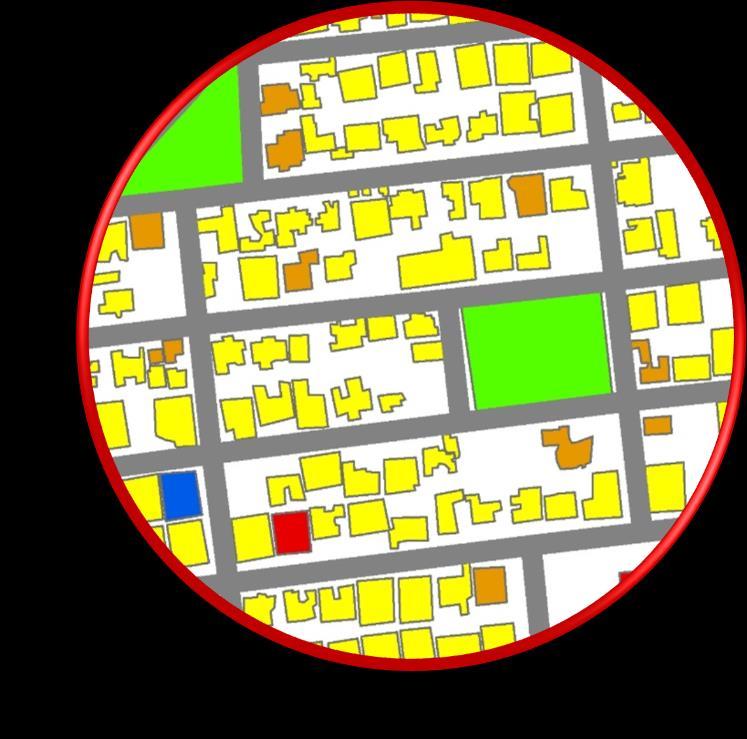
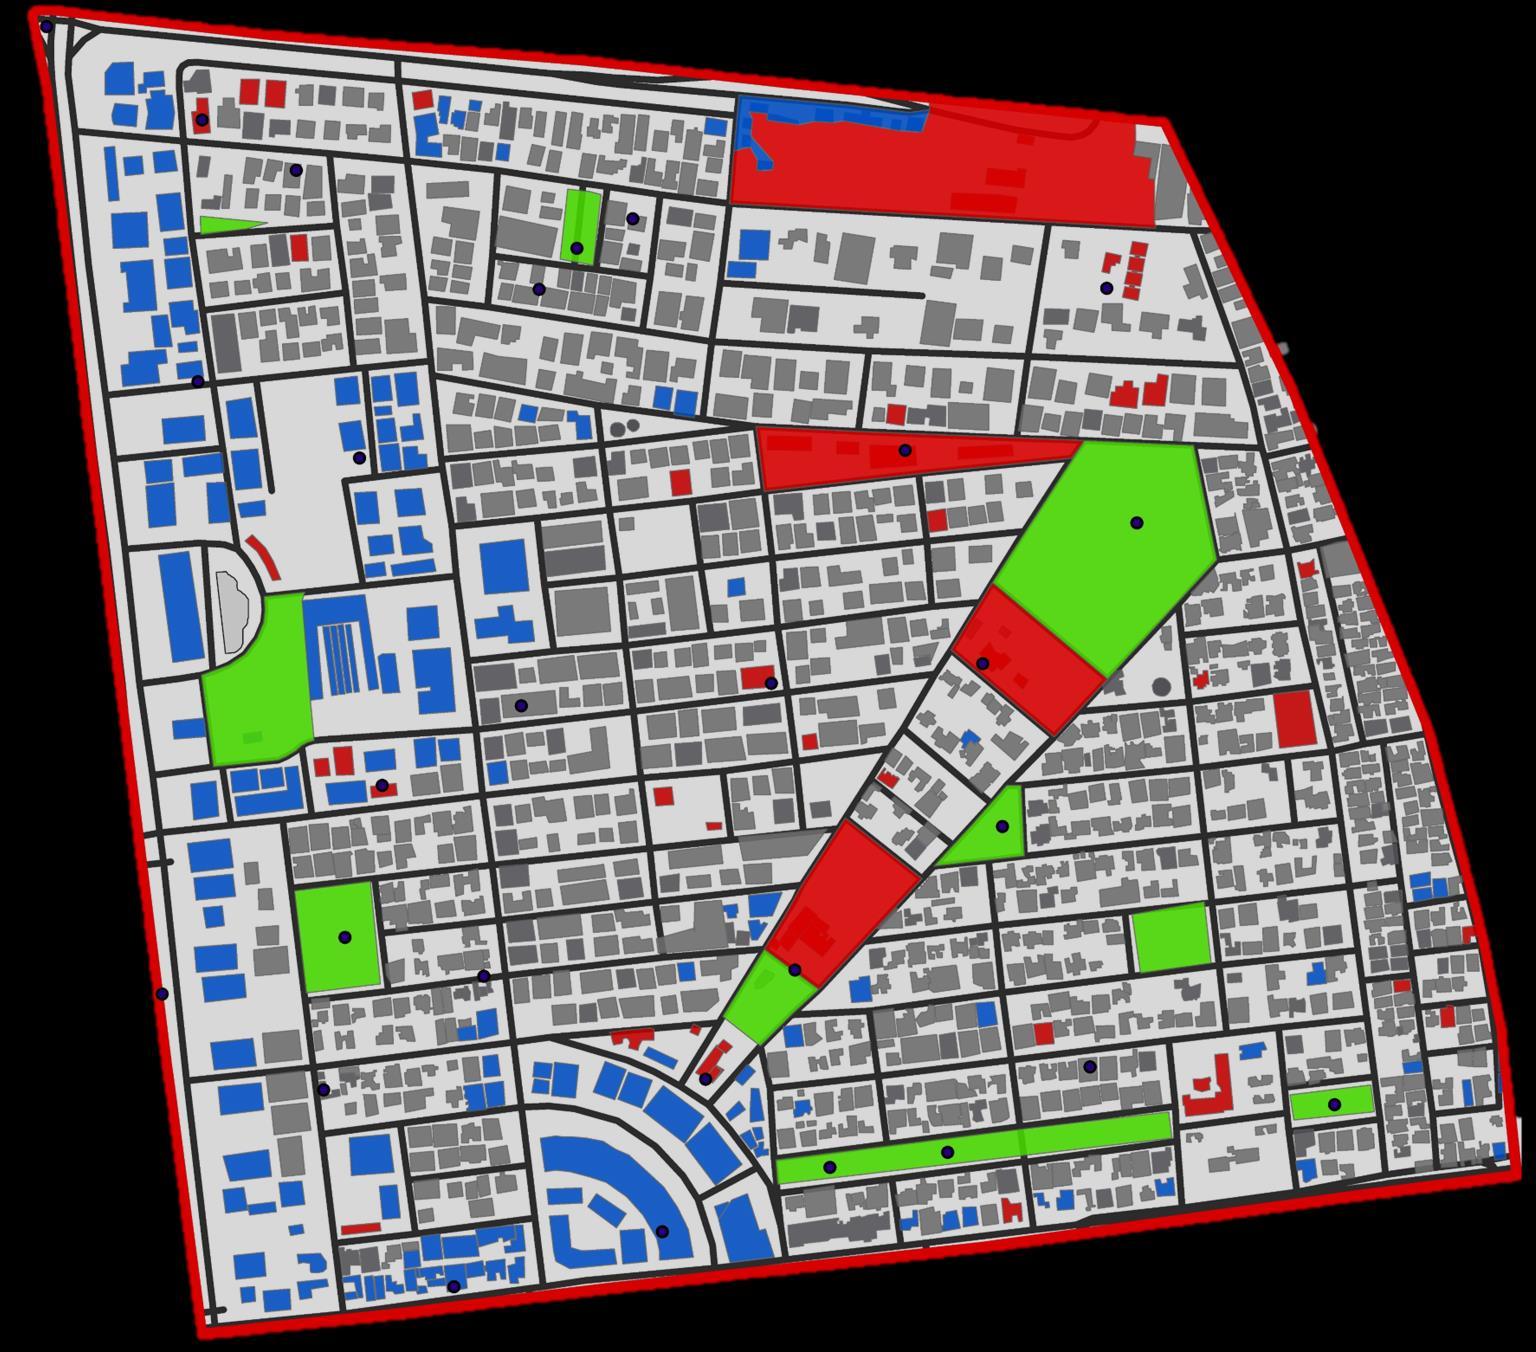
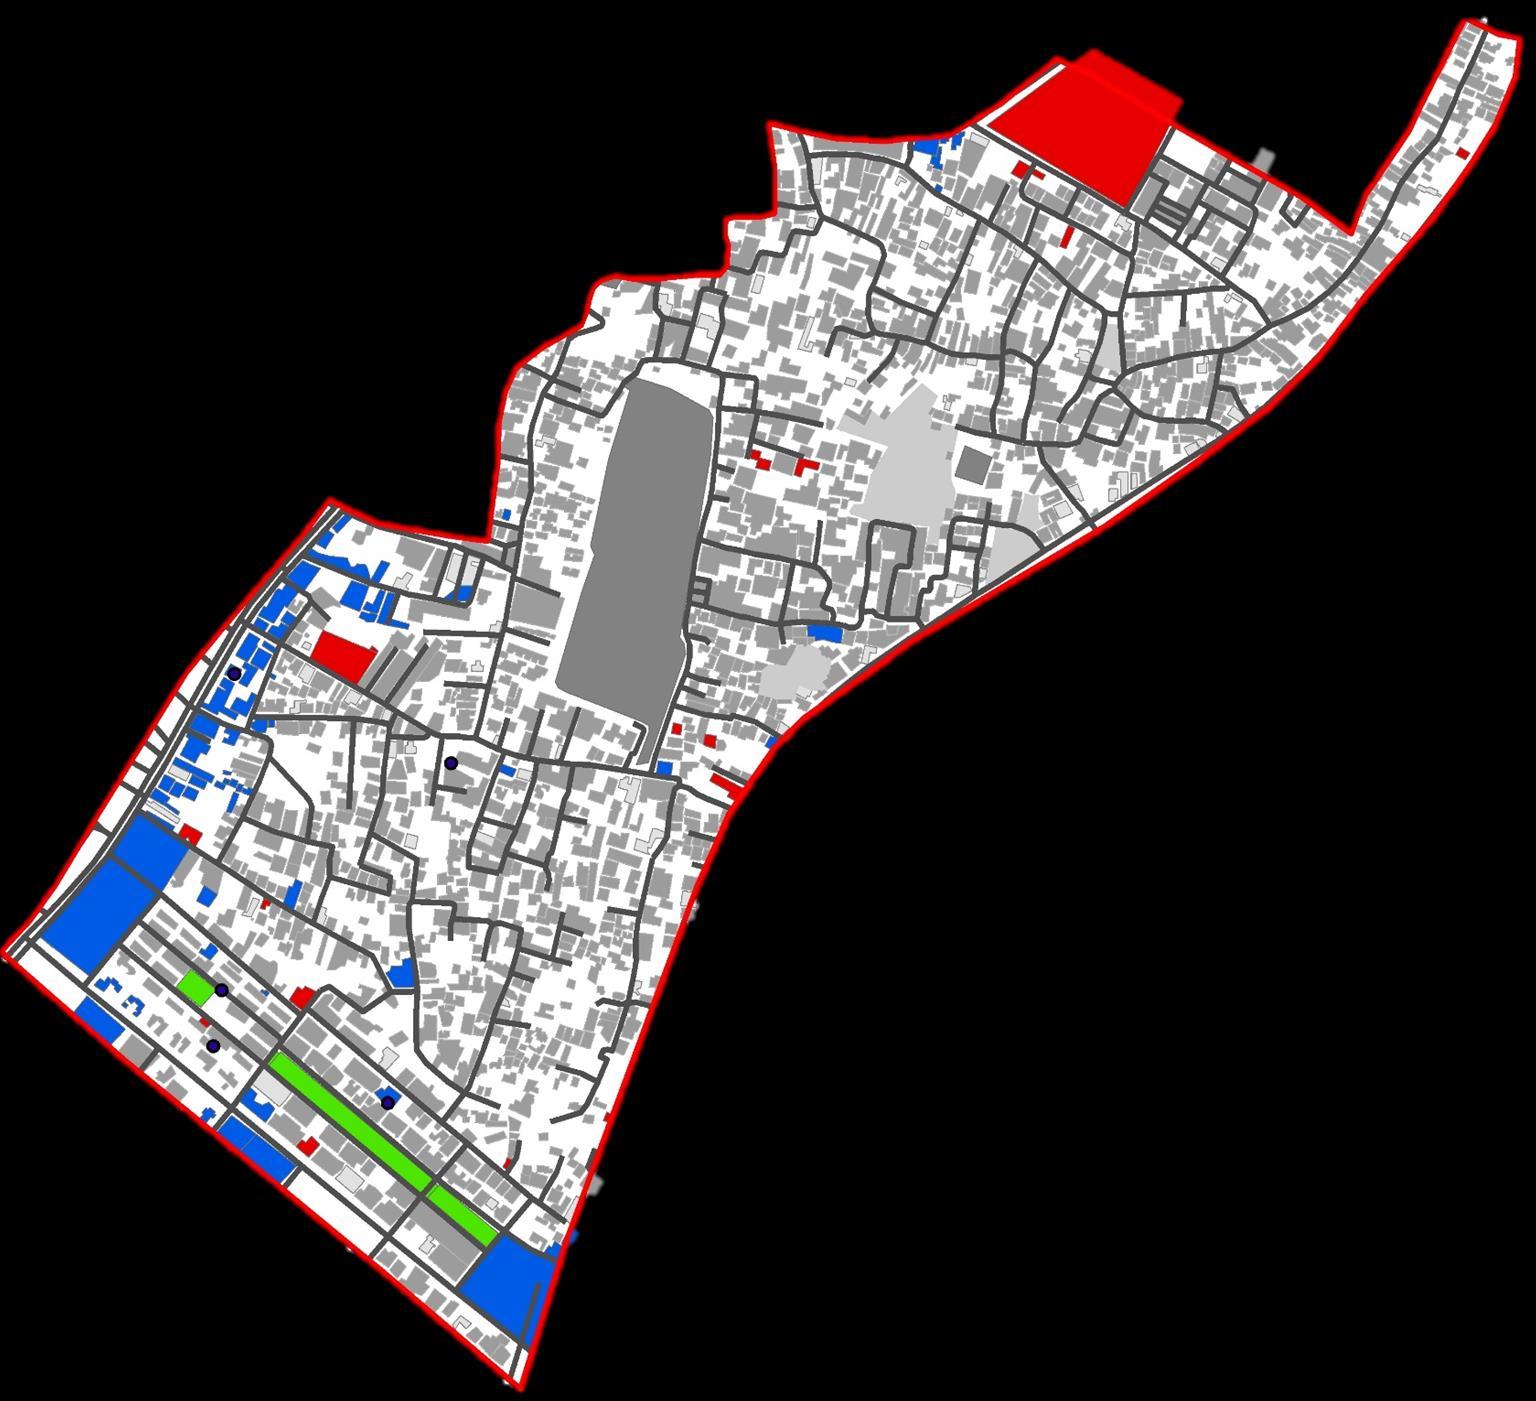
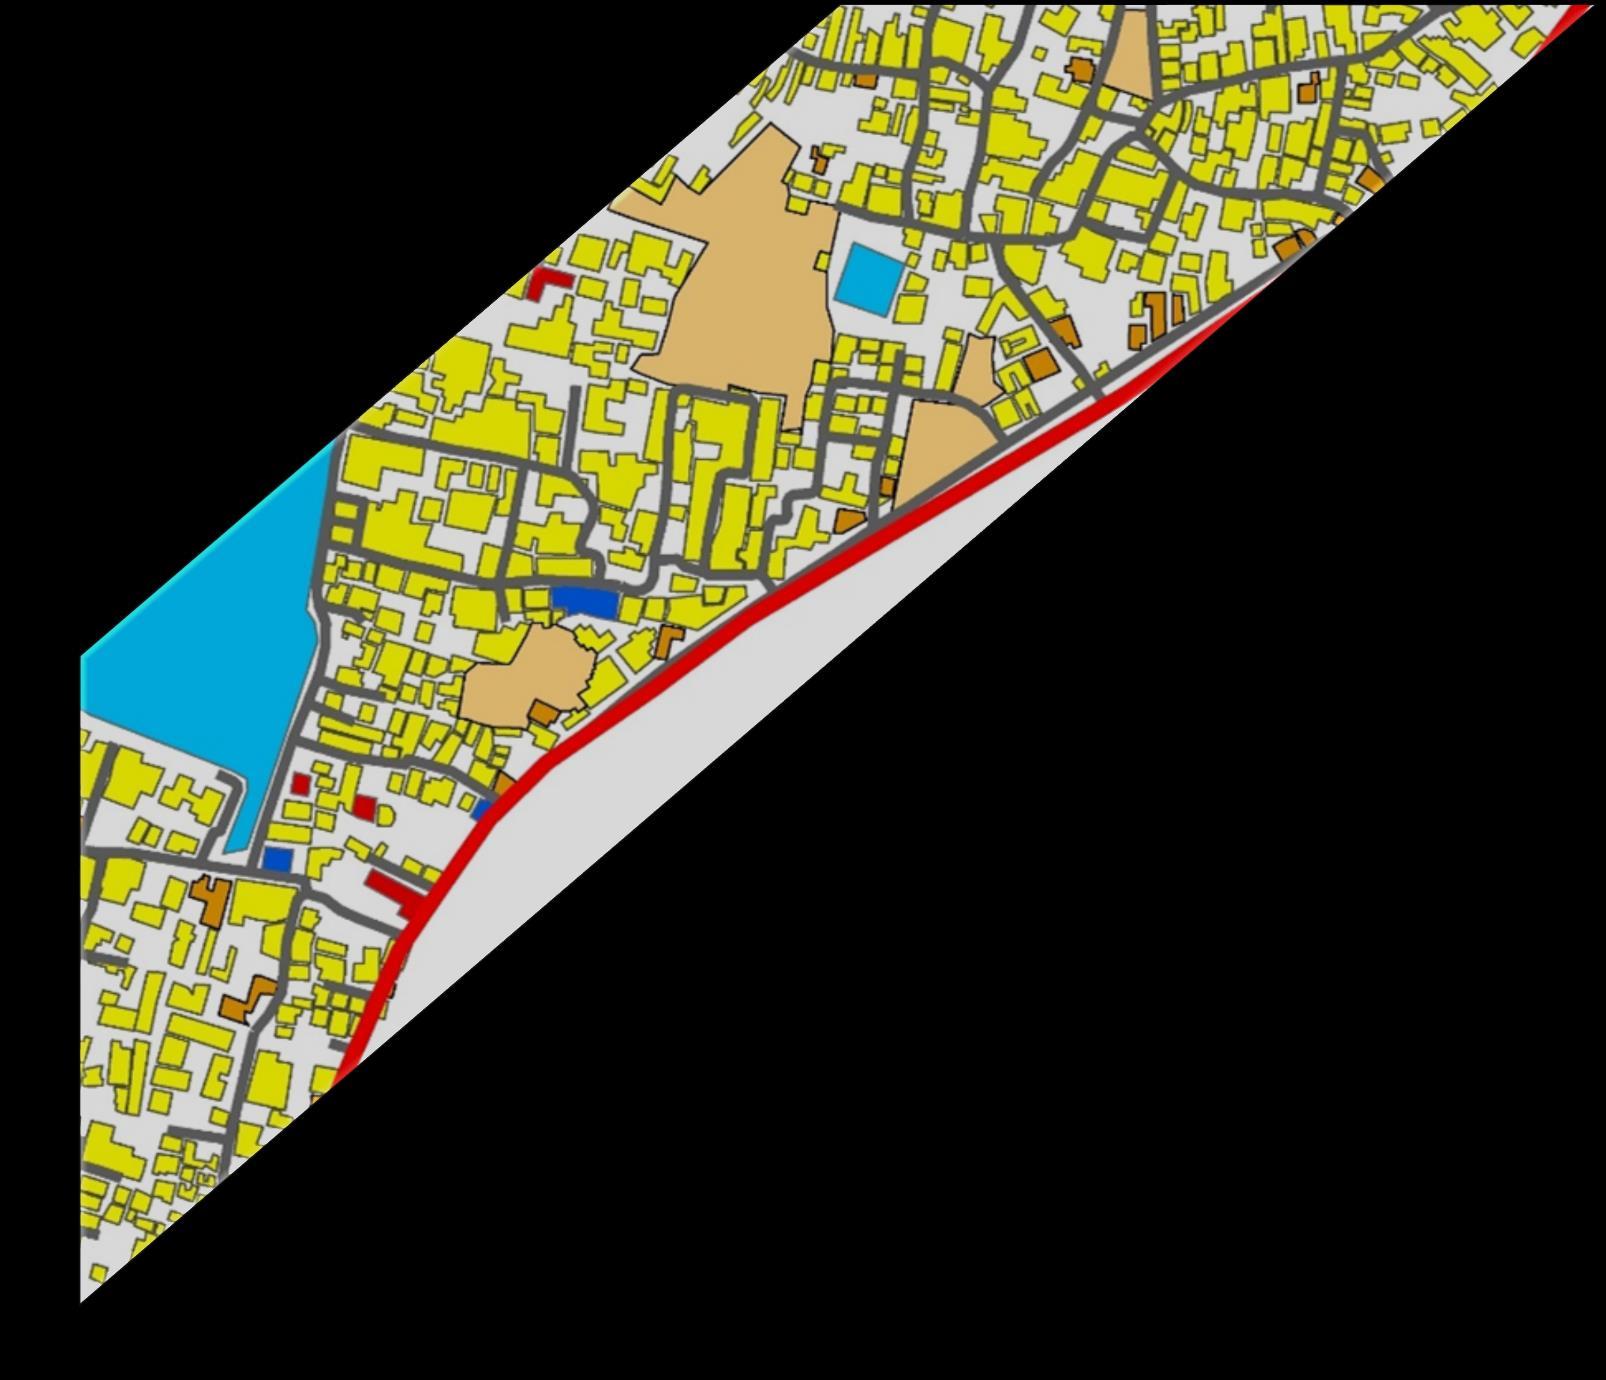
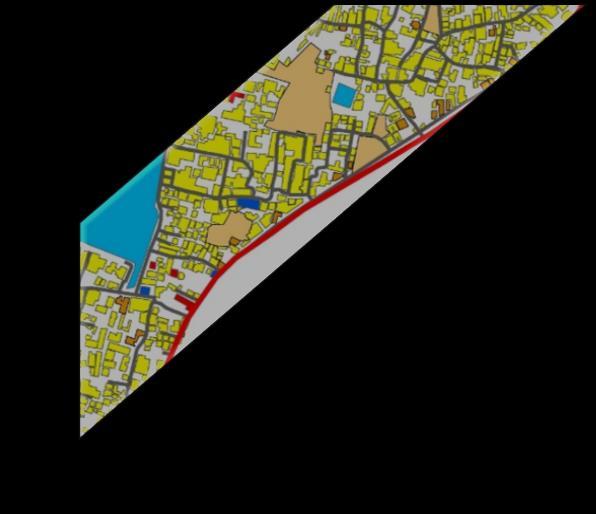
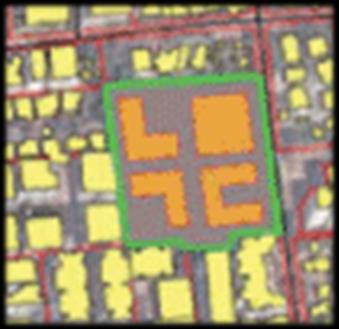
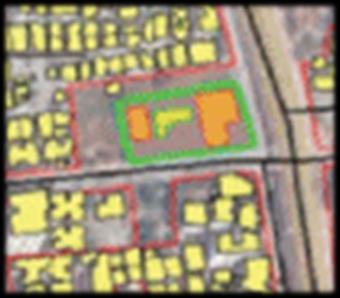
AOI Void Solid Street Legend AOI Void Solid Street Legend Boundary Residential Commercial Public/ Semi-Public Transportation Open spaces Ponds Lakes Lagoons Vacant Land Mixed Use Legend Boundary Residential Commercial Public/ Semi-Public Transportation Open spaces Mixed Use Legend Mixed Landuse Percentage is higher Low Percentage of Recreational area Map 1.12: Solid and Void Map (Source: GIS, Google Earth) Map 1.13: Solid and Void Map (Source: GIS, Google Earth) Map 1.14:
Study Area I & II (Source: GIS, Google Earth, CDP 2030)
Landuse Map of
Area (Source:
Map 1.11: Highlighting the Study Area I & II (Source: GIS)
1.1:
Distribution
Study Area I (Source: Primary)
(Source:
Table 1.2: Socio-Demographic Data of Study
BMC)
Chart
Landuse Percentage
in
Chart 1.2: Landuse Percentage Distribution in Study Area II
Primary)
Fig 1.11: Scoring Chart used for analysis
2
Social activities takes place in the neighbourhood but the frequency needs to be improved.
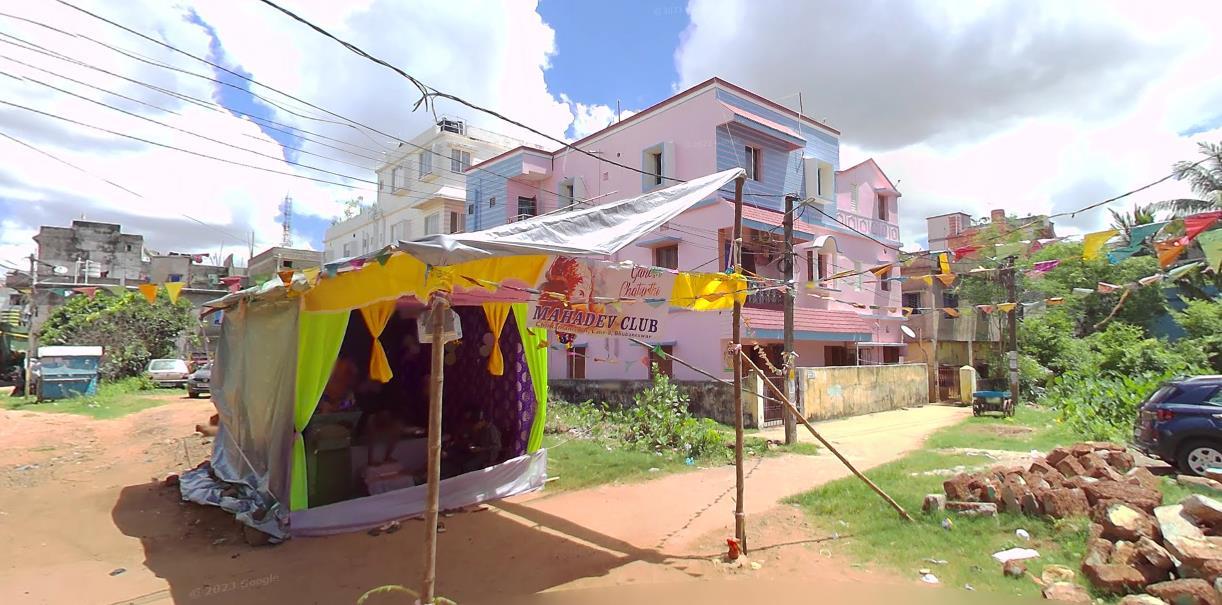
Open Spaces in terms Kalyan Mandaps and other public land is available.
The Kalyan Mandap is well maintained but the public land needs improvement.
Map 1.16: Analysis of Study Area I for parameters of Sustainable Communities (Source: Primary)
According to URDPFI Guidelines Residential Use Zone is Classified into two Categories:
Residential Use Zone
R1: Primary Residential Zone
R2: Unplanned/ Informal residential Zone


R1: Primary Residential Zone


There is no regular social programs in the neighbourhood Lack proper maintenance of the open space that can be used for such activities.
Residents are busy in their day to day lives and due to lack of social interaction their mental health is affected.

1
3


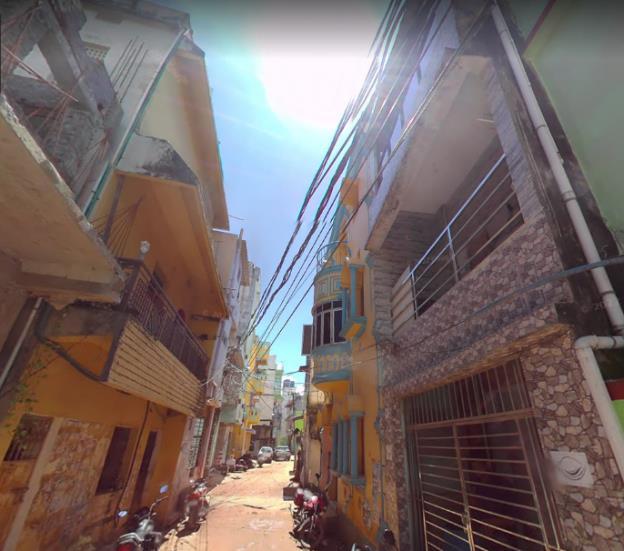
Fig 1.14: Narrow Streets (Source: Primary Survey)

Building are aligned in a proper pattern so the eyes are on the street.
Street lights are available and higher mixed use also contribute to safer neighbourhood.


Women don't feel safe during late nights.
Buildings are arranged in a regular pattern and this makes the neighbourhood accessible to others easily
Buildings are build by following the building rules and regulation.
Ventilation and privacy is not affected.
Eyes one the streets are less due to unplanned development of buildings.
Street Lights are available


Streets are not safe for women during night.
Lack of proper privacy
Buildings do not have sufficient setbacks
Lack of Ventilation
Legend 1 1 3
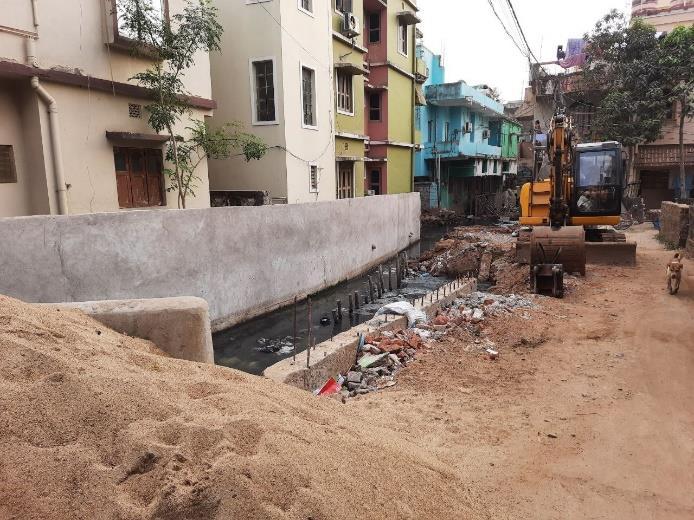
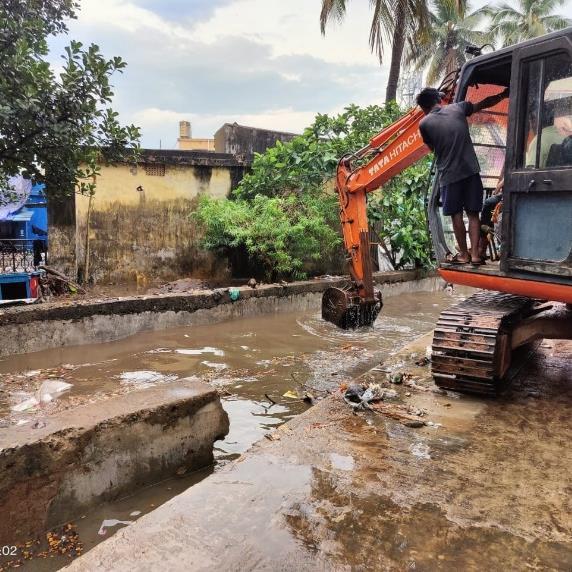
Construction activities without considering drainage network
UNDERSTANDING THE ROLE OF URBAN FORM ON ACHIEVING BETTER SOCIAL SUSTAINABILITY: A CASE STUDY OF BHUBANESWAR SHEET NO: 08
DEPARTMENT OF PLANNING
Odisha University of Technology and Research, Ghatikia, Bhubaneswar
2 3 1
PLANNING THESIS
DATA COLLECTION & ANALYSIS SUBMITTED BY PRITI CHHATOI
SUSTAINABLE COMMUNITIES
1920106033
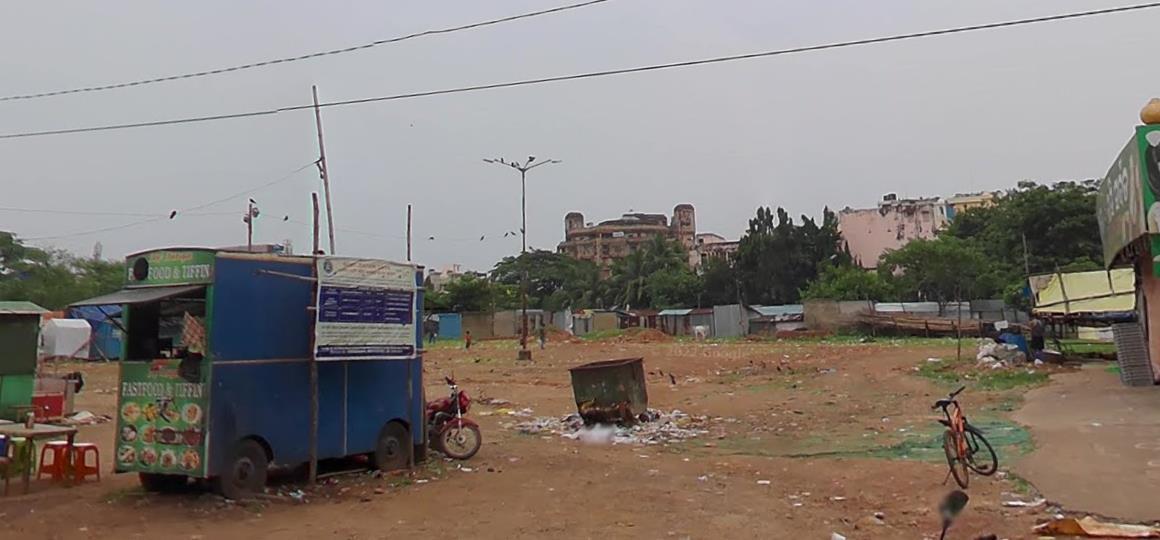
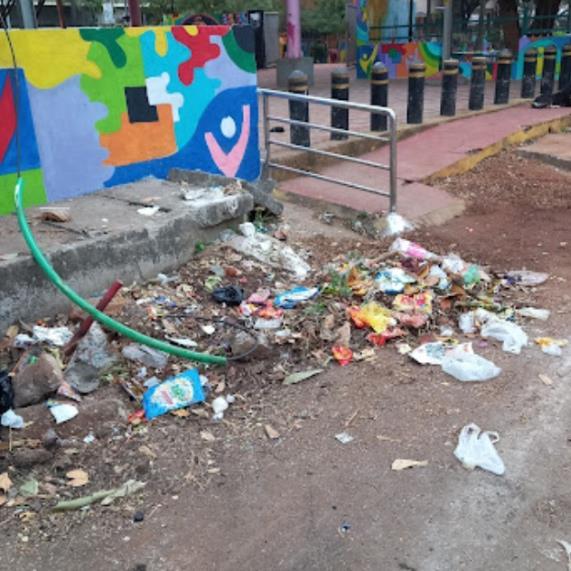
Fig 1.13: Lack of proper maintenance of open spaces that can be used for socio-cultural festivals.
(Source: Primary Survey)
Fig 1.12: Lack of proper maintenance of open spaces that can be used for sociocultural festivals.
(Source: Primary Survey)
Fig 1.15: Houses constructed near and over drain has led to improper management of drain and may further lead urban flooding.
AOI Street
R2: Unplanned/ Informal 2 3
2
Map 1.17: Analysis of Study Area II for parameters of Sustainable Communities (Source: Primary)
According to URDPFI Guidelines, the number of unit of social amenities to be provided for a population of 12,220.


DEPARTMENT OF PLANNING


Odisha University of Technology and Research, Ghatikia, Bhubaneswar
▪ Fresh fruits and vegetables.
▪ Organised Market place
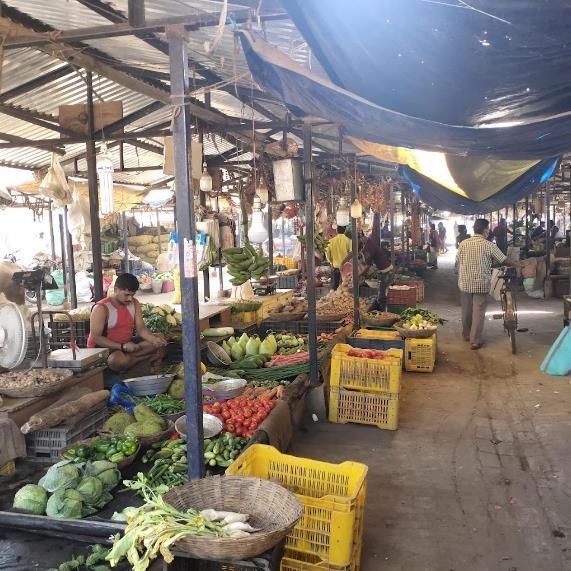
▪ Cleanliness and hygiene is maintained

▪ Poor maintenance in front of public open spaces.
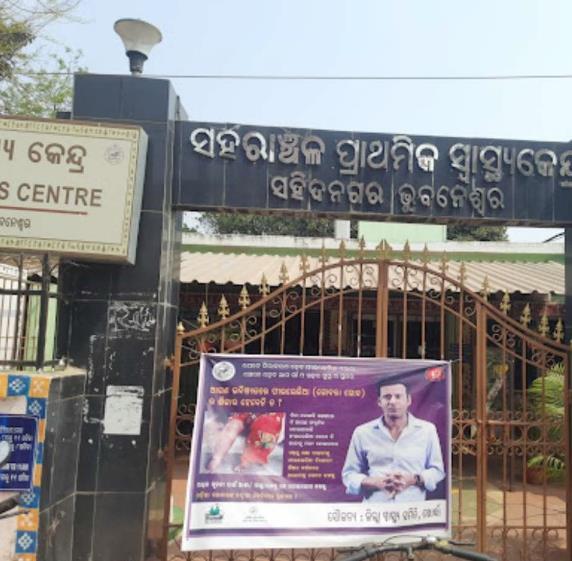
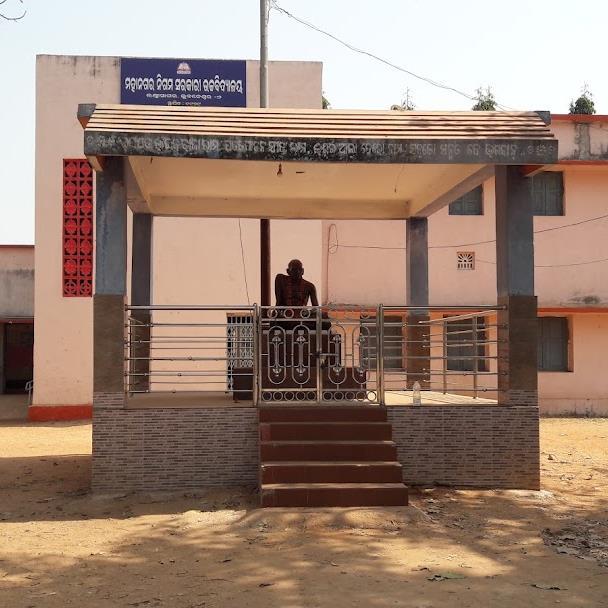
▪ Both government and private hospital are present in study area
▪ Hospitals are well maintained.

PLANNING THESIS

▪ Mostly the basic services are available in 3 mins of travelling or in an radius of KM


▪ Facilities like Fire Station, Library and schools for higher education are available in a radius of 5 KM


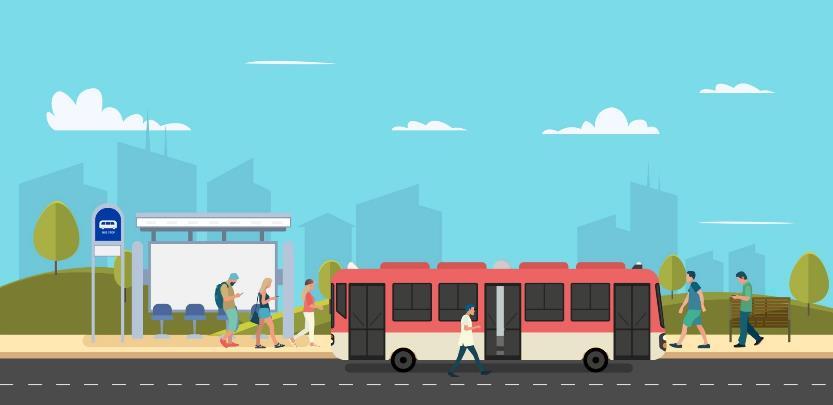
Modes of Public Transport Available in Study Area are Public Bus, Auto Rickshaw and Bi cycle


▪ Mo Bus Stop are is evenly distributed in study area such that people could easily access the bus services within a walkable distance.
▪ Share Auto rickshaws are the second most preferred mode of transportation in the Study Area after Mo- Bus Services.
▪ Availability of proper cycle tracks has encouraged PBS System in the neighbourhood for travelling short distances in case of youth population mostly during morning and evening time
Satisfaction


Satisfaction Level Of Open Spaces and Parks

DATA COLLECTION & ANALYSIS


▪ Well Distributed open spaces & parks.
▪ Parks and playgrounds are well equipped with facilities for all categories of population.
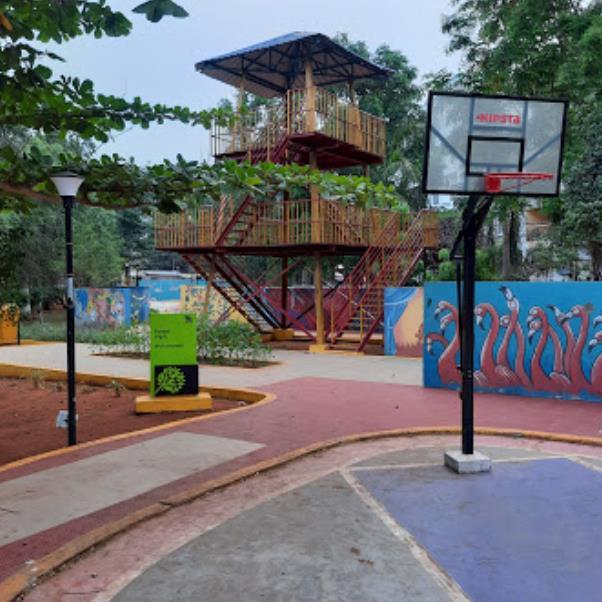
Open Spaces including parks and playground cover 6% of total landuse in the study area. People frequently visit parks & playgrounds during morning & evening time for walks and kids gather at parks to enjoy various swings & slides in the study area.
SHEET NO: 09


SUBMITTED BY PRITI CHHATOI 1920106033
Neighbourhood Amenities Population Served/ Unit Required Present Primary School 5000 3 3 Senior Secondary School 7500 2 4 Dispensary 15000 1 1 Community Hall 15000 1 2 Sports area Complex 15000 1 2
Services Available Police Station Fire Station Post Office Library ATM & Bank Availability of Other Services Services Available Cinema Hall Local Market Hotel Public Toilet Petrol Pump Table 1.2: Socio-Demographic Data of Study Area (Source: BMC)
1.2: Availability of Different Services within 4 KM Radius (Source: Primary) ACESS TO SERVICES TRANSPORTATION AVAILABILITY 2 3 4 5 5
Table
Level
1.18: Public Services/Amenities within 4 KM Radius of Study Area II (Source: Primary)
(Source:
Of Transportation Facilities Map
Map 1.19: Analysis for Social Equity in Study Area I
Primary)
PARK & OPEN SPACES 1 2 3 4 5
4.8
PUBLIC AMENITIES SATISFICATION
UNDERSTANDING THE ROLE OF URBAN FORM ON ACHIEVING BETTER SOCIAL SUSTAINABILITY: A CASE STUDY OF BHUBANESWAR
Boundary Commercial Public/ Semi-Public Road Open spaces Educational Buildings Hospital Local Market ATM Mo Bus Stop Petrol Pump Post Office Public Toilet Library Legend
According to URDPFI Guidelines, the number of unit of social amenities to be provided for a population of 14,992.
▪ Both primary and senior secondary schools are present in Study Area in adequate numbers

▪ Only a private hospital & a Govt. homeopathy
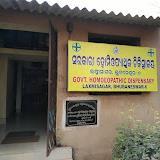
Dispensary is present


▪ The Dispensary only provides homeopathic solution and the disadvantaged communities may not be able to access a Private Hospital.
▪ Poor maintenance
▪ Urban flooding occurs even in very medium rainfall.
DEPARTMENT
▪ This market provides day to day needs
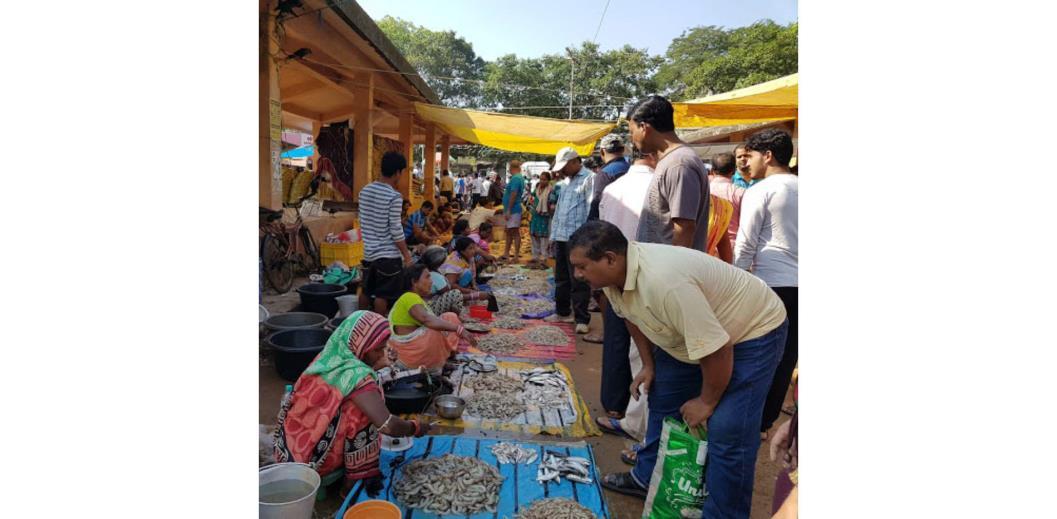
▪ Cheap rates
▪ Lack of Parking Facilities.
▪
▪ Mostly the basic services are available in 3 mins of travelling or in an radius of KM.
▪ Facilities like Cinema Halls, Library and schools for higher education are available in a radius of 5 KM
Modes of Public Transport Available in Study Area are Public Bus, Auto Rickshaw and Bi cycle
▪ Mo Bus Stop are provided in such a way that people could reach the stops in an average walking distance of 5 mins and there are very rare cases where the time exceeds 5-6 mins
▪ Youth usually prefer to book auto rickshaw through mobile application
▪ Share auto rickshaws are also used instead of reserving a whole vehicle This method contributes to more eco friendly travel method
▪ Cycles provided in public bike system of the city are not frequently used in the neighbourhood
▪ Cycles are not used because of lack of awareness among people regarding the process of use of PBS system

Satisfaction Level Of Transportation Facilities


According to URDPFI Guidelines, there should be at least -4 local park and playgrounds in a neighbourhood. So, the study area lacks recreational spaces in terms of parks and playgrounds.
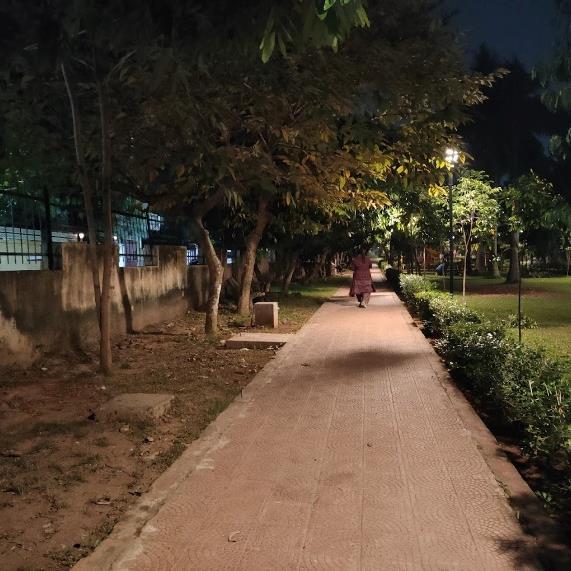
Issues Identified in availability and accessibility of Open Spaces in Study Area:
Less frequency of using of recreational people in the study area leads to less social interaction.
▪ Parks and Playgrounds are not uniformly distributed over the study area.
▪ Poorly maintained.
▪ People do not frequently visit the open spaces in the study area
Satisfaction

SHEET NO: 10


SUBMITTED BY PRITI CHHATOI 1920106033
ACESS TO SERVICES Neighbourhood Amenities Population Served/ Unit Required Present Primary School 5000 3 2 Senior Secondary School 7500 2 4 Dispensary 15000 1 1 Community Hall 15000 1 1 Sports area Complex 15000 1 1
Services Available Police Station Fire Station Post Office Library ATM & Bank Availability of Other Services Services Available Cinema Hall Local Market Hotel Public Toilet Petrol Pump PARK & OPEN SPACES PLANNING THESIS
OF PLANNING Odisha University of Technology and Research, Ghatikia, Bhubaneswar
UNDERSTANDING THE ROLE OF URBAN FORM ON ACHIEVING BETTER SOCIAL SUSTAINABILITY: A CASE STUDY OF BHUBANESWAR
DATA COLLECTION & ANALYSIS
PUBLIC AMENITIES SATISFICATION
TRANSPORTATION AVAILABILITY
1 2 3 4 5 2.4
Level
Open Spaces
Parks 1 2 3 4 5 4.7
Of
and
Boundary Commercial Public/ Semi-Public Road Open spaces Educational Buildings Hospital Local Market Legend ATM Mo Bus Stop Petrol Pump Post Office Public Toilet Map 1.21: Analysis for Social Equity parameter in Study Area II (Source: Primary)
1.2:
KM Radius (Source: Primary) Map 1.20: Public Amenities/Services within 4 KM Radius of Study Area II (Source: Primary)
Table
1.2:
Socio-Demographic Data of Study Area (Source: BMC) Table
Availability of Different Services within 4
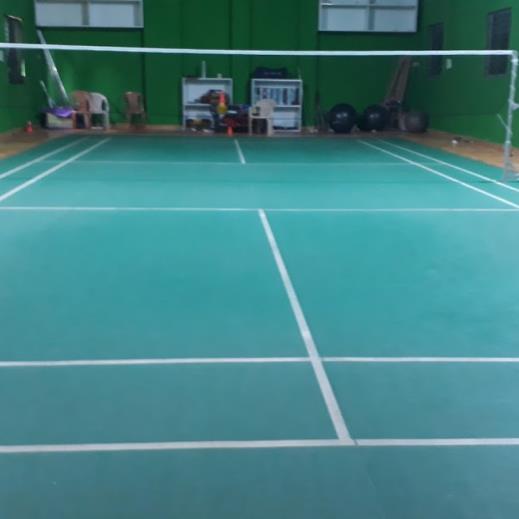
only 1 private Indoor Hall.
Social Integration
▪ Participation in Neighbourhood Activities: 3.75
▪ Talking or interaction in Neighbourhood: 4
▪ Maintenance of Space used for interaction: 3.75
▪ Volunteering Different Social Gatherings, Campaign: 3.5
▪ Participation in Neighbourhood Activities: 2
▪ Talking or interaction in Neighbourhood: 3.5
▪ Maintenance of Space used for interaction: 2
▪ Volunteering Different Social Gatherings, Campaign: 1
▪ Social Integration is higher in Study Are I due to:
▪ Mixed Landuse encourages people interaction
▪ Availability and maintenance of proper space for gatherings and social activities as compared study area II
▪ Feeling Safe during Afternoon: 4.75
▪ Feeling Safe during Evening: 5
▪ Feeling Safe during Night: 4.5
▪ Feeling that house is Safe during Travel: 4.75
Safety
Neighbourhood as a Place to Live
▪ Privacy Level: 5
▪ Buildings Constructed as per rules and regulation: 5
▪ House Accessibility by other: 5
▪ Ventilation: 5
▪ Feeling Safe during Afternoon: 3.5
▪ Feeling Safe during Evening: 4
▪ Feeling Safe during Night: 1
▪ Feeling that house is Safe during Travel: 3.5
▪ The way in which urban solids are built with respect to streets and voids plays an important role in ensuring safety in roads and streets.
▪ Facing of windows and balconies towards the streets increases the number of eyes on street.
▪ Study Area I has been more safe because of its better street integration and presence more mixed landuse and proper arrangement of buildings on the streets
▪ Privacy Level: 3
▪ Buildings Constructed as per rules and regulation: 2
▪ House Accessibility by other: 3
▪ Ventilation: 3
▪
▪ Services Availability: 3.5
▪ Service Maintenance: 3.25


▪ Frequency of use of Public Services: 4
▪ Time needed to access the Services: 4
▪
▪
▪ Availability: 5
▪ Frequency of use of Open Spaces: 4.75
▪ Time needed to access : 5
▪ Services Availability: 5
▪ Frequency of use of Public Transport Services: 4.5
▪ Time needed to access the Services: 4.5
▪ Buildings do not follow a proper setbacks in Study Area II where as in Study Area I they buildings are constructed in regular manner with proper set backs that makes the neighbourhood more liveable
▪ When the building bye laws are not followed both privacy and ventilation is compromised
▪ Irregular and less integrated streets may make house accessibility difficult
▪ Mixed Landuse increase the services availability at a neighbourhood level
▪ Accessibility of services depends upon the distance and the connectivity of the area to the place of availability
▪ The units available in the neighbourhood should also be according to the population of the area
▪ Provision to avail the public transportation in available in both the study area.
▪ Accessibility of bus services depends upon the distance and the other connecting mode of transport from origin to bus stops and vice versa
of Open Spaces/ Parks


URBAN FORM SUSTAINABLE COMMUNITIES
SOCIAL INTEGRATION
SAFETY
NEIGHBOURHOOD AS A PLACE TO LIVE
▪ Availability: 2
▪ Frequency of use of Open Spaces: 2
▪ Time needed to access : 3.75
LANDUSE HOUSING TYPOLOGY CONNECTIVITY DENSITY
DEPARTMENT OF PLANNING


Odisha University of Technology and Research, Ghatikia, Bhubaneswar
▪ Recreational spaces depends upon the landuse distribution of study area
▪ Frequency of visit to parks and playgrounds depends upon the maintenance of the areas and distance from the residence
▪ Distribution of recreational spaces is needed.
URBAN FORM SOCIAL EQUITY
AVAILABILITY OF SERVICES
AVAILABILITY OF PUBLIC TRANSPORTATION
AVAILABILITY OF OPEN SPACES/ PARKS
LANDUSE HOUSING TYPOLOGY CONNECTIVITY DENSITY
PLANNING
THESIS
DATA COLLECTION & ANALYSIS SUBMITTED BY PRITI CHHATOI 1920106033 PARAMETERS STUDY AREA I (SAHEED NAGAR AREA) STUDY AREA II (LAXMISAGAR
INFERENCE
UNDERSTANDING THE ROLE OF URBAN FORM ON ACHIEVING BETTER SOCIAL SUSTAINABILITY: A CASE STUDY OF BHUBANESWAR SHEET NO: 11
AREA)
Availability
of Services
▪ Services Availability: 5 ▪ Service Maintenance: 4.5
▪ Frequency of use of Public Services: 4.75
Time needed to access the Services: 5
Availability
of Public Transportation
▪ Services Availability: 5
Frequency of use of Public Transport Services: 4.5
Time needed to access the Services: 5
Availability
MATRIX BETWEEN URBAN FORM
SUSTAINBALE COMMUNITES
BETWEEN
& SOCIAL
COMPARATIVE ANALYSIS OF SOCIAL SUSTAINBILITY PARAMETERS OF STUDY AREA I & STUDY AREA II
&
MATRIX
URBAN FORM
EQUITY
Recommendations for achieving Sustainable Communities

To create and maintain the pockets for community activities.
Local Government at the ward level should take initiative to organise different activities to engage different age groups and gender of people once in two months.
Public participation in decision making process can be introduced at the neighbourhood level to encourage social interaction and make the decision making process more inclusive.

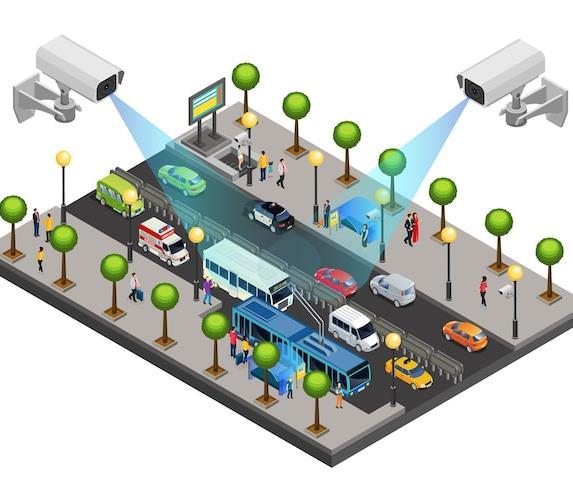
CCTV Surveillance to make streets more safe.
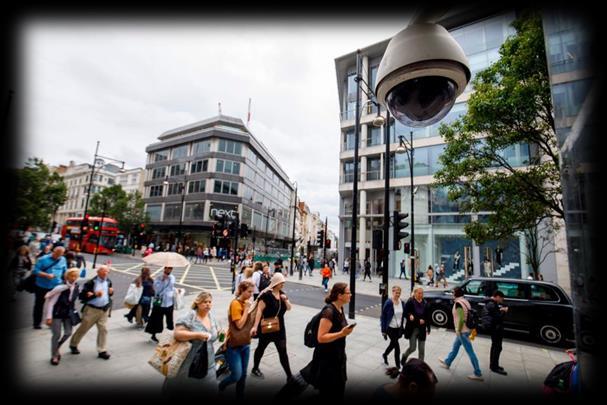
Promoting Mixed Landuse to increase walkability and number of eyes on street and make more safe places.
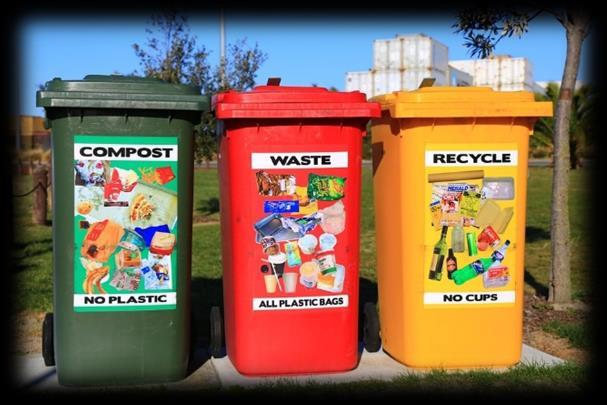
Providing Community bins at the neighbourhood level could make spaces more liveable.
Allowing the constructions of Building that are according to the Building Bye Laws thus aiming for a planned urban form.
Regular maintenance of drains, proper waste management to promote clean physical environment to prevent urban flooding and water logging to make a neighbourhood a good place to live in.
Mixed Use
Infill development refers to the construction of buildings or other facilities on previously unused or underutilized land. . Horizontal Infill of Fully Vacant Plot; Horizontal Infill of Partially Vacant Plot and Vertical Infill
3 Fig 1.5: Illustration of different methods of infill development


(Source: planetizen.com)
For Study Area I
1. Promoting Vertical Infill development and infill development high density
2. Regular Maintenance of Public spaces and streets
Recommendations for achieving Social Equity
For Study Area II
1. Creating pockets for recreational proposes
2. Developing the unused vacant lands using horizontal infill development to provide small library and community spaces
3. Creating awareness regarding mental and physical health among people
(Source: Secondary)
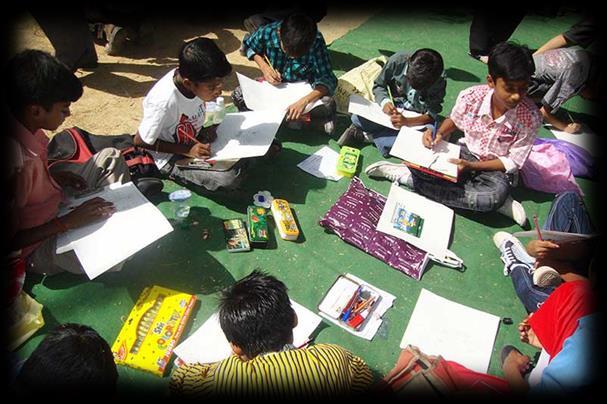
Residents especially the youths could take up the responsibility to organise activities like drawing and painting, outdoor sports in neighbourhood to encourage teamwork, social interaction between different members of the neighbourhood.
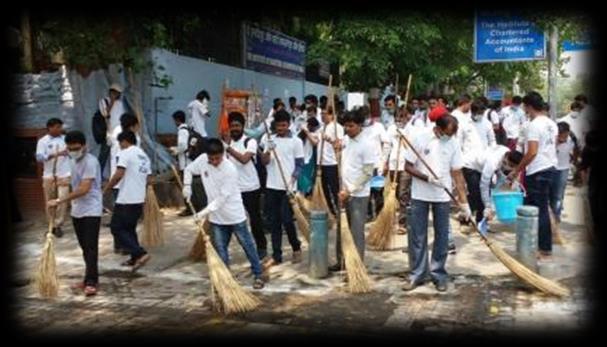
Volunteering campaigns for socio-environmental cause like cleanliness drive and socio-cultural programs in the neighbourhood.
Residents need to dispose of their waste in the respective community bins or vehicles that collect waste from door to door.


(Source: Secondary)
DEPARTMENT OF PLANNING


Odisha University of Technology and Research, Ghatikia, Bhubaneswar
People should build their buildings as per proper norms and guidelines laid down by the local government to encourage privacy, ventilation and a good street view in the neighbourhood. PLANNING
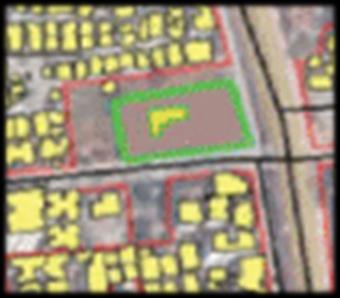
Map 1.23: Proposals for Study Area
(Source: Primary)
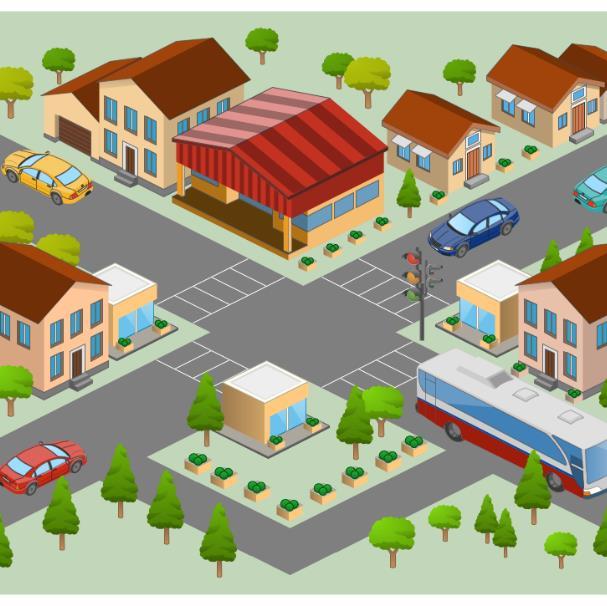
Recommendations for New Neighbourhood Development
For New Development or urban expansion the urban form of the new neighbourhood should be planned on the basis of the following principles toa attain a better social sustainability:
Accessibility
Connectivity
Mixed Use Diversity
Density Open Spaces

Neighbourhood as a place to live in (proper building bye laws)
Availability Public Participation
Fig 1.16: Proposed Neighbourhood Design
(Source: Rethinking Urban Future)
Map 1.24: Proposals for Study Area II
(Source: Primary)


CCTV Surveillance Community Facility

COMMUNITY LEVEL
THESIS
UNDERSTANDING THE ROLE OF URBAN FORM ON ACHIEVING BETTER SOCIAL SUSTAINABILITY: A CASE STUDY OF BHUBANESWAR
RECOMMENDATIONS
PRITI CHHATOI 1920106033 PROPOSALS AND RECOMMENDATIONS
SHEET NO: 12 PROPOSALS &
SUBMITTED BY
POLICY LEVEL
1 2
