DataViz Guidance_DataViz project 2021

Page 1

Data Viz Design Guidance

A. Color Definition & Use Guidance

A-1. Color Definition

A-2. Use Guidance

A-4.1. Categories

A-4.2.

Diverging

A-4.3. Sequential

A-4.4.

Gradient

A-2. Use Guidance

A-4.5. Point - Line - Area

Appendix A. Color Design Process

AA. Color Definition_Process Overview

Extracting Extending& Adjusting Evaluating

AA-1. Extracting

AA-2. Extending & Adjusting

AA-3. Evaluating

B. Charts Design Guidance in Business Context

B-1. Understanding the Design Process

Define Your Business context

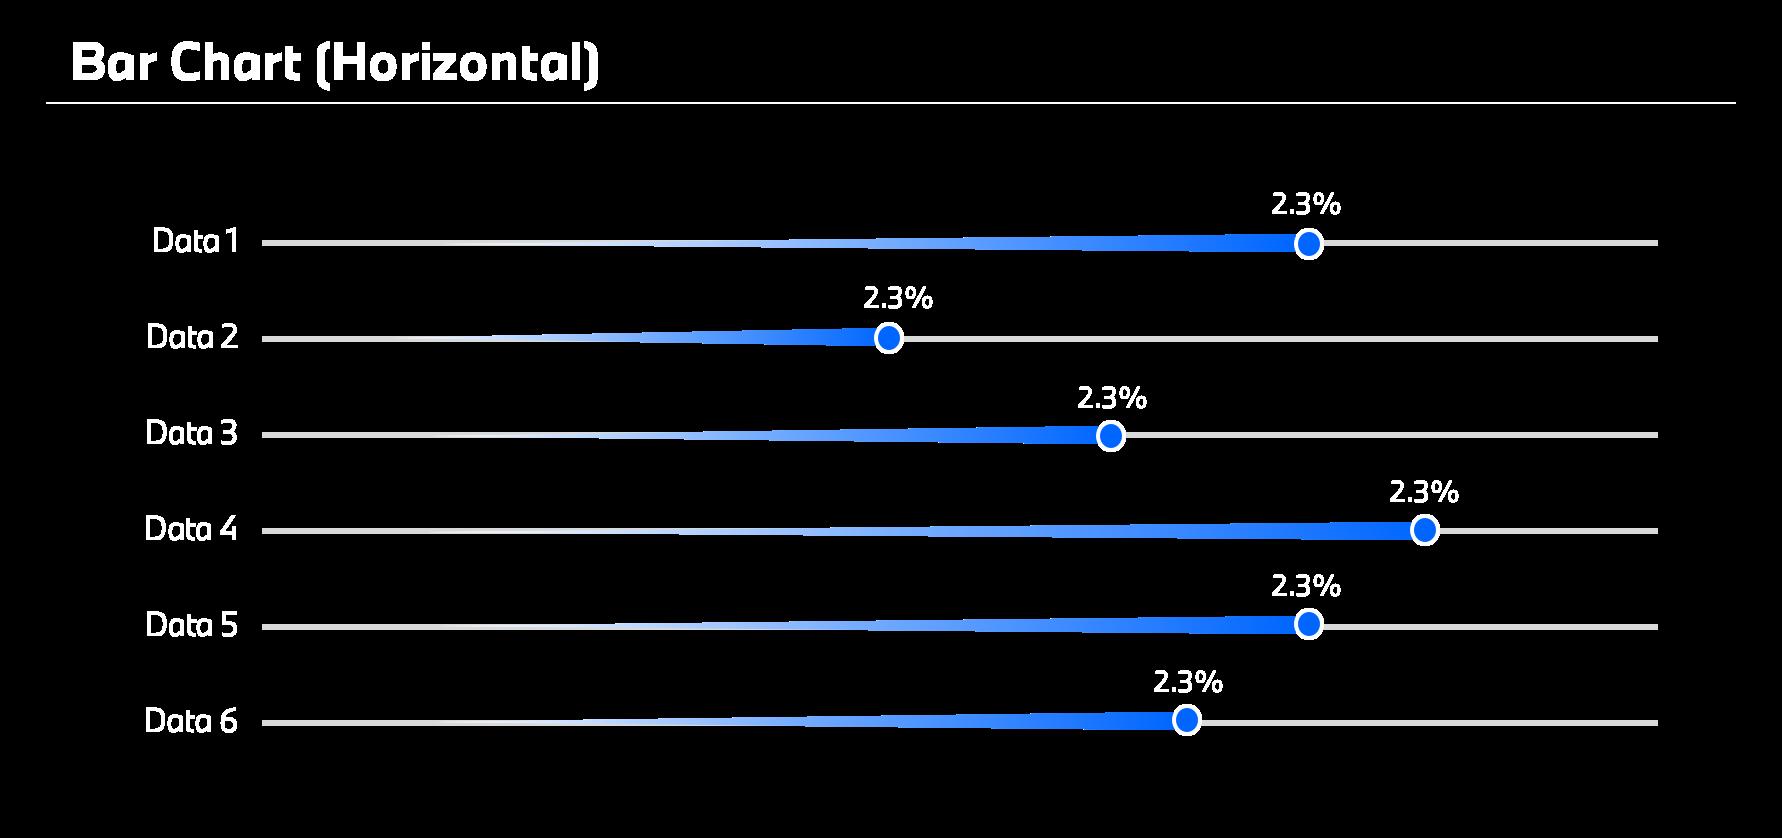
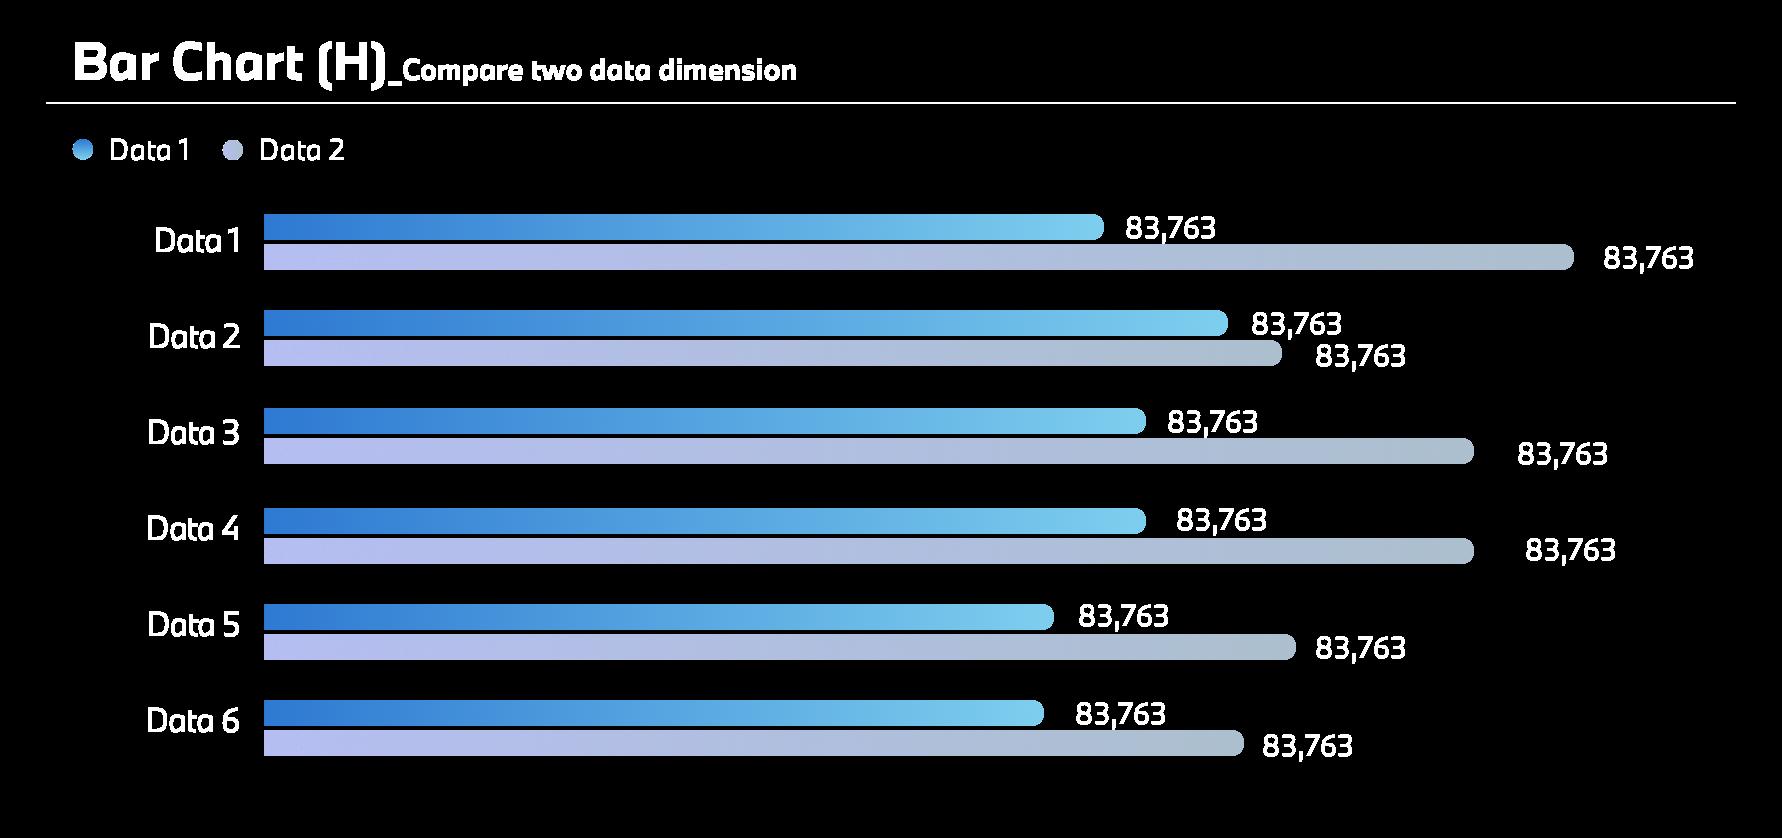
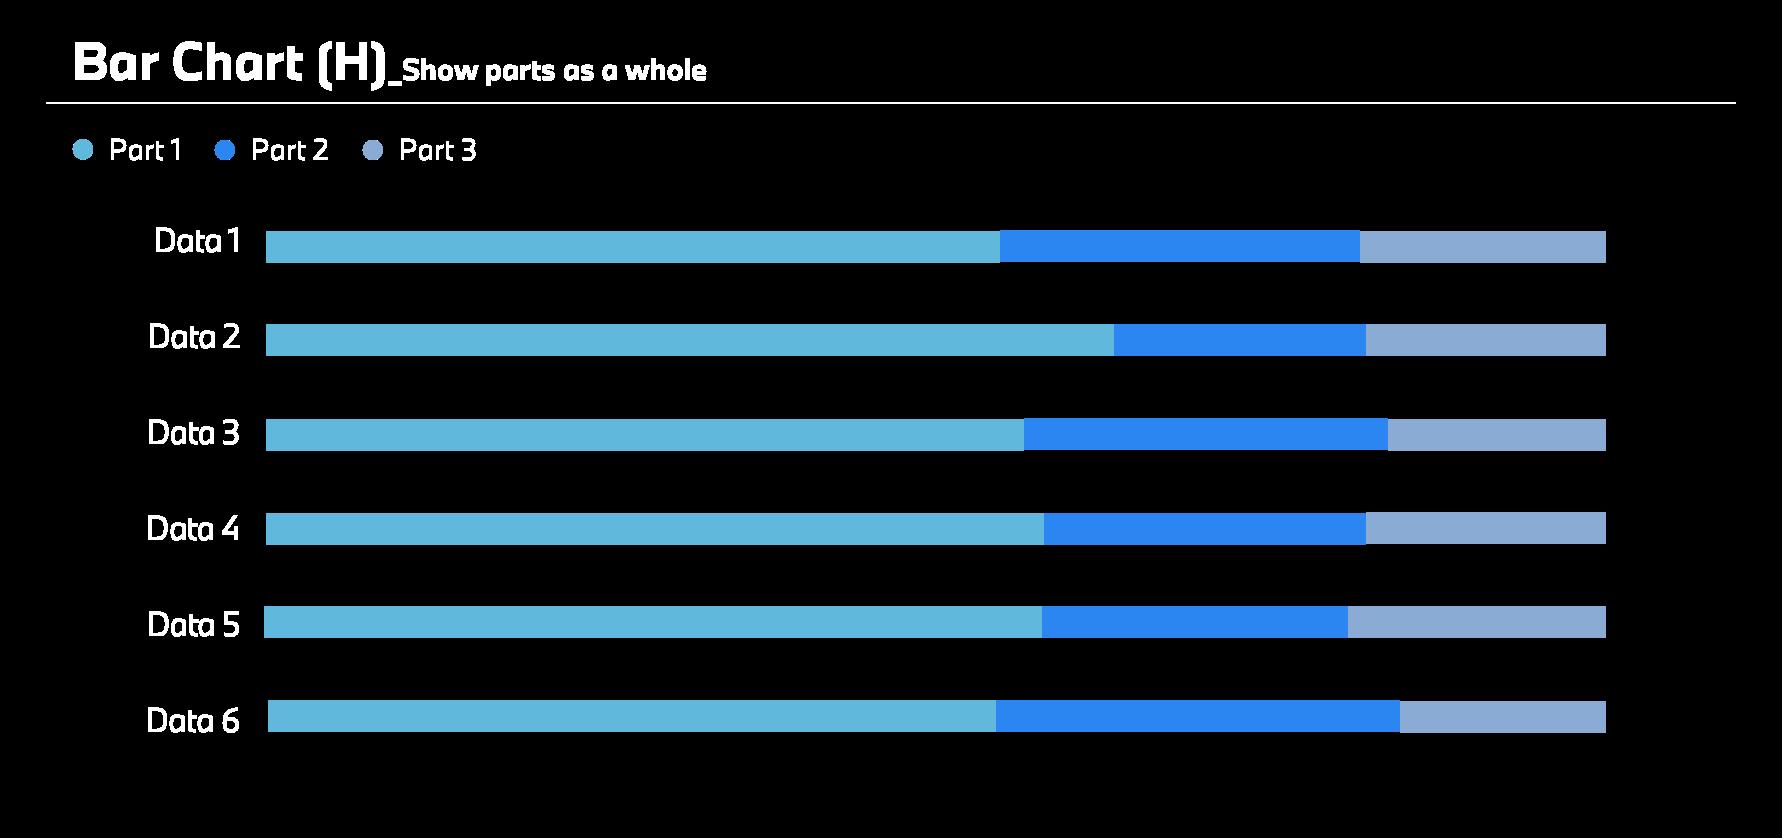
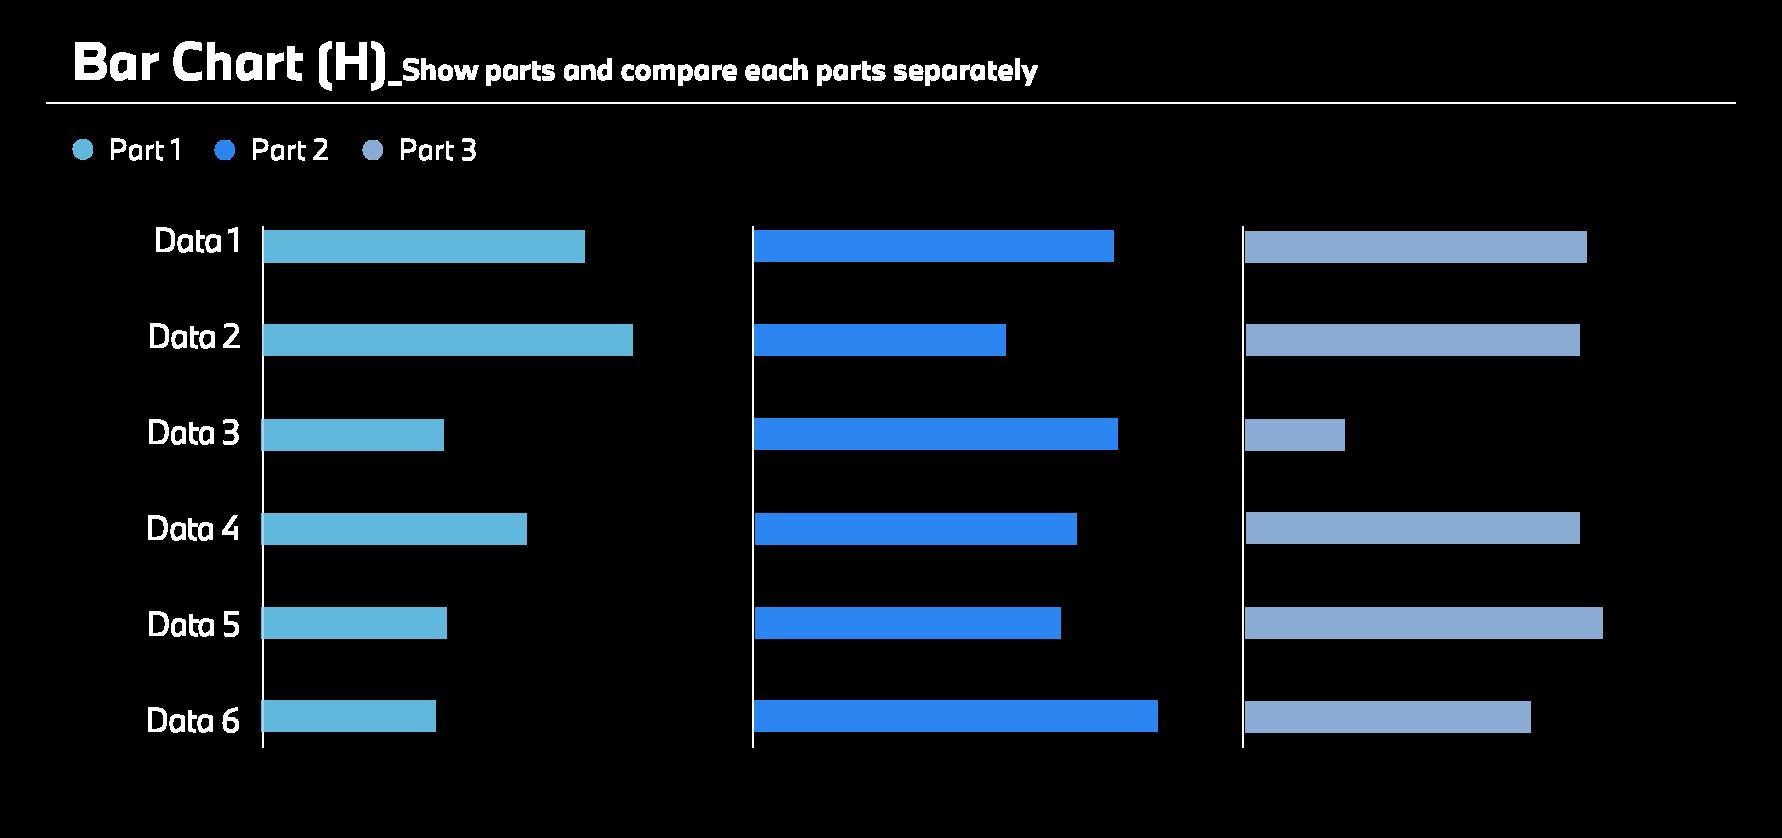
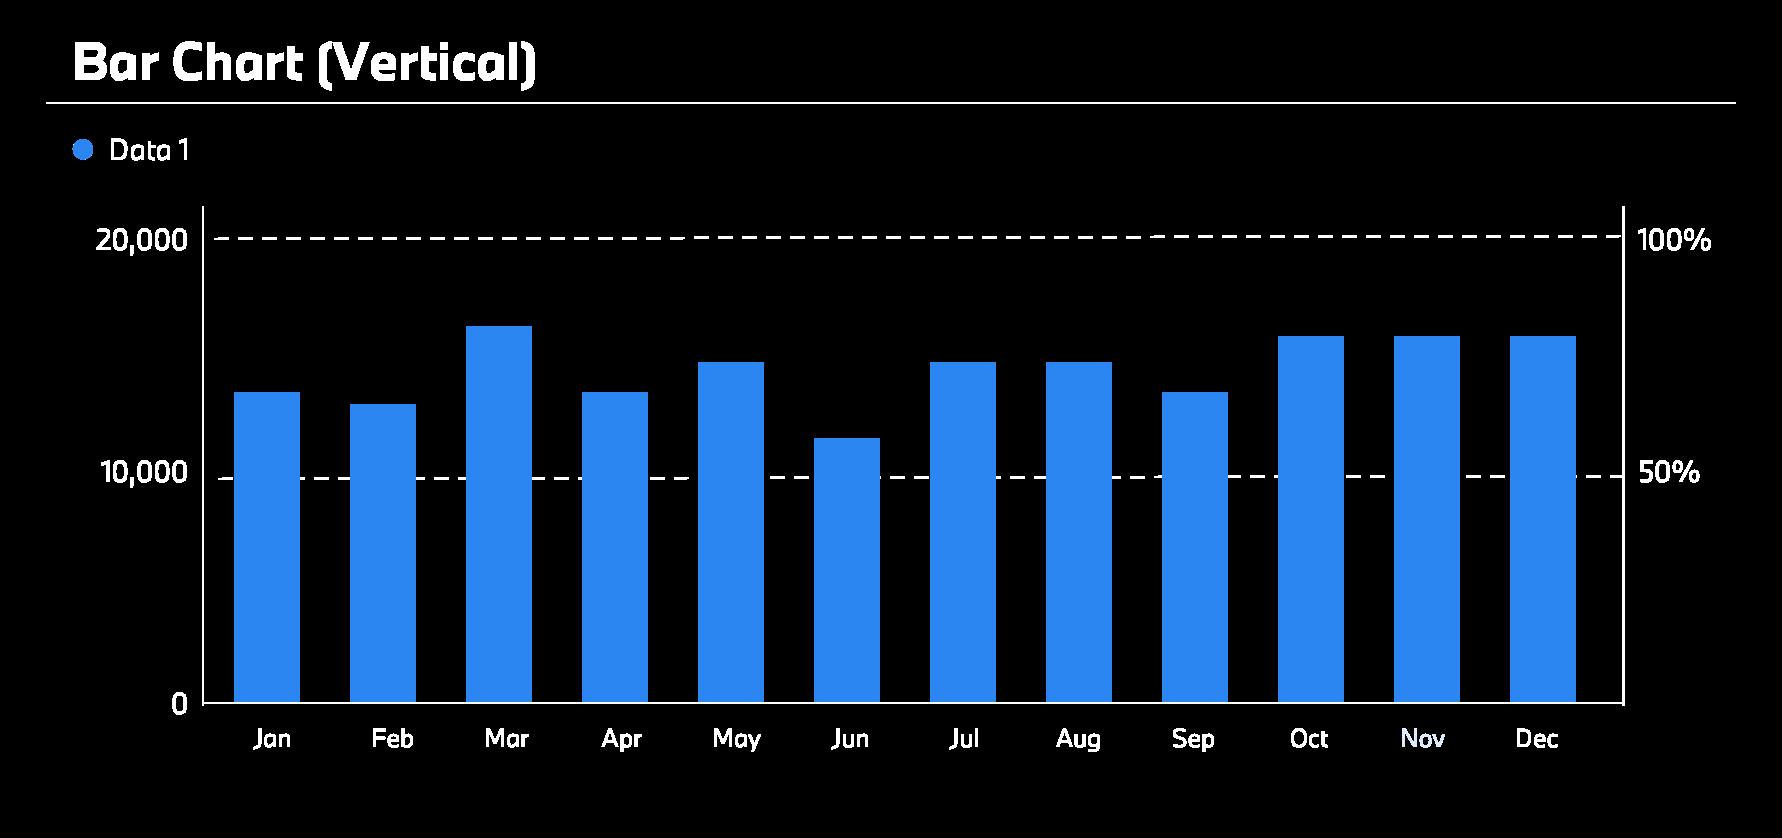
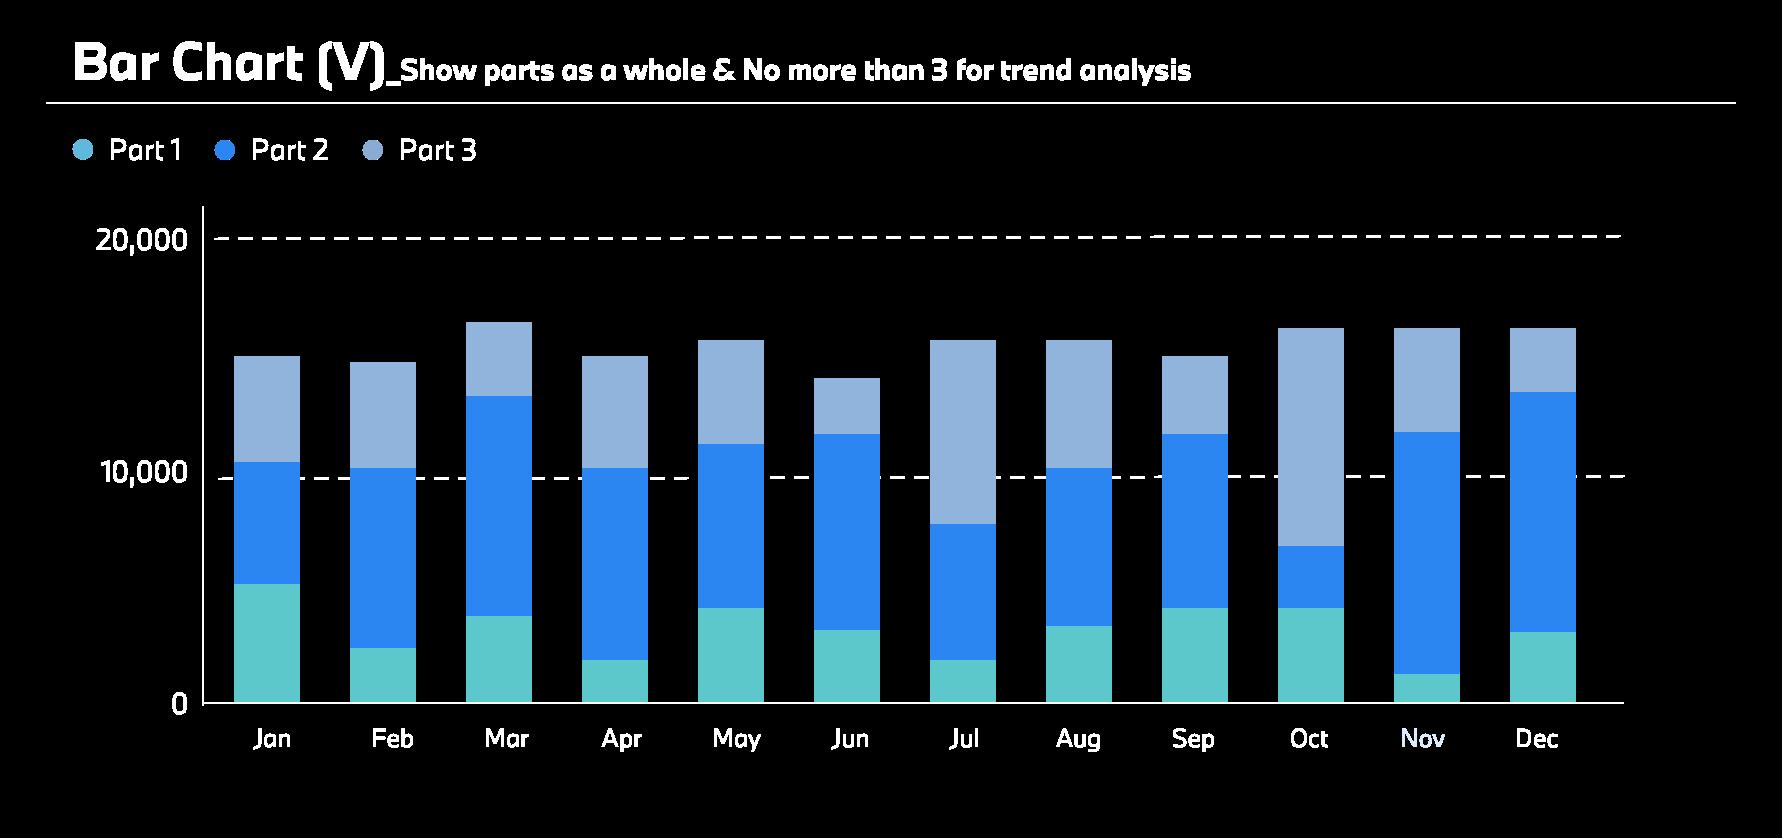
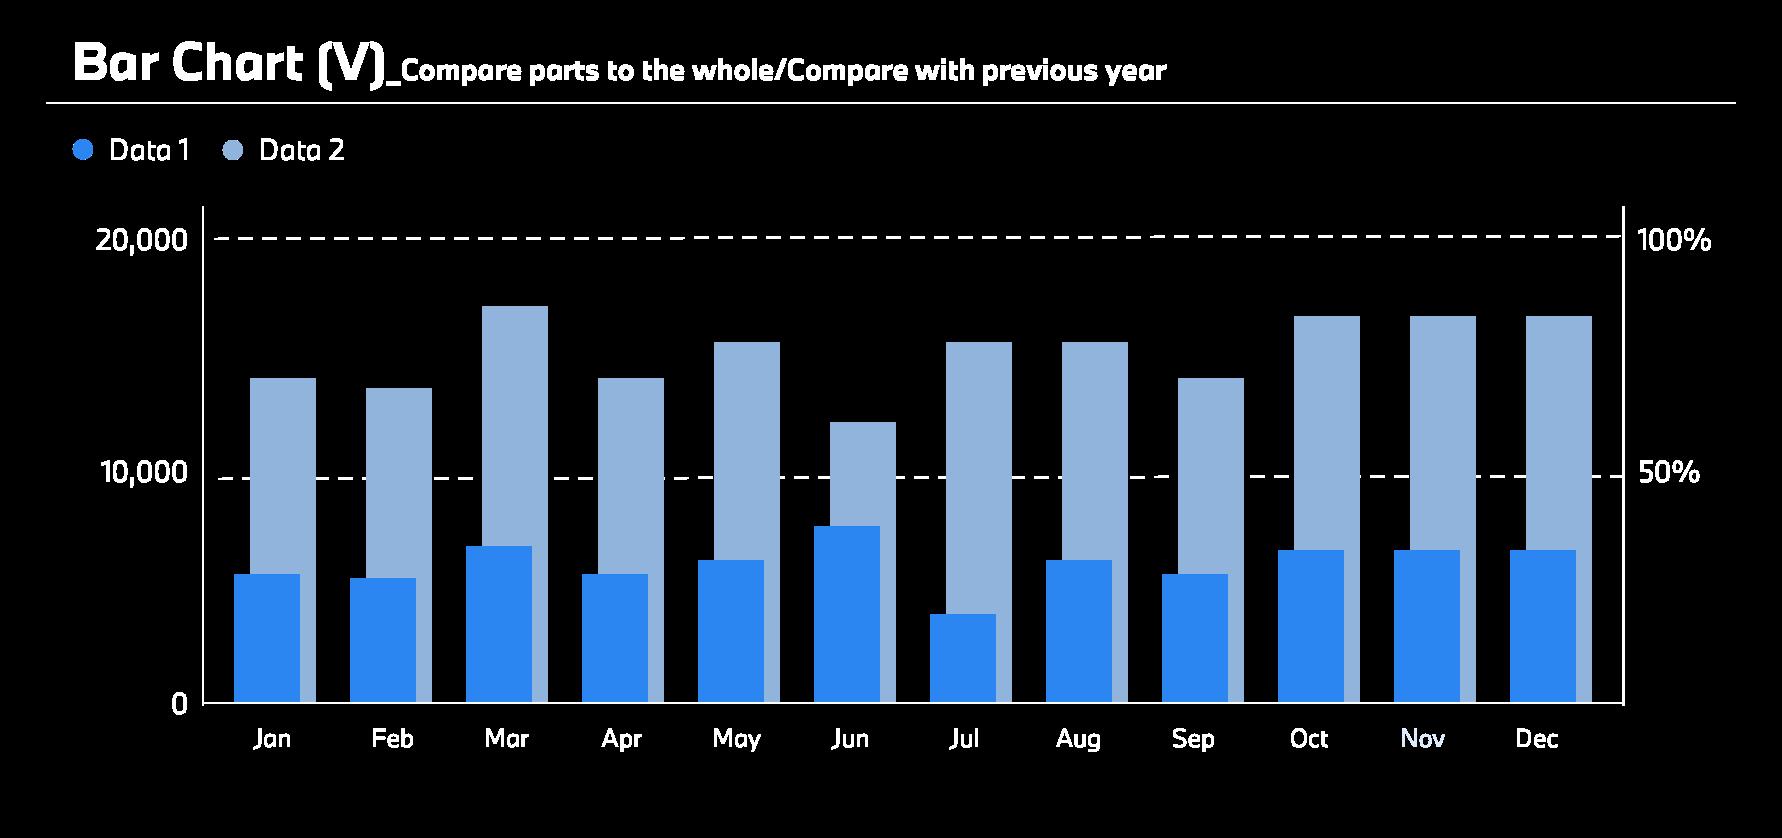
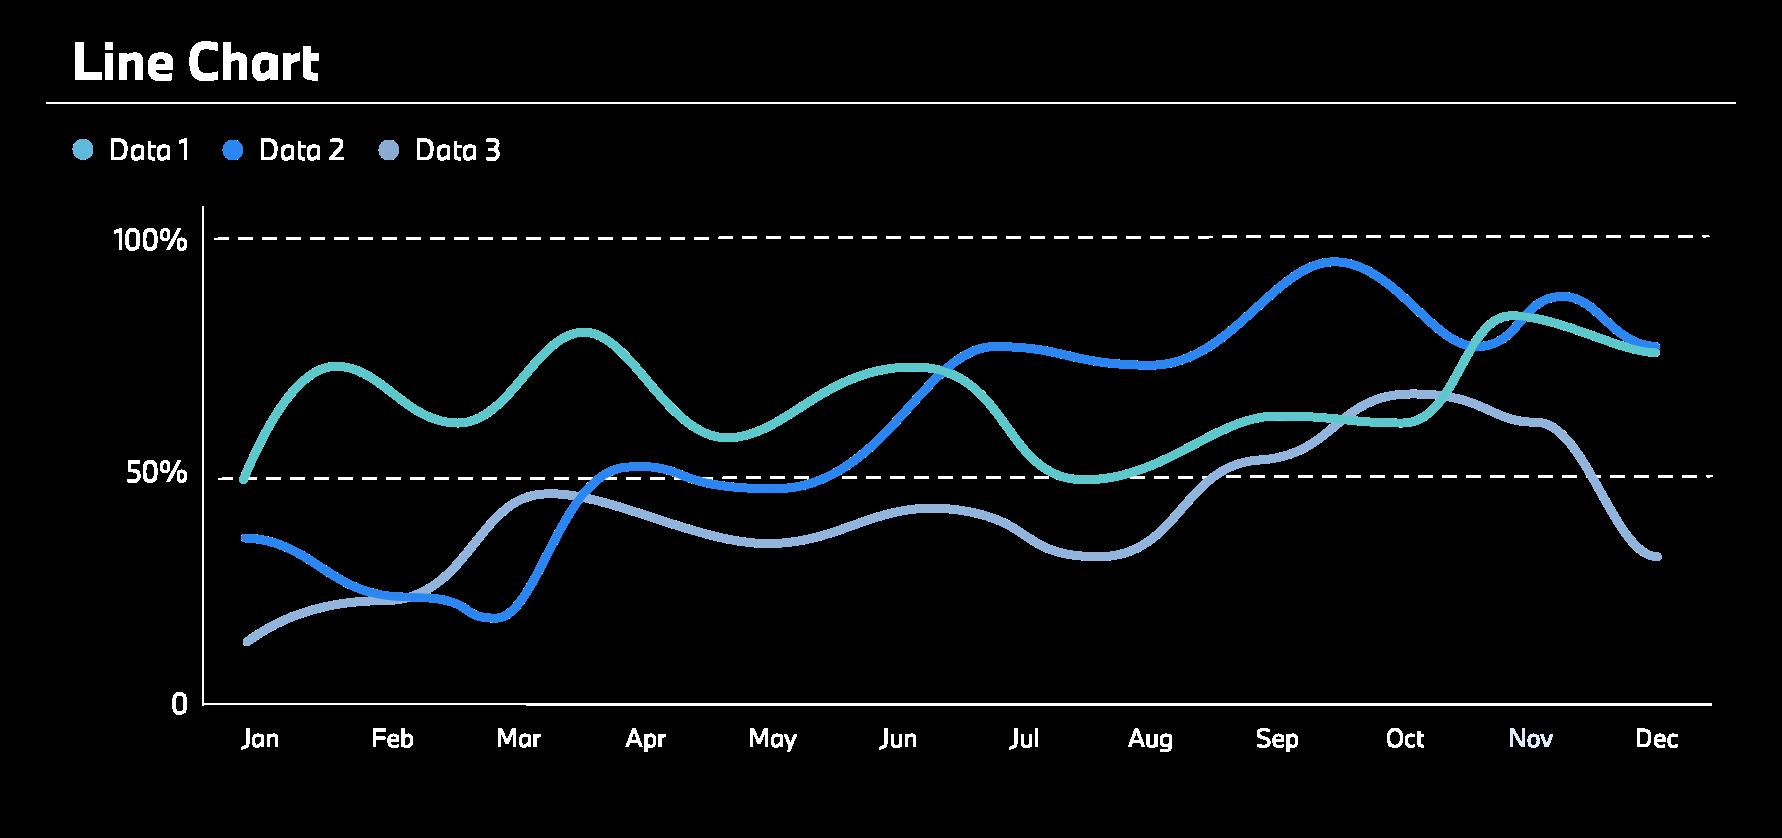
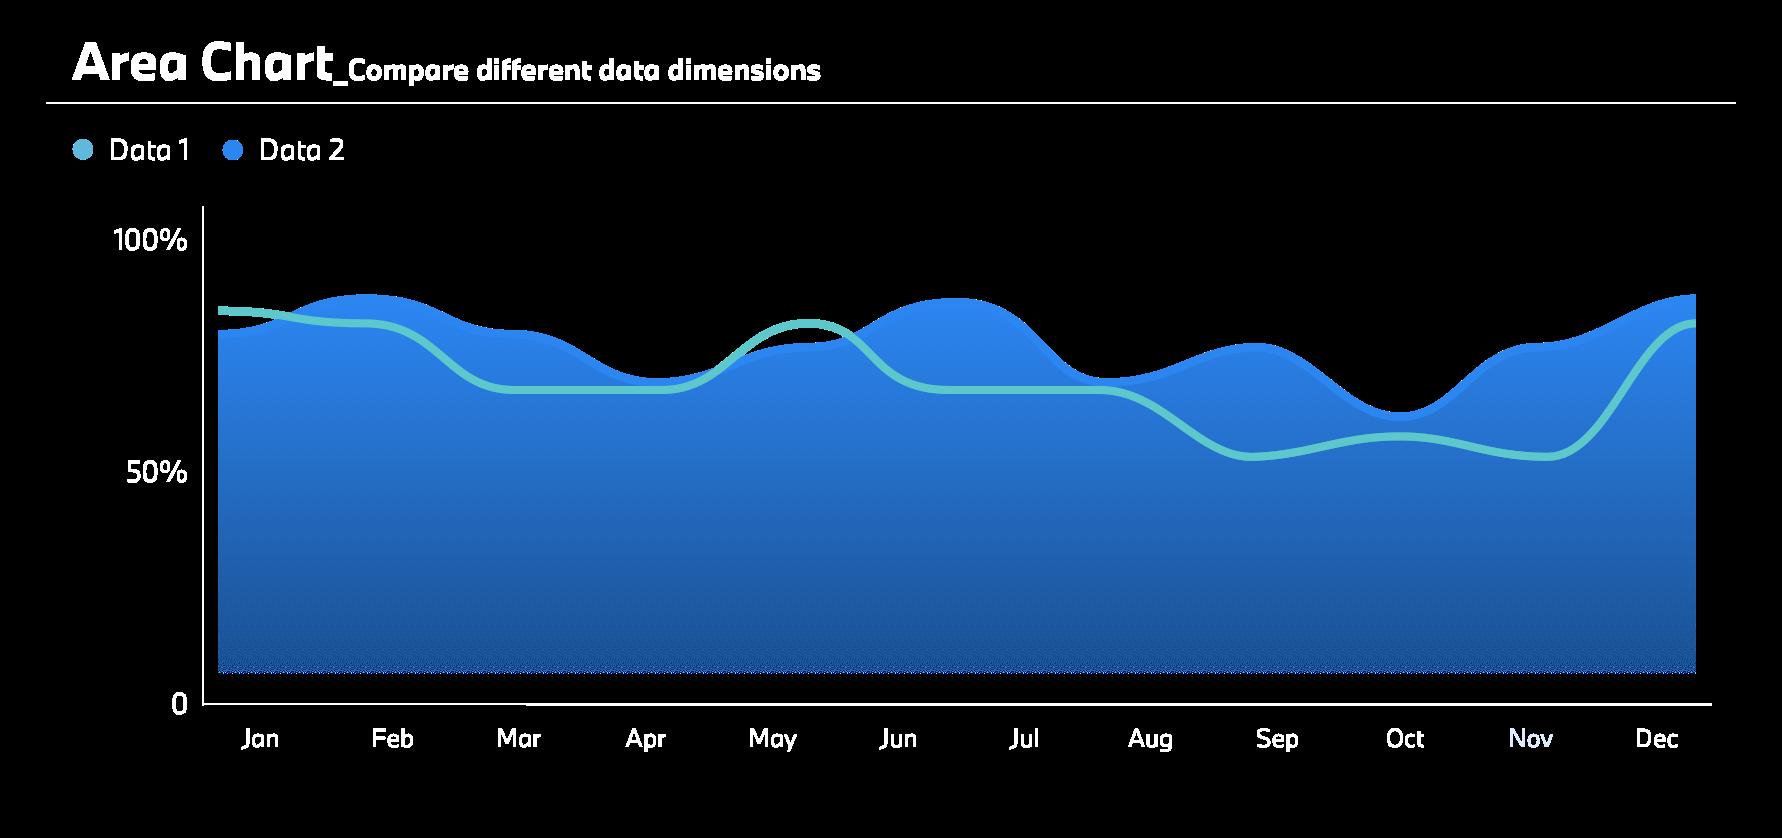
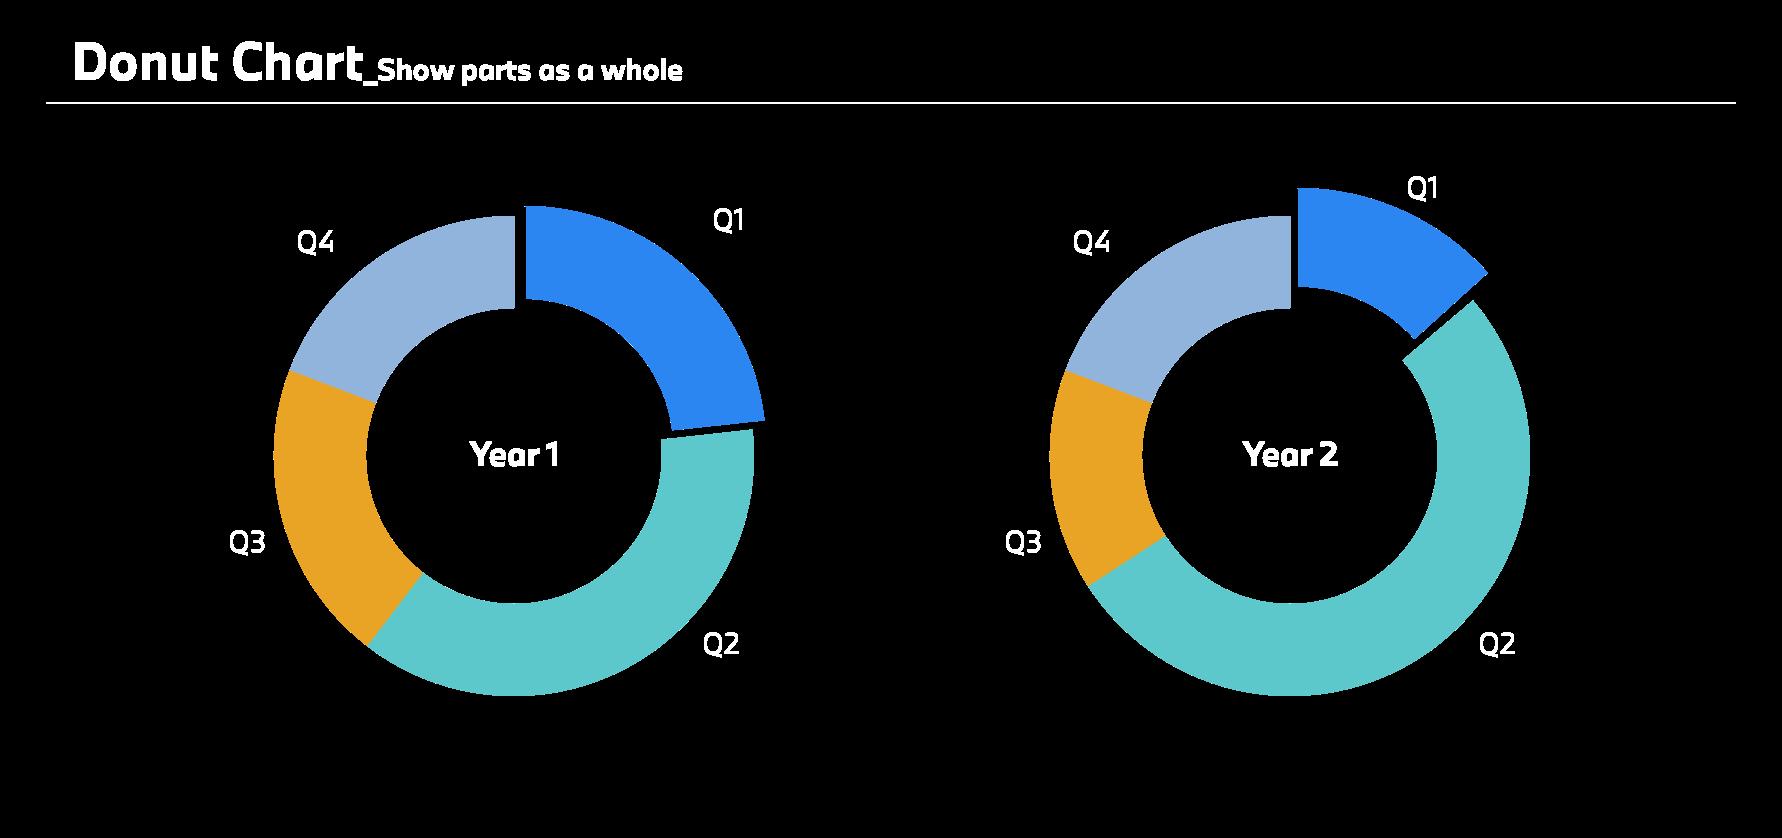
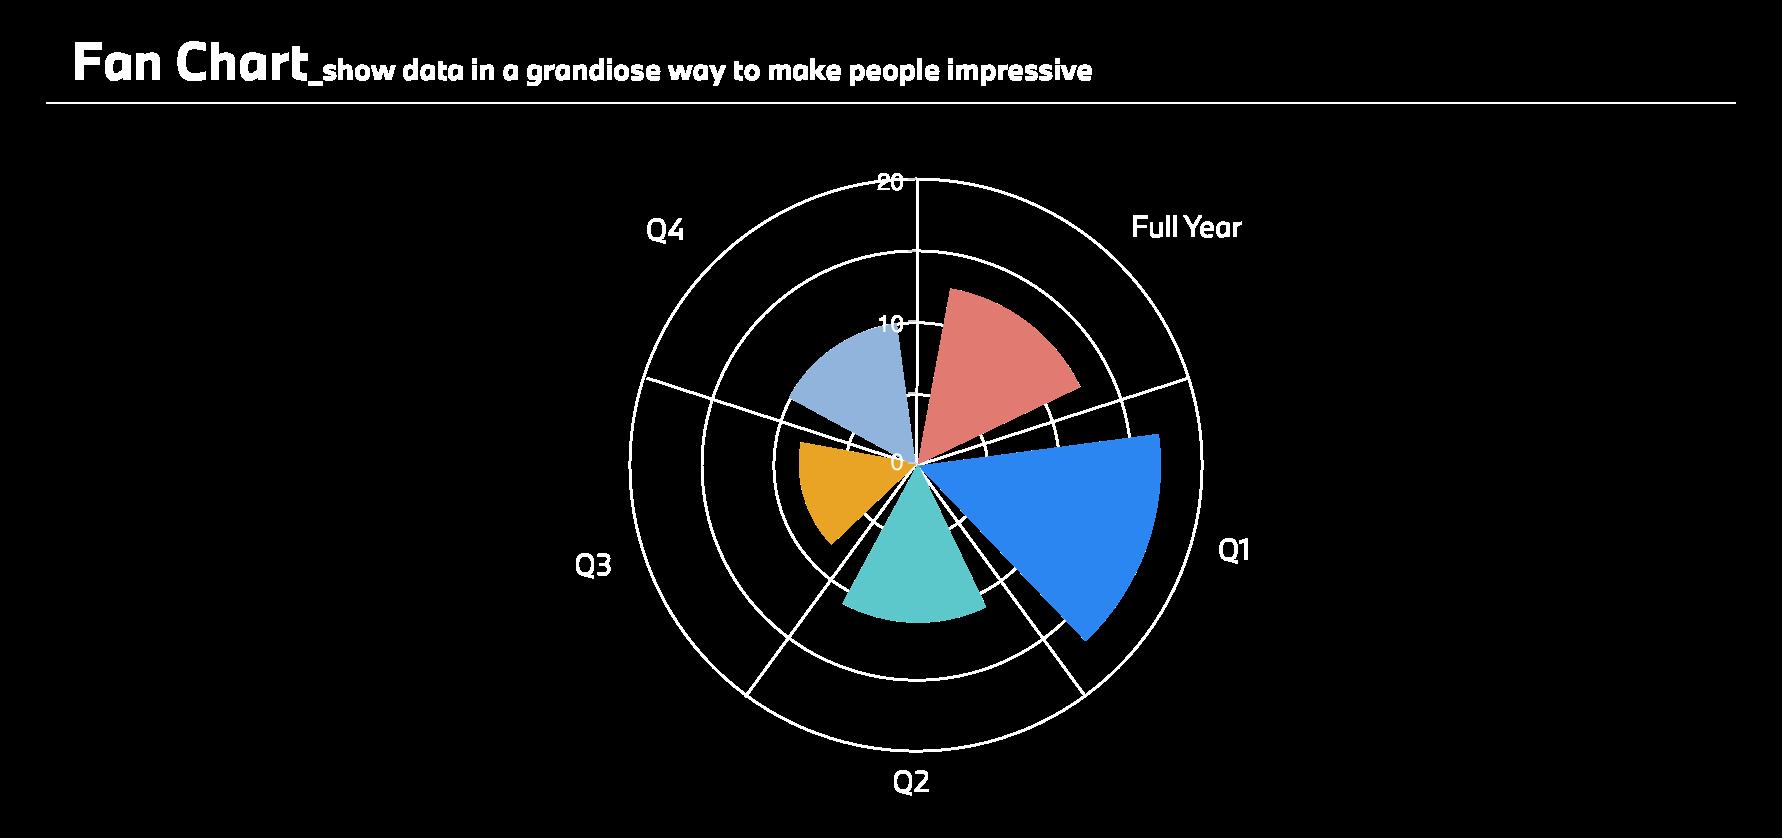
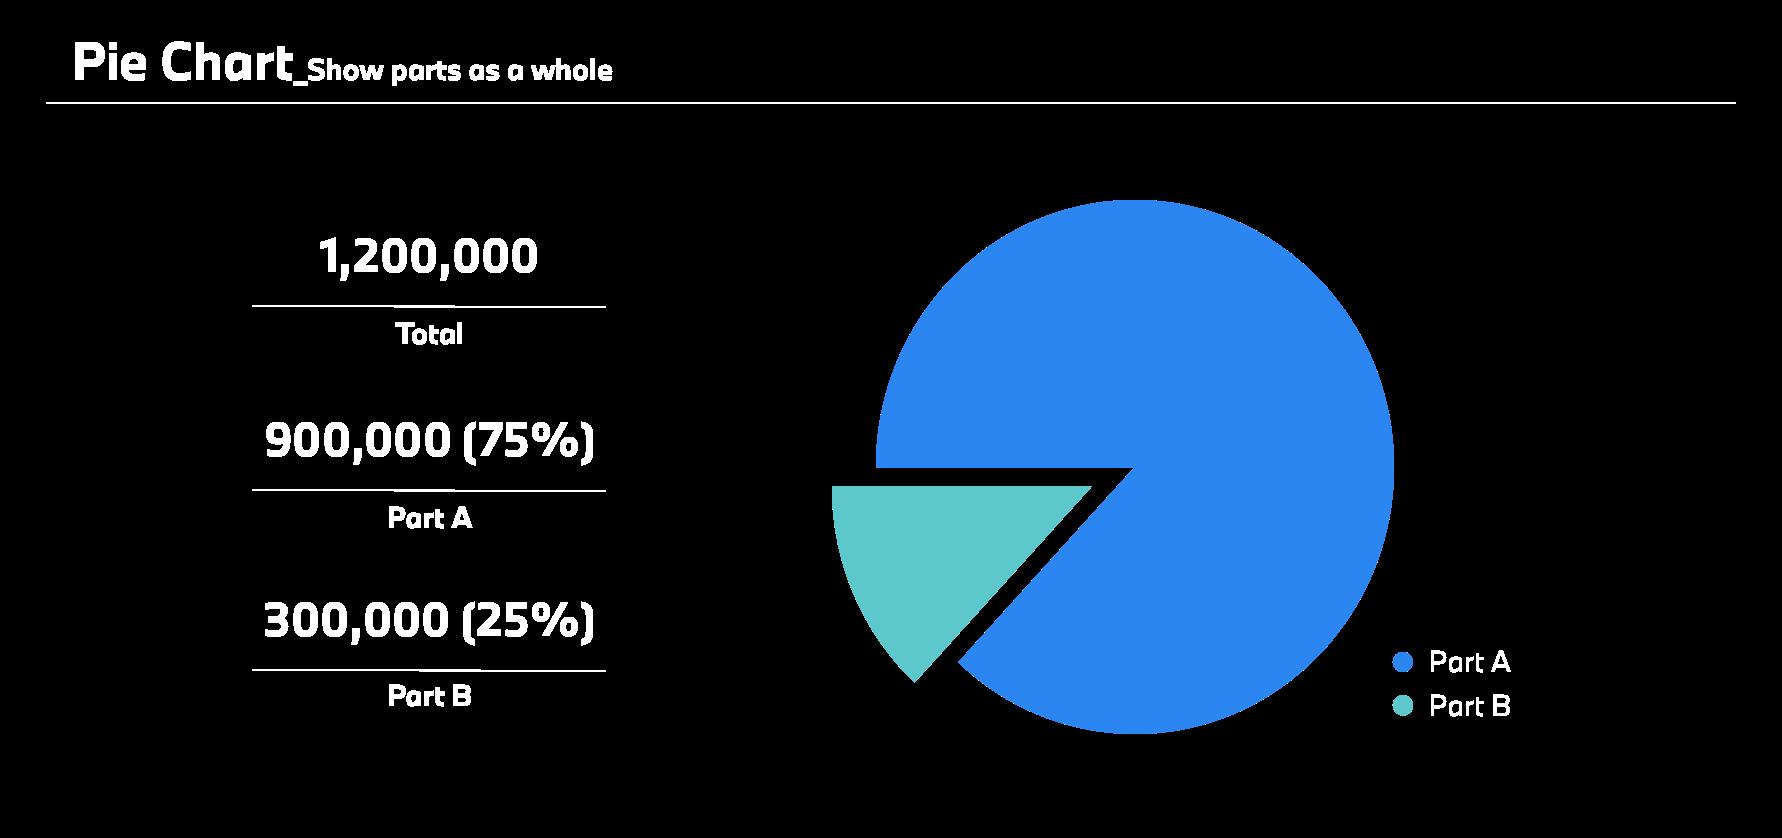
Choose effective visuals

Eliminate Clutter

Give Focus of your graph

Tell the story

Data
Setup
Action

B-2. Step 2 Effective Visuals Guidance

Persuading Impressing Communicating Analyzing

B-3. Step 3 & 4 Clutter & Focus_Design format & Interaction

Value 450

B-4. Before Step 5_Evaluating the Design

What happened?

Why did it happen?

What will happen?

What should we do?

What is my plan?

Appendix B. Common Charts & Functions

AB-1. Bar Chart (Horizontal)

AB-2. Bar Chart (Vertical)

AB-3. Line Chart

AB-4. Area Chart

AB-5. Circle-Shaped Charts

AB-6. Other Charts

AB-6. Other Charts

Turn static files into dynamic content formats.

Create a flipbook
Issuu converts static files into: digital portfolios, online yearbooks, online catalogs, digital photo albums and more. Sign up and create your flipbook.