ABBREVIATED PORTFOLIO
CHASE KEA
supports targeting future growth into centers and multi recommendations from the BCDCOG’s Regional Transit Framework Plan that call for a High Transit (HCT) network to advance the region’s vision.

supports targeting future growth into centers and multi recommendations from the BCDCOG’s Regional Transit Framework Plan that call for a High Transit (HCT) network to advance the region’s vision.
This report provides guidance for local governments, the private sector, community groups, BCDCOG, and other stakeholders to support the implementation of TOD in the LCRT corridor over time. The report includes:
PREPARED BY:
• TOD design principles and TOD Placetypes
• Station area profiles
• TOD implementation strategies
The recommendations in this report reflect technical and design analysis as well as feedback and insights gleaned from engagement with the public, local government staff, members of the development community, and the LCRT TOD Steering Committee from the fall of 2019 to the spring of 2021.
September 30, 2020


The River House

Urban Design
Adaptive Reuse Hospital Reuse Feasibility Study

Oriented Development Study

Lorton Visioning Core Study

2070 Land Use Scenario Development


Freehand sketches Digital illustrations NEXTransit Long Range Transportation Plan


The meaning of a home is determined not by the way it looks - a window with a funny shape, a set of columns at the front door, a tiled roof, etc - but rather by the experiences of those who live there or visit. In this renovation, located on the Allegheny River three miles upriver from the city of Pittsburgh, we have combined several strategies that we feel will create a set of memorable experiences. Our first choice was to preserve the load bearing masonry ground floor but demolish - and subsequently rebuild - the insubstantial 2x4 framed building above. The second was to clad the new volumes in Cor10 steel, providing a colorful, tough, industrial look that relates to Pittsburgh’s storied past.


Before
Before
We wanted to preserve the loadbearing masonry ground floor but demolish - and subsequently rebuild - the insubstantial 2x4 framed building above
We wanted to preserve the loadbearing masonry ground floor but demolish - and subsequently rebuild - the insubstantial 2x4 framed building above
to preserve the load bearing masonry ground floor but demolish - and subsequently rebuild - the insubstantial 2x4 framed building above
The new volume was clad in Cor10 steel, providing a colorful, tough, industrial look that relates to Pittsburgh’s storied past
The new volume was clad in Cor10 steel, providing a colorful, tough, industrial look that relates to Pittsburgh’s storied past
The new volume was clad in Cor10 steel, providing a colorful, tough, industrial look that relates to Pittsburgh’s storied past


RENDERING SHOWING RELATIONSHIP TO HILLSIDE


The “3-D Visualization Project” was a research project led by CMU’s Remaking Cities Institute (RCI), partnering internally with the School of Architecture, Heinz College of Information Systems and Public Policy, the Entertainment Technology Center, the School of Design and externally with the Department of City Planning of the City of Pittsburgh.
The Master of Urban Design (MUD) program tested the prototype and other 3D and virtual reality software on the same Baum-Centre business district. The MUD urban systems studio applied the 3D software to a series of data and design projects, including virtual reality placemaking, that the research team identified as potentially useful for urban and city planning. After the testing, the CMU research team worked with Pittsburgh City Planning to decide what software is most useful for various scenarios.

DESIGN WORKFLOW DIAGRAM


Figure 5.2 – Three of the final seven intersection designs
There were several outcomes of the testing that were not software specific. Collaboration was the most significant issue for the students. Few of the design-oriented programs allowed file sharing. This was a problem as almost all the assignments were conducted by teams of two or the entire studio. Modeling multiple buildings for an urban setting, detailing basic massing-model form (adding textures), and geo-locating them into location-specific base maps or 3D sites is an arduous and time-consuming process. When using the typical go-to modeling platforms (Revit, Rhino, SketchUp) each building is a separate file void of geospatial information. 3D software, including both geospatial and 3D modeling platforms, are not collaborative tools. Design tasks are viewed by the software industry as a singular user experience, but urban designers and city

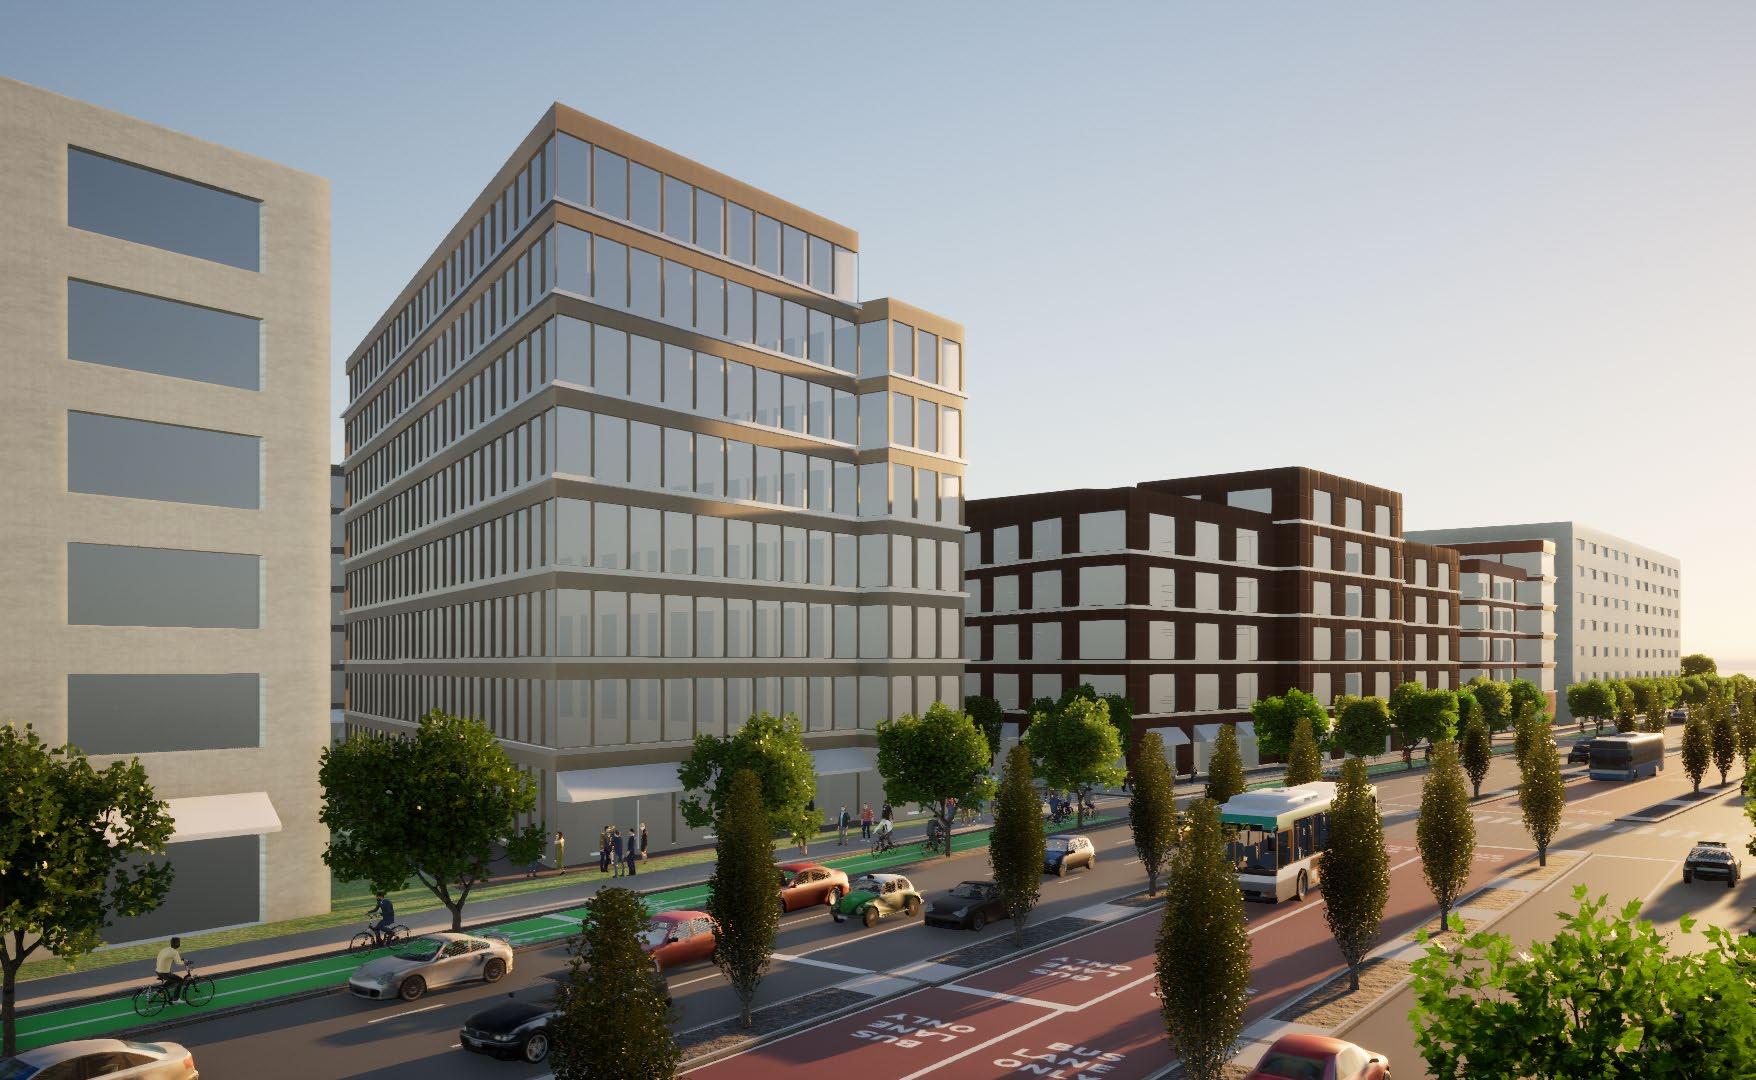
As part of the LCRT TOD Planning efforts, the team conducted a site feasibility analysis for Joint Development on three separate publicly owned parcels adjacent to the proposed Mt. Pleasant Station. The analysis involved a review of existing zoning regulations and concepts for mixed use development inclusive of workforce and market rate housing, ground floor retail, structured parking and public realm improvements. The assessment included multiple scenarios to assess the viability of different program configurations of each site to determine the total number of buildable units, parking spaces and square footage of retail. This assessment will be used to guide developer proposals for the joint development project.


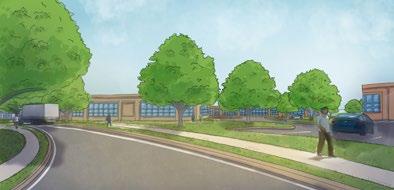
The Mt. Pleasant Station presents an opportunity to advance TOD and notably improve the bicycle and pedestrian conditions within the area. The station area concept plans illustrate some of these key design concepts. Moving forward, the priority TOD strategies at Mt. Pleasant include:
• Conducting a more detailed station area planning process to identify key opportunities for improvements to the bicycle and pedestrian conditions to better connect with the Lowline and altogether improve walk access to nearby neighborhoods
• Continued infill of housing while maintaining a ratio of 20% affordable units

• Further study to assess the publicprivate Joint Development opportunity at the Hop Lot site to include mixed- use development and structured parking
• Significant traffic calming of King Street and major improvements to the Mt. Pleasant Street intersection to better connect the station area ‘island’ to points south, east, and west
Compilation of photos from December 2019 LCRT public workshops in Summerville, North Charleston and Charleston where participants located stations and designated TOD Placetypes along the corridor
• Additional neighborhood level planning and visioning to engage local residents and other property owners in advancing TOD urban patterns of infill in the area

The station area is designated as a Town Center. It has just under 500 units of existing affordable housing units, making it almost 20% affordable. Recent development in the area includes higher density residential and additional non-residential infill to the south. The publicly owned property where the station and Hop Lot will be located presents an opportunity for Joint Development, and more than 200 acres of land are also available to the north. While this area is challenged by the breakdown of the urban grid, the larger sized parcels do present transformational opportunities for the long- term transition into a more walkable, mixed-use, and higher density node.
General Town Center Place Type Targets

4 -8 stories 20 du/acre (min)
4,000 jobs
4,000 households
ILLUSTRATION SHOWING THE RELATIONSHIP OF THE SITE TO


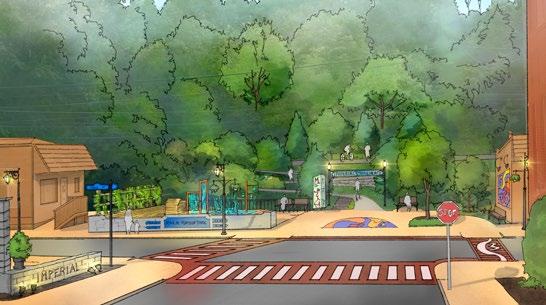
The Lowline is a proposed major public-private project for the City of Charleston to reclaim 1.7 miles of abandoned railway track running parallel to the LCRT corridor between King and Meeting Streets from Marion Square to the Mt. Pleasant Street station. It will include a linear park and multi-use trail establishing notable green infrastructure that will provide enhanced east-west neighborhood connections and provide an alternative off-road walking and biking route through the center of the Peninsula. As of 2021, the project remains in the planning and funding stages. In addition to the linear park amenities and improved bicycle and pedestrian connections, Lowline has the potential to further catalyze infill and redevelopment, along this stretch of the LCRT corridor.
The city has made bicycle and pedestrian safety, convenience and accommodation a major priority. The City’s Transportation Plan, the People Pedal Plan and a recent downtown Parking Study all promote more non-auto use. A key goal of the People Pedal Plan is to utilize bicycles as a fundamental part of the transportation system on the Peninsula with stated goals: “to alleviate traffic congestion, 12% of all trips downtown should be made by bicycle - a big change from our current “mode share” of only 2.5%.” To accomplish this goal, the plan calls for the establishment of a robust network of urban bikeways throughout the Peninsula. As part of the LCRT planning effort, detailed recommendations for specific improvement projects include notable enhancements along the LCRT route as documented in the LCRT Walking & Bicycling Access to Stations report (Draft, 2021).


Conceptual rendering of the Lowline (www.lowcountrylowline.org)


This study was initiated and requested by the City of Allentown. As a member of the Lehigh Valley Land Recycling Initiative (LVLRI), the City of Allentown requested funding for this Reuse Feasibility Study in order to guide future redevelopment plans and accelerate development on the ASH site. The City of Allentown intends to utilize this study as a resource when considering development plans, rezoning requests and fielding concerns from community members. This study was funded through a 2016 United States Environmental Protection Agency’s (USEPA) Brown field Assessment Grant received by the LVLRI and the Lehigh Valley Economic Development Corporation (LVEDC). The utilization of USEPA funding for reuse planning has a strong history of catalyzing redevelopment and leveraging significant implementation investment from both the public and private sectors. Further, the investment in this study creates forward momentum towards job creation, tax revenue generation, and community revitalization.

critical component of this study, and phases of the study development phases of the study, one-on-one wide array of local and regional government and other public agencies, development providers, and area interviews were conducted through a municipal and economic development were helpful to gather the following supplement community input:
real estate for high value offices. The street grid creates coherent development parcels,

neighborhood center with retail located along Hanover Avenue, surrounded by blocks of residential units, small offices, or a mix of both.

Table 2 provides a collective summary of the overarching themes that resulted from these interviews. During a latter phase of the study stakeholder engagement included exploration of plan concepts for three development scenarios, the results of which are described in the Visioning Process section of this report. The Visioning Process included a design workshop held virtually via Zoom due to concerns regarding the current COVID-19 pandemic. Participation was robust and consistent over the two-day workshop, and the goals of the workshop were accomplished.


Interactive virtual public engagement meeting. The concepts above were discussed and sketched during the meetings, creating a series of potential concepts developed with community and stakeholders input.
The Grand Boulevard concept balances neighborhood and commercial uses. It portrays the most development but will require substantial regrading to achieve.
The Urban Plaza concept balances neighborhood and commercial uses. It maximizes development in the most feasible areas but avoids major regrading that only supports small areas.
The Town Square concept prioritizes connecting with surrounding neighborhoods and keeps the largest area of preserved open space.
The Grand Boulevard concept balances neighborhood and commercial uses. It portrays the most development but will require substantial regrading to achieve.

The Urban Plaza concept balances neighborhood and commercial uses. It maximizes development in the most feasible areas but avoids major regrading that only supports small areas.


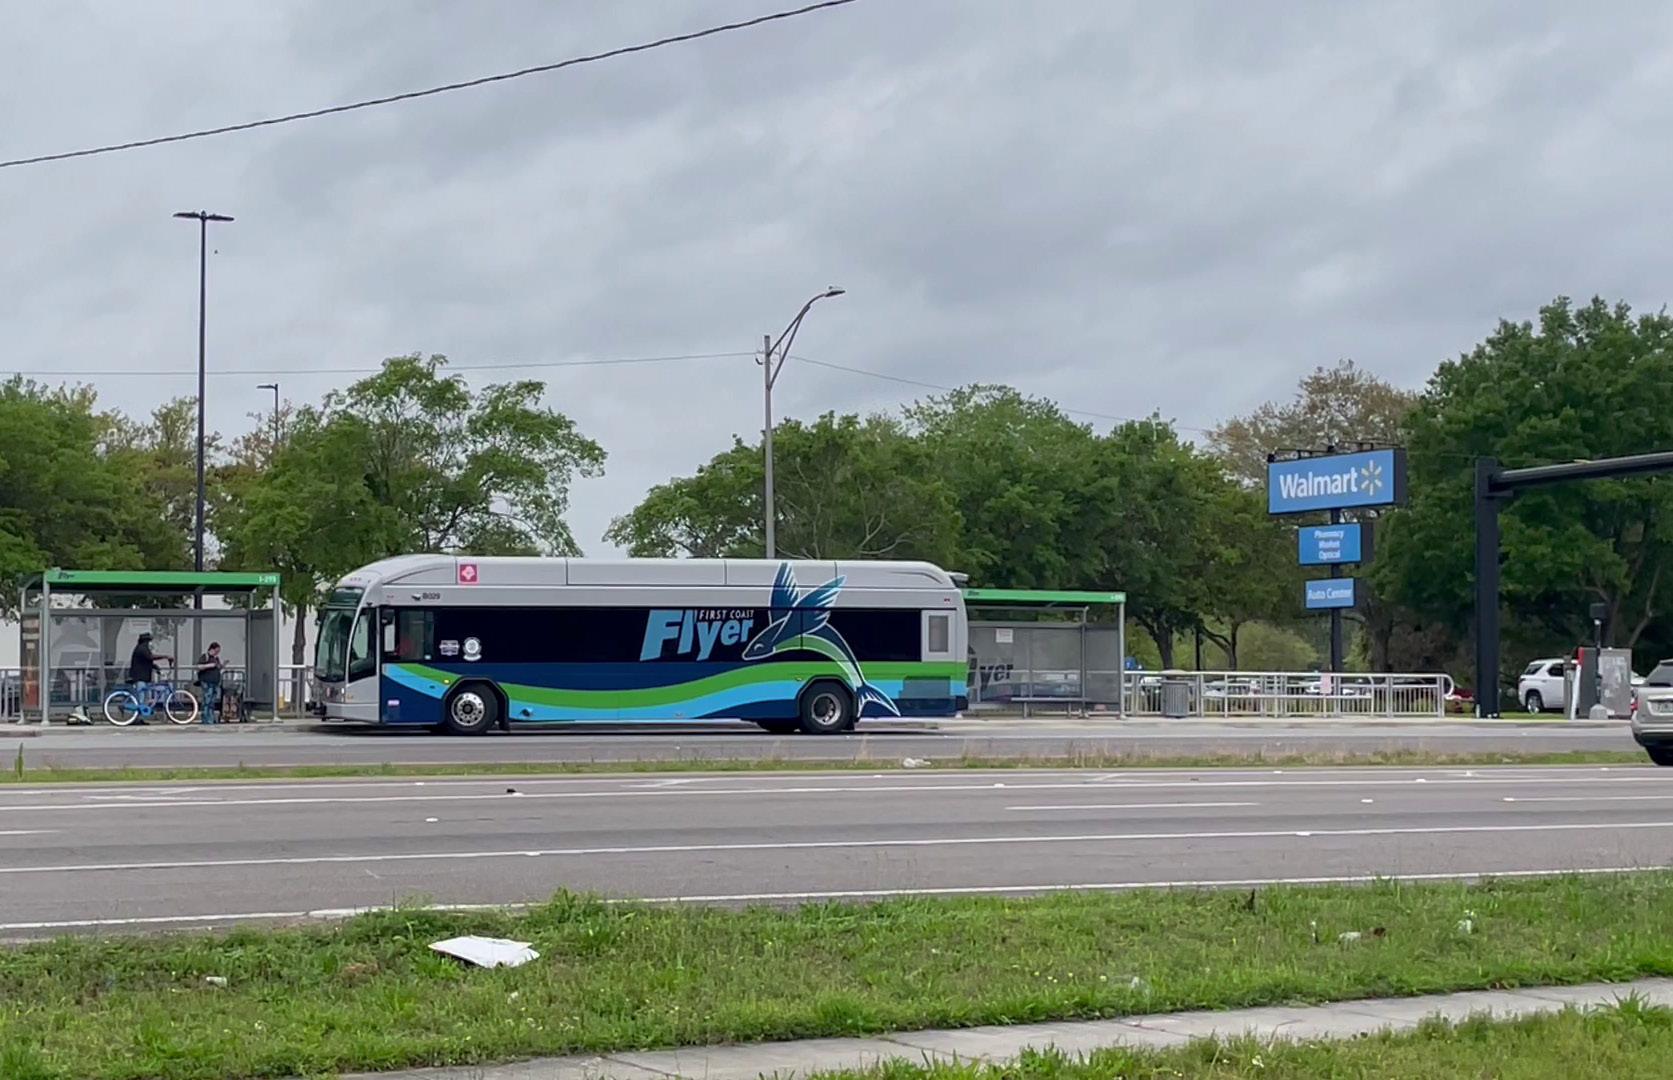
The purpose of the Northwest Jacksonville Connects Green Line Transit Oriented Development (TOD) Study has been to identify how integrating transportation and land use investments along the Green Line corridor can foster sustainable growth through innovative TOD. With positive momentum, JTA is building partnerships for new investments and seeking new funding opportunities that will continue to move the needle toward improved housing, more jobs, business opportunities, and other mixed-use Transit Oriented Development solutions along the Green Line corridor. Funded by a Federal Transit Administration (FTA) TOD grant, this study focused on development strategies for communitybuilding and reinvestment around each of the Bus Rapid Transit (BRT) station areas along the Green Line.
Lem Turner/I-295 station area (southbound) within the Capper-Armsdale Subarea


The Jacksonville Transportation Authority (JTA) Green Line Transit Oriented Development (TOD) Study conducted planning and public engagement activities from 2021 –2023. Public workshops were held in evening and weekend sessions at various station area locations along the study corridor. Additional outreach activities included individual briefings, engagement events, and stakeholder meetings. This appendix includes key insights gleaned from the community engagement activities that informed the strategies recommended in the Study’s Final Report.


Below are some of the goals and ideas that were developed with community members and stakeholders during engagement:
Fill the stations with more people
Break up subsidized housing
Bring back key destinations
Gateway as key community center
Small business incubation
Safer neighborhoods and walkable
• Training for jobs

Public Sector Intervention for TOD
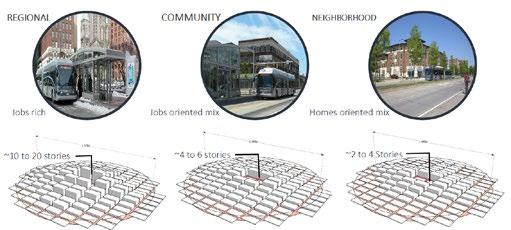
This chapter describes the overall vision of TOD for the Green Line and presents potential strategies for achieving the vision. It suggests TOD key features necessary to create more sustainable change for the betterment of community residents and businesses, with input provided from these stakeholders as detailed in Appendix C – Engagement Summary. Sample design concepts show how some stations could redevelop over time, and are presented for illustrative purposes to demonstrate the potential of creating more walkable, mixed-use centers of activity around station areas reflecting the different TOD placeAppendix D – TOD Goals, Targets, and Typologies offer a framework for these concepts. Subareas may have different levels of design detail, or include phasing options. It is worth noting that the subareas evolved over the life of this project, so appear slightly different below than in Appendix A – Existing
Create Corridor Coalition(s)


→ Convene, Share Knowledge, and Build Partnerships Across Public, Private, and Non-Profit Sectors.
Support Sustainable Development
Phase 1
→ Coordinate Economic Development (job attraction, retention, and growth) and Workforce Development (training and placement) with an emphasis on retaining, growing, and attracting business while also Improving Sustainable Environmental Practices and Outcomes.
enhancements to existing parks and green infrastructure projects to establish strong linear green network

Transit oriented development requires the combination of public sector policy making, private sector investments, and public buy-in to support changes to existing places. The engagement strategy for the JTA TOD Green Line included targeted discussions with neighborhoods near station areas, local partners, and other key stakeholders potential for TOD within each station area.
Create TOD Plans & Policies
existing subsidized housing with modern units and additional market rate, mixed income housing
→ Adopt TOD Land Use Policies to Change Built Form and Align Public and Private Sector Infrastructure Investments.
Each subarea has strategies organized by topic. Settlement include urban, suburban, and varying levels of density. address land use and partnership Environmental strategies can capitalize on redevelopment opportunities to improve resiliency and support Transportation strategies can help improve bicycle and pedestrian accessibility, safety, and parking. Transformation are an optional topic that may include catalytic interventions and “Big Ideas.” The areas of focus for subarea planning for this Green Line TOD Study featured in this chapter
Invest in TOD
→ Prioritize Green Line Corridor Investments for all Public Sector Agencies; Prioritize retention of naturally occurring affordable single-family residential housing.
Invest in Transit


from a study of market against key principles community stakeholders. This areas of concentrated people and households are locating here. ends of the corridor. hospitals lie at the south end of lie at the north end. But The TOD Study team works with residents at a public
→ Improve Transit Service with Improved Frequency, Off-Board Fares, and Station Infrastructure.
→ Reposition Publicly Owned Land to Support Community Development.
Track Success
→ Track Targets and Goals on a Digital Dashboard.


→ Seek public private partnerships to consolidate retail, infill with mixed income housing and create job generating uses tailored to medical, logistics, construction trades and hospitality related industries.
→ Consider immediate use of underutilized and vacant commercial for job generating uses such as a call center, restaurant training, and small business incubation, trades training and small business incubation, and other uses aimed at improving job creating opportunities and small business growth for the area.
→ Enable all types of housing through redevelopment and infill of commercial areas to include small lot single family, townhomes and multifamily ownership and rental opportunities.


→ Implement programs that enable stronger pathways to home ownership for existing renters in the area.
→ As part of redevelopment of larger area, establish legacy business retention programs such as tax abatement and relocation assistance for existing small businesses and flea market to remain in area as new buildings come online. Capture housing demand over the next 20 years including 420+ residential units, consolidation and redevelopment of retail, and job-generating uses aimed at improving income elevating opportunities in the neighborhood.


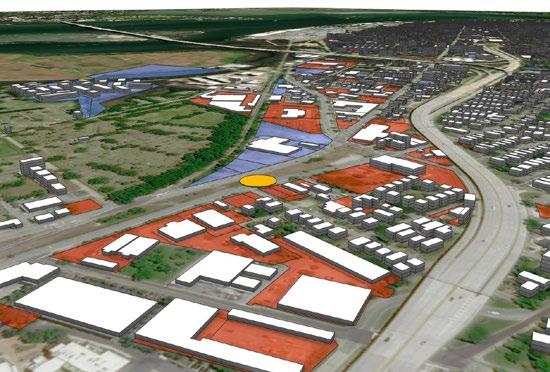
CONCEPTUAL PHASING FOR CATALYST SITE


This study brought together the Fairfax County DPD, stakeholders, and members of the community to create an implementable vision for a more sustainable and transit focused Lorton. The recommendations outlined in the vision plan and illustrated in the graphics will guide an update of the Lorton-South Route 1 Suburban Center area within the Comprehensive Plan in terms of land uses, development intensities, and other significant placemaking features within the Visioning Study Area and Focus Area. The team has successfully brought diverse Task Force perspectives together to around a comprehensive vision for the future of Lorton. The district supervisor and staff have also been engaged in this process and have expressed support and excitement for the new vision. Collaboration with the FCDOT and their consultants has also led to fruitful conversations around the tradeoffs and transformative transportation elements necessary to realize this vision.
community desires, interests, and ideas, the team worked alongside the Task Force through a series of meetings and brought information to the public for feedback at key points during the process. In total there were eight Task Force meetings held monthly between March –October 2023. Renaissance Planning attended four total Task Force meetings on a bi-monthly basis including three in person Task Force meetings at the Lorton Community Center, and one virtual meeting. Renaissance also collaborated with DPD staff on a weekly basis to help prepare and discuss information presented to the Task Force during the meetings attended only by DPD staff. The Task Force gave feedback on draft progress towards the Comprehensive Plan update and endorsed a Community Vision Statement for the study area.

one virtual meeting. Renaissance also collaborated with DPD staff on a weekly basis to help prepare and discuss information presented to the Task Force during the meetings attended only by DPD staff. The Task Force gave feedback on draft progress Comprehensive Plan update and endorsed a Community Vision Statement
To solicit community feedback and ideas, the project team worked and the Task Force to host a community open house, gather input a table at the Back to School Community Day. In total, 91 people res survey, while an additional 45 responses to the survey were filled out

To solicit community feedback and ideas, the project team worked with the Supervisor’s office and the Task Force to host a community open house, gather input on an online survey, and host a table at the Back to School Community Day. In total, 91 people res survey, while an additional 45 responses to the survey were filled out in person.

Table 1 shows the estimated maximum development potential inclusive of redevelopment options for transitional neighborhood areas within the Activity Nodes and the related land uses described previously. Guidance for Floor Area Ratio (FAR) maximums is also included for each of the Activity Nodes. Development of these areas will occur in phases as the market and individual landowners are ready. Phased development must advance the goals and vision described in this study, with potential implementation steps described in more depth in the Implementation and Market Catalyst Strategies section.
Table 1. Future development potential


Table 2. Activity Node FAR Guidance


CONCEPTUAL RENDERING OF FUTURE LAND USE AND TRANSPORTATION


This unique project involved developing, evaluating, and presenting a countywide land use scenario for the forecast year of 2070. The scenario goal is to minimize increases in VMT by reducing trip lengths and promoting multimodal travel while ensuring long-term resiliency. The team used the CorPlan model to develop an integrated land use and transportation scenario for the corridor study. The project focused on data collection, development of scenario stories and schematic maps, scenario development, and technical analysis. Multimodal streets, transit oriented land uses, parks and open spaces, and more were procedurally generated for each scenario to quickly analyze the impacts of design decisions. The models enabled more informed decision making and helped local, county, and state representatives and stakeholders visualize the complex relationships between land use and transportation planning.

FUTURE JOB DENSITY PROJECTIONS


CONCEPTS FOR FUTURE GROWTH

VISUALIZING WHAT SUSTAINABLE GROWTH LOOKS LIKE TO QUANTIFY THE IMPACT OF DESIGN DECISIONS


MODELED 3D LAND USES MERGED WITH ADDITIONAL GIS DATA IN A SMART URBAN MODEL


CONTEXT SENSITIVE TRANSECT TYPOLOGIES SHOWING TRANSITION BETWEEN LOW/HIGH DENSITY

BEFORE AFTER


NEXTransit, Port Authority’s Long Range Transportation Plan, provides a roadmap for the policies, programs, and projects that are needed to move us toward a future Allegheny County that is accessible, efficient, environmentally sustainable, and equitable. NEXTransit details how Port Authority will strive for a more connected transit system that increases the quality of our services and the reach of our network by strategically investing in new infrastructure and when adapting what we already have.
True to Port Authority’s commitment to connecting people to life, public engagement and input were central to the NEXTransit long-range visioning process. Working with the region’s stakeholders, leaders, elected officials and public, the mission was clear to develop an action-oriented plan that makes connecting to jobs, friends and family, education, medical services, recreation, and all of life’s necessities more simple, efficient, and reliable—all by using transit!

Several forms of public outreach were conducted in order to obtain the crucial feedback needed to understand transit needs and identify gaps in the current system. Significant in-person engagement through pop-up events was possible in the summer and fall of 2020, and the project team used large maps at these events, on which participants placed dots to identify various types of transit gaps. This exercise was also available on the project website in a similar form.


Theme 3: How Can Transit Get You There?
With the transit gaps identified by the public, the project team developed nine preliminary transit connection areas that would help to address these gaps. Some places could be better connected with more frequent service, better sidewalks and stops, or new lines. Also explored were major destinations within each connection area to lay the groundwork for the right mix of potential projects
Theme 3 Activities:
• Created NEXTransit Stories – This consisted of animated graphics to tell individual stories of current transit hardships, one for each of the nine identified missing connections; posted to the project website and shared on social media.
• Hosted public meeting series #2 – November of 2020. The project team hosted meetings with approximately 60 attendees via Zoom, Facebook Live, and phone. Using the potential transit connections map, participants were asked: “Do you agree with the 9 transit connection areas? What areas are missing? Within each area, what points of interest or places for connections are important?”
• Launched the “How can transit get you there?” Public Survey – The survey was available from December 1, 2020 through January 30, 2021.


Here’s what Allegheny County gains by building the NEXTransit Network over the next 25 years:


ORIGIN AND DESTINATION ANALYSIS
PROPOSED TRANSIT NETWORK COMPARISON