
PENNINGTON MANSION 2022 Q3 MARKET REPORT TRI-COUNTY | EL DORADO | PLACER | SACRAMENTO Check current market value for your home at chaseinternational.com/value
888.70.CHASE | chaseinternational.com

Chase International 3-4 Market Opinion 5-6 El Dorado County 7-8 Placer County 9-15 Sacramento County 16-20 Chase Ready 21-22 My Home Value? 23-24 Chase International 25-28 Contents

Live Well. Work Well. Love Well.
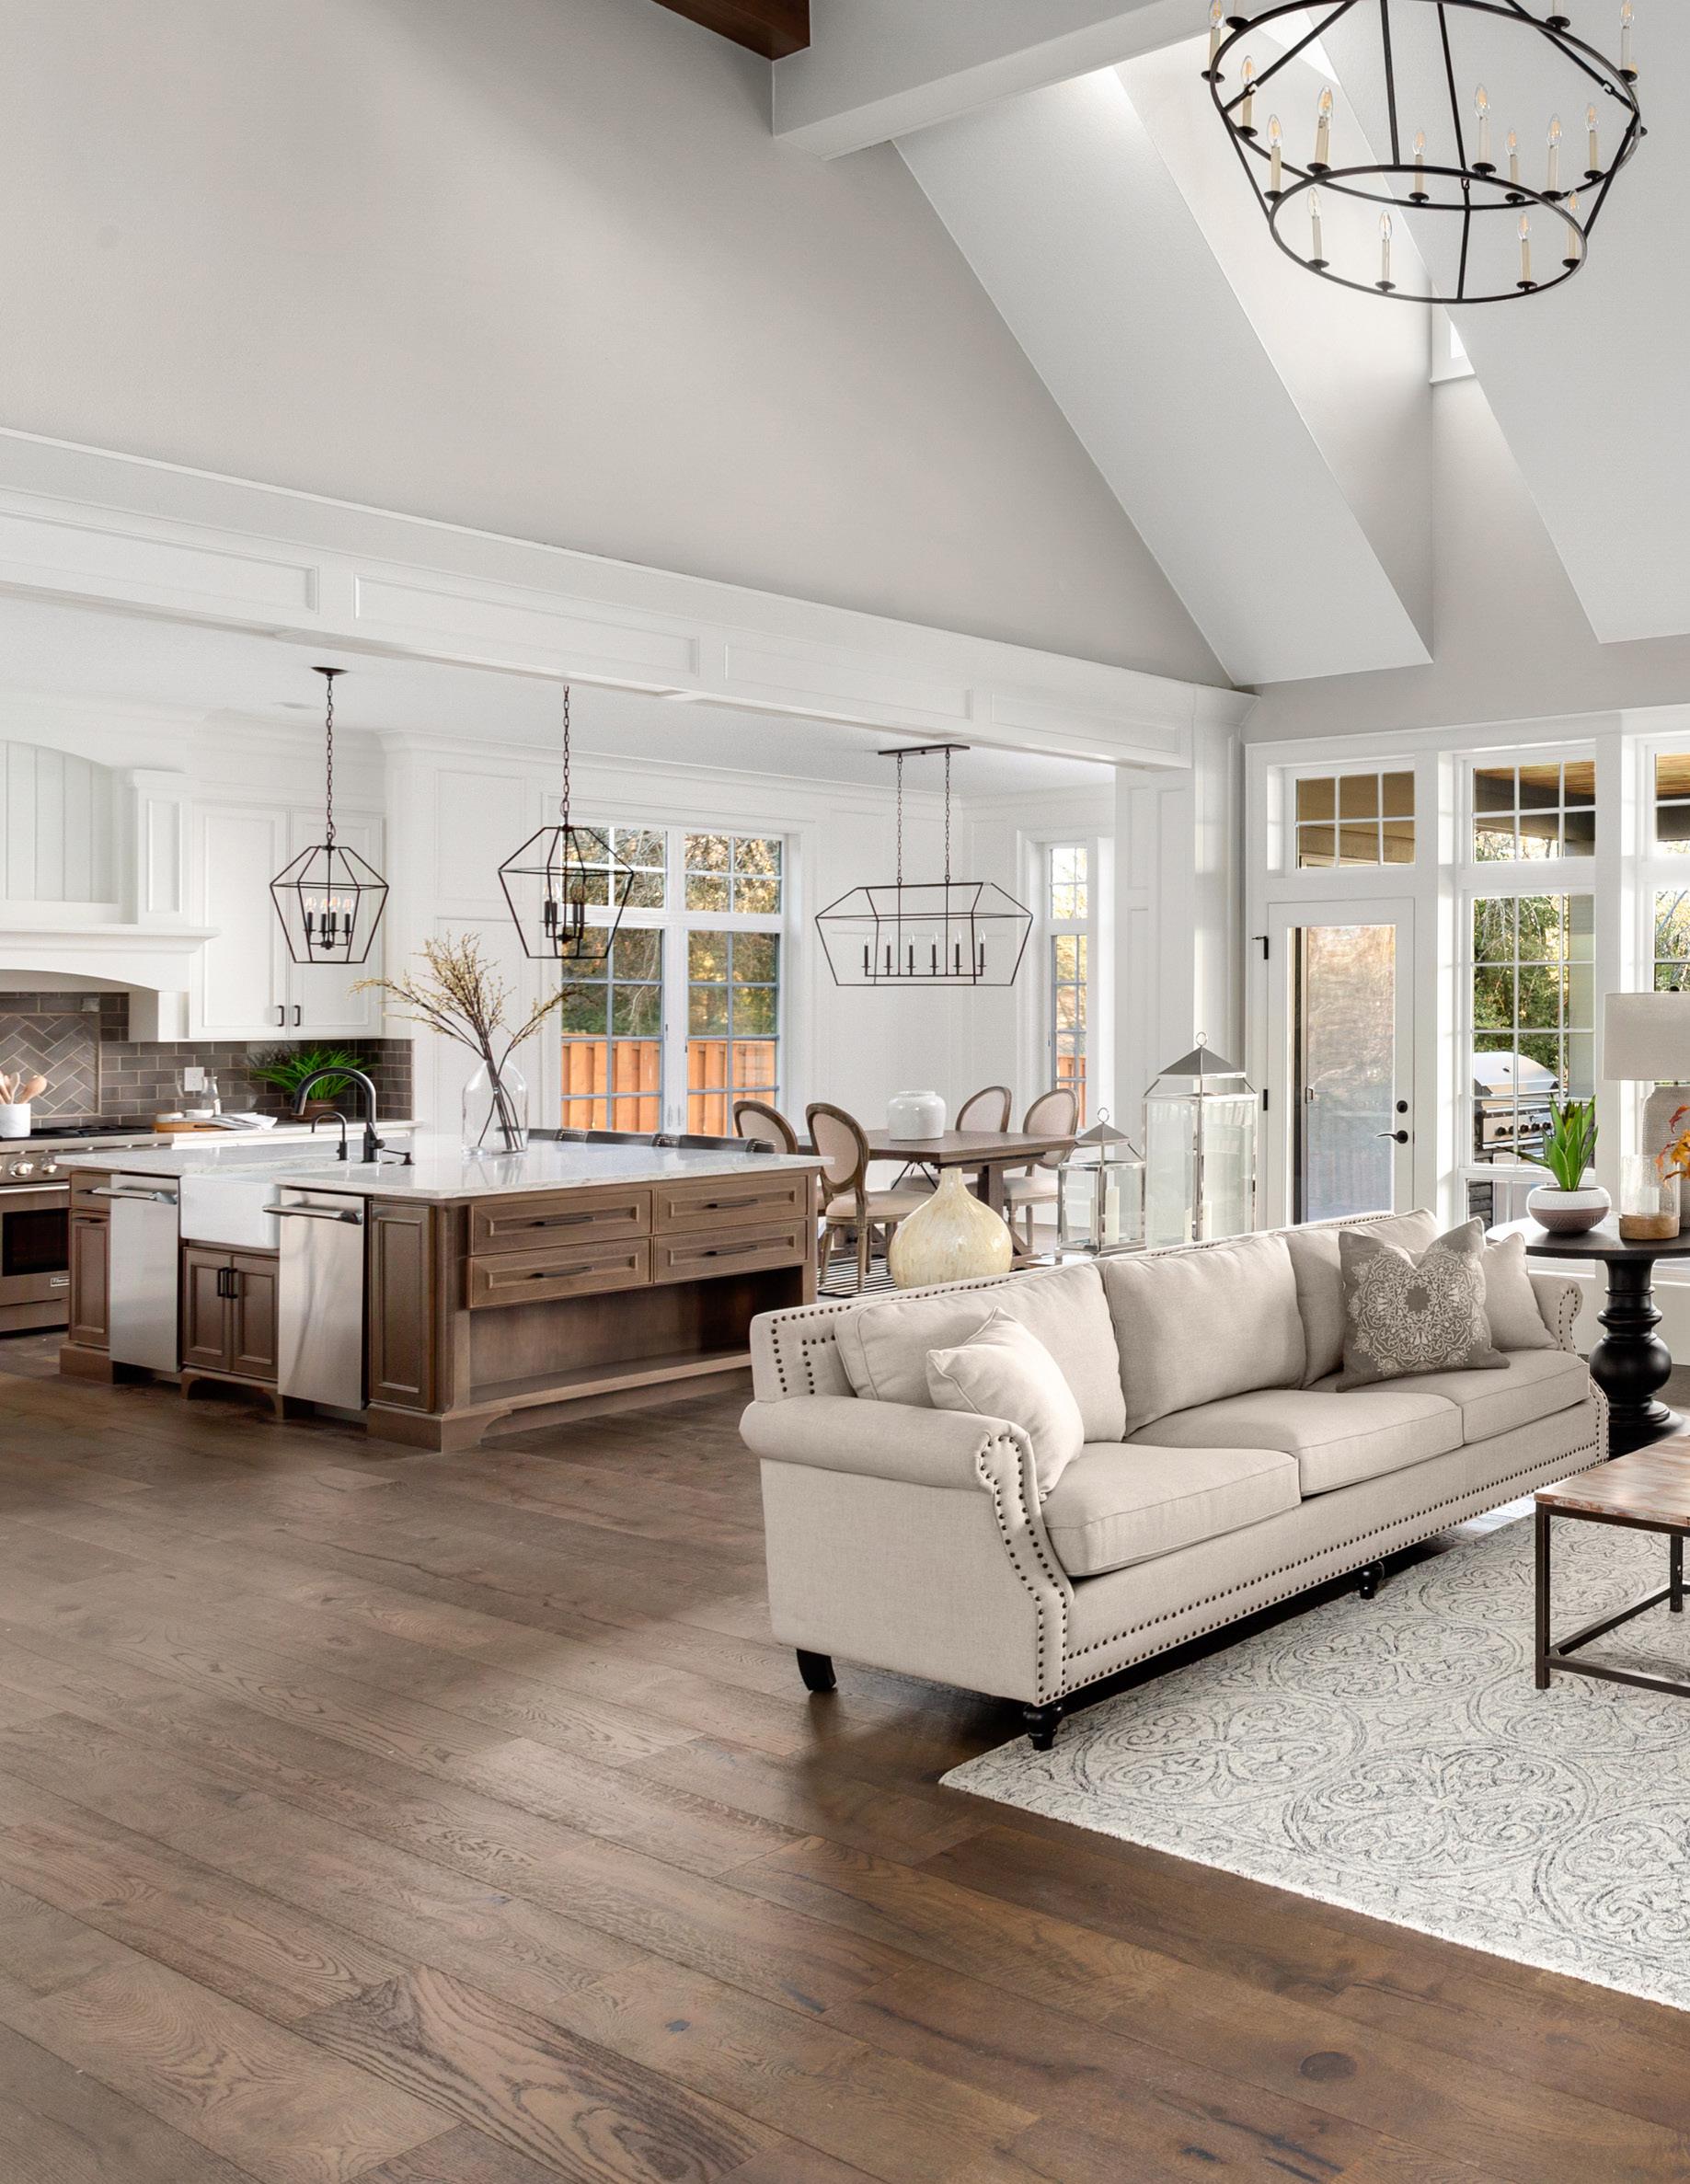
As the market shifts, we are reminded of what we would like to prioritize. There are many qualified buyers looking for their dream home, their first home, their next home. The Bay area and other areas look to Sacramento as a pinnacle location. In the heart of California, the Greater Sacramento region is near the mountains, the sea, the city, and more. This location opens the door to many lifestyles, and ultimately many are seeking that lifestyle, and balance it offers.
Chase International has opened a Regional Real Estate Center in Roseville, California. This elegant one of a kind location brings together all the key tools and resources needed for seamless and successful transactions so clients can connect to an experienced Chase Real Estate professional to guide them to a home where they will flourish.
It’s a great time to sell and a great time to buy! If you’re considering selling, you’re able to get your preferred price range. If you’re considering buying, your investment is likely to increase in value in the long-term since the housing shortage is projected to last up to ten more years.
Our Chase Ready program makes it easier for sellers to sell and buyers to buy. Sellers are able to increase their fair market value and decrease challenging negotiations or fall-out. While buyers can make a confident and educated decision when making an offer, having the Chase Ready program by your side creates opportunities where everyone wins.
If you would like to learn more, please call our local office 888 70 CHASE.

SINGLE
El Dorado Hills

UNITS SOLD 2022 2021 SALES VOLUME 2022 2021
2022 Q3 Statistics | January 1st - September 30th 888.70.CHASE | chaseinternational.com Information gathered from MetroList 10/01/2022 Volume of Sales Number of Sales Average Sales Price Median Sales Price Average Price Per Sqft. Average Days on Market List to Sales Price Ratio 2022 $634,628,056 574 $1,105,624 $989,750 $377.25 23 98.7 2021 $821,212,685 819 $1,002,702 $890,000 $331.41 17 98.43 % Change -22.72% -29.91% 10.26% 11.21% 13.83% 35.29% 0.27%
FAMILY 574 819 $634,628,056 $821,212,685
SINGLE FAMILY

Volume of Sales
of Sales
Sales
Sales
Price
Placerville
Sqft.
Days on Market
Sales Price
SALES VOLUME
2021
UNITS SOLD
2022 Q3 Statistics | January 1st - September 30th
Number
Average
Price Median
Price Average
Per
Average
List to
Ratio 2022 $125,094,894 220 $568,613 $530,000 $321.40 28 97.13 2021 $126,860,167 249 $509,479 $465,000 $301.46 23 98.43 % Change -1.39% -11.65% 11.61% 13.98% 6.61% 21.74% -1.32%
2022
220 249 $125,094,894 $126,860,167
2022 2021
SINGLE FAMILY

Auburn 2022 Q3 Statistics | January 1st - September 30th Volume of Sales Number of Sales Average Sales Price Median Sales Price Average Price Per Sqft. Average Days on Market List to Sales Price Ratio 2022 $274,856,452 386 $712,063 $629,500 $358.39 21.0 97.8 2021 $317,152,055 475 $667,689 $616,000 $322.31 25 98.12 % Change -13.34% -18.74% 6.65% 2.19% 11.19% -16.00% -0.33%
SALES VOLUME 2022 2021 UNITS SOLD 2022 2021 386 475 $274,856,452 $317,152,055 888.70.CHASE | chaseinternational.com Information gathered from MetroList 10/01/2022
SINGLE FAMILY

Granite Bay
2022 Q3 Statistics | January 1st - September 30th Volume of Sales Number of Sales Average Sales Price Median Sales Price Average Price Per Sqft. Average Days on Market List to Sales Price Ratio 2022 $319,232,861 227 $1,406,312 $1,215,000 $423.70 23 97.19 2021 $362,321,885 292 $1,240,828 $1,095,000 $367.92 26.0 98.06 % Change -11.89% -22.26% 13.34% 10.96% 15.16% -11.54% -0.89%
SALES VOLUME 2022 2021 UNITS SOLD 2022 2021 227 292 $319,232,861 $362,321,885

Lincoln 2022 Q3 Statistics | January 1st - September 30th Volume of Sales Number of Sales Average Sales Price Median Sales Price Average Price Per Sqft. Average Days on Market List to Sales Price Ratio 2022 $641,881,066 901 $712,410 $670,000 $345.20 21 99.71 2021 $660,114,533 1,005 $656,830 $600,000 $307.90 16 99.41 % Change -2.76% -10.35% 8.46% 11.67% 12.11% 31.25% 0.30% SINGLE FAMILY SALES VOLUME 2022 2021 UNITS SOLD 2022 2021 901 1,005 $641,881,066 $660,114,533 888.70.CHASE | chaseinternational.com Information gathered from MetroList 10/01/2022
SINGLE FAMILY

Twelve Bridges
SALES VOLUME
2022 Q3 Statistics | January 1st - September 30th Volume of Sales Number of Sales Average Sales Price Median Sales Price Average Price Per Sqft. Average Days on Market List to Sales Price Ratio 2022 $128,573,758 142 $905,449 $750,000 $341.85 26 100.6 2021 $135,737,915 150 $904,919 $761,500 $298.34 19 98.75 % Change -5.28% -5.33% 0.06% -1.51% 14.58% 36.84% 1.87%
2022 2021 UNITS SOLD 2022 2021 142 150 $128,573,758 $135,737,915
SINGLE FAMILY

Volume
SALES VOLUME
Loomis 2022 Q3 Statistics | January 1st - September 30th 888.70.CHASE | chaseinternational.com Information gathered from MetroList 10/01/2022
of Sales Number of Sales Average Sales Price Median Sales Price Average Price Per Sqft. Average Days on Market List to Sales Price Ratio 2022 $181,482,320 129 $1,406,840 $1,050,000 $472.34 30 94.95 2021 $185,226,640 173 $1,070,674 $870,000 $416.83 24 98.95 % Change -2.02% -25.43% 31.40% 20.69% 13.32% 25.00% -4.04%
2022 2021 UNITS SOLD 2022 2021 129 173 $181,482,320 $185,226,640
Rocklin

2022 Q3 Statistics | January 1st - September 30th Volume of Sales Number of Sales Average Sales Price Median Sales Price Average Price Per Sqft. Average Days on Market List to Sales Price Ratio 2022 $514,987,625 683 $754,008 $712,000 $346.52 17.0 98.59 2021 $630,934,121 932 $676,968 $633,750 $306.38 12.0 100.08 % Change -18.38% -26.72% 11.38% 12.35% 13.10% 41.67% -1.49% SINGLE FAMILY SALES VOLUME 2022 2021 UNITS SOLD 2022 2021 683 932 $514,987,625 $630,934,121
SINGLE FAMILY

Roseville 2022 Q3 Statistics | January 1st - September 30th 888.70.CHASE | chaseinternational.com Information gathered from MetroList 10/01/2022 Volume of Sales Number of Sales Average Sales Price Median Sales Price Average Price Per Sqft. Average Days on Market List to Sales Price Ratio 2022 $1,133,080,446 1,657 $683,814 $655,872 $350.53 18 99.23 2021 $1,188,980,331 1,907 $623,482 $600,000 $313.77 10 101 % Change -4.70% -13.11% 9.68% 9.31% 11.72% 80.00% -1.34%
SALES VOLUME 2022 2021 UNITS SOLD 2022 2021 1,657 1,907 $1,133,080,446 $1,188,980,331
SINGLE FAMILY

Sacramento 2022 Q3 Statistics | January 1st - September 30th *Sacramento stats include Arden Arcade, Carmichael, Curtis Park, East Sacramento, Fair Oaks, Land Park, Midtown Volume of Sales Number of Sales Average Sales Price Median Sales Price Average Price Per Sqft. Average Days on Market List to Sales Price Ratio 2022 $1,028,258,141 1,668 $616,462 $550,000 $403.68 20 98.59 2021 $1,213,635,811 2,109 $575,456 $515,000 $368.88 18 98.89 % Change -15.27% -20.91% 7.13% 6.80% 9.43% 11.11% -0.30%
SALES VOLUME 2022 2021 UNITS SOLD 2022 2021 1,668 2,109 $1,028,258,141 $1,213,635,811

Folsom 2022 Q3 Statistics | January 1st - September 30th 888.70.CHASE | chaseinternational.com Information gathered from MetroList 10/01/2022 Volume of Sales Number of Sales Average Sales Price Median Sales Price Average Price Per Sqft. Average Days on Market List to Sales Price Ratio 2022 $597,941,092 711 $840,986 $780,000 $387.32 21 99.43 2021 $573,943,240 790 $726,510 $675,000 $352.54 11 99.21 % Change 4.18% -10.00% 15.76% 15.56% 9.87% 90.91% 0.22% SINGLE FAMILY SALES VOLUME 2022 2021 UNITS SOLD 2022 2021 711 790 $597,941,092 $573,943,240
Elk Grove
2022 Q3 Statistics
1st - September 30th
SINGLE FAMILY
Volume of Sales
Number of Sales
Average Sales Price
Sales Price
Average Price Per Sqft. Average Days on Market

to Sales Price Ratio
$823,363,591 1,208 $681,592 $650,000 $342.58
96.55
$922,022,195 1,531 $602,235 $573,514 $302.11
98.89
SALES VOLUME
2021
UNITS SOLD 2022 2021 1,208 1,531
Change
| January
Median
List
2022
17
2021
11
%
-10.70% -21.10% 13.18% 13.34% 13.40% 54.55% -2.37%
2022
$823,363,591 $922,022,195


INTRODUCING, CHASE READY Make your home ready to SELL and easy for buyers to BUY! 888 70 CHASE 916 234 0247
Stand out from the crowd with Chase Ready
With Chase Ready, your home will stand out from the crowd by providing buyers full transparency on the condition of your home. Buyers will know what they are purchasing and can make an educated and confident decision when making an offer on your property.
Your home is ready to SELL and easy for buyers to BUY!
What distinguishes a Chase Ready Property?
Prior to putting your home on the market, Chase Ready Properties have completed the following:

Full Home Warranty for Buyers: Coverage for the sellers during the listing period
Property Inspection
Fully Completed Disclosures


Preliminary Title Search
Completed Natural Hazards Disclosure Report
Completed Sewer Clearance if necessary
Defensible Space Evaluation if necessary
Benefits to Sellers
ELIMINATE SURPRISES
Eliminates virtually all major surprises that often occur during the inspection process.
SAVES TIME & MONEY
Allows you to cost-effectively complete repairs and improvements.
REDUCES STRESS
Greatly reduces the stress and lost time of canceled transactions.
Benefits to Buyers
CONFIDENCE
Enable buyers to make educated and confident decisions when writing an offer.
SECURITY
Protect buyers from the cost of systems repairs during the first year of ownership.
CHASEINTERNATIONAL.COM/READY

888.70.CHASE | chaseinternational.com

Get your home value today! chaseinternational.com/value
Chase Family of Companies


S an c t u a r y COMMERCIAL REAL ESTATE
“May a world that affirms in oneness—health as the highest gain, contentment as the highest wealth, awaken its note of joy in the human kingdom. – Dr. Jayanath Abeywickrama
The Hela Bima Rice Project


At Chase International, we are proud to make a real difference in our world by supporting over 1,000 traditional rice farmers in Sri Lanka. Over 3.5 billion people consume rice, mostly unhealthy hybrid varieties. The Hela Bima Rice Project and Chase International join forces to grow 2,000-year-old pure, whole varieties of rice (hidden for over 500 years) with human loving, nature friendly and sustainable farming practices, using the wisdom of their ancestors. We support education, fund schools, build state-of-the-art, eco-friendly rice mills, storage and packaging facilities.


Since 2011, Chase International has empowered the farmers, their families, children and villages to live healthy lives. The Hela Bima Rice Project is awakening and educating the world, honoring the farmers, their rice and well-being. This relationship with the farmers creates a circle of abundance in all of our lives.
Making a difference: Our mission is to bring awareness to how we see FOOD, giving value and respect for all human beings.

CHASE GLOBAL INITIATIVE
Joysuccess
ONE COMPANY. ONE HEART. ONE PHILOSOPHY.
$2.6 BILLION IN ANNUAL SALES.
Chase International is one of the nation’s most successful independent real estate firms specializing in unique and distinctive properties in the Northern Califonia, Tahoe, and Reno regions. With more than 350 compassionate and determined REALTORS® in 12 locations, we are committed to our clients’ success. We have more qualified luxury professionals and top lakefront specialists with the experience and connections to serve all your needs.
We empower people to achieve unlimited possibilities, make magical life decisions, and bring peace and harmony into their lives. This is our secret power. Put the Chase Power of Success to work for you.
REGIONAL CENTER
I osma yppah lufetargdnadeticxe, htta C h a s e In ternationaliswealthy in all realms . We area vibrant community thatembraces ab un d a n c ,e getni r smaerdruollafotnemlliflufdnayti ROSEVILLE
915 HIGHLAND POINTE, SUITE 190 ROSEVILLE, CALIFORNIA 95678
OVER
Zephyr Cove | Glenbrook | Incline Village | South Lake Tahoe | Tahoe City | Truckee Sacramento | Reno | Sparks | Carson Valley | Henderson | London
