
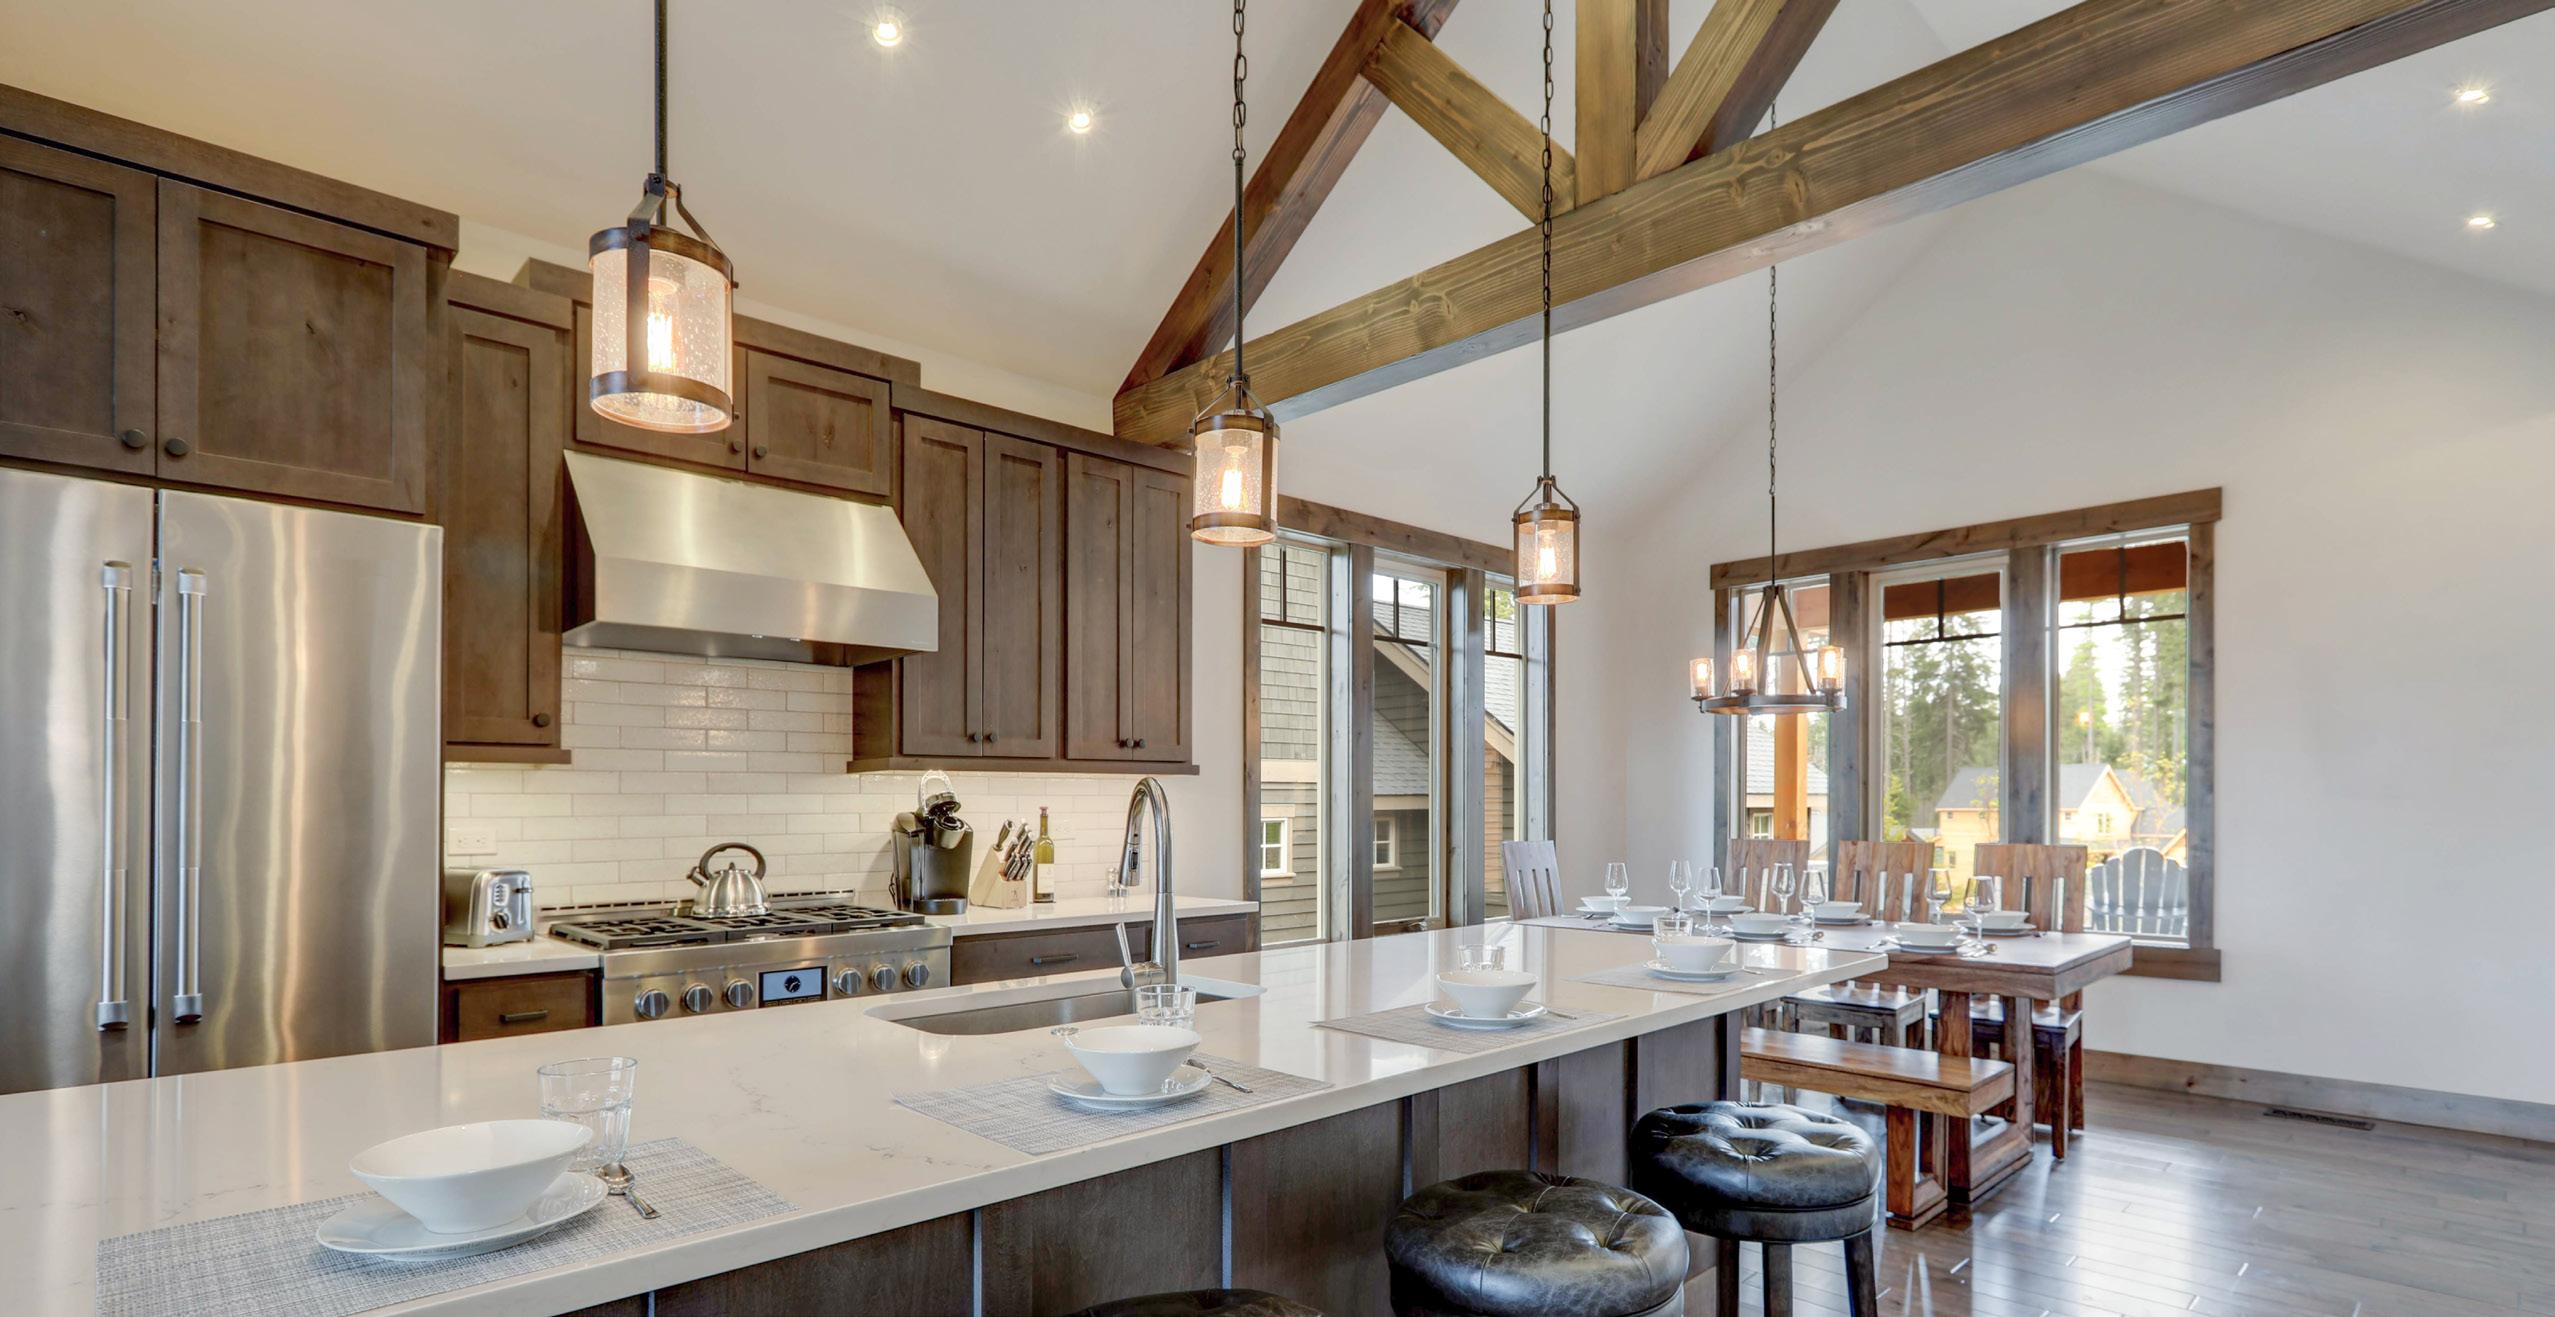
135SELBYTAHOE.COM LISTED BY THE DONOVAN GROUP
TRI-COUNTY | EL DORADO | PLACER | SACRAMENTO Check current market value for your home at chaseinternational.com/value
2023 MID-YEAR MARKET REPORT

888.70.CHASE | chaseinternational.com

Chase International 3-4 Market Opinion 5-6 El Dorado County 7-8 Placer County 9-15 Sacramento County 16-20 Chase Ready 21-22 My Home Value? 23-24 Chase International 25-28
Contents

Transformative year
Geopolitical tensions, market volatility, and high inflation are poised to retain their prominence throughout the second half of the year, accompanied by other significant macroeconomic factors. As of June 14, the average 30-year fixed mortgage rate soared to 6.86 percent. The Federal Reserve’s relentless series of 10 rate hikes aims to tackle inflation, resulting in the swiftest rate surge witnessed in decades. Consequently, markets are grappling to adapt to this new reality. Sales of previously owned homes have plummeted by 23.2 percent since last spring, and the trajectory of rates and the Fed’s future course for the latter half of the year remain uncertain.
Yet, amidst this familiar sense of uncertainty, it is essential to view 2023 as a transformative year, where economic fluctuations and the previous frenzy in the market subside, giving way to a more balanced marketplace that presents opportunities for both sellers and buyers.
With or without economic uncertainty people are attracted to the greater Sacramento area with it’s vibrant food scene, bustling arts and culture, and a highly desireable moderate climate which makes to general real estate forecast for the area positive.
If you would like to learn more, please call our local office 888 70 CHASE.


SALES VOLUME 2023 2022
Dorado Hills 2023 Mid-Year Statistics 888.70.CHASE | chaseinternational.com Information gathered from MetroList 06/30/2023 Volume of Sales Number of Sales Average Sales Price Median Sales Price Average Price Per Sqft. Average Days on Market List to Sales Price Ratio SINGLE FAMILY 282 460 $301,731,905 $521,509,506 2023 $301,731,905 282 $1,069,971 $900,250 $366.49 34 97.05% 2022 $521,509,506 460 $1,133,716 $1,012,500 $380.95 16 98.74% % Change -42.14% -38.70% -5.62% -11.09% -3.80% 112.50% -1.71%
UNITS SOLD 2023 2022
El
Placerville
2023 Mid-Year Statistics
Volume of Sales Number of Sales Average Sales Price Median Sales Price Average Price Per Sqft. Average Days on Market List to Sales Price Ratio 2023 $38,157,249 70 $545,104 $545,104 $321.58 39 97.83% 2022 $88,441,454 156 $566,932 $535,000 $321.38 25 97.44% % Change -56.86% -55.13% -3.85% 1.89% 0.06% 56.00% 0.40% SINGLE FAMILY SALES VOLUME 2023 2022 UNITS SOLD 2023 2022 70 156 $38,157,249 $88,441,454
2023 Mid-Year Statistics
Auburn
Volume of Sales Number of Sales Average Sales Price Median Sales Price Average Price Per Sqft. Average Days on Market List to Sales Price Ratio 2023 $117,033,745 151 $775,058 $675,000 $347.30 45.0 98.02% 2022 $202,181,760 257 $786,699 $699,000 $375.10 20 98.06% % Change -42.11% -41.25% -1.48% -3.43% -7.41% 125.00% -0.04% SINGLE FAMILY SALES VOLUME 2022 2021 UNITS SOLD 2023 2022 151 257 $117,033,745 $202,181,760 888.70.CHASE | chaseinternational.com Information gathered from MetroList 06/30/2023
Granite Bay
2023 Mid-Year Statistics

Volume of Sales Number of Sales Average Sales Price Median Sales Price Average Price Per Sqft. Average Days on Market List to Sales Price Ratio 2023 $168,820,269 128 $1,318,908 $1,235,000 $407.77 50 96.95% 2022 $206,261,077 142 $1,452,543 $1,290,000 $424.13 18.0 98.04% % Change -18.15% -9.86% -9.20% -4.26% -3.86% 177.78% -1.11% SINGLE FAMILY SALES VOLUME 2023 2022 UNITS SOLD 2023 2022 128 142 $168,820,269 $206,261,077
2023 Mid-Year Statistics

Lincoln
Volume of Sales Number of Sales Average Sales Price Median Sales Price Average Price Per Sqft. Average Days on Market List to Sales Price Ratio 2023 $307,485,924 450 $683,302 $616,709 $328.23 42.0 98.72% 2022 $442,471,232 599 $738,683 $689,000 $349.07 17 100.11% % Change -30.51% -24.87% -7.50% -10.49% -5.97% 147.06% -1.39% SINGLE FAMILY SALES VOLUME 2023 2022 UNITS SOLD 2023 2022 450 599 $307,485,924 $442,471,232 888.70.CHASE | chaseinternational.com Information gathered from MetroList 06/30/2023
Twelve Bridges
2023 Mid-Year Statistics
Volume of Sales Number of Sales Average Sales Price Median Sales Price Average Price Per Sqft. Average Days on Market List to Sales Price Ratio 2023 $76,049,961 84 $905,357 $750,000 $326.82 45 97.96% 2022 $95,052,843 102 $931,891 $752,858 $343.27 23 100.49% % Change -19.99% -17.65% -2.85% -0.38% -4.79% 95.65% -2.52% SINGLE FAMILY SALES VOLUME 2023 2022 UNITS SOLD 2023 2022 84 102 $76,049,961 $95,052,843
2023 Mid-Year Statistics

Loomis
888.70.CHASE | chaseinternational.com Information gathered from MetroList 06/30/2023 Volume of Sales Number of Sales Average Sales Price Median Sales Price Average Price Per Sqft. Average Days on Market List to Sales Price Ratio 2023 $84,666,767 67 $1,263,683 $881,000 $460.89 48.0 96.53% 2022 $125,250,390 83 $1,509,041 $1,170,000 $478.99 24 96.02% % Change -32.40% -19.28% -16.26% -24.70% -3.78% 100.00% 0.53% SINGLE FAMILY SALES VOLUME 2023 2022 UNITS SOLD 2023 2022 67 83 $84,666,767 $125,250,390
2023 Mid-Year Statistics

Rocklin
Volume of Sales Number of Sales Average Sales Price Median Sales Price Average Price Per Sqft. Average Days on Market List to Sales Price Ratio 2023 $255,545,133 325 $786,293 $699,000 $332.69 37.0 97.56% 2022 $375,039,756 472 $794,576 $735,000 $348.65 13.0 99.21% % Change -31.86% -31.14% -1.04% -4.90% -4.58% 184.62% -1.66% SINGLE FAMILY SALES VOLUME 2023 2022 UNITS SOLD 2023 2022 325 472 $255,545,133 $375,039,756

Roseville
Mid-Year Statistics 888.70.CHASE | chaseinternational.com Information gathered from MetroList 06/30/2023 Volume of Sales Number of Sales Average Sales Price Median Sales Price Average Price Per Sqft. Average Days on Market List to Sales Price Ratio 2023 $541,231,935 815 $664,088 $620,990 $316.69 48 98.2% 2022 $764,453,366 1081 $707,172 $675,000 $352.74 14.0 100.33% % Change -29.20% -24.61% -6.09% -8.00% -10.22% 242.86% -2.12% SINGLE FAMILY SALES VOLUME 2023 2022 UNITS SOLD 2023 2022 815 1081 $541,231,935 $764,453,366
2023
2023 Mid-Year Statistics

Sacramento
Volume of Sales Number of Sales Average Sales Price Median Sales Price Average Price Per Sqft. Average Days on Market List to Sales Price Ratio 2023 $1,031,713,560 1608 $641,613 $600,000 $359.21 36 97.34% 2022 $1,565,175,631 2280 $686,481 $645,000 $389.90 16 98.88% % Change -34.08% -29.47% -6.54% -6.98% -7.87% 125.00% -99.02% SINGLE FAMILY SALES VOLUME 2023 2022 UNITS SOLD 2023 2022 1608 2280 $1,031,713,560 $1,566,175,631
*Sacramento stats include Arden Arcade, Carmichael, Curtis Park, East Sacramento, Fair Oaks, Land Park, Midtown
2023 Mid-Year Statistics

Folsom
888.70.CHASE | chaseinternational.com Information gathered from MetroList 06/30/2023 Volume of Sales Number of Sales Average Sales Price Median Sales Price Average Price Per Sqft. Average Days on Market List to Sales Price Ratio 2023 $235,360,685 296 $795,137 $740,000 $363.29 35.0 97.15% 2022 $407,435,281 460 $885,729 $820,000 $394.22 19.0 99.89% % Change -42.23% -35.65% -10.23% -9.76% -7.85% 84.21% -2.74% SINGLE FAMILY SALES VOLUME 2023 2022 UNITS SOLD 2023 2022 296 460 $235,360,685 $407,435,281
Elk Grove
2023 Mid-Year Statistics

Volume of Sales Number of Sales Average Sales Price Median Sales Price Average Price Per Sqft. Average Days on Market List to Sales Price Ratio 2023 $358,146,301 559 $640,691 $629,950 $316.42 37 98.07% 2022 $571,472,131 816 $700,333 $663,750 $349.40 13.0 98.41% % Change -37.33% -31.50% -8.52% -5.09% -9.44% 184.62% -0.35% SINGLE FAMILY SALES VOLUME 2023 2022 UNITS SOLD 2023 2022 559 816 $358,146,301 $571,472,131


INTRODUCING, CHASE READY Make your home ready to SELL and easy for buyers to BUY! 888 70 CHASE 916 234 0247
Stand out from the crowd with Chase Ready
With Chase Ready, your home will stand out from the crowd by providing buyers full transparency on the condition of your home. Buyers will know what they are purchasing and can make an educated and confident decision when making an offer on your property.
Your home is ready to SELL and easy for buyers to BUY!
What distinguishes a Chase Ready Property?
Prior to putting your home on the market, Chase Ready Properties have completed the following:

Full Home Warranty for Buyers: Coverage for the sellers during the listing period
Property Inspection
Fully Completed Disclosures


Preliminary Title Search
Completed Natural Hazards Disclosure Report
Completed Sewer Clearance if necessary
Defensible Space Evaluation if necessary
Benefits to Sellers
ELIMINATE SURPRISES
Eliminates virtually all major surprises that often occur during the inspection process.
SAVES TIME & MONEY
Allows you to cost-effectively complete repairs and improvements.
REDUCES STRESS
Greatly reduces the stress and lost time of canceled transactions.
Benefits to Buyers
CONFIDENCE
Enable buyers to make educated and confident decisions when writing an offer.
SECURITY
Protect buyers from the cost of systems repairs during the first year of ownership.
CHASEINTERNATIONAL.COM/READY

888.70.CHASE | chaseinternational.com

Get your home value today! chaseinternational.com/value


 Chase Family of Companies
“
May a world that affirms in oneness—health as the highest gain, contentment as the highest wealth, awaken its note of joy in the human kingdom.
– Dr. Jayanath Abeywickrama
The Hela Bima Rice Project


At Chase International, we are proud to make a real difference in our world by supporting over 1,000 traditional rice farmers in Sri Lanka. Over 3.5 billion people consume rice, mostly unhealthy hybrid varieties. The Hela Bima Rice Project and Chase International join forces to grow 2,000-year-old pure, whole varieties of rice (hidden for over 500 years) with human loving, nature friendly and sustainable farming practices, using the wisdom of their ancestors. We support education, fund schools, build state-of-the-art, eco-friendly rice mills, storage and packaging facilities.


Since 2011, Chase International has empowered the farmers, their families, children and villages to live healthy lives. The Hela Bima Rice Project is awakening and educating the world, honoring the farmers, their rice and well-being. This relationship with the farmers creates a circle of abundance in all of our lives.
Making a difference: Our mission is to bring awareness to how we see FOOD, giving value and respect for all human beings.

CHASE GLOBAL INITIATIVE
Joysuccess
ONE COMPANY. ONE HEART. ONE PHILOSOPHY.
$7 BILLION IN 3 YEARS.
Chase International is one of the nation’s most successful independent real estate firms specializing in unique and distinctive properties in the Northern Califonia, Tahoe, and Reno regions. With more than 350 compassionate and determined REALTORS® in 14 locations, we are committed to our clients’ success. We have more qualified luxury professionals and top lakefront specialists with the experience and connections to serve all your needs.
We empower people to achieve unlimited possibilities, make magical life decisions, and bring peace and harmony into their lives. This is our secret power. Put the Chase Power of Success to work for you.
ROSEVILLE REGIONAL CENTER
915 HIGHLAND POINTE, SUITE 190
ROSEVILLE, CALIFORNIA 95678
I osma yppah , lufetargdnadeticxe htta C h a s e In ternationaliswealthy
thatembraces ab un d a n c ,e getni r smaerdruollafotnemlliflufdnayti
in all realms . We area vibrant community
Zephyr Cove | Glenbrook | Incline Village | South Lake Tahoe | Tahoe City | Truckee Sacramento | Reno | Sparks | Carson Valley | Lake Almanor | Henderson | London
