
Purchasing Power in the Midst of Inflation Pg. 7 SEED, FEED AND FIELD Supporting American Agricultural Producers Edition Seven | Winter 2022-2023 Transition Financing – Why Interest-Only Products Make Cents Pg. 57
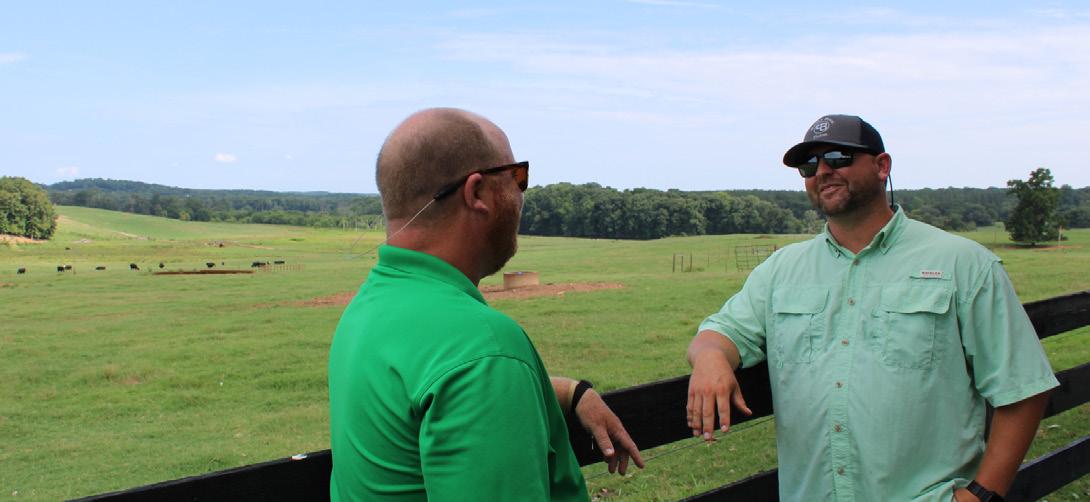
A recent visit with a fifth generation farmer leads to talks of succession planning, today’s economy, and how financing structure can make a huge impact on passing down the farm.
Severe drought is leading California’s farmers and ranchers to fallow lands, switch to less water-intensive crops, or farm on fewer acres. The decisions our California communities make now with respect to managing housing density and urban growth are critical for our future. 05
It’s no secret that interest rates have seen significant fluctuations recently, but AgFi Sales Officer Barry Rager says there are still good options for producers looking to restructure, refinance, or make a new purchase.
Like many other sectors of our economy, building material costs have seen significant increases in the last few years. That’s why it’s important that building owners check their insurance coverage.
Higher commodity prices fueled record farm profits in 2022. Outlook is muddied by higher costs in 2023 and 2024. 16
SEED, FEED AND FIELD - WINTER 2022-2023
Interest rates have followed consumer price inflation higher. Real interest rates remain negative, implying the Federal Reserve may have work to do.
ABOUT
Average farm real estate gained 12.4% in 2022. While some states gained more than 20%, adjusted for inflation, gains were much more modest compared to housing.
24
You will also find, as an insert and central element, Farmer Mac's The Feed, which is re-printed and included
To subscribe to Seed, Feed and Field, or to access a digital download of this publication, please visit: www.cgb-agfi.com/seed-feed-field/
A cold winter lies ahead, and La Niña’s persistence could mean dryness in the West but a snowy winter in the East. 32
For media inquiries: AgFiMarketing@cgb.com
To learn more about AgriFinancial: Toll-free 877-548-2622 www.cgb-agfi.com
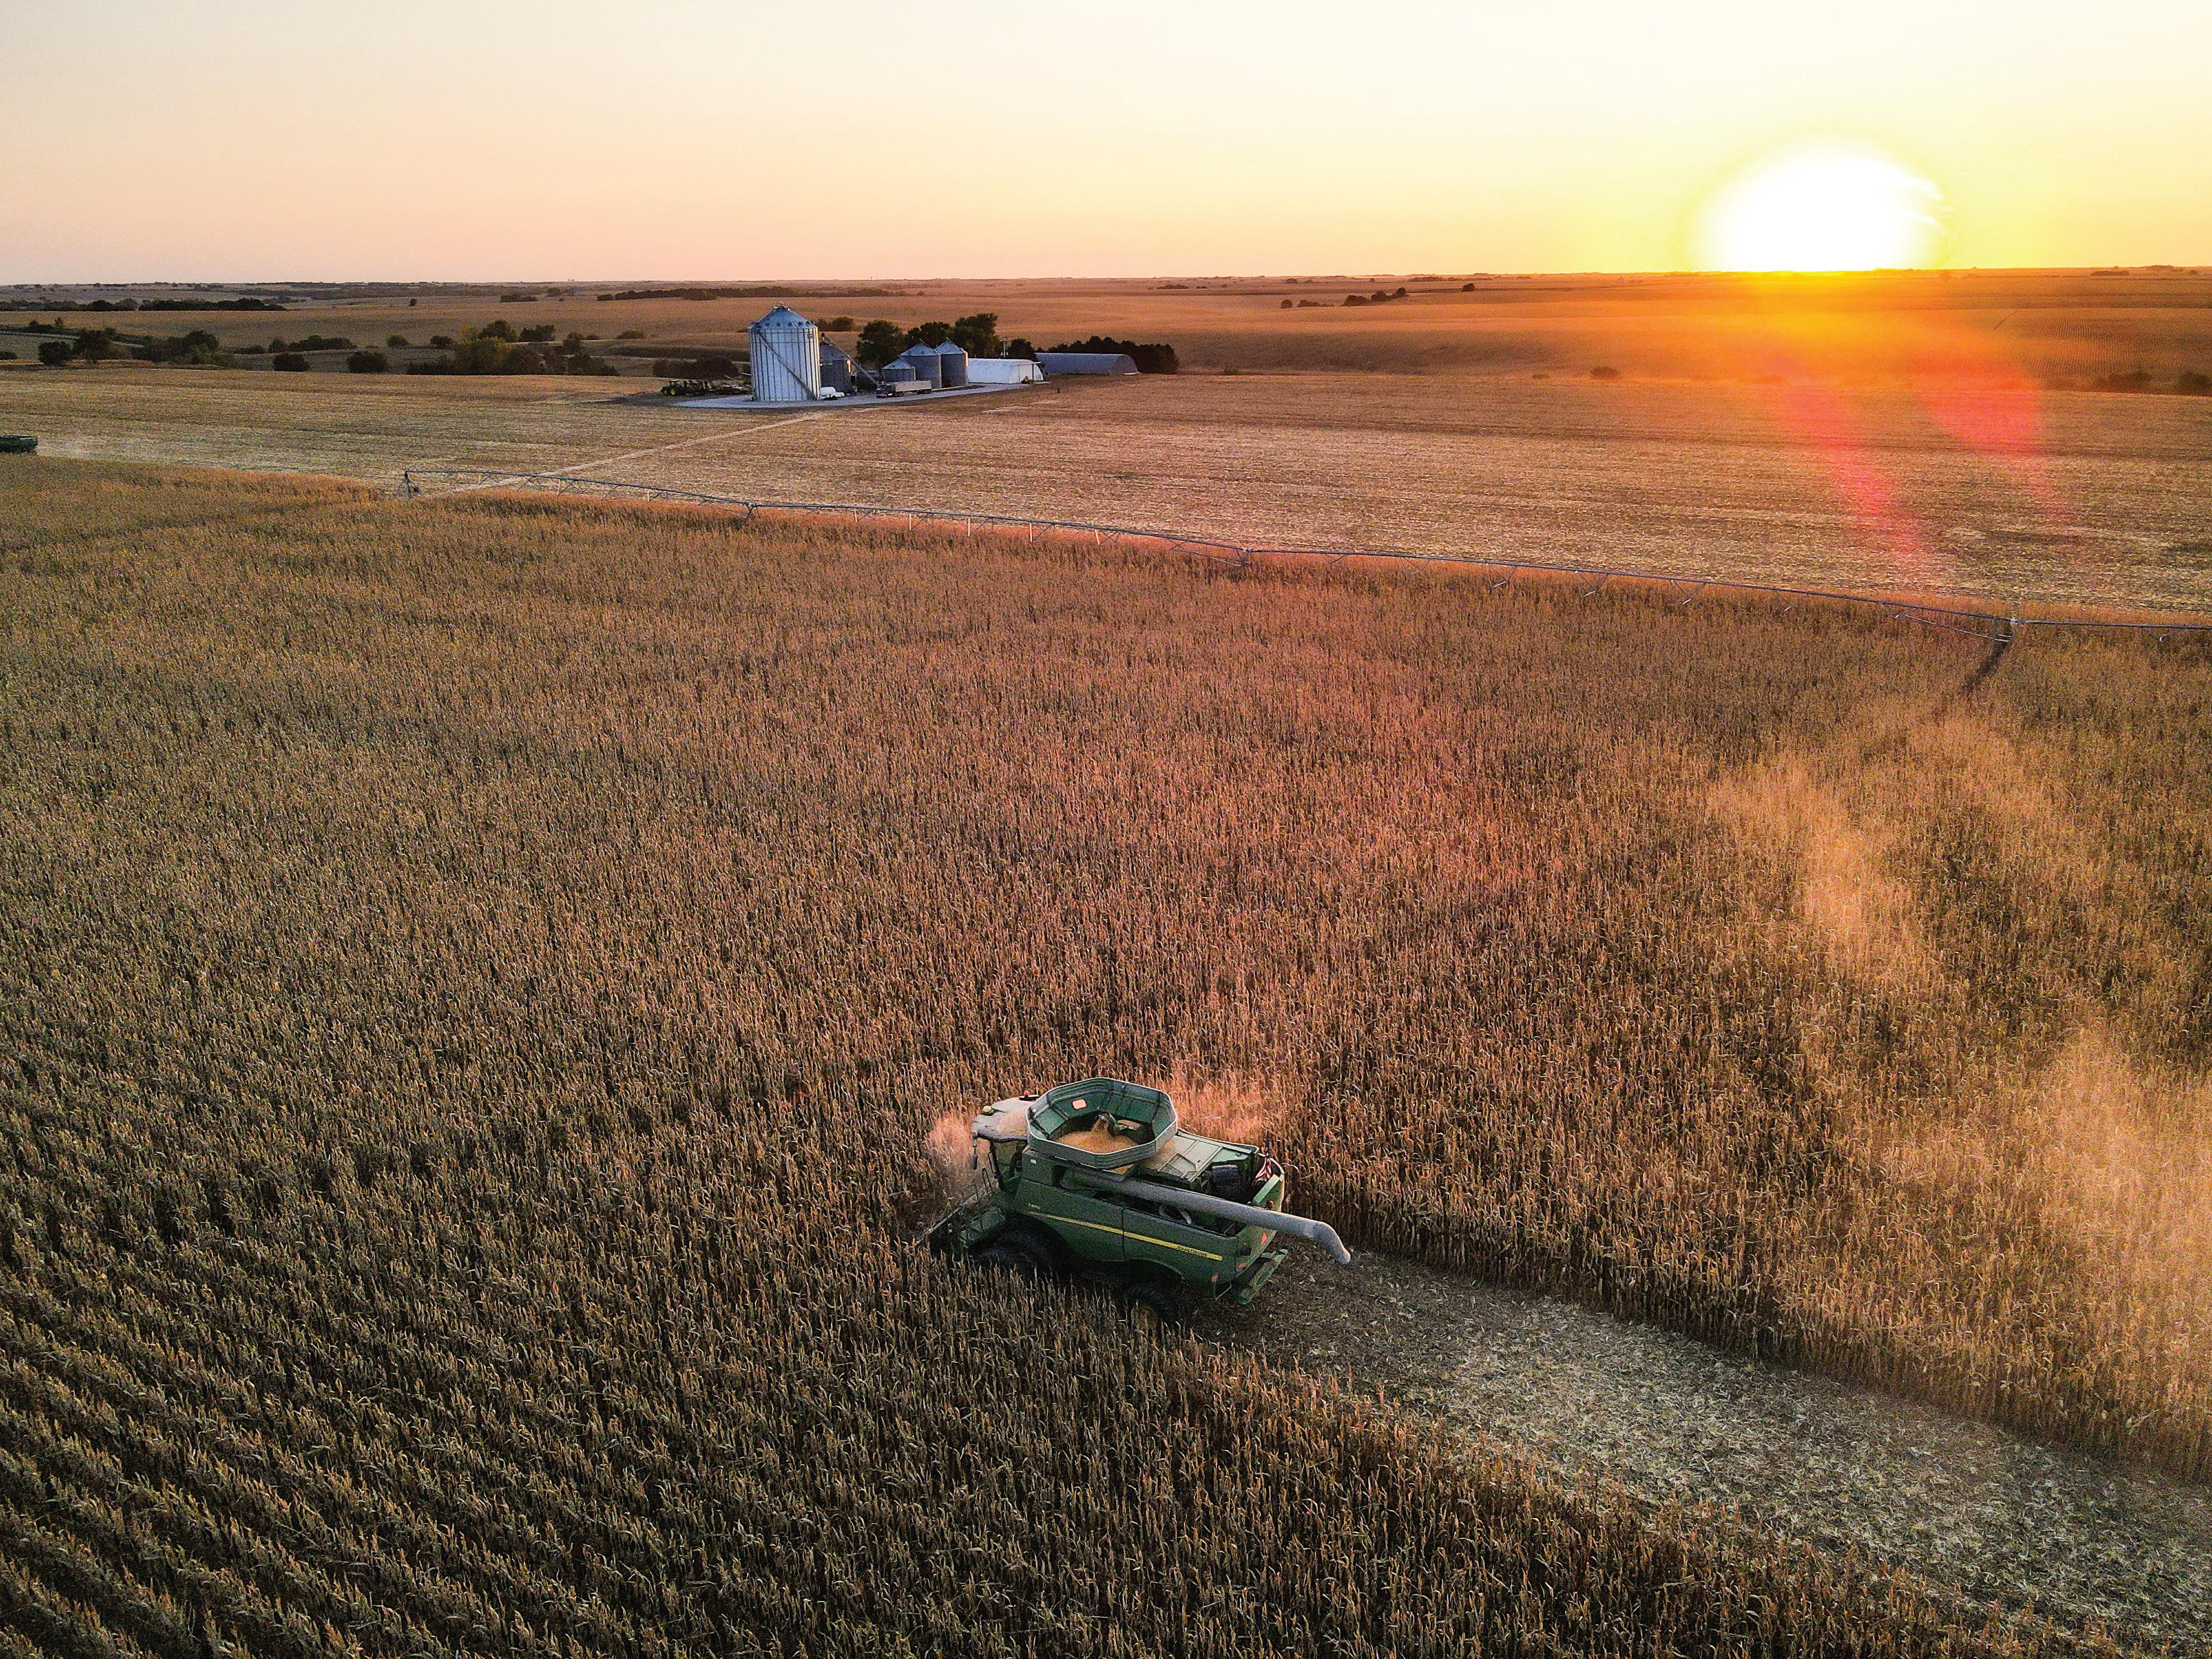
Corn, soybean, and wheat growers experienced excellent returns in 2021 and 2022. Weather and input price inflation are the x-factors in 2023.
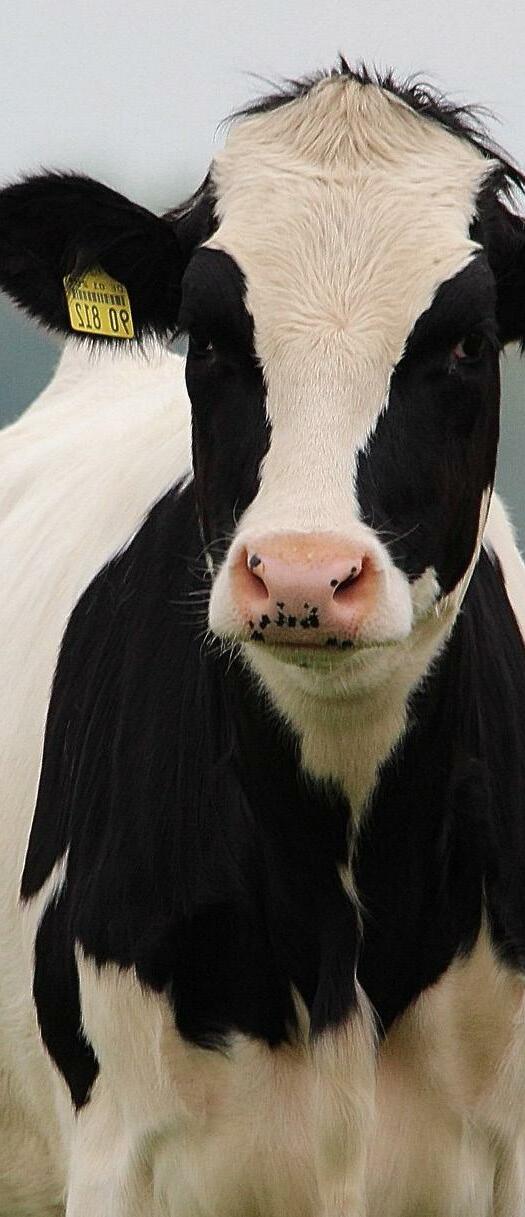
Milk output rebounded in 2022, but global demand has been high enough to support prices throughout the year. Feed costs and a slowing global economy are factors to watch in 2023.
A decline in cattle inventory drove up live cattle prices in 2022 and could keep them high in 2023. However, consumers have balked at high beef prices, and a slowing economy could hurt demand in the near term.
Debt outstanding on farmland follows cycles driven by patterns in farm income and real interest rates.
FARM FRESH RECIPE - PUMPKIN ROLL
Wow your guests with this delicious treat, sure to be a hit at any gathering.
CGB EXPANDS TO INCLUDE ORGANIC
CGB has expanded its grain handling operations to include Non-GMO Soybeans and Organic Grains.
An interest-only program can be a great fit for transitioning operations.
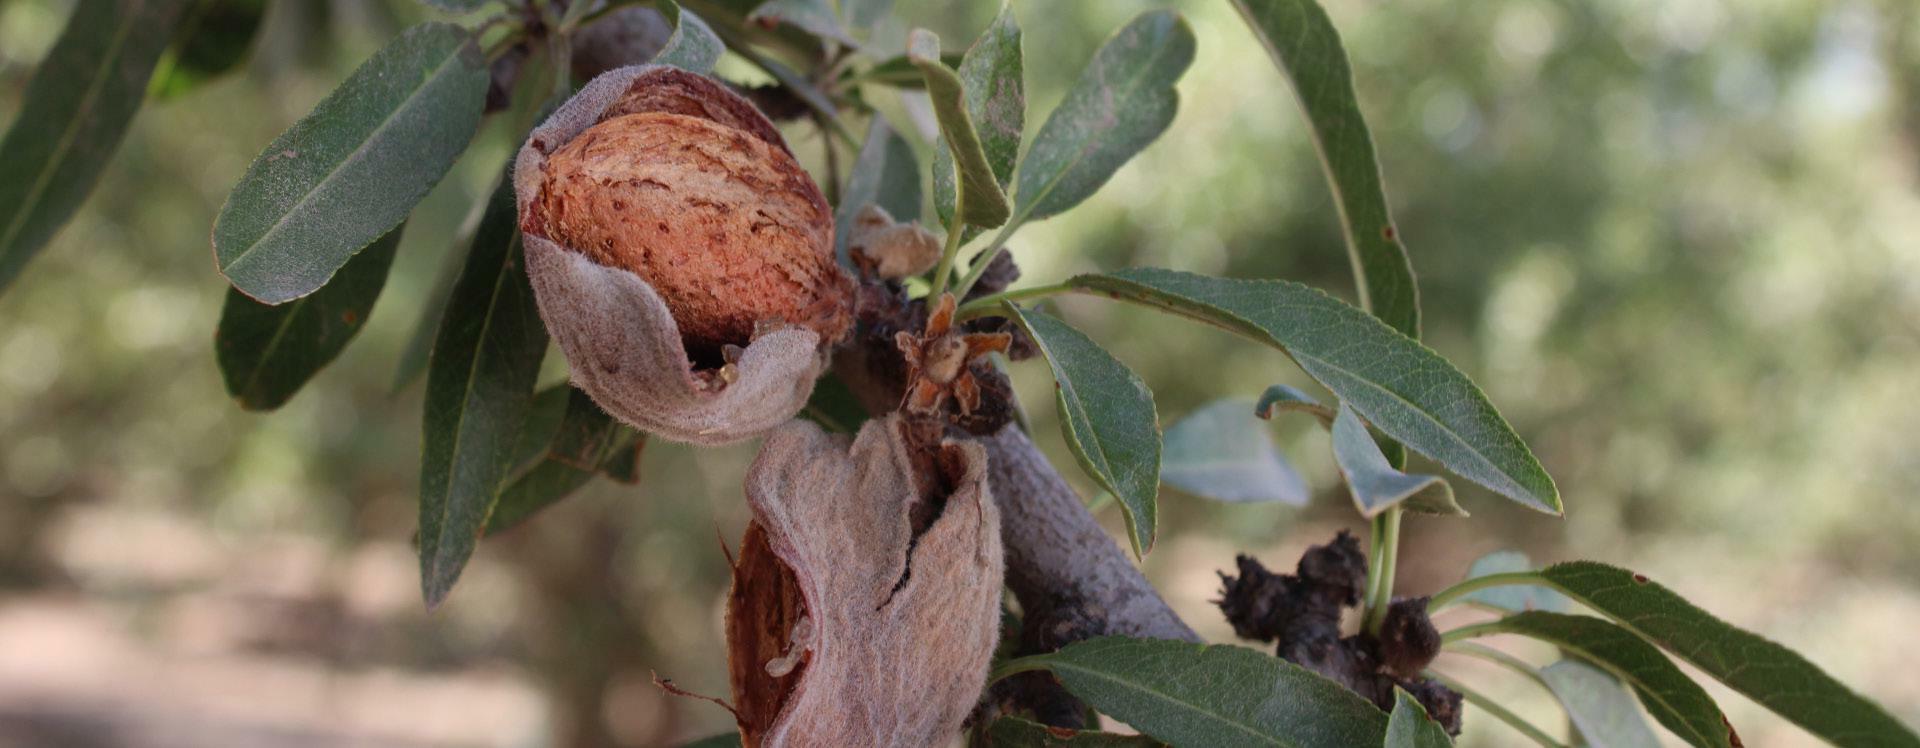
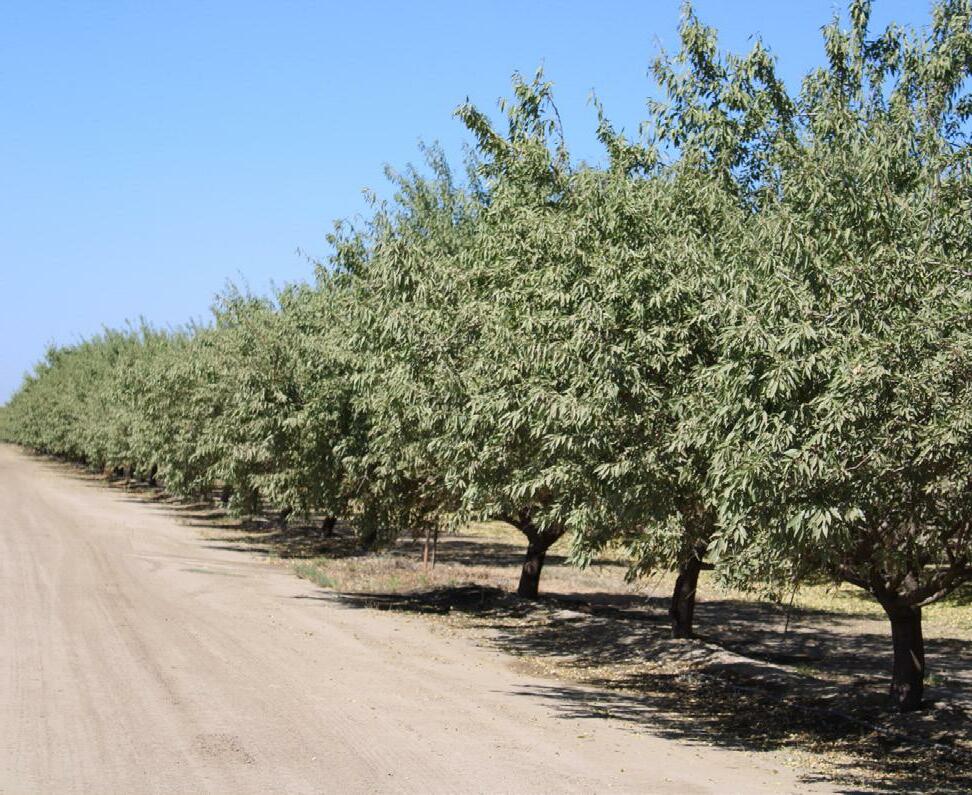
Located in the heart of California’s Central Valley, Critchley Family Farms produces Blueberries, Blackberries, Table and Wine Grapes, and Almonds.
SEED, FEED AND FIELD - WINTER 2022-2023
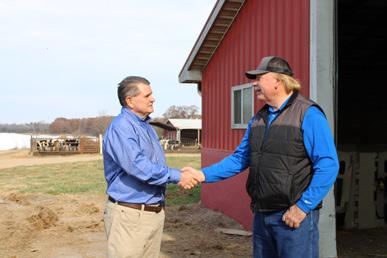
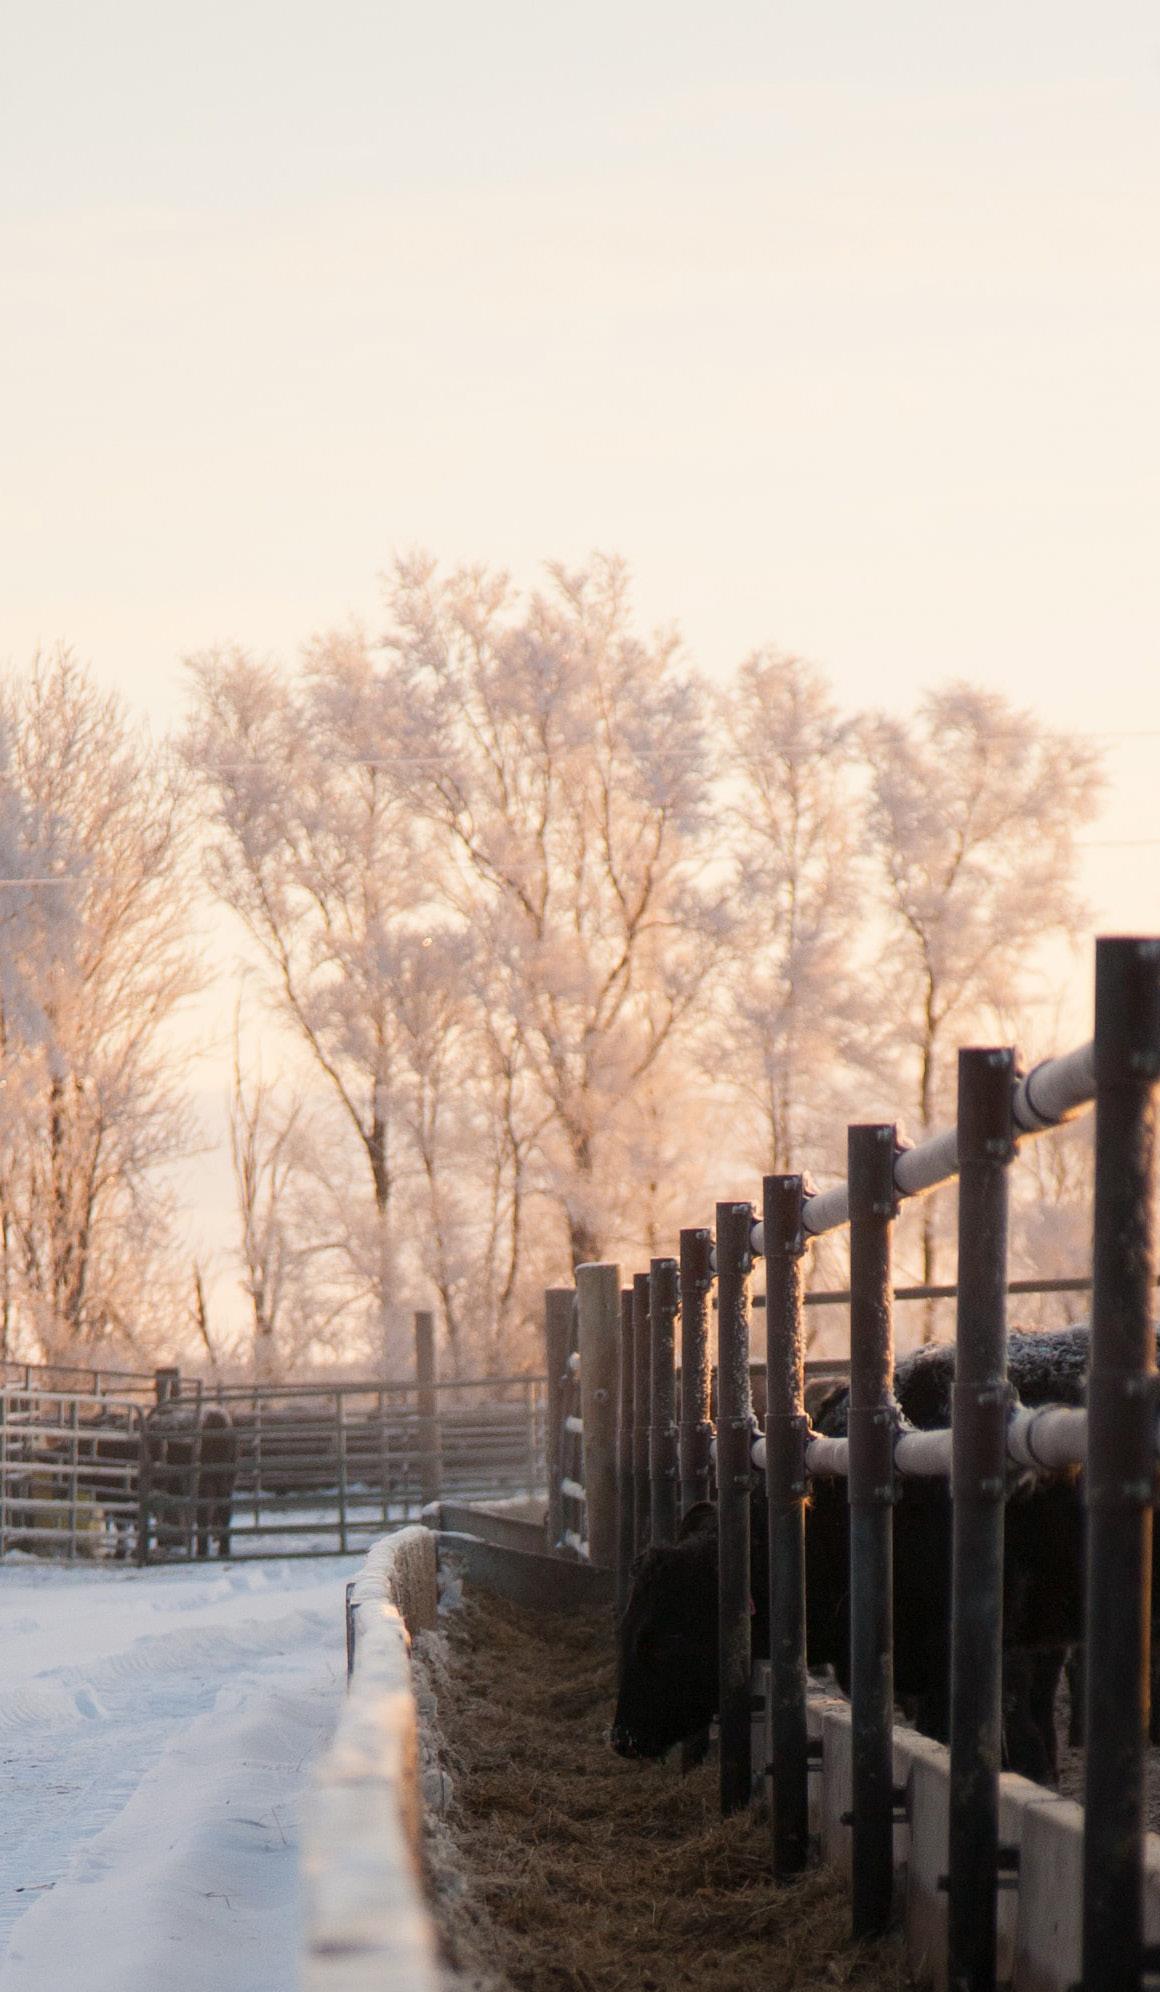
Recently, I was able to travel about an hour outside of Atlanta, GA to visit with some of our customers. These fifth generation cattle farmers made a huge decision within the last few years, in an effort to make the farm more sustainable for future generations, to put in a processing facility and meat market. This business investment now makes their operation fully integrated from conception to the dinner plate. It’s a remarkable project that I am honored to have seen.
It got me thinking a lot about succession planning – making preparations to pass the family farm on to the next generation. This is a complex, difficult, yet necessary conversation. When I think about my family and everything my parents and grandparents sacrificed in order to maintain farm living for us, I well with pride.
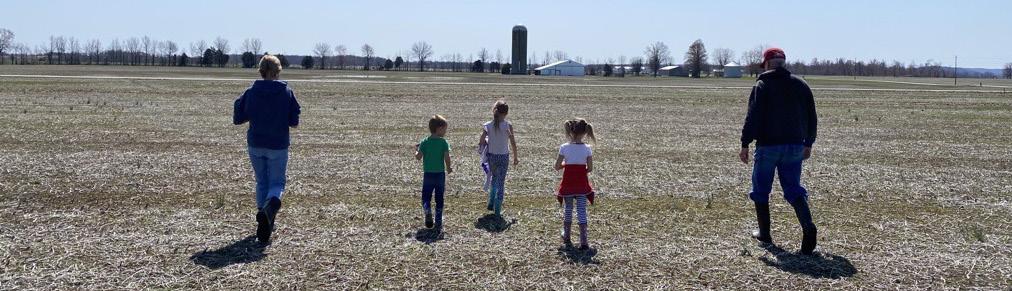
During this visit in Georgia, our customer commented, “There’s pressures that go along with keeping a family farm going; keeping the heritage alive. I felt like I owed it to my ancestors to keep this kind of lifestyle a reality.” I think many of us can share that sentiment – I certainly do. I can’t help but wonder what the future holds and feel the anticipation of what my role may be in my family farm.
Today’s economy certainly leaves a lot to be desired. When does it not? We all look forward to times when we can make more and budget less. I find myself consistently


driving 10 extra minutes to save $.10 a gallon. I fear the skyrocketing costs of the housing market may leave my children as permanent houseguests. I wonder when my beat up minivan with 200,000 miles on it goes out, if I’ll be able to find a replacement, let alone a cost-effective option. Everything costs a little more these days. Unfortunately, not taking the time to make the meaningful future decisions for an operation can be much more costly.
Outside of the operating decisions that need to be made, financing decisions are also a key part to the discussion.
There are a number of articles in this edition of Seed, Feed & Field that have to do with thinking outside of the box when it comes to financing. Whether, or not, you are making considerations for retirement, I encourage you to read these and then talk with your ag lending expert about the options that are available to you.
When it comes to securing the future of the things that are important to you, choose a partner that will listen, understand, and genuinely strive to meet your needs.
Katie Irk, Editor - Seed, Feed and Field AgFi Director of Marketing and Communications Pictured above are my parents walking through the field with my three children.Severe drought is leading California’s farmers and ranchers to fallow lands, switch to less water-intensive crops, or farm on fewer acres. Cattle producers, whose pastures are nearly barren, are selling off cattle because they have little or nothing to feed them.
In 2021, 395,100 acres of cropland were fallowed, which resulted in more than 14,000 lost jobs and $1.7 billion in lost revenue, according to the California Farm Water Coalition. It predicts this year (2022) will be worse, with 594,000 to 691,000 fallowed acres, up to 25,800 lost jobs and $3.5 billion in lost economic output.
Current development trends are sounding off additional alarms for the loss of productive farmlands.
According to American Farmland Trust’s new report “Farms Under Threat, Choosing an Abundant Future,” California ranks fifth in the nation for projected agricultural land conversion to nonfarming uses by 2040. Some 797,400 acres may potentially be idled, much of it paved over for residential, commercial or industrial development under a troublesome business-as-usual scenario.
In fact, three of the top 20 counties nationally in farmland acreage loss are in California, including
Riverside (second in the nation), San Bernardino (12th) and Fresno (17th). Other notable counties include Kern (29th), Los Angeles (30th) and San Diego (36th).
Particularly alarming is Fresno County. According to the 2020 Fresno County Crop Report, Fresno is the nation’s No. 1 agricultural county. It is home to 1.88 million acres producing more than 350 different crops, contributing billions of dollars to California’s economy and supporting 20% of all jobs in the Fresno area.
To see how quickly a valuable agricultural region can disappear, we need look only to the not-sodistant history of Southern California. Los Angeles County “was once the largest, most bountiful agricultural county in the U.S. (for four decades, between 1909-1949). It’s now primarily urban and is the most populated county in the nation,” explains University of California’s Rachel Surls, coauthor of “From Cows to Concrete: The Rise and Fall of Farming in Los Angeles.”
In an interview with Dr. Rose Hayden-Smith, Surls described how the transition sped up after World War II, when the nation needed more affordable housing.
But California’s agricultural land loss means less land to provide the bounty of food and fiber to the rest of the United States and the world. It means less prime agricultural land to provide a carbon sink, groundwater recharge, riparian buffers for fish and wildlife, and scenic viewsheds for all. Not to mention, the loss of farmland means a devastating impact on our local and state economies.
There is no question that creating new housing is critical. The state needs millions of units of affordable and “climate-friendly” housing, Gov. Gavin Newson declared in a recently posted letter to the California Air Resources Board on California’s Climate Commitment.
But California can both provide housing and protect as much of California’s irreplaceable agricultural resources as possible. American Farmland Trust’s report lays out three future development scenarios: runaway sprawl; business as usual; and better built cities.
AFT promotes the “better built cities” scenario for clear reasons. It envisions successful efforts to reduce the footprint of residential, commercial and industrial development on productive agricultural land. While the scenario still results in conversion of some agricultural land, it envisions a future with vibrant, compact cities and towns, and abundant farm and ranch land to meet future needs.
By choosing the “better built cities” scenario instead of “runaway sprawl,” Californians can save 413,200 acres of farmland and ranchland. That means saving 2,805 farms, preserving $545 million in farm output and keeping 7,124 jobs.
We know planners need support to protect our agricultural resources with the greatest potential to effectively infiltrate and conserve water during this historic drought.
That’s why AFT and Conservation Biology Institute created the Project Prioritization Tool, based
on data analysis of the San Joaquin Valley Land and Water Strategy Report. This conservation decision-making tool helps increase adoption of water infiltration practices, improves groundwater recharge and protects agricultural land in San Joaquin Valley, and it may soon be used across the state.
Unfortunately, California hasn’t increased its investment in agricultural land protection, despite historic state budget surpluses. The Golden State’s per-capita investment is 11 cents, while Delaware’s investment is $6.03, according to Farms Under Threat research from 2020.
The decisions our California communities make now with respect to managing housing density and urban growth are critical for our future. It is essential that we accommodate additional population increases without compromising still more important agricultural land and open space. California agriculture—and America’s food supply—depends on it.
(Kara Heckert is the Resilient Agriculture West advisor and former California regional director for the American Farmland Trust. She may be contacted at kheckert@farmland.org.)
Reprinted with permission for use from the California Farm Bureau Federation.
Heckert, Kara. “California needs housing, but must protect its farms.” Ag Alert, 9 September 2022, https://www.agalert.com/ california-ag-news/archives/sept-7-2022/ california-needs-housing-but-must-protect-itsfarms/.
With the new year officially here, now is the time to consider important factors affecting farm finances. AgriFinancial Regional Sales Officer, Barry Rager, says, “The first thing to know is what your financial obligations are to determine what your cash position needs to be.”
but Rager says there are still good options for producers looking to restructure, refinance, or make a new purchase. “Traditionally, we see quite a bit of land come for sale this time of year,” he said. “Farmers shouldn’t be scared to make the move because interest rates look different than they did a year ago.”
With the swift turn of the calendar, producers across the country pause to reflect and to plan for the upcoming planting season. The close of another year also marks a crucial period for a producer building their balance sheet.
Barry adds, “As you start to pull together numbers for your annual financial statements, all of these factors are equally important to know the financial strength of your operation, how they affect cash flow, and the structure of any existing debt you have, especially if you have plans to make a purchase in the near future.”
So, what happens to your purchasing power if you are looking for financing? It’s no secret that interest rates have seen significant fluctuations,
As for options? Rager says considering an agequity line of credit can provide a dependable and flexible source of capital for a producer. “You can borrow up to 50% of your bare-land owned equity,” he explains, “There’s no, non-use fees and the funds are transferred into your account next day, so this option not only strengthens a farmer’s buying power to make a quick decision, but also protects their cash reserves.” Rager also noted that with elevated land values, now is the time to gain access to built-up equity.
He also spoke about tranching a loan. This method includes placing a portion of a loan amount on a longer-term, fixed rate and another portion on a short-term, adjustable or variable rate product. This allows a producer to protect cash flow and hedge interest rates with the option to prepay or convert at any time when rates look more appealing.
By taking advantage of this “tranching” method, the risk of rate movement can be managed very closely while the debt balance is high. As the debt pays down over the years, rate movement becomes less of an issue. Using this strategy saves the producer money when compared to using a long-term fixed rate for the entire balance.

Figure 1.1 shows an example amortization of a 20-year fixed rate loan. Here's a brief summary of what the payments would look like:
OPTION 1:
• $1,200,000 financed on a 20 year fixed rate of 6.8%.
• The annual payment would be $111,516.81 each year until the loan is paid in full.
Figure 1.1: Option 1 - 20 Year Fixed Rate
A Better Option? Part I
Figure 2.2: Option 2 - Tranched Loan PART II
Option?
Figure 2.1: Option 2 - Tranched Loan PART I 10-Year VRM 6.4%
Figure 2.1 and Figure 2.2 on the opposite page provide an example amortization/rate reset of a tranched loan. Here's a brief summary of what the payments would looks like:
OPTION 2:
• $500,000 financed on a 5 year VRM of 5.9% with a 20 year amortization.
PLUS
• $700,000 financed on a 10 year VRM of 6.4% with a 20 year amortization.
• When combined, the Initial Weighted Average Rate is 6.15%
• The combined annual payment would be $106,264.81 each year for the first five years until the rate resets on the 5-Year VRM. It resets again on year 10 and once more on year 15. The 10 year VRM resets only once after year 10.

To better understand the differences and benefits of the two options, here’s a breakdown of the numbers.
Annual Payment on Option 1 = $111,516.81
Annual Payment on Option 2 = $106,264.81* Annual payment savings = $5,252.00
Interest Paid on Option 1 in Year 1 = $81,600
Interest Paid on Option 2 in Year 1 = $74,300 Savings on Interest in Year 1 = $7,300
Interest Paid on Option 1 through Year 5 = $386,225.55
Interest Paid on Option 2 through Year 5 = $350,466.22 Savings on Interest through Year 5 = $35,759.33
Remaining Loan Balance on Option 1 at the end of Year 5 = $1,028,641.49
Remaining Loan Balance on Option 2 at the end of Year 5 = $1,019,142.15
Principal is paid down by an additional $9,499.34
Rager concluded by saying, “There are many bankers out there who are only going to sell you on rate, but that’s just a small piece of the puzzle. As we all know, rate is important, but structure is absolutely the key to success.”
To connect with Barry, or the ag lending expert near you, visit www.cgb-agfi.com.
For the first five years. Payment would be re-calculated once rate is reset. Examples are for informational purposes only. The results are estimates based on information input and may not reflect actual results. The results of the calculations are not a promise or guarantee of a customer’s eligibility or terms for a specific product or service. AgFi does not, by virtue of this publication, render investment, legal, accounting, tax or other professional advice. We recommend that you seek the advice of a financial services professional before making any type of investment.
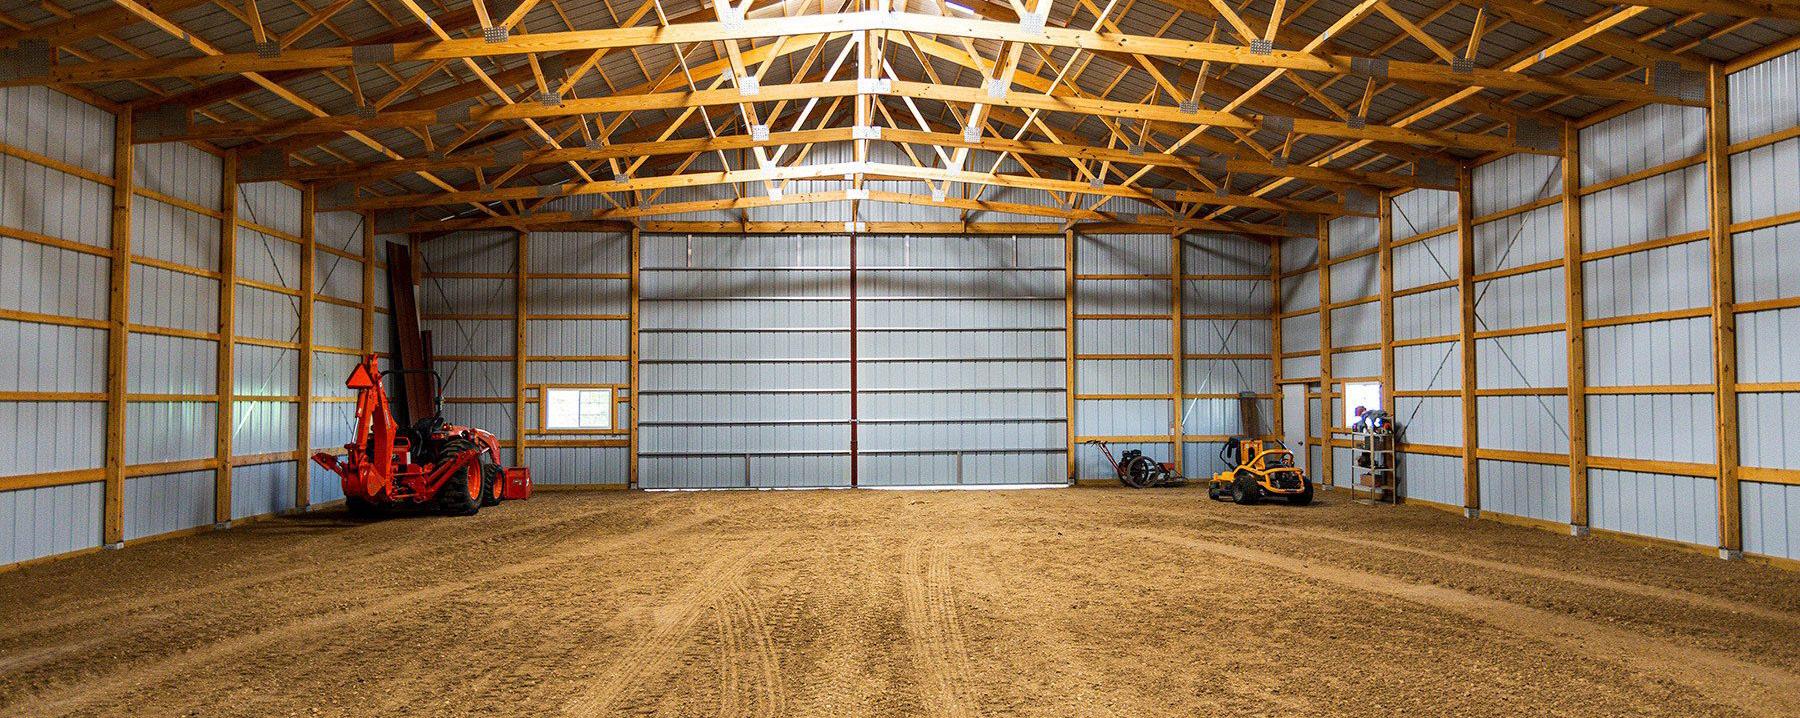
Like many other sectors of our economy, building material costs have seen significant increases in the last few years. That’s why it’s important that building owners check their insurance coverage to make sure it will be adequate to repair or replace a damaged structure – whether that’s a farm building, equestrian barn, home or commercial facility.
Given today’s busy work schedules and personal lifestyles, many building owners may not have kept track of the insured value of their buildings to determine if they will be sufficiently covered in the event of a significant loss. If not, an insurance checkup is important to safeguard your building investment.
One farmer recently lost the roof of his farm shop in a storm. The cost today to replace the trusses, roof and ceiling exceeded the total insurance assessment value of the entire building 15 years ago, and to rebuild with today’s material costs would be even higher.
Here are steps to take to make sure you are protected:
Ask your insurance agent about the total construction cost of comparable buildings which they have recently insured. This will provide a good idea of what level of insurance you need.
If your insurance is for the replacement cost, find out if there is a deduction for depreciation. If so, a resulting settlement could be inadequate to replace a damaged or destroyed building.
Be sure to include the value of any specialized equipment or finishes the building may include.
Some building owners may choose to under-insure to save on insurance premium costs, figuring they can apply those savings to help cover a possible future loss. But consider carefully whether you or your company can absorb the potential cost.
If you haven’t done so recently, contact your insurance provider now to determine if any policy adjustments are needed to make sure you are adequately protected in case of a future loss.


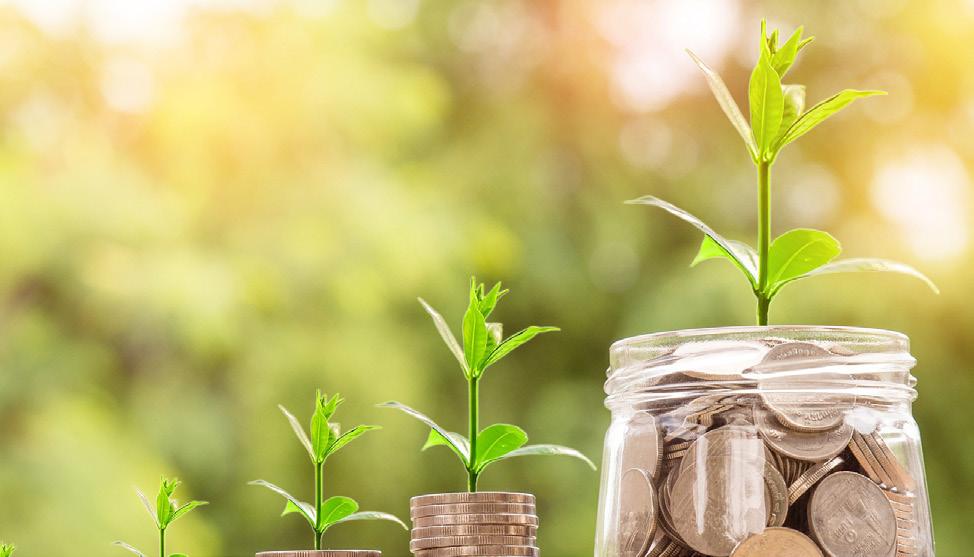
The U.S. farm economy is having a moment. The USDA forecasts 2022 U.S. farm income to be at an all-time high, and farmland values experienced robust returns in 2022. Global demand for our food, fiber, and fuel products is high. Food price inflation has supported higher commodity prices throughout the year. And tight supplies for many food products imply support for these conditions into 2023. All of this comes following a very high income and cash-flow year in 2021. An expansion of the ag economy to new heights in 2022 was not on most peoples’ bingo cards in 2020, when commodity prices were plunging and supply chains were clogged.
As fall turns to winter and last year’s harvest turns into this year’s planning session, transitions are an apt way to contextualize today’s agricultural economy. The U.S. ag economy has often operated through cycles in which a sudden change in supply or demand leads to high prices, which incentivizes production, which leads to excess supply followed by lower prices, and so on and so on. In each of these cycles, we see transitions from lowprice environments to high-price environments, transitions from low-expense environments to high-expense environments, and back and forth in a delicate dance over the course of five to ten years. When the farm economy is transitioning to a high-price environment like the one we’re in today, higher costs tend to follow, led by inputs, interest, labor, and land.
Just as farmers and ranchers prepare for their regular transitions between each marketing year, so too can borrowers and lenders prepare for transitions in the general and agricultural economy. In times of increasing costs and falling profits, working capital becomes increasingly important to both buffer the bottom line from impacts and provide opportunistic capital to
take advantage of new business prospects. During times of rising interest rates, the cost and allocation of capital are critical to future success. And often, ag lenders are trusted advisors and providers of capital to millions of farm families across the country. Planning ahead is the common theme during times of transition, as well as learning lessons from history.
The Feed creative team wishes you, your customers, and your families the absolute best in the new year. And as the new year begins, filled with opportunity, we hope this issue, packed with rich content on economic cycles, land value trends, lender competition, interest rate trends, and farm loan leverage cycles, is insightful in your planning for the interesting year to come.
Best wishes,
Jackson Takach, CFA Chief Economist at Farmer Mac
1, 2, 3
The USDA forecasts a 27% increase in 2022 Net Cash Farm Income, a common measure of farm profitability. This new record is fueled by higher commodity prices in 2022 and would be even higher, except for increases in fertilizer, feed, and interest expenses. As the longest-running ag economy expansion in the U.S. since World War II, the sector could see headwinds in 2023 and 2024, depending on supply-demand dynamics, farm expenses, and geopolitical outcomes.
After two years of higher commodity prices and elevated returns, U.S. farmers and ranchers are experiencing another expansionary ag cycle. This is the second expansion (defined as four or more years of consecutive increases in net cash farm income) in 10 years and the third in 20 years. Following a surge in commodity prices in 2021, shocks to global grain supplies—combined with
a strong rebound in global demand for dairy and protein—pushed prices even higher in 2022. Revenues are only half of the equation, and many operations did simultaneously face significantly higher farm expenses, including fertilizer, fuel, and feed. However, the increase in revenues ultimately outpaced that of expenses, resulting in an estimated record-setting level of net cash farm income (NCFI) at $187.9 billion.
Meanwhile, a low-interest environment in 2020 and 2021 pushed up farmland asset values into 2022. The value of farm real estate, the largest portion of the farm balance sheet, is expected to have increased by more than 10% in 2022.
Thus, for both the income statement and balance sheet, conditions in the ag economy look good in the near term. That said, while the fundamentals supporting the current expansion are strong, historical ag cycles have taught us to watch out for a wicked combination of rapidly rising supplies, falling commodity prices, and rising expenses.
If realized, the increase in net cash farm income in 2022 would represent the sixth consecutive year of increases, a run not experienced since World War II (see Figure 1). The incredible demand for food products and a global dip in supply for many consumer-oriented and bulk ag products helped boost prices in 2021 and helped to keep them high in 2022. The increase in 2022 was driven by higher cash receipts from corn ($19.6 billion increase, or 28%), broilers ($17.4 billion increase, or 55%), dairy ($15.9 billion increase, or 38%), soybeans ($14.5
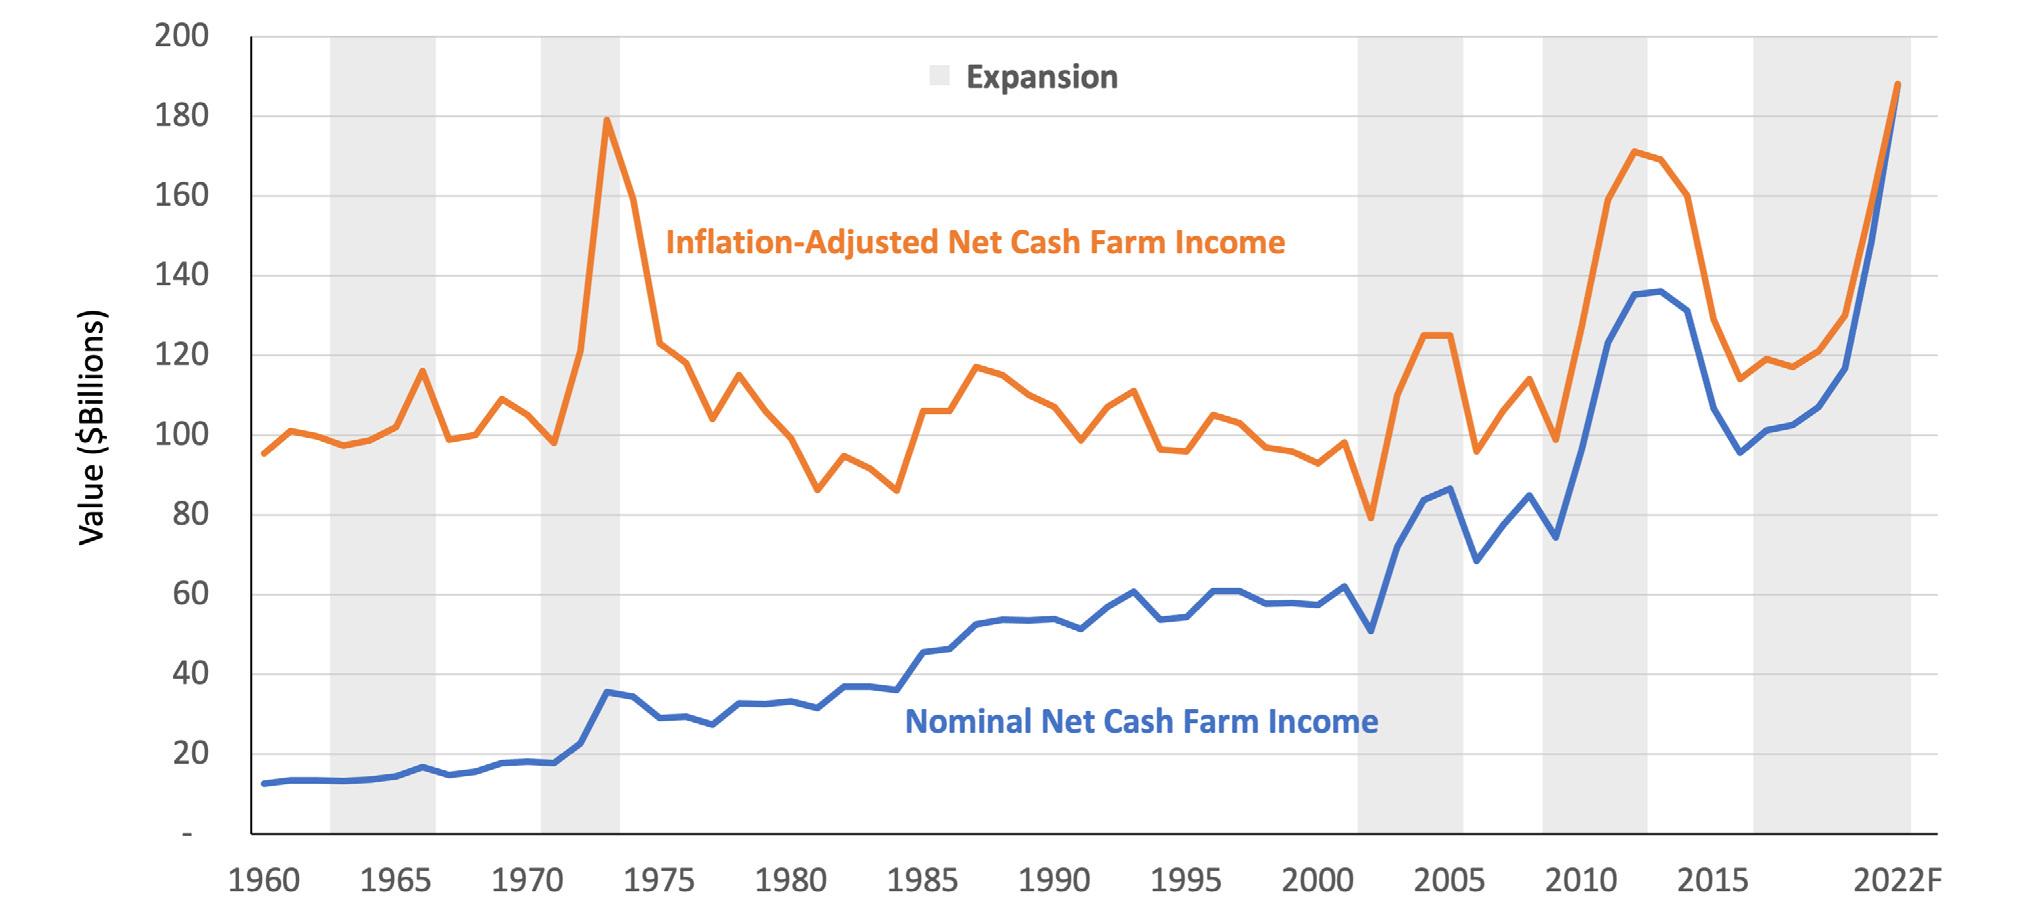
billion increase, or 30%), and cattle ($13.9 billion increase, or 19%). Only a handful of commodity categories are estimated to have experienced a decline in cash receipts in 2022, mostly vegetables and field crops. The beginning of this expansion was fueled by government support programs: the Market Facilitation Program drove more than $19 billion in total increases to NCFI between 2018 and 2019, and the Coronavirus Food Assistance Program added another estimated $32 billion between 2020 and 2022. In 2020, government payments represented 39% of total NCFI; for 2022, the USDA estimates the percentage will be less than 9% and will be roughly on par with the last expansionary cycle from 2010 to 2014. This transition of economic activity from the government to the market is typical during each cycle expansion in modern agricultural economics.
Revenues aren’t the only thing on the rise: the USDA estimates that cash farm expenses will touch a new nominal record in 2022, at over $412 billion. Even adjusting for inflation, this year’s cash expenses represent the second-highest level in history, behind only 2014. The largest single category increase is expected to be in fertilizer expense on the back of a global energy price spike, complicated by Russia’s invasion of and ongoing war with Ukraine. This was a large increase indeed; the USDA estimates
Source: USDA ERS Farm Income and Wealth Statistics, December 2022
FEED - WINTER 2022-2023
U.S. farmers spent over $43 billion on fertilizer and nutrients in 2022, a whopping 47% increase over 2021. Farmers and ranchers also spent more this year on feed (up 17%), interest expense (up 41%), and fuel (up 47%). These increases have contributed to an estimated rise in overall cash expenses of 19% in 2022, the biggest single-year jump since 2007. While many of these current drivers of farm expenses are energy-related and could pull back in the coming quarters and years, some categories lag expansions and may have yet to be seen. Seed, rent, and even interest expenses could remain sticky even if other expense categories calm down.
The composition of farm balance sheets lends itself well to a low interest rate and real asset investment environment like that experienced in 2020, 2021, and early 2022. Farm real estate represents a staggering 83% of the sector balance sheet. In part, that’s because real assets with cash flow-generating capacity, like farmland, find interested buyers during volatile economic conditions or when inflation is heightened. Furthermore, when farm incomes are rising, farmers, ranchers, and other farmland investors increase interest in the asset class. During
the five expansionary cycles since 1960, farm real estate has increased at an average real rate of 4.9% per year compared to an average real rate of only 0.1% per year during all other years. Other common measures of farm balance sheet health, including working capital, current ratio, and overall leverage ratios, all signal a financially healthy sector in 2022.
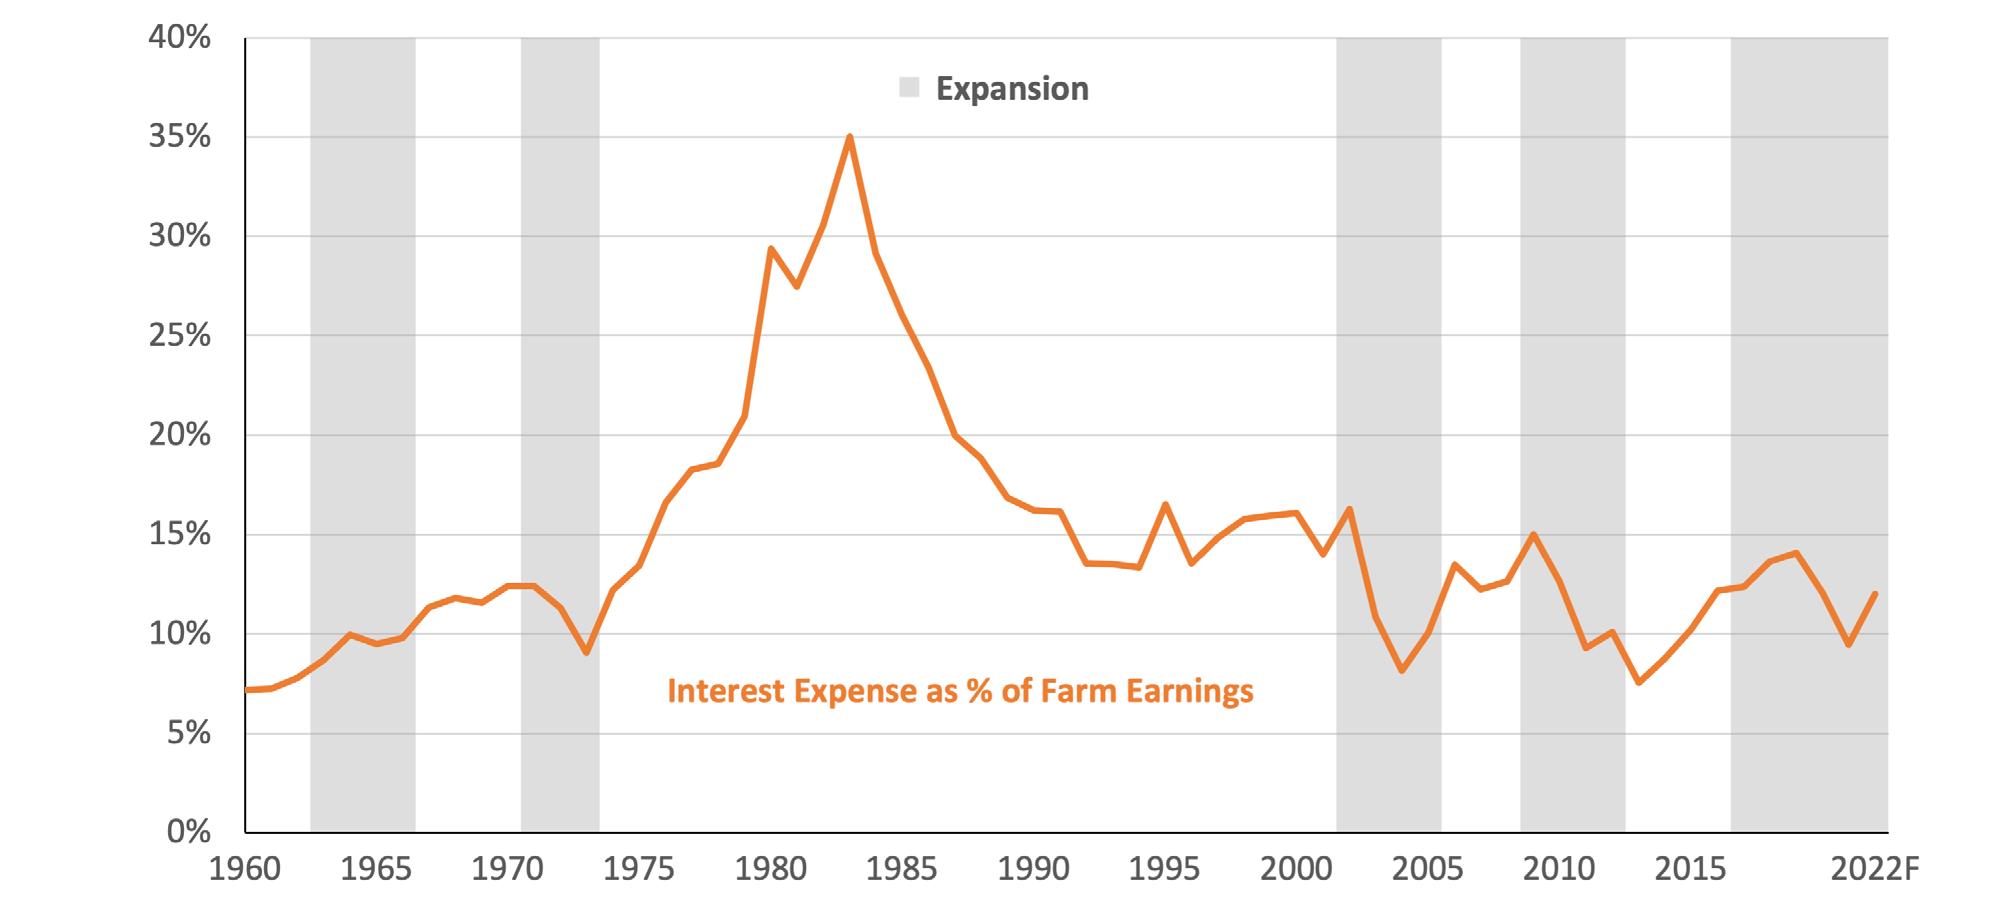
While farm debt and interest rates continue to climb in 2022, data indicate that current debt levels are supportable by the sector. First, the USDA estimates that nearly 70% of farm debt in 2022 will be secured by real estate, up from the historical average of just over 50%. Mortgages can have significantly longer terms and fixed-interest-rate periods compared to non-real estate loans, giving many farmers and ranchers significant risk reductions in the event of a rapid increase in interest rates. Second, even with a 39% increase in interest expense in 2022, the ratio of interest expense to farm earnings remains well below historical averages, as shown in Figure 2. In 1983, farmers and ranchers spent nearly thirty-five cents of every dollar earned farming on interest. Today, that figure is approximately twelve cents, below the 60-year average of fifteen cents. Both farm earnings and assets appear healthy enough to absorb a reasonably volatile interest rate environment for the near future.
THE FEED - WINTER 2022-2023
Economic expansions can languish for lots of reasons, but in agriculture, contractions are almost always associated with overproduction and ample global supply. In both the 1970s, 2000s, and 2010s, severe drought caused grain shortages. The commodity price spikes drew additional acreage into production, and in the years that followed, production and supplies outpaced demand. The current crop outlook certainly rhymes with the expansions of the past, with multiple droughtstricken regions in the U.S., South America, Europe, and Oceania. However, the rebound in production may be one or two seasons away and will depend on the outcome of the war in Ukraine as well as on global economic health. U.S. farm revenues could
hold or even advance in 2023 in the absence of exceptional weather in South America and Europe in the spring. Some expenses could retreat in the coming growing season, but any relief could also be absorbed by higher expenses in other categories. Lower energy prices may give way to higher seed, labor, water, and interest expenses. Farmers, ranchers, and lenders should prepare for budget management in 2023 and 2024 as the world steadies agricultural supply and demand. If history is a guide, NCFI should contract slightly in 2023 and potentially more in 2024. But the run could instead continue if the world sees another short wheat, corn, and soybean crop in 2023. Fortunately, farmers and ranchers are in a great position to manage through the next cycle, whenever it happens.
Financing availability for agricultural, food, and agribusiness borrowers depends on the level of interest rates, the economic outlook, and overall industry and borrower credit quality. Today’s market conditions are in flux, signaling a potential change in lender market liquidity. Competition remains stiff between Farm Credit System institutions and commercial and community banks, and changes in the interest rate environment and economy could signal a shift in growth patterns.
Editor’s Note:
Contributing Author Zachary Carpenter is the Executive Vice President – Chief Business Officer at Farmer Mac. Through a career spanning over two decades of work in financial services, Zack has accumulated deep expertise in analyzing the ag economy and the agribusiness value chain.
In the last issue of The Feed, the article “The Improved Financial Health of Ag Borrowers and Lenders” explored how the strength of farm finances (and the capital providers serving them) has significantly improved since the farm crisis of the 1980s. In that article, we identified some reasons to believe that ag producers and lenders are on solid footing despite recent market and agriculture volatility. Here, we continue that thread by exploring how the financial sector has supported borrowers during past volatile economic environments and how lenders might respond in this one.
When we look at prior periods of volatility, we see that most financial institutions generally managed financing deployment based on the level of interest rates, market environment (e.g., recession or expansion), and industry and borrower credit quality. The circular movement of financial market financing availability is largely based on the interaction of and the expected future path of these components. For example, as credit quality improves, more lenders compete for loans in the industry. As interest rates are reduced, more borrowers seek credit, and competition for high-quality borrowers picks up. As industry profitability wanes, credit quality deteriorates
and competition for ag loans slows. Finally, as interest rates increase, fewer borrowers seek credit, reducing the supply of lending opportunities and increasing competition.
As Figure 3 depicts, the current environment has transitioned through a period of historicallylow interest rates, an expansionary market, and generally favorable credit quality, ending in a period of significant financing availability but also significantly higher interest rates. As the perceptual map indicates, agricultural and agribusiness lenders are currently experiencing an ‘opportunistic’ lending environment characterized by a decline in loan demand, forcing lenders to strongly compete for opportunities when they exist. As we proceed through what could be a volatile 18 months, it remains to be seen if financial sector liquidity will transition into a more ‘defensive’ posture that could impact the overall health of the agricultural borrower. When industry conditions are ‘defensive,’ lenders pull back from the industry and tighten lending standards and conditions, which increases the financial burden placed upon borrowers.
To better explain this transition, we first assessed liquidity in the syndicated and commercial and Figure 3: Ag Lending Cycle Perceptual Map
industrial loan markets and their respective loan growth rates over the last 20 years. The result is a clear correlation between the components highlighted above. There was a significant decline in large, syndicated loan volume during the great financial crisis, and this decline strongly correlated with a large decrease in commercial loan growth for all U.S. banking institutions during the same period. The market stresses brought on by the COVID-19 pandemic resulted in a similar outcome.
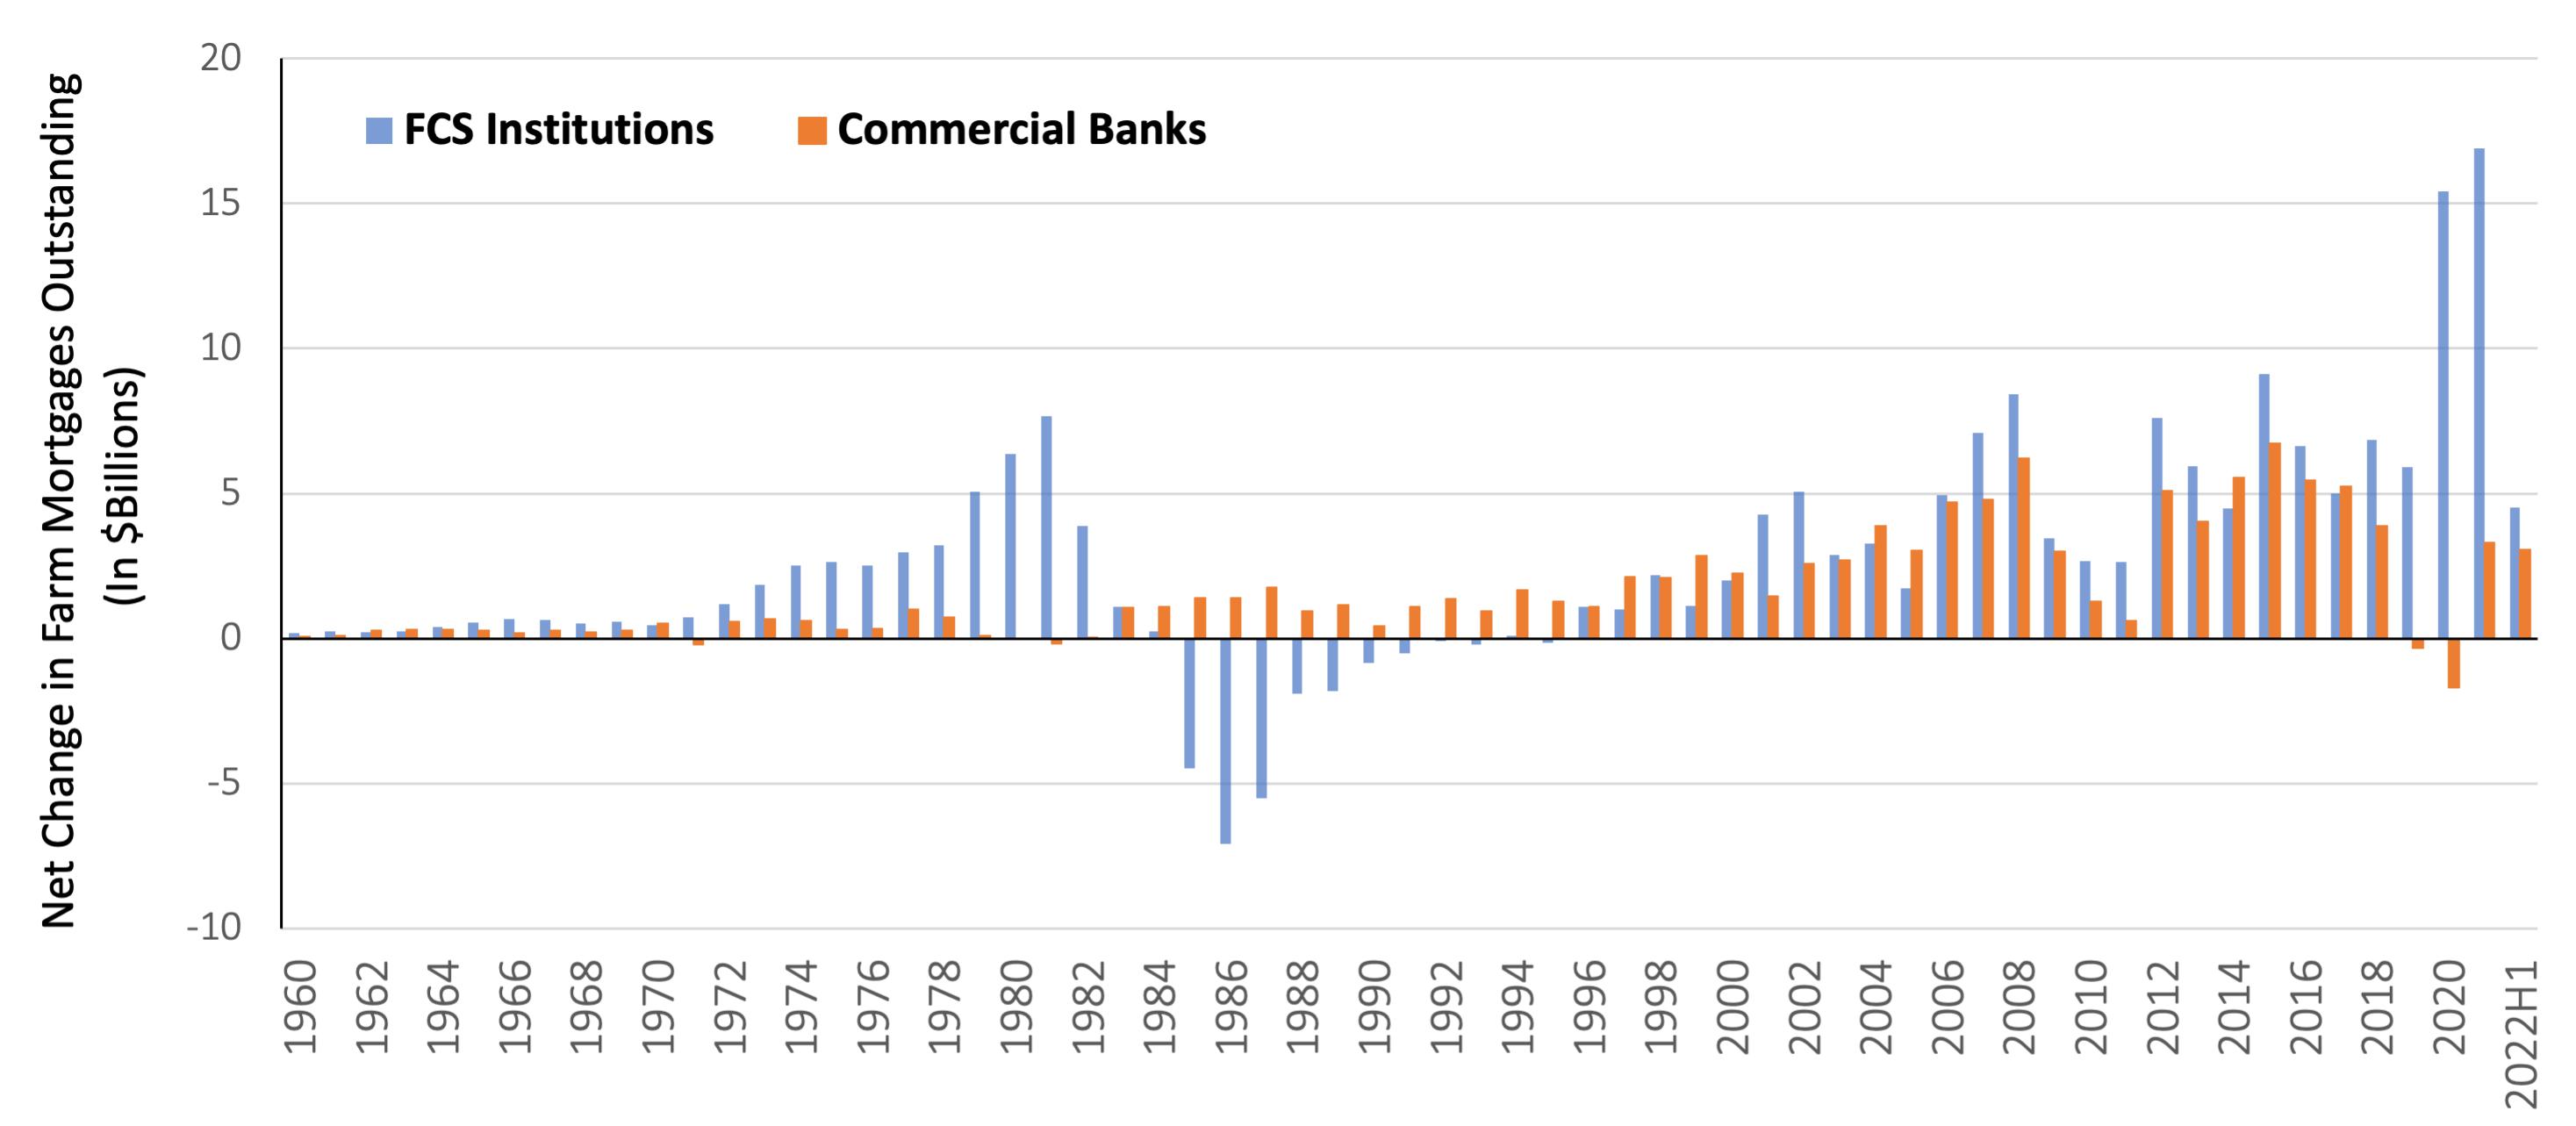
One unique twist on this dynamic is the competitive balance between Farm Credit System institutions (FCS) and commercial and community banks (which we will refer to here simply as “banks”). Since 2005, there have been very few quarters in which real estate and operating debt commitments decreased in the FCS, even during the great financial crisis of 2008. In fact, real estate and operating debt within the FCS increased by 18% and 22%, respectively, during the great financial crisis. Conversely, there was an overall decrease in growth for the same types of loans within banks. A similar scenario occurred during the recession caused by COVID-19 in 2020. Historically, during periods of rising interest rates, farm mortgage lending at banks has grown faster than at the
FCS, and the opposite has been true during periods of declining interest rates.
Figure 4 highlights the net annual change in farm mortgages outstanding at FCS and banks. In periods of stable and rising interest rates, banks showed positive growth that outpaced the FCS (1980s and 1990s), and in periods of falling rates, the FCS growth outpaced that at banks (2010s and 2020s). As of June 30, 2022, after two years of record-low interest rates, only three of the top 20 agricultural lenders are banks, and those three banks’ portfolios declined by nearly $2 billion in total agricultural loans in the last 10 years. The top three FCS lenders gained nearly $30 billion in total agricultural loans over the same time period.
It remains to be seen how the financial markets will react to the potential market volatility over the next few years. The strength of the financial sector, capital and liquidity levels, and industry and borrower credit quality is at a decades-long high. This environment has historically aligned with more competition and available liquidity. However, it is important to keep in mind that, as past market stresses have shown, conditions can reverse course quickly.
THE FEED - WINTER 2022-2023

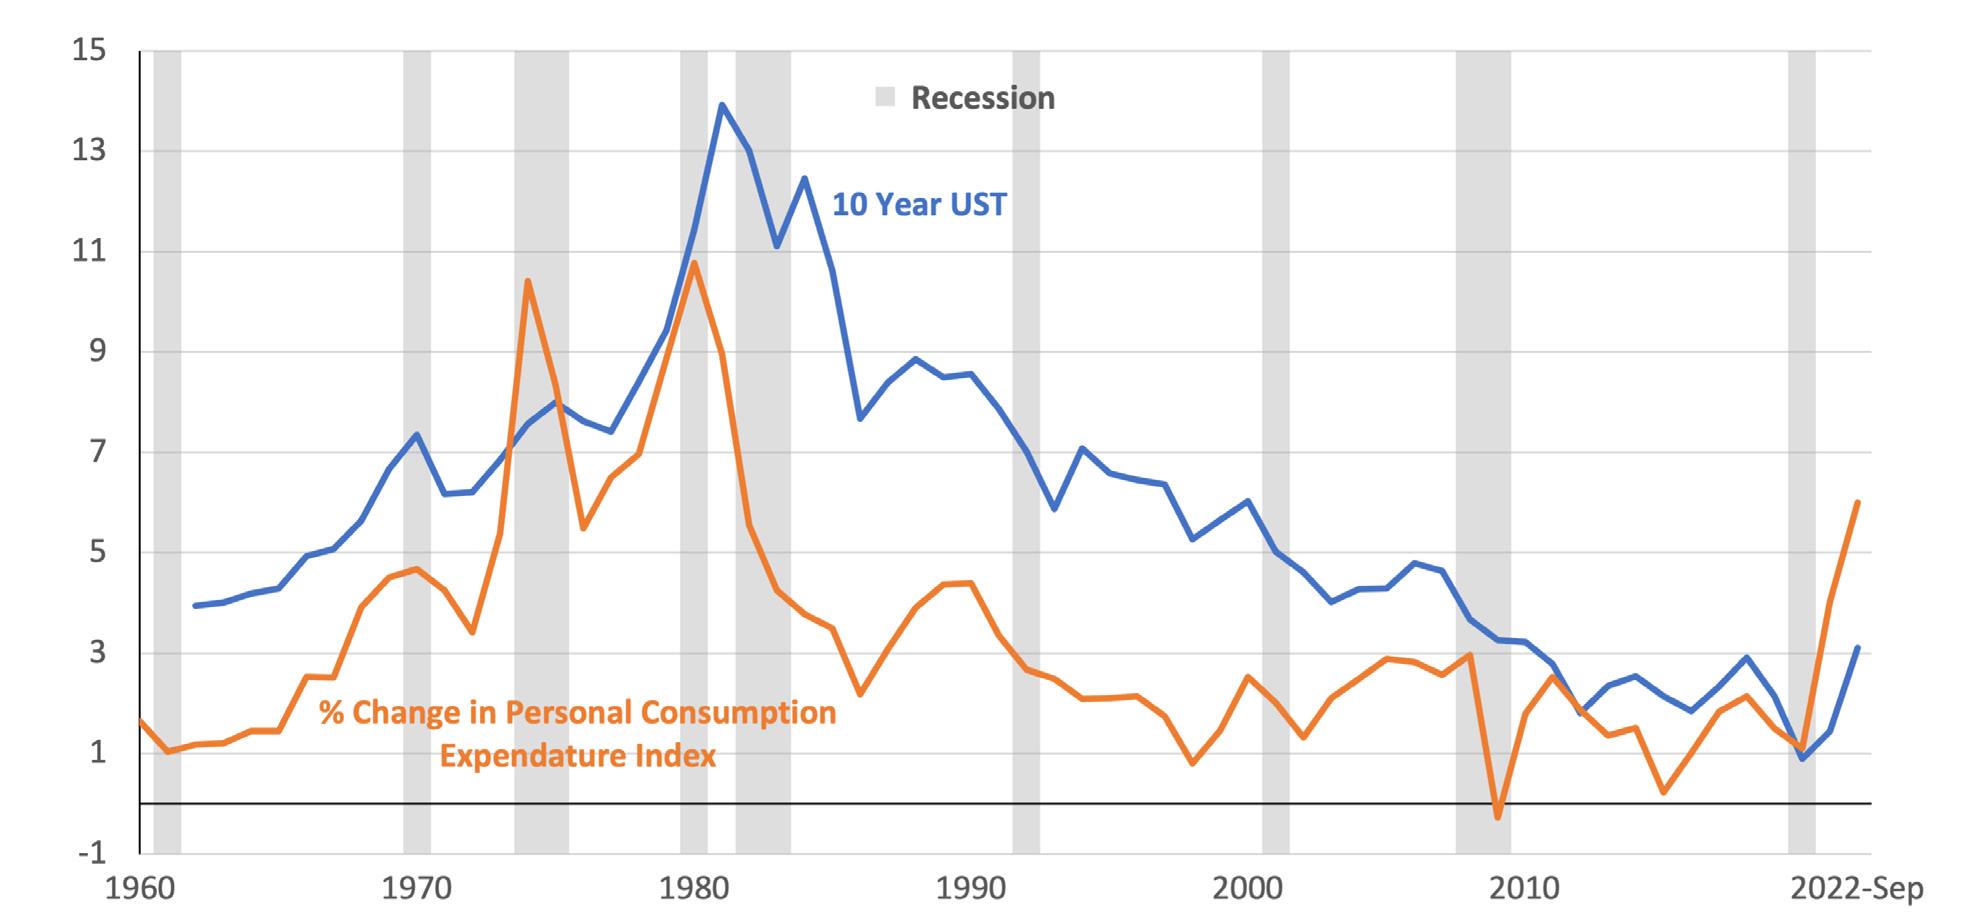
Consumer price inflation rocked the U.S. economy in 2022 as the price of nearly everything increased rapidly. Interest rates are inextricably linked to inflation, as the U.S. central banking system uses monetary policy tools to attempt to stabilize prices. The inflation-adjusted 10-year U.S. Treasury rate will be an interesting bellwether to watch in the coming year. Real interest rates remain in negative territory, indicating the Federal Reserve still has some work to do, but farmland values could continue to see support if commodity and food price inflation remains elevated.
No matter the context, inflation has been one of the biggest economic stories of the year. What started with an increase in the price of used cars and appliances in 2021 continued with a spike in the price of groceries and gasoline in 2022. The story is now about the rising price of everything in 2022, affecting consumers of all stripes and delivering the fastest increase in the price of U.S. goods and services since the 1980s.

The causes of increasing prices can be numerous and nuanced, but the effects can be a blunt force: the consumer can afford less and is forced to adapt behavior. And because an estimated 70% of the U.S. economy is powered by consumer spending, changes to consumer behavior are a huge deal.
One cure for a rapidly rising price environment is to raise the price of money—or, said differently,
to increase interest rates. Central banks have been using that prescription to fight inflation for decades, and the last time the U.S. experienced inflation at this level (in the 1970s), the Federal Reserve (the Fed) raised interest rates and successfully tamped down inflation. While today’s economic environment is different from that in the 1970s in many ways, the relationship between inflation and interest rates continues. Figure 5 highlights this historical relationship as well as the recent increase in both inflation and interest rates.
Price inflation typically starts with either a supply-side shock or excess demand. In a supplyside shock, the supply of goods and services is constrained, which causes retailers and wholesalers to raise their prices in response to the lack of available products to take to market. An example of supply-side inflation is when a kink in the gasoline supply chain causes prices at the pump to spike. With excess demand, on the other hand, consumers have an ample amount of funds and are willing to bid up prices in order to secure the goods and services they demand. An example of excess demand was seen when housing prices boomed in the mid-2000s, where
home buyers had a seemingly endless supply of available credit and too many buyers were chasing too few houses on the market.
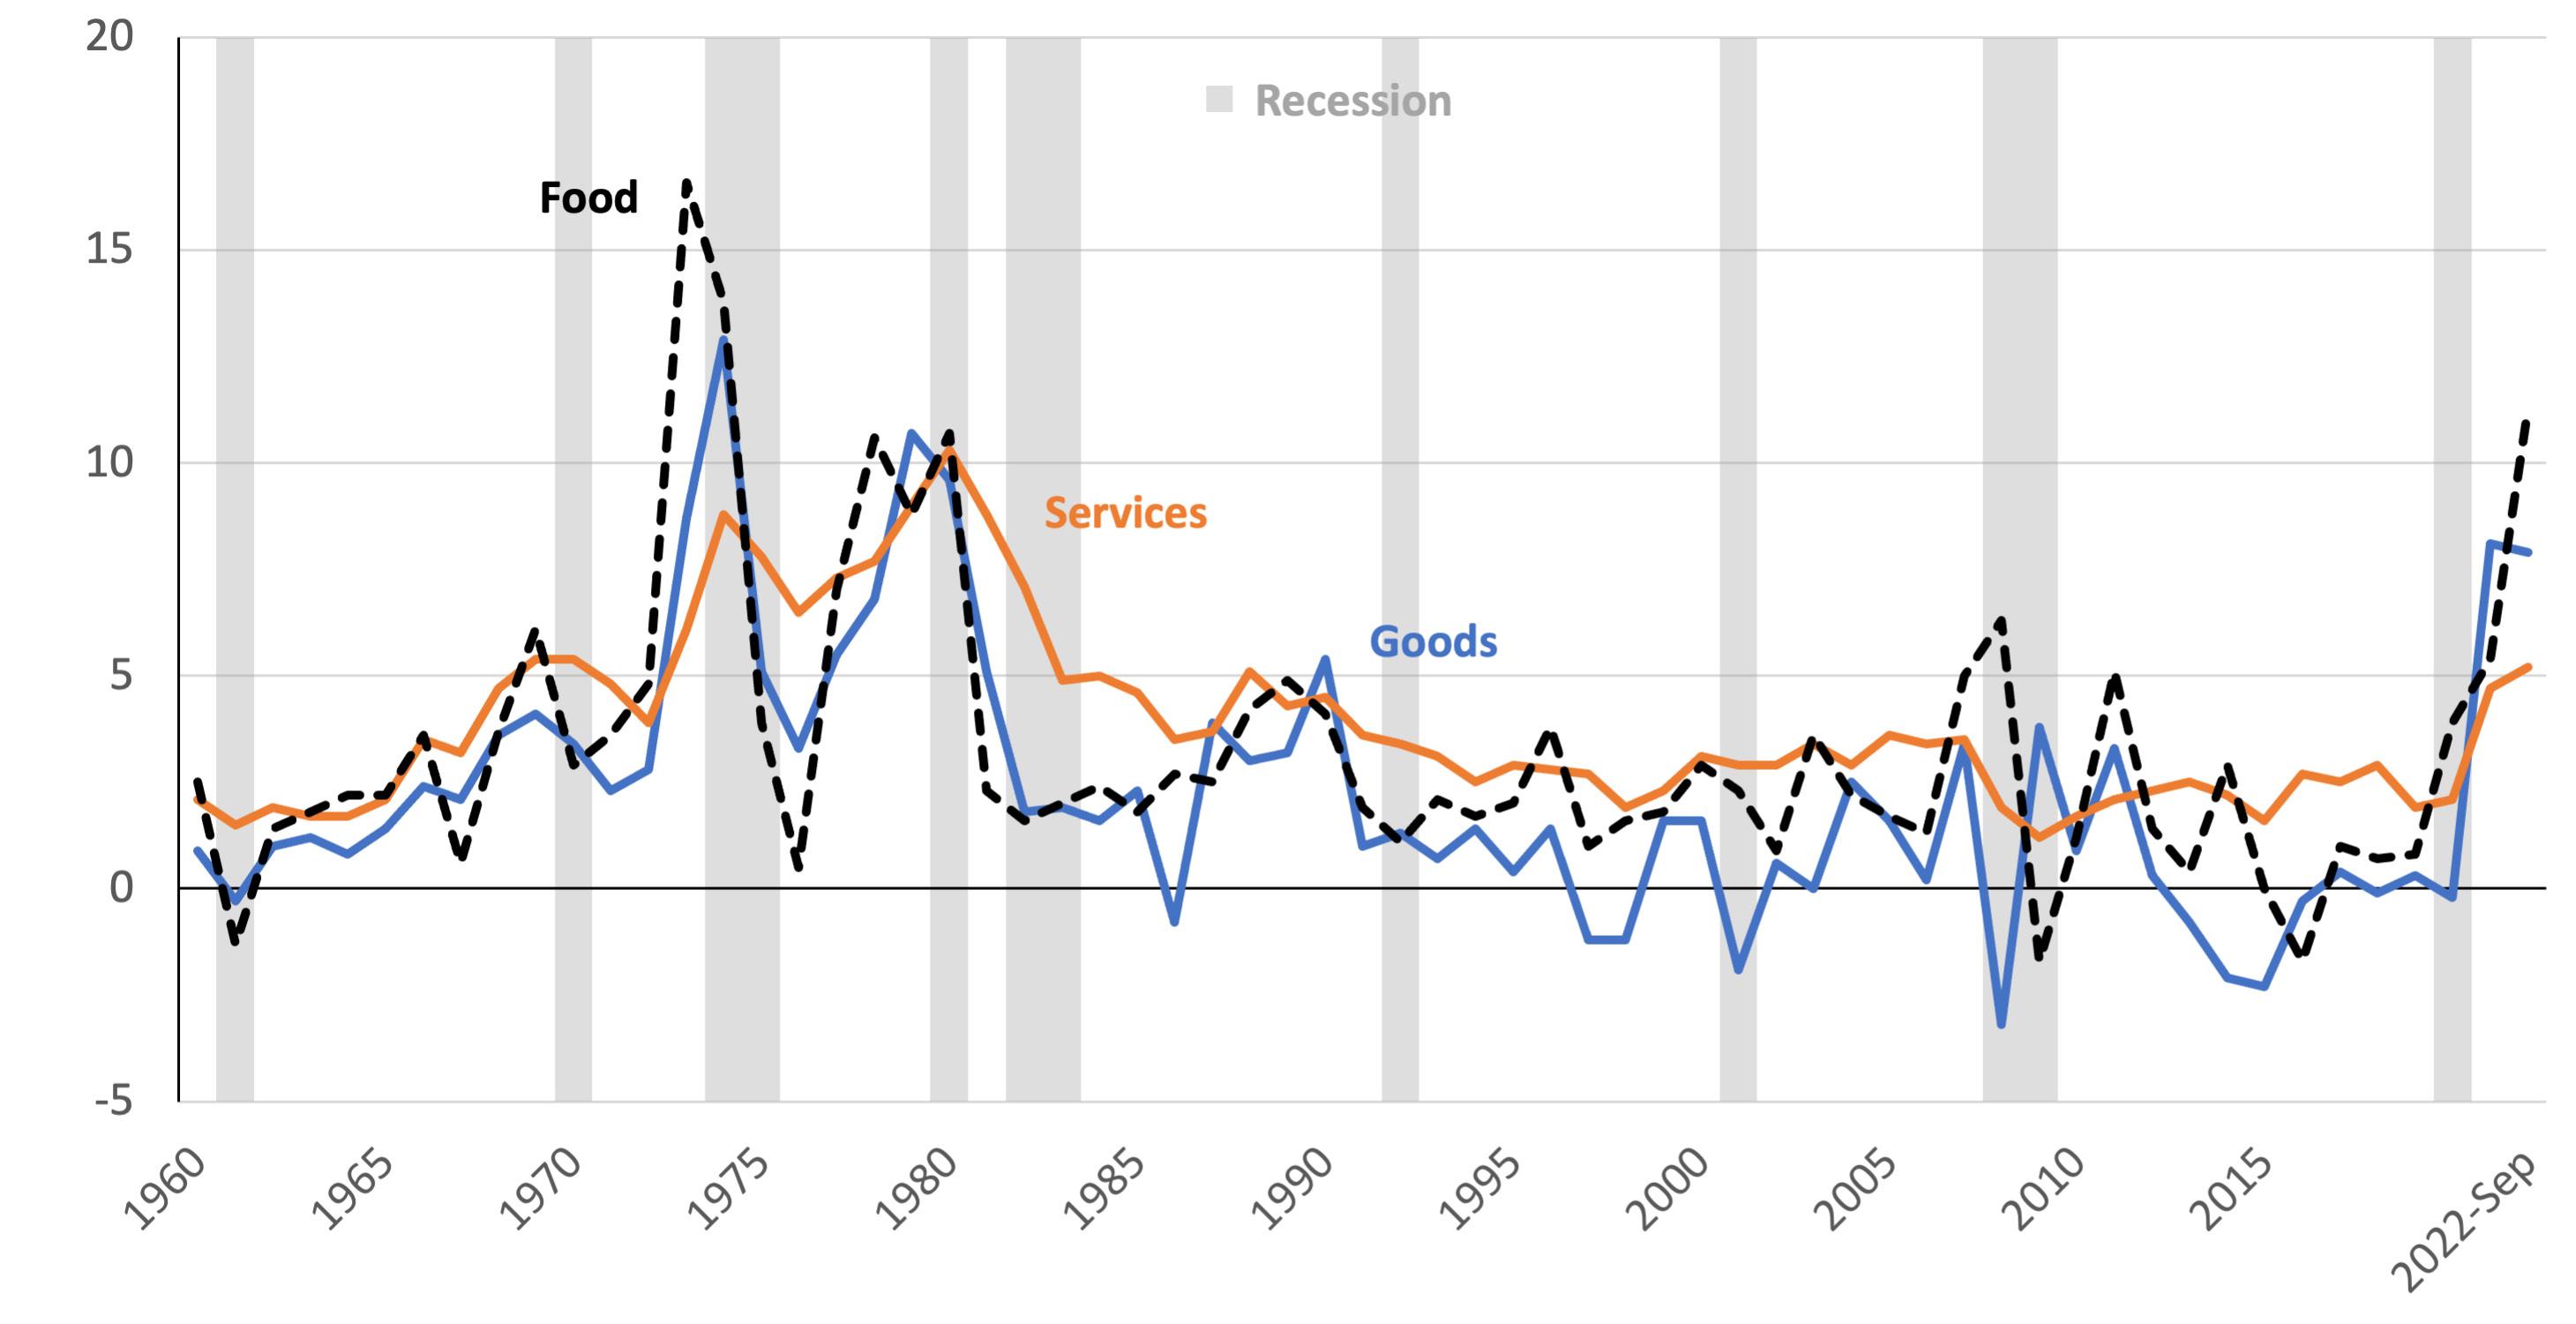
In the shadow of the COVID-19 pandemic, the U.S. faced both sets of inflationary conditions. First, supply chain disruptions caused a decrease in the availability of goods for consumption. Everything from food to futons was seemingly out of stock or difficult to find. Global shipping costs skyrocketed as lockdowns closed ports, and many manufacturing plants temporarily closed to attempt the prevention of viral spread. Second, government support programs blanketed U.S. consumers with cash in 2020 and 2021. These payments helped offset wages for millions during global lockdowns, buttressing mortgage and credit markets from potential calamity; however, they also provided the fuel for a surge in consumption. Finally, Russia’s advance on Ukraine and the global sanctions that followed put the oil and energy markets into disarray. This final nudge exasperated both supply-side constraints and demand-side surges. Figure 6 displays the 12-month trailing price level increases for U.S. goods, services, and food for the last 60 years. While inflation rates slowed in the fourth quarter of 2022, level increases are at their highest since the 1970s.
Percentage
THE FEED - WINTER 2022-2023
Seeing the pressure building on consumer prices, the U.S. central bank took action in early 2022. The Federal Reserve Act of 1913 clearly sets the objectives of the Federal Reserve System to conduct monetary policy “…so as to promote effectively the goals of maximum employment, stable prices, and moderate long-term interest rates.” Two arrows in the Fed’s quiver of tools are to raise and lower the Effective Federal Funds Rate (Fed Funds) and to buy and sell market assets onto its balance sheet. The Fed Funds rate is the reference rate for which banks and depository institutions charge each other to borrow and lend short-term money to meet regulatory capital requirements. A higher rate encourages banks to hold more capital and reduce borrowing, thereby constricting the economy. Buying and selling assets is a way to influence more long-term and credit market interest rates by absorbing any excess supply of long-term bonds like a sponge. Conversely, the Fed can raise long-term market rates by selling assets or simply not buying assets and letting that water in the sponge re-enter the market.
In March 2022, the Federal Reserve shot both arrows, raising the Fed Funds rate target by 0.25% and ceasing new asset purchases. Since then, the Fed has raised the target rate five times and shrunk the massive balance sheet by 4% in the fastest U.S. monetary policy tightening cycle since 1981.
Where inflation, interest rates, asset prices, and Fed policy collide is in the concept of real interest rates. A real interest rate is a security’s market interest rate adjusted for the rate of inflation. Figure 7 shows the rate of return on a 10-year U.S. Treasury bond adjusted for the level of inflation as measured by the increase in the Personal Consumption Expenditure price index. When real treasury rates are high, as they were in the 1980s and 1990s, the returns to risk-free assets attract more investors, and money flows out of risky assets like stocks and real estate and into fixed-income investments like bonds. Conversely, when real interest rates are low, the real cost of borrowing incentivizes investors to borrow
THE FEED - WINTER 2022-2023
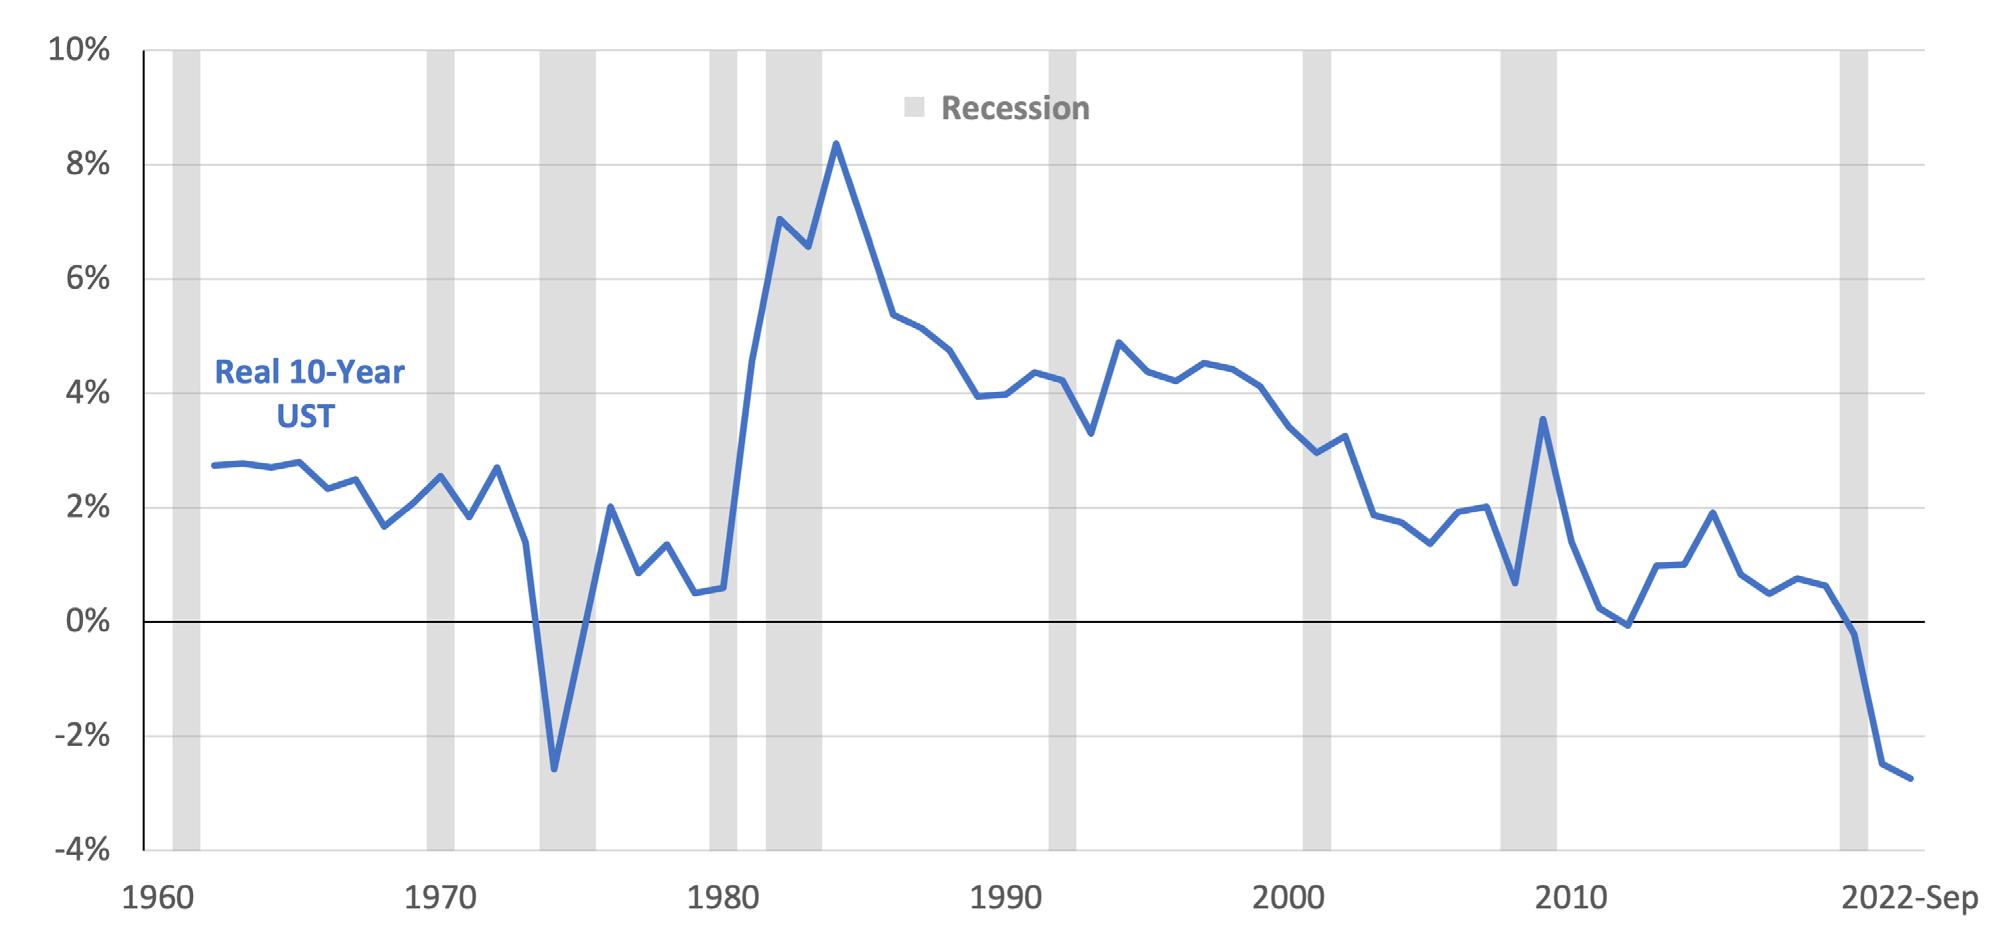
and invest in risky assets to achieve higher returns. In the extreme case of negative real interest rates, risk assets can see extreme price appreciation as investors borrow more to try and capture rapidly rising returns from inflationary prices. In the 1970s, negative real interest rates correlated with the fastest rise in farmland values in modern history. Similarly, negative real interest rates in 2013 and 2021 corresponded to large increases in farmland values. And despite rapid increases in rates in 2022, real interest rates remained in negative territory in the fourth quarter of 2022.
The level of real interest rates could be an interesting leading indicator to monitor. First, if food price inflation remains positive and real interest rates remain negative, there should be support for farmland values to hold or possibly advance, even in the face of higher interest rates. Second, inflation levels may indicate where the Fed could drive interest rates in the coming months. If inflation is hovering around 5% and the long-term average historical real interest rate is 2%, the Fed is likely to continue to tighten monetary policy. However, if inflation starts to come back down to 3%, the Fed is likely to slow or even pause tightening as the real rate would start to approach 1%. While it may not be a perfect crystal ball, any clarity in the haze of inflation and interest rates is a welcomed focus.

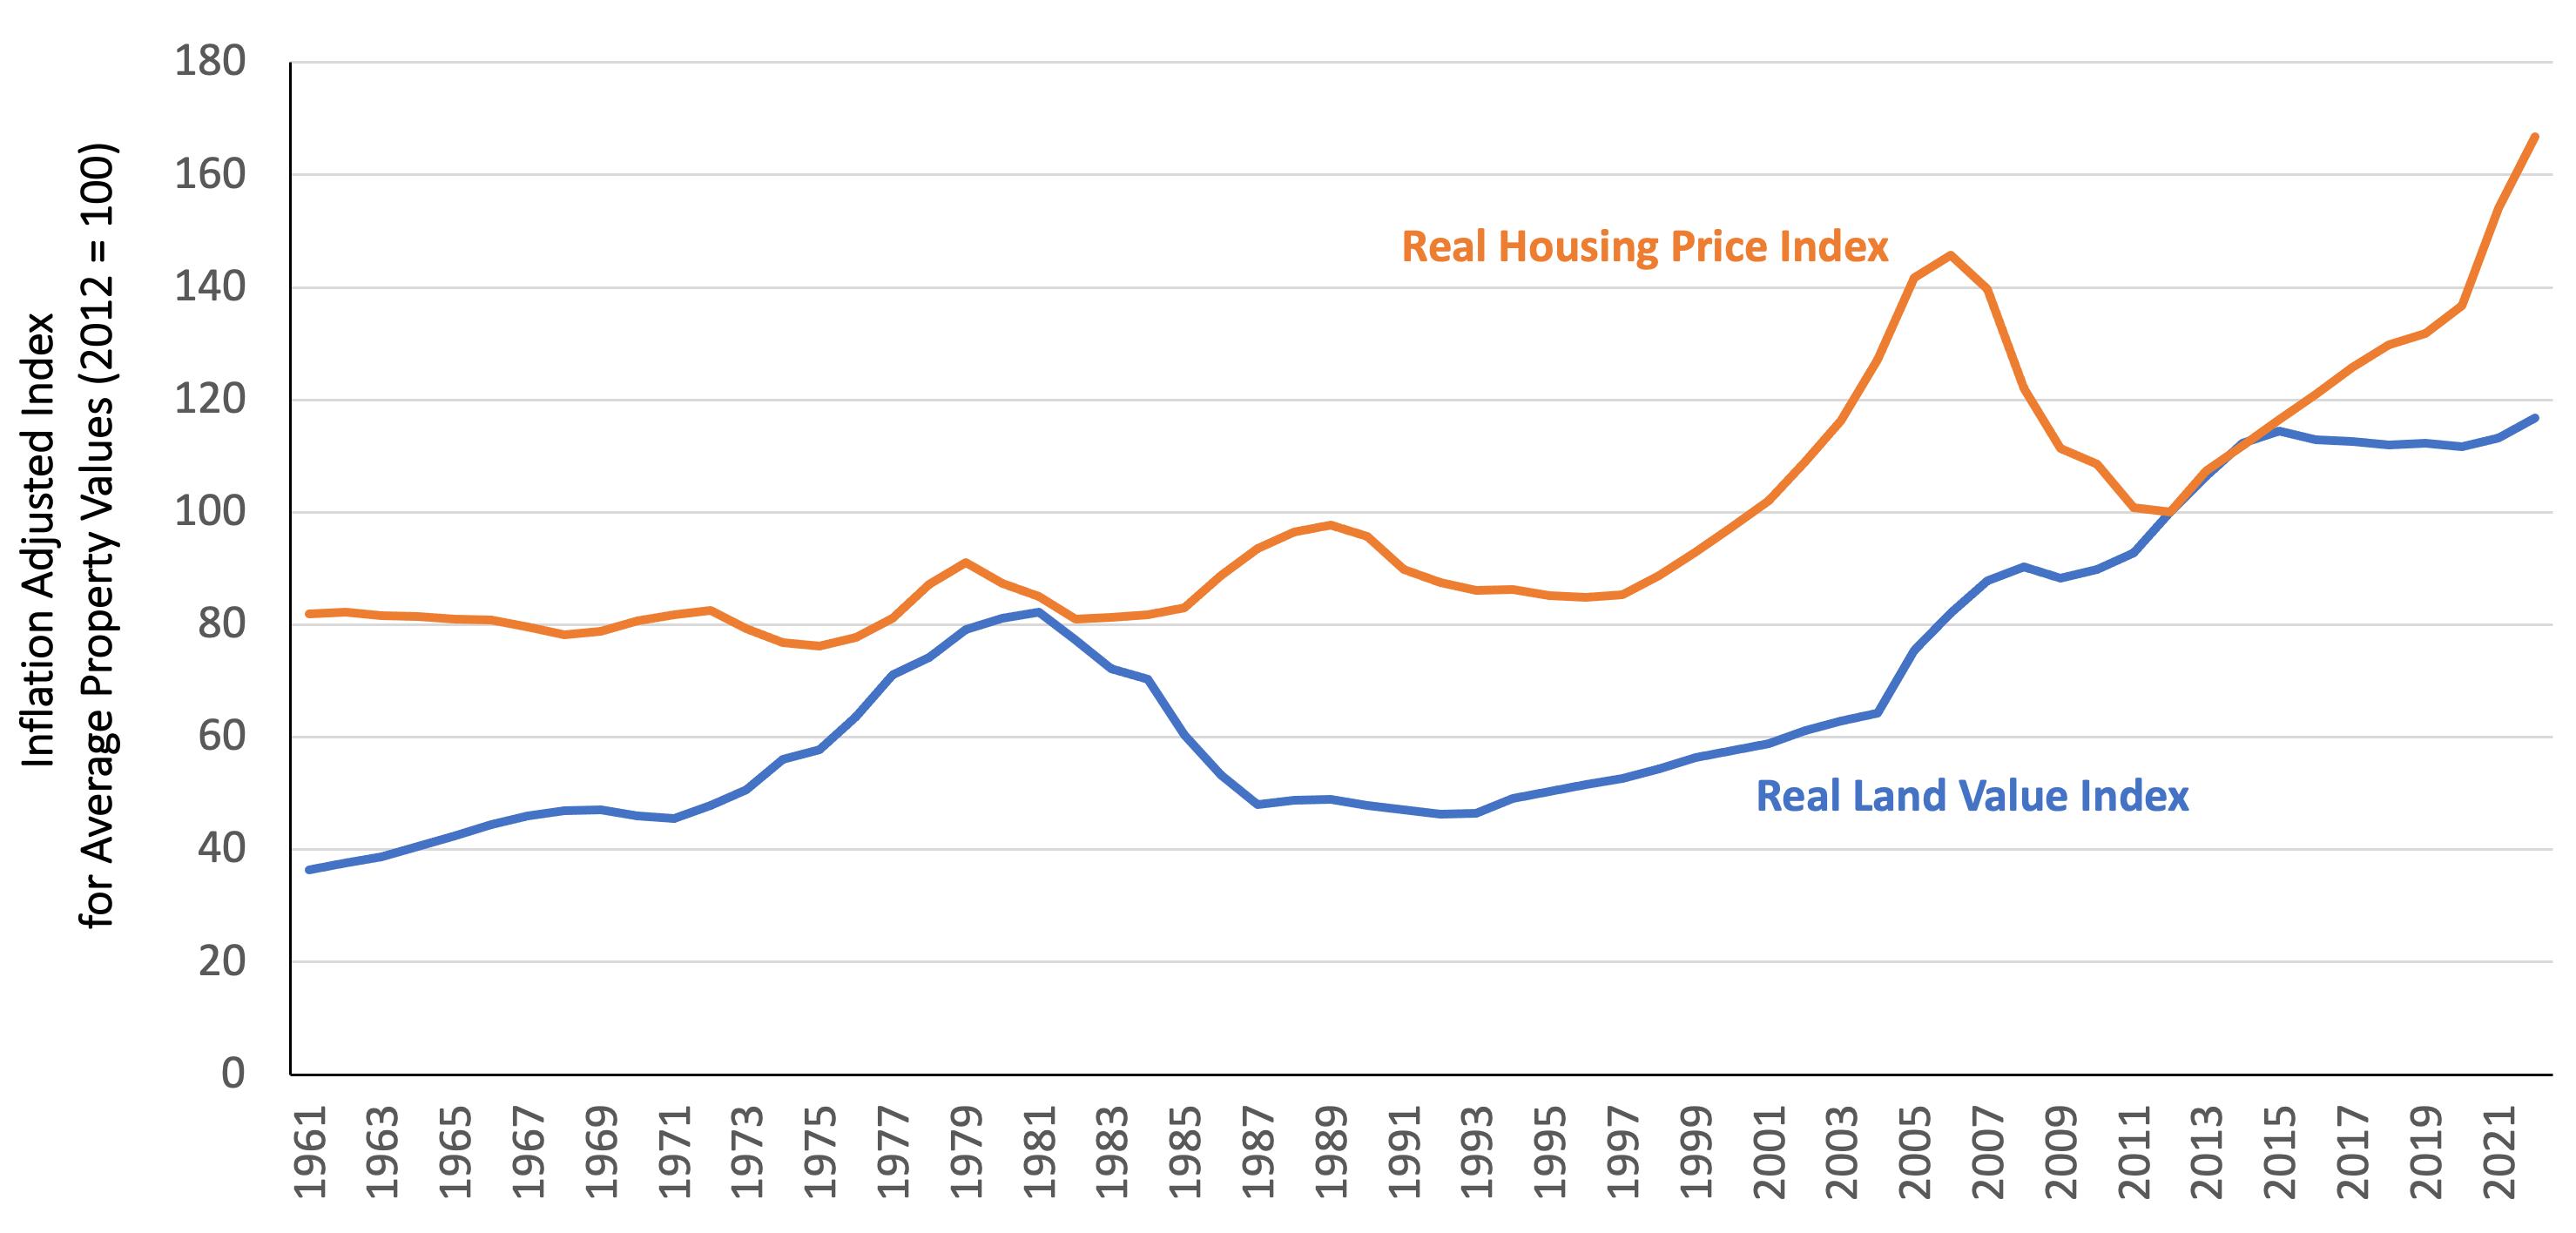
The USDA reported a gain of 12.4% in average U.S. farm real estate in 2022. The increase was supported by a low interest rate environment and record-setting farm income levels. However, adjusted for inflation, the gains in farmland in 2022 are only the 24th highest in history. Therefore, farmland prices are likely to be significantly less volatile than housing prices, stocks, or bonds.
Every August, a team of economists at the USDA’s National Agricultural Statistics Service releases an annual look at statelevel and national average farm real estate values. The analysis is based on a nationwide survey of land operators called the June Area Survey, in which more than 9,000 segments of land are statistically sampled, and the results are carefully tabulated to estimate the average value of different types of farmland across each state. The August 2022 Land Values report showed a 12.4% increase in land values from June 2021 to June 2022, with an average value per acre of $3,800. The annual increase was led by advances in Corn Belt states like Kansas (25.2%), Iowa (21.4%), and Nebraska (21%), but also in Western states like Idaho (10.4%), California (10.1%), and Colorado (9.9%).
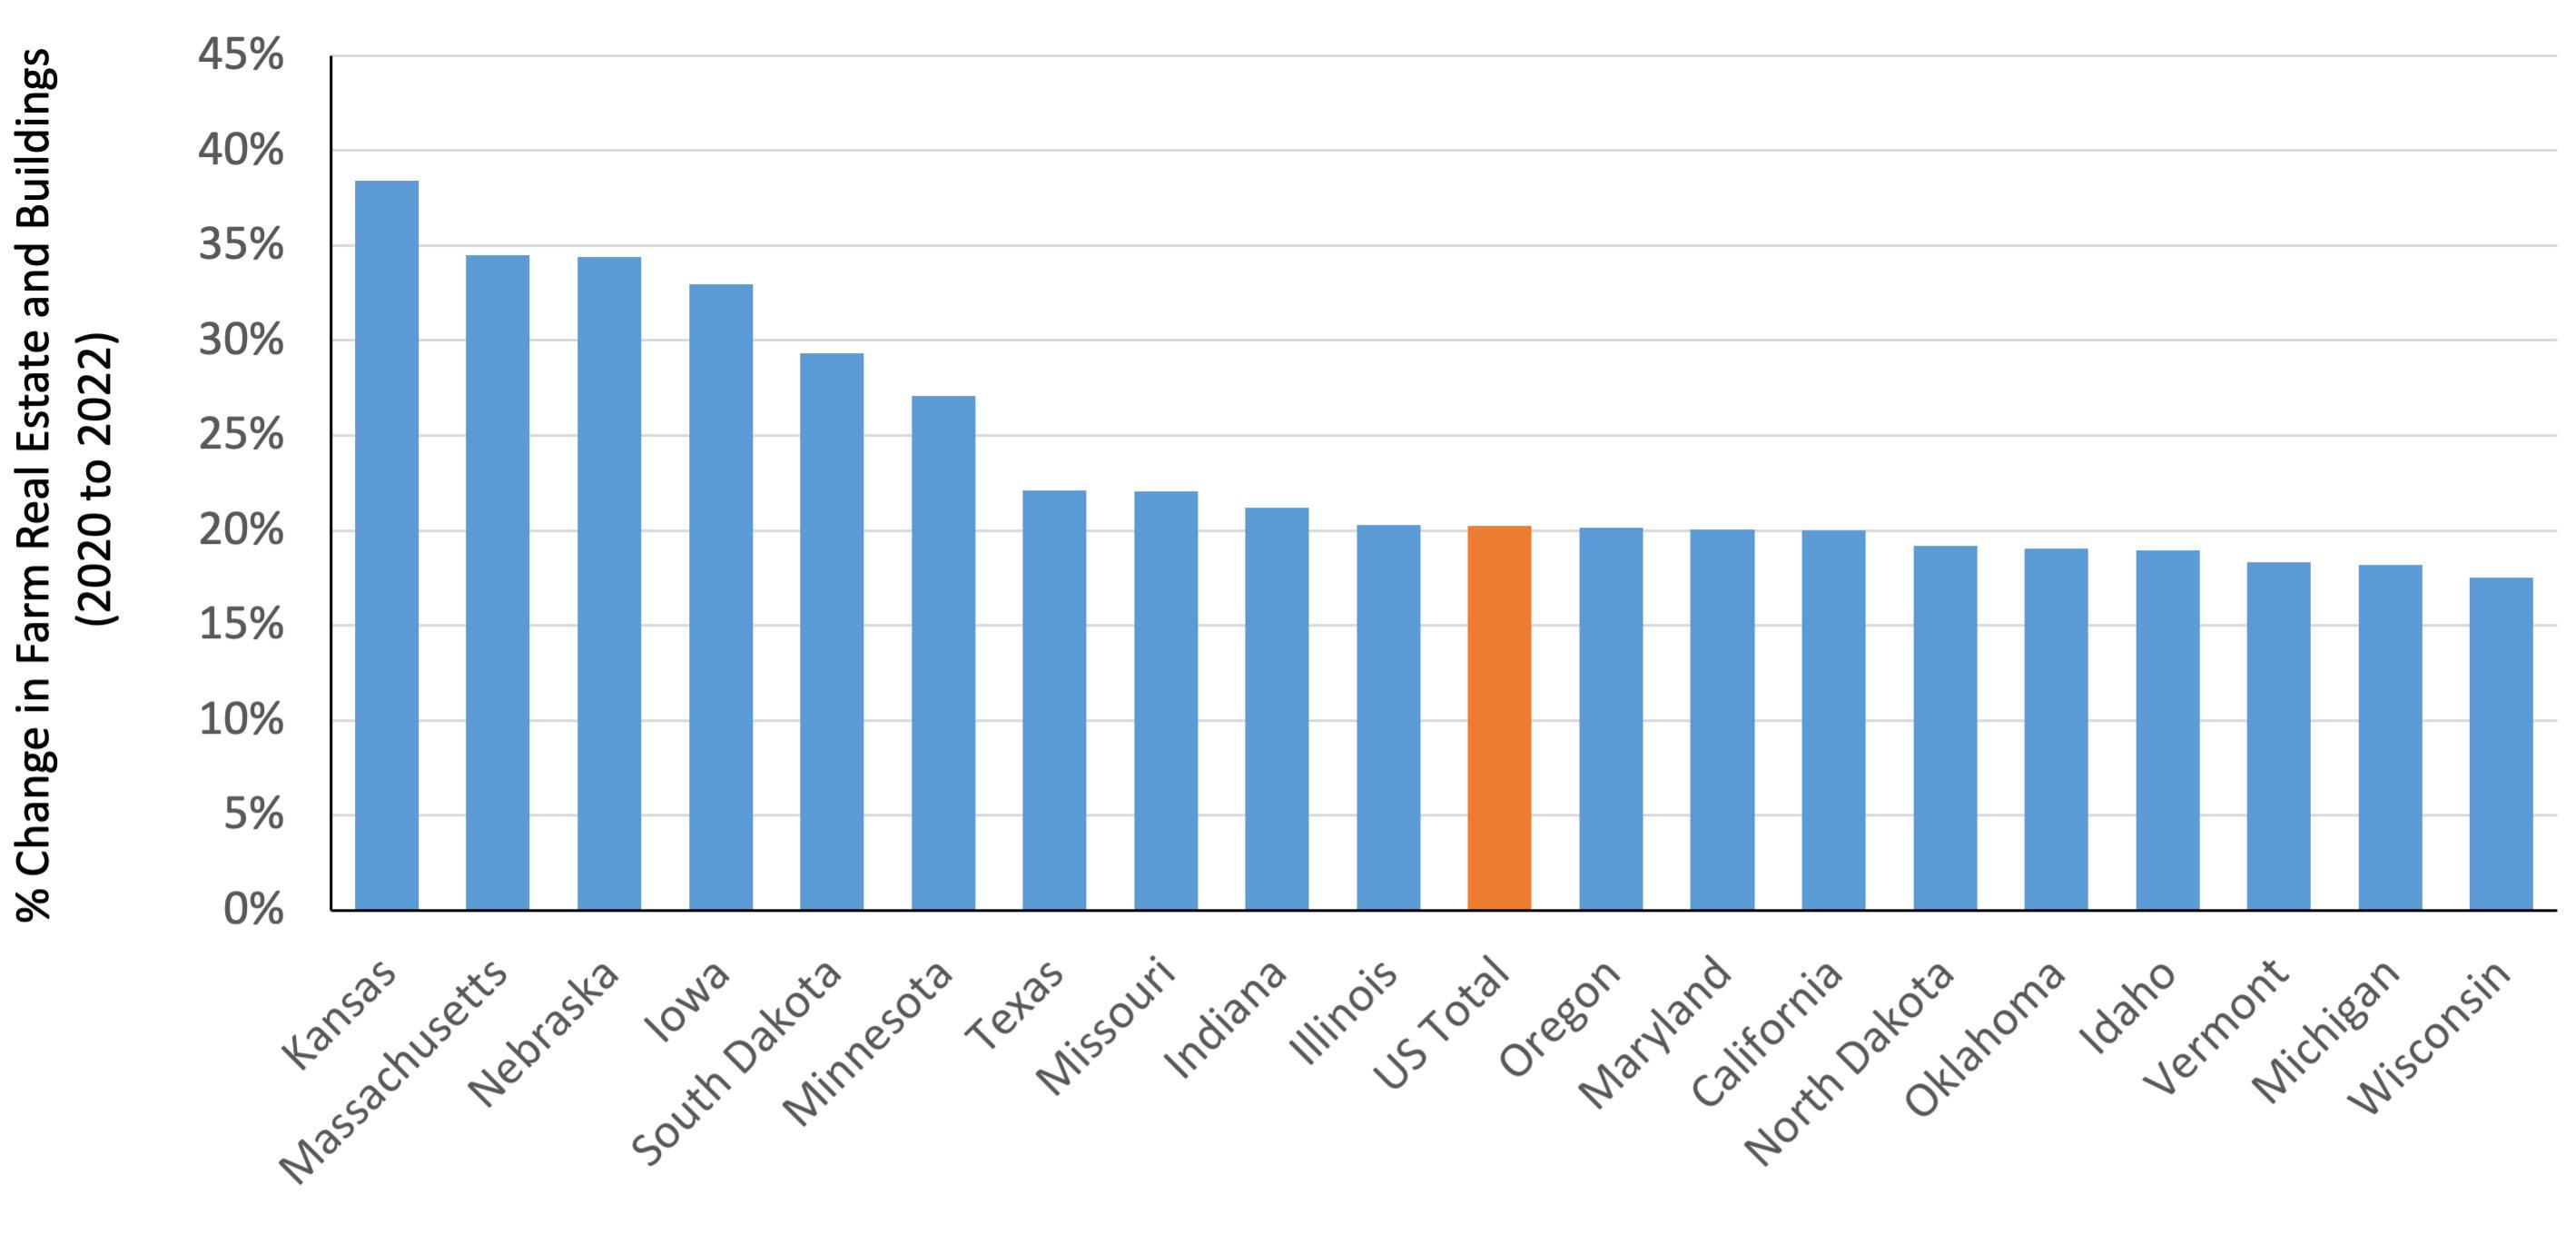
Double-digit gains in many states matched economists’ expectations due to an extended period of low interest rates and higher profits. As discussed in other articles in this issue of The Feed, 2021 and 2022 represented some of the highest nominal and real farm incomes in history. It is understandable, then, that the average value of farm real estate has increased by nearly 40% in Kansas since 2020 (see Figure 8). The U.S. average real estate value is up 20% since 2020, and 13 other states have seen 20% or higher twoyear gains in values. The strengthening value of farm real estate boosted farm balance sheets and improved lending collateral positions during 2022, but it also raised the cost of buying farm ground and the opportunity cost of owning the asset class.
While individual land sales make headlines, and while these two-year growth percentages are a welcome trend for hundreds of thousands of landowners, inflation-adjusted returns to farmland are significantly more modest. If the price of everything increased at a rate of nearly 8% in 2022 (as indicated by most measures of year-over-year inflation), landowners should expect their holdings to increase at least 8%, and they should likely expect a return above inflation to make their investment worthwhile. If land values increase by 12% in 2022, the real return to farmland is then approximately 4%,
or the total return less the percent increase in prices. Between June 2021 and June 2022, housing prices averaged an increase of 18% (or roughly 10%, adjusted for inflation). Figure 9 plots an index of farmland values compared to an index of housing values (both adjusted for inflation, anchoring values at 2012 levels). Since 2012, U.S. house prices have increased more than 60% after adjusting for inflation; farmland values have increased a modest 17% during that same period. While the double-digit gains in farmland values grab lots of attention, real returns to farmland are much less volatile
THE FEED - WINTER 2022-2023
compared to other asset classes like housing, stocks, and bonds.
The distinction between real and total returns is an important one. Simple math shows that the increase in farmland values in 2022 was the ninth largest gain in the last 62 years of available data. However, when adjusted for inflation, 2022 was only the 24th largest gain. It is hard to call recent increases in land values an asset bubble when values have increased more than they have this year 23 different times. Conversely, nominal (i.e., not adjusted
for inflation) gains in housing prices ranked first and second in 2021 and 2022, respectively. Adjusted for inflation, 2021 and 2022 ranked first and fourth, respectively. It may be tempting to correlate the volatility in housing prices with land values, but farm real estate markets have been slower to increase in value and are therefore less likely to exhibit volatility in the higher interest rate environment compared to residential housing.
11, 12
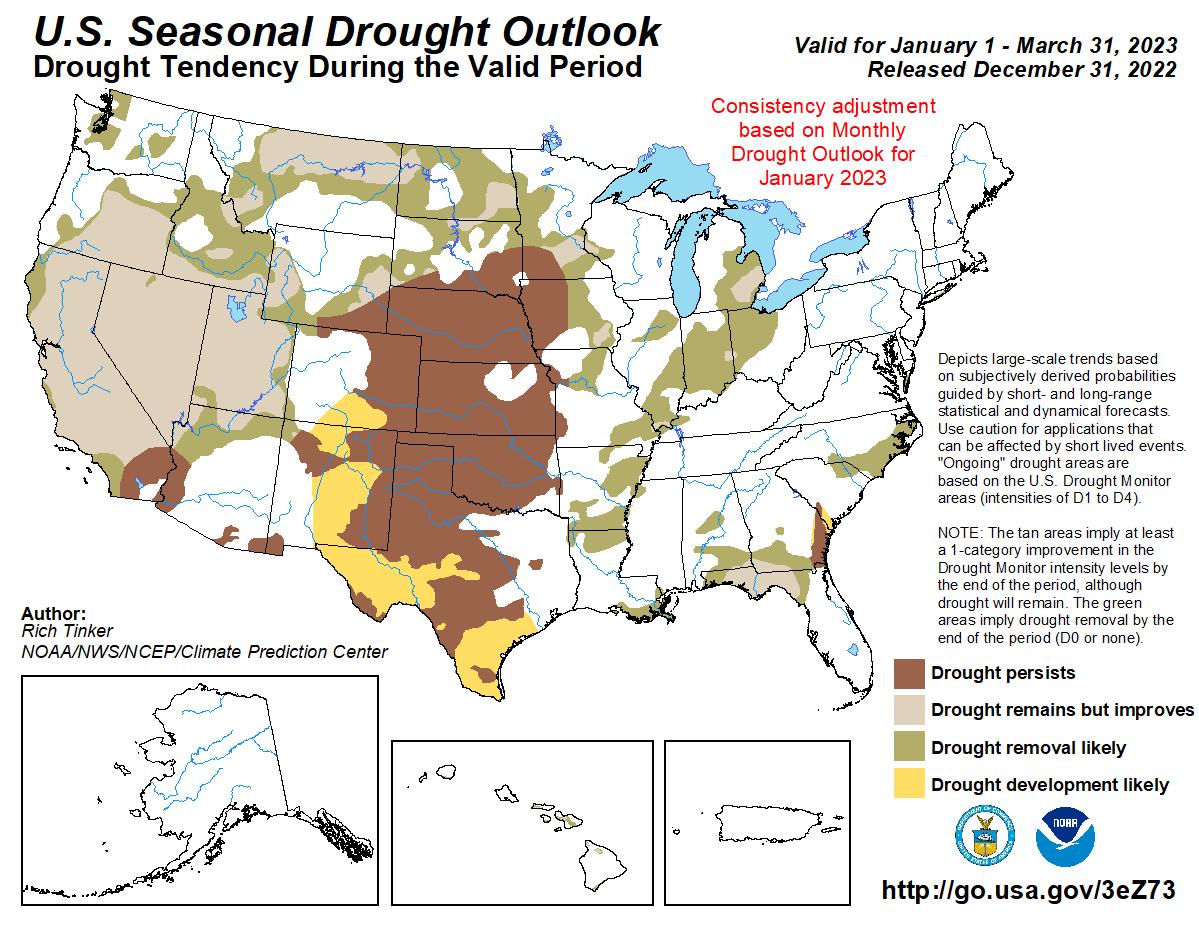
Colder-than-normal conditions are probable in the northern Rockies and upper Midwest over the winter. Drierthan-normal conditions are likely to persist in California. Eastern Corn Belt states should expect some temperature volatility and potential for above-average snowfall.
The overarching story for the winter of 2022/23 will likely be the long-running La Niña conditions in the equatorial Pacific. This will be the third winter in a row featuring below-normal sea surface temperatures in this area. The “triple dip” La Niña is a relatively rare phenomenon as it has occurred only two other times since 1950, with the most recent being during the mid-1970s. La Niña may moderate to more neutral or normal conditions by mid-winter. The exact timing of this transition may have implications for the temperature and precipitation patterns across the United States, as the stronger and earlier it occurs, the more impactful it will be in shifting toward a more El Niño-influenced pattern.
Across the northern tier of states from the Pacific Northwest to the upper Midwest, the general
influence of the La Niña pattern will be for an active storm track, bringing colder-than-normal temperatures and above-average amounts of precipitation. This should generally be helpful in reducing some drought conditions that have persisted throughout the summer and fall of 2022. Unfortunately, the active storm track across the northern tier does not portend favorably for the rainy season in California and other areas of the West south of the Pacific Northwest and northern Rockies. This trend will likely be more significant closer to the Mexican border. Far northern California may see some impact from the northern storm track, which would be beneficial to the reservoir system there; however, overall, it seems that the water year could be challenging. As mentioned above, one wild card for the weather outlook is the speed of transition away from
La Niña. If that were to occur earlier in the winter, it would bring enhanced chances for precipitation to California.
The central Plains through the Ohio Valley and interior Northeast are likely to experience temperature volatility as mild air rushes in from the south ahead of the northern storm track, followed
Figure 10: U.S. Drought Monitor
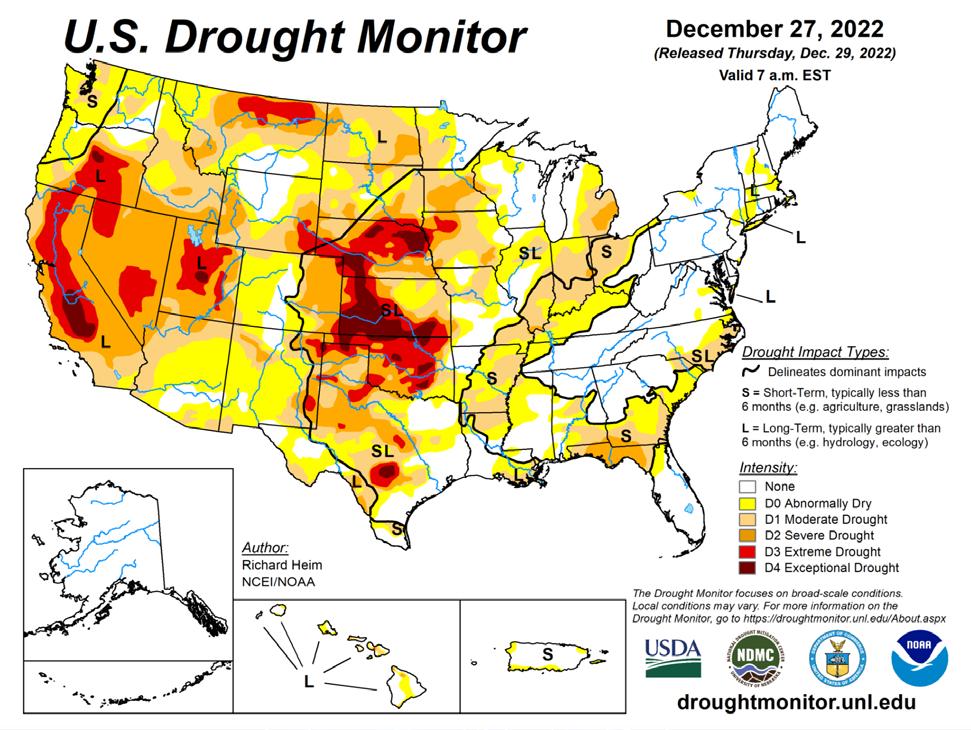
by onrushing cold air in the wake of the storms. These clashes in temperature would energize storms and result in a mixture of precipitation. However, snowfall is likely to be above average in this region. The southern tier from Texas through the Southeast will likely remain drier and warmer than usual, which would exacerbate drought conditions in this area.
Figure 11: U.S. Seasonal Drought Outlook
Corn, soybean, and wheat returns have been excellent in 2021 and 2022, driven by elevated commodity prices. Operating expenses are starting to catch up, but per-acre profits should be near-record in 2022 and should remain strong in 2023. Weather and expenses are likely to be the biggest drivers of uncertainty in 2023; until global supplies recover, however, returns could remain elevated relative to pre-pandemic levels.
From crop years 2014 to 2019, grain and oilseed crop profitability had been in a bit of a grind. Global production of corn, soybeans, and wheat increased rapidly during that period due to a combination of near-perfect weather conditions and expanding production in North America, South America, and parts of Europe and Asia. Global supplies of grains and oilseeds increased as a result, with ending stocks of the major crop commodities peaking between 2016 and 2018. Then demand destruction from cheap oil and the extended outbreak of African Swine Fever in China took a toll on commodity prices, and U.S. producers faced a difficult profitability picture.
Yet the last three years have at long last seen a remarkable turnaround for U.S. grain producers. Things began to change in 2020, as the world economy responded to COVID-19 and, despite supply chain challenges, food consumption increased.
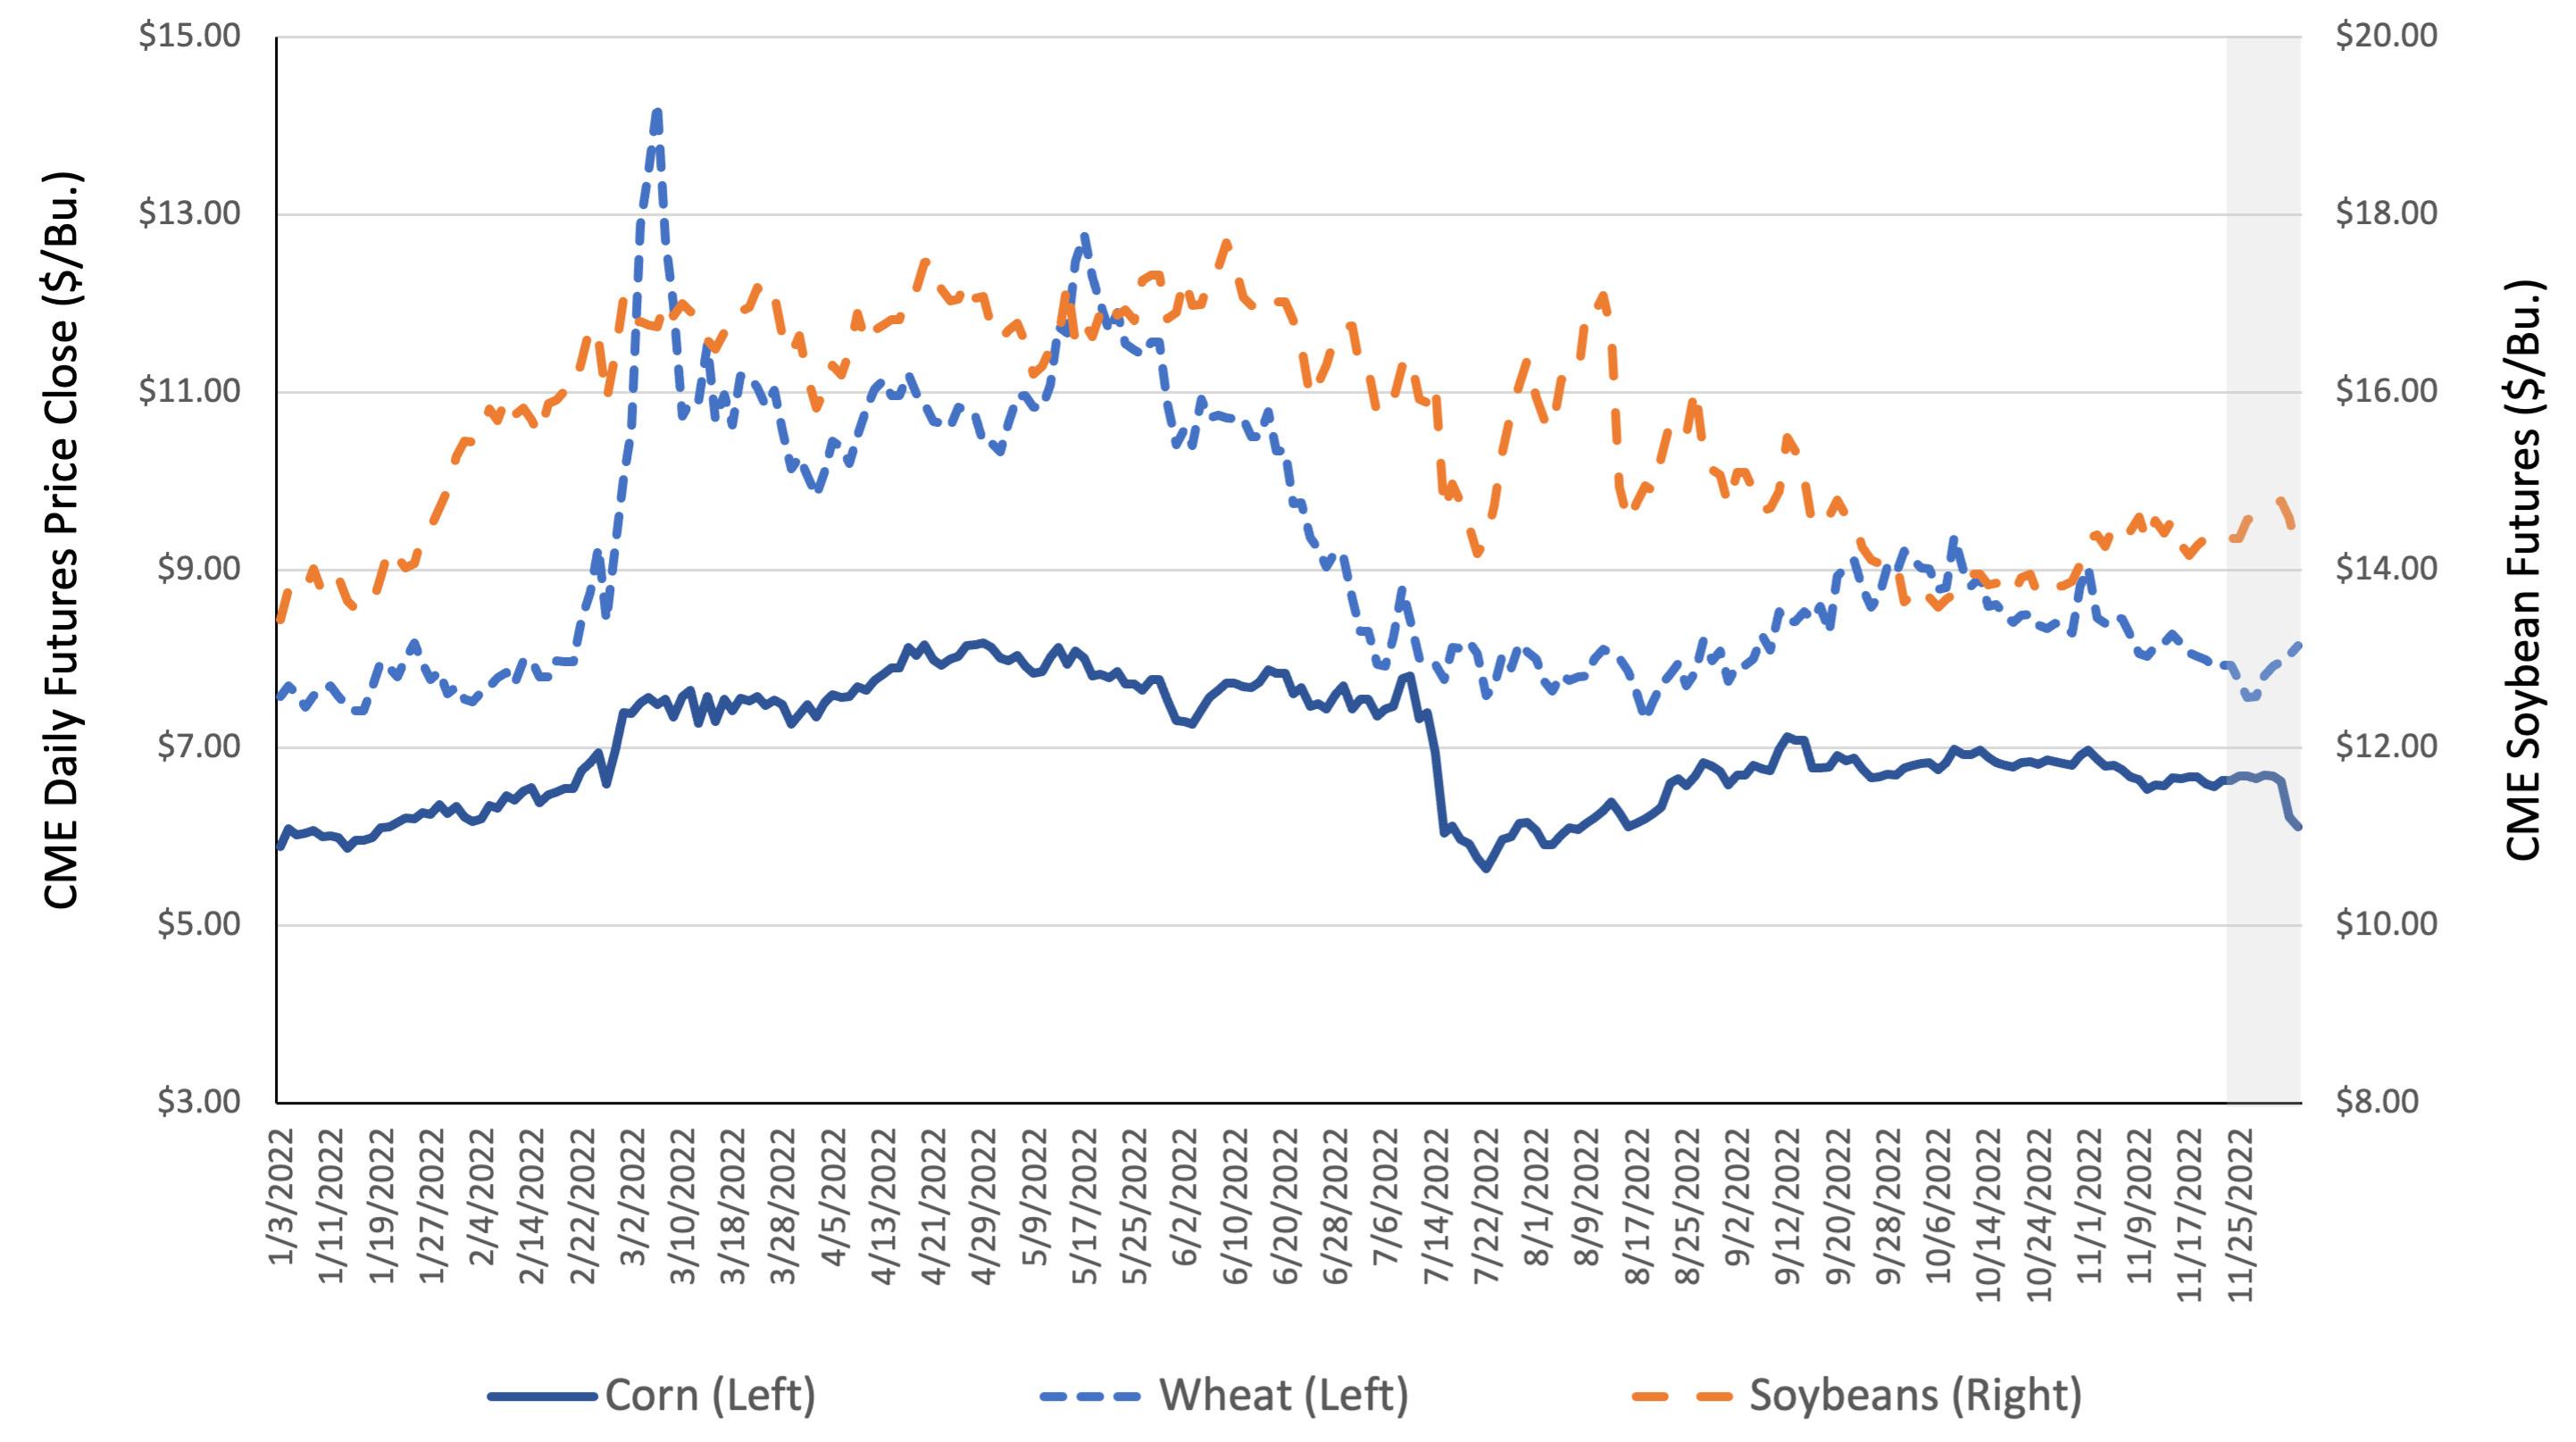
Strong demand for animal proteins increased grain usage for feed, particularly in Asia, where hog populations began to rebuild. The good run continued into 2021 with a strong global economic recovery and steady grain and oilseed production. Corn, soybean, and wheat prices pushed higher throughout 2021 and into 2022. When Russia invaded Ukraine, traders feared a global supply disruption, bidding up wheat and corn prices dramatically. Importers of grains sought to secure supplies, causing a squeeze on stocks between March and June of 2022. Futures prices presented in Figure 12 highlight the extreme commodity price volatility in the market during the first half of 2022. Markets settled in 2022Q3 due to better-than-expected weather conditions and a tentative agreement between Russia and Ukraine to allow grain shipments to resume. Still, commodity prices remained much higher than in recent experience throughout the year.
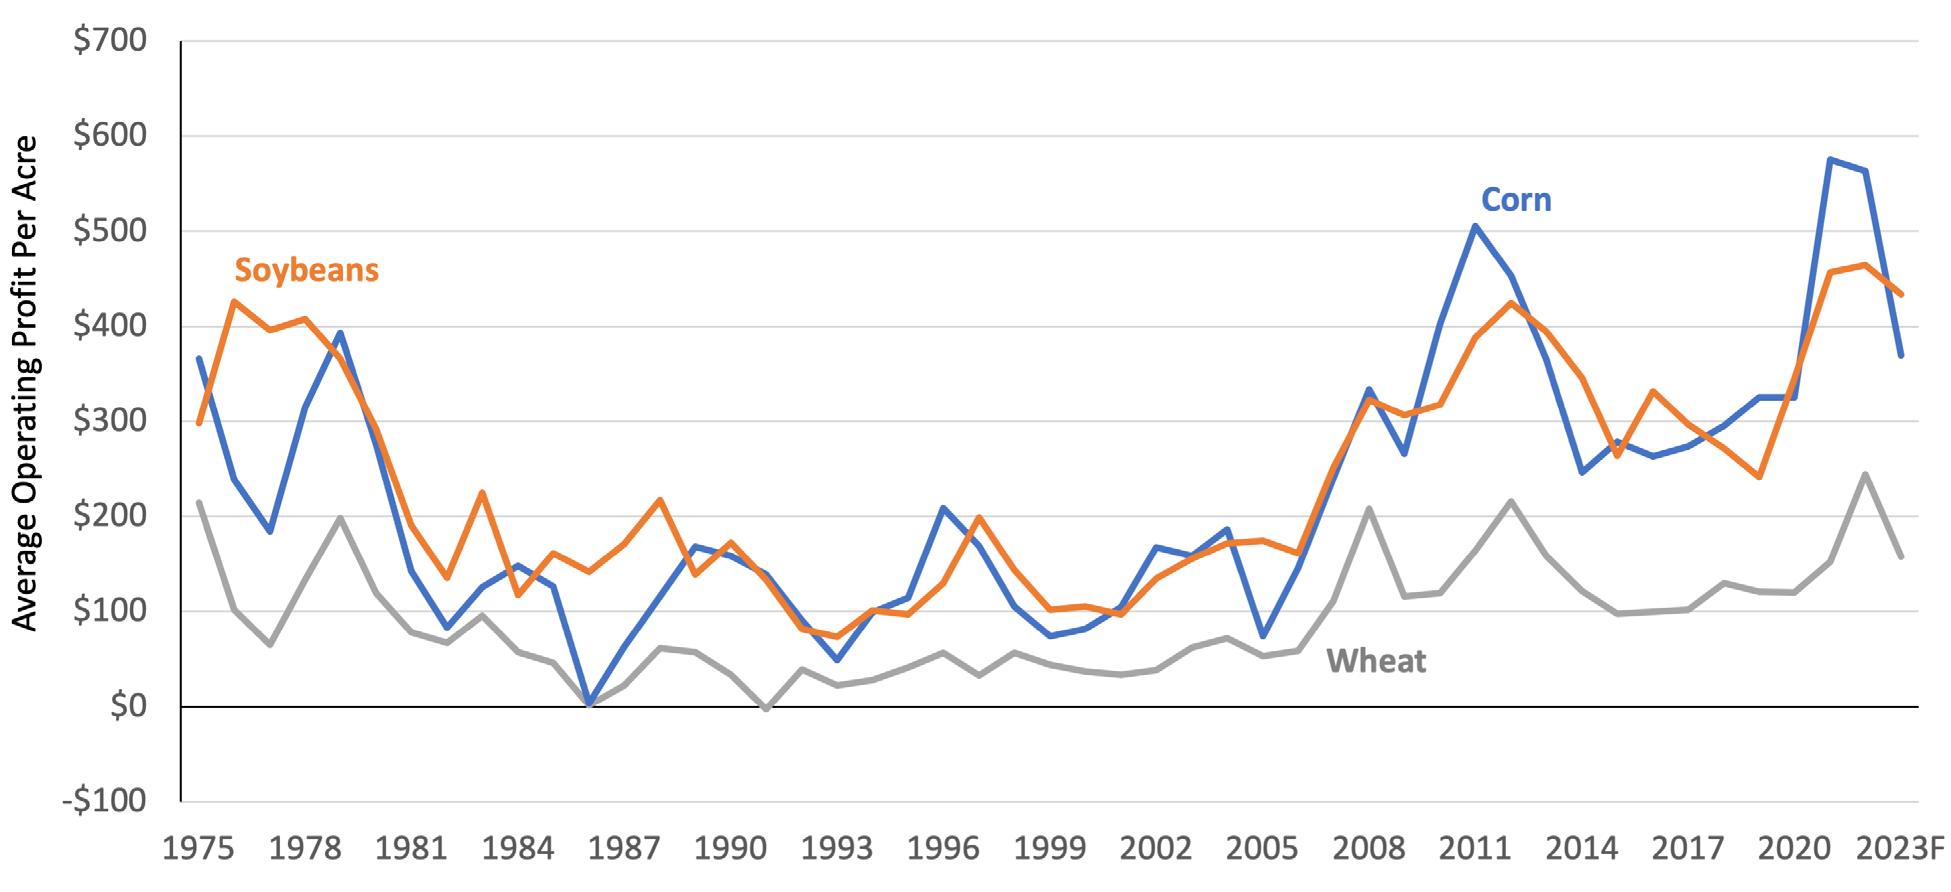
Elevated commodity prices raised farmers’ revenues considerably in 2021 and 2022. While crop yields failed to set records, the higher average price throughout the year allowed farmers to market unsold crops at significantly higher prices. Profits were especially strong in 2021 when the crop was planted with still-low input prices. The run-up in fertilizer prices in late 2021 caused a large increase in the cost of production for most. However, because commodity prices were so high, profit-per-acre remained near historical highs in 2022. Figure 13 shows the average operating profit per acre (total revenues less variable cash expenses) for each major crop commodity adjusted for inflation back to 1975. The three major cycles shine through this time series, with a spike in profitability in the 1970s, the 2010s, and now in the 2020s. Most notable is the extremely high level of operating profits driven by the 2021 crop, a new nominal and inflation-adjusted level going back 50 years. If realized, the 2022 level would be a new high for wheat producers and a near-high for both corn and soybean producers, behind only 2021.
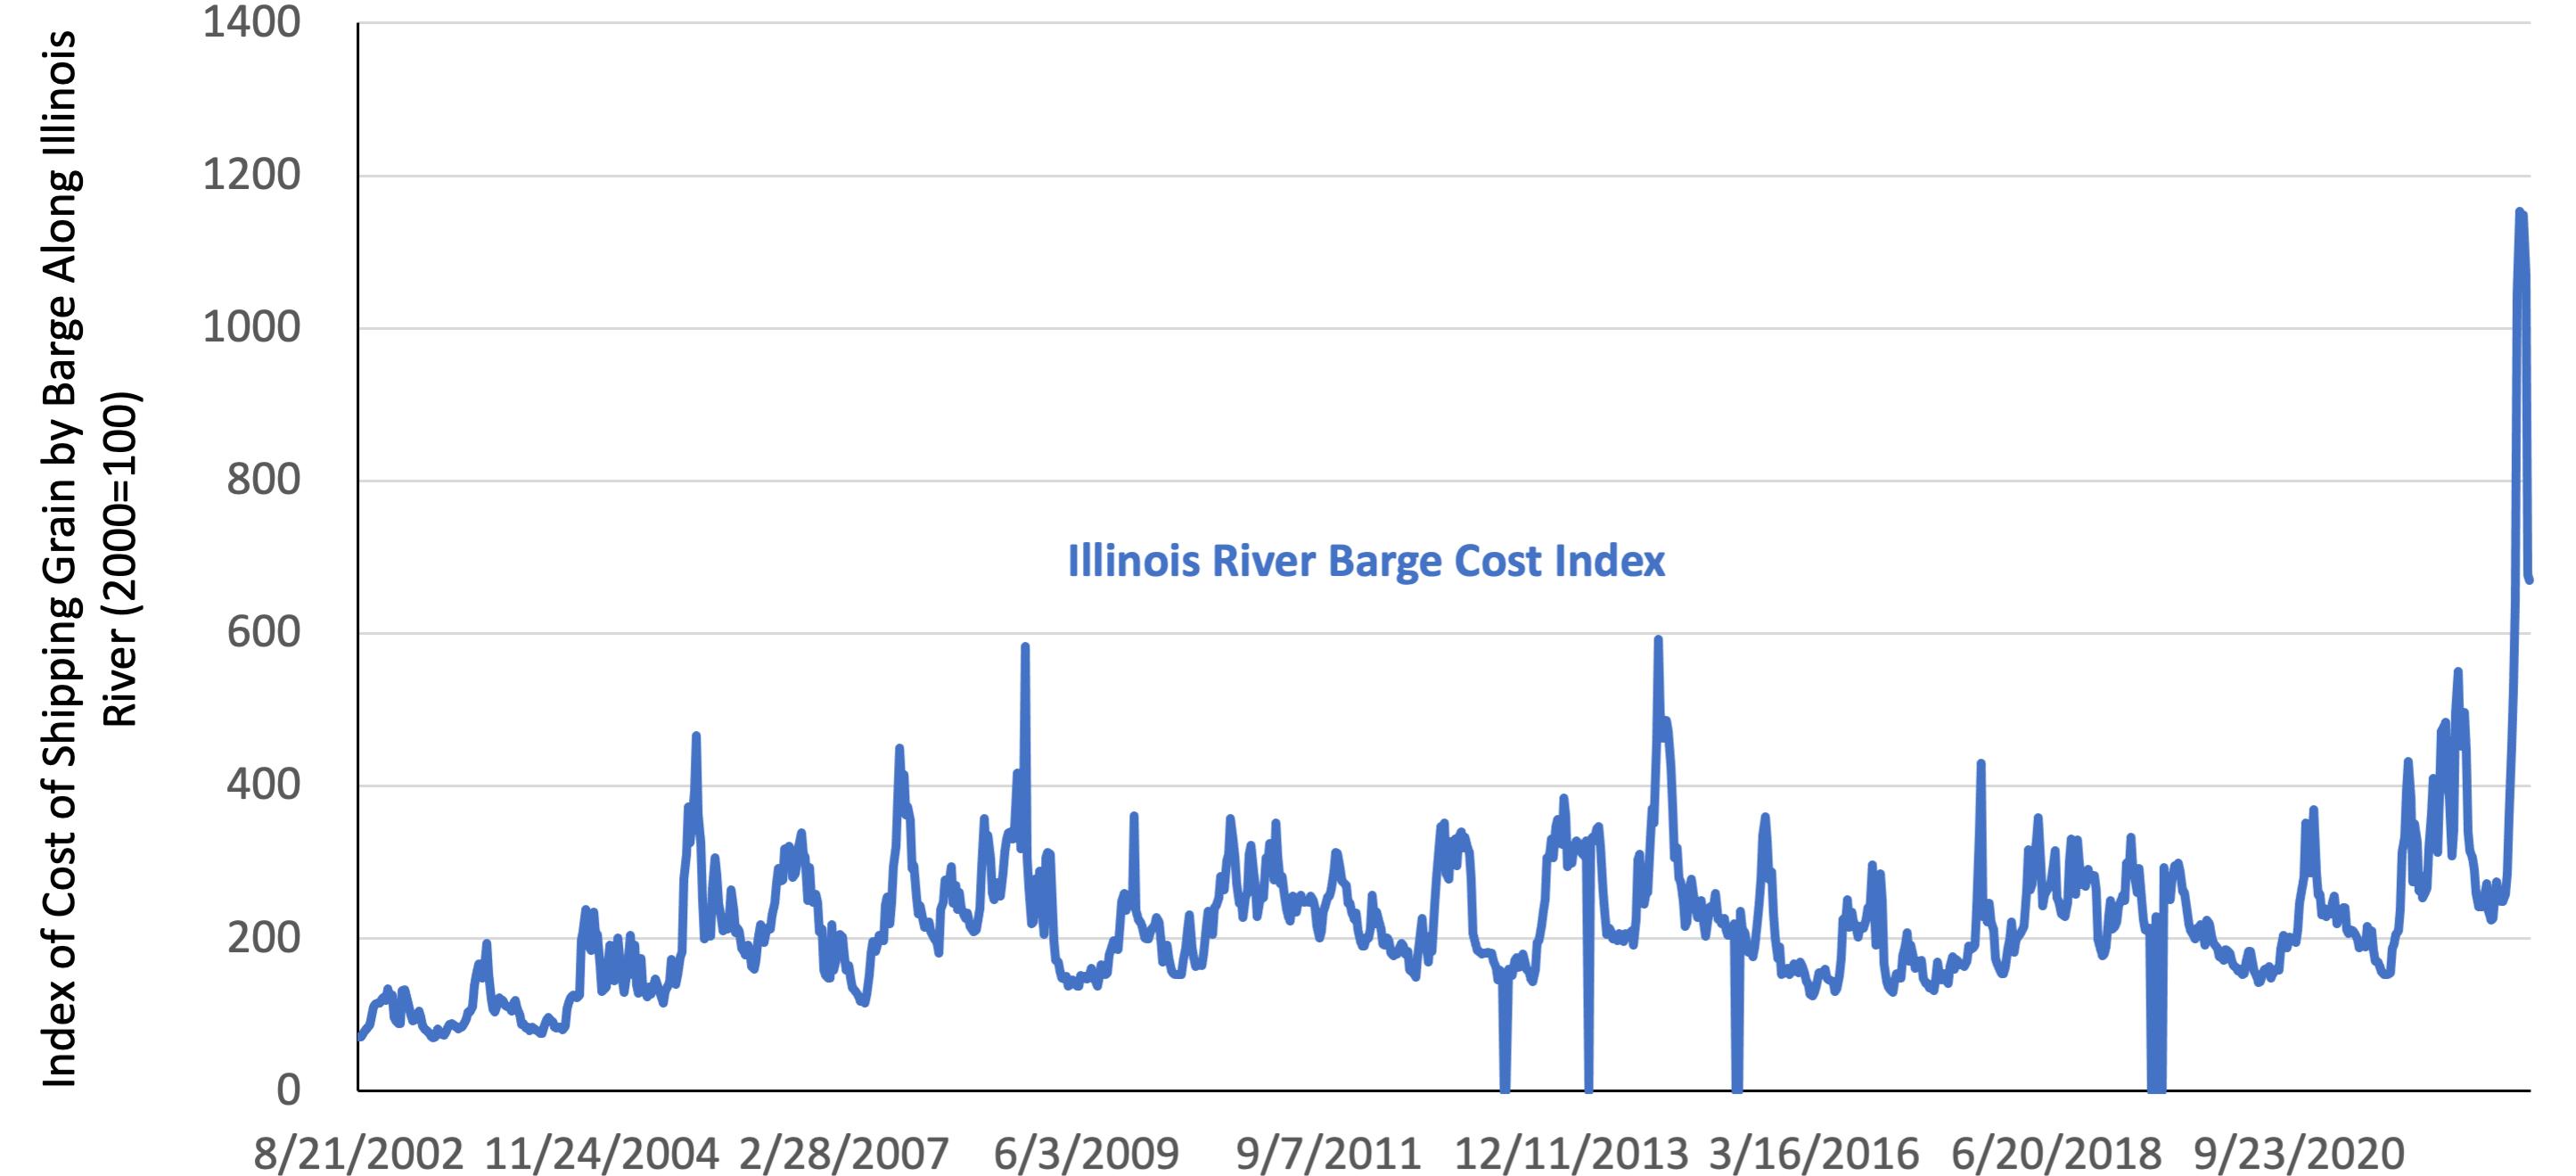
The biggest expected delta heading into 2023 is the cost of production. The USDA forecasts that the cost of growing an acre of corn, soybeans, and wheat will increase 32%, 22%, and 34% between 2021 and 2022, respectively. The cost of fertilizer was the biggest driver of the expected increase, up 65% in 2022. Interest costs are another source of the forecasted increase, although rates have only been elevated for the second half of the growing season. The full impact of higher interest rates is likely to take effect in the 2023 season. Looking ahead, profitability is expected to compress in 2023 on higher production costs and lower commodity prices. However, even compressed profitability levels represent a top-10 historical per-acre operating profit level for corn, soybeans, and wheat growers. Expense areas to watch will be shipping, seed, labor, and interest costs, as those categories have yet to see significant increases compared to 2021 levels. Flash drought conditions along the Mississippi have caused a backup of barge traffic and a runup in the cost of shipping (see Figure 14), but prices started to ease in November 2022 and will likely moderate as precipitation recharges the river in the spring.
Commodity prices should see support into 2023 if dry conditions persist in most major growing regions and if there is no sudden shock to global demand. There is limited potential for upside if there is any additional disruption to global supplies. Weather will be the biggest source of
uncertainty in 2023 as persistent dryness in parts of the Midwest could stress production for many growers. Producer profits could start to experience greater friction in 2024 if supplies rebuild and production costs continue to build momentum.
Figure 13: Inflation-Adjusted Operating Profit Per Acre by Crop
Source: USDA Cost of Production Historicals and Forecasts, Author’s Calculations
Figure 14: Index of Illinois River Barge Shipping Costs
Source: USDA Agricultural Marketing Service, Grain Transport Cost Indicators
THE FEED - WINTER 2022-2023
17, 18, 19, 20
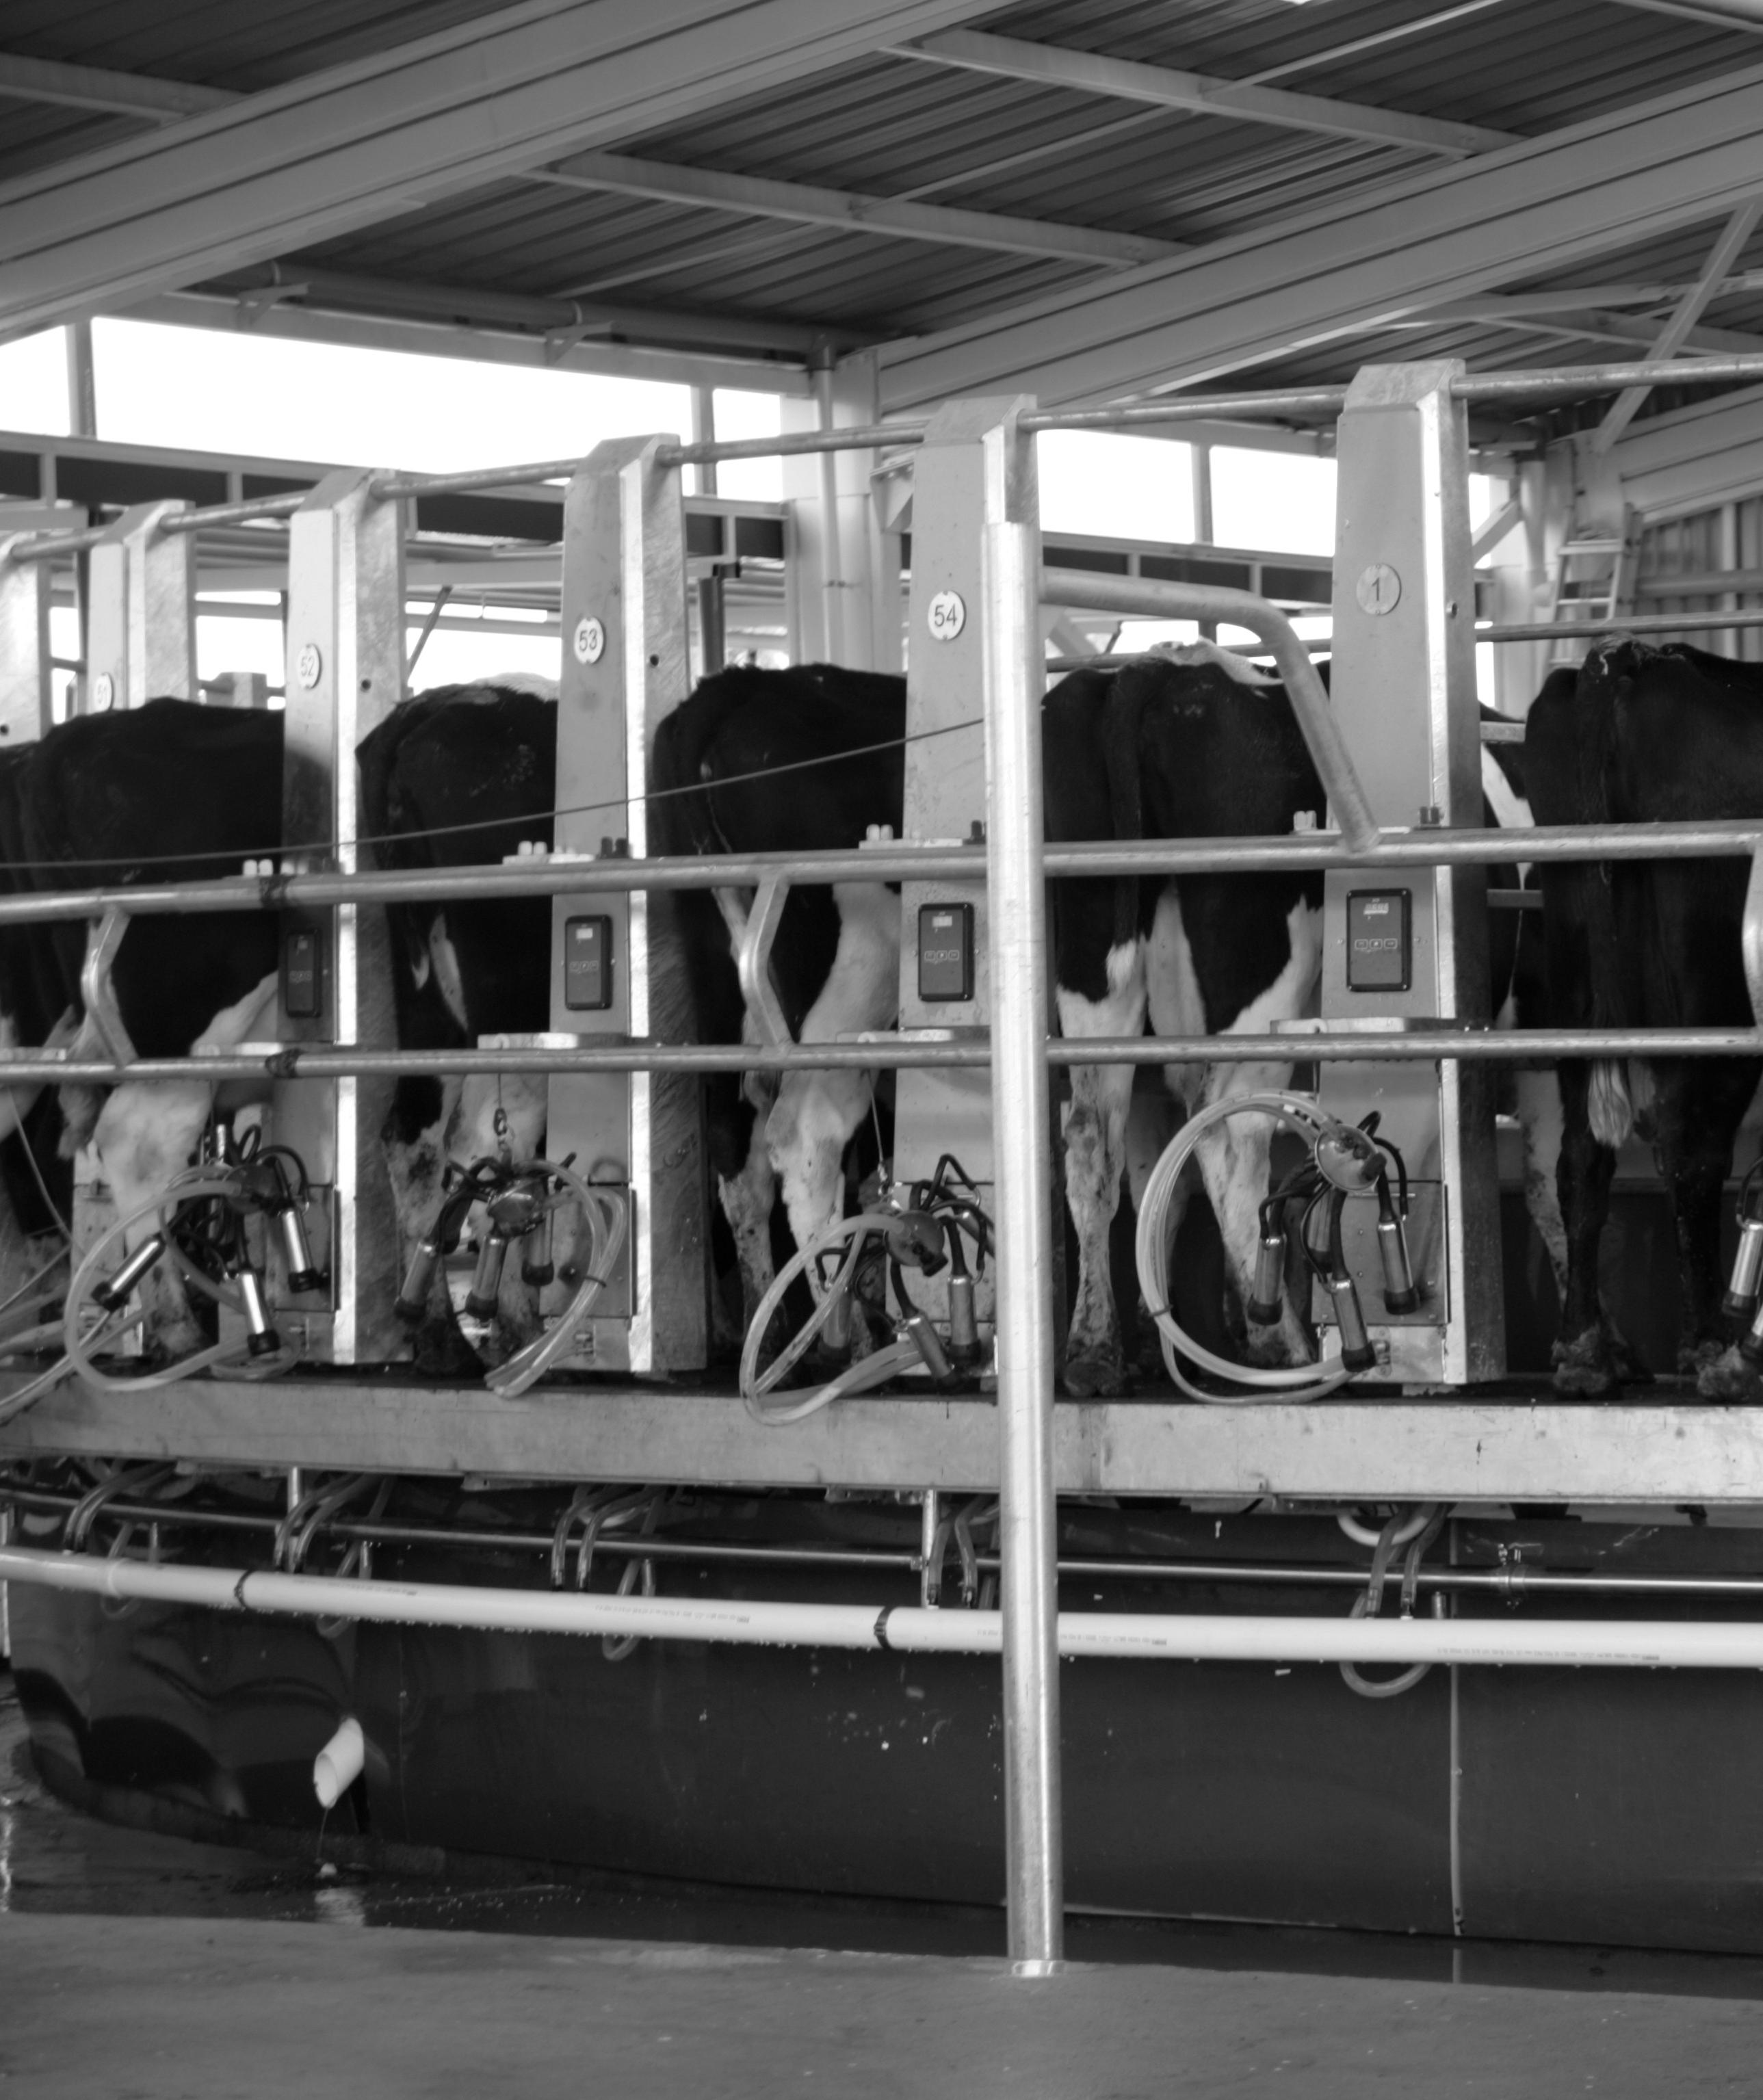
U.S. dairy production climbed in 2022, but global demand for dairy products kept prices ahead of the curve. Prices for cheese, butter, and nonfat dry milk helped buoy the U.S. blended (i.e., all-milk) price received to record levels in mid-2022. However, high feed costs and a challenging economic picture in China could cause some compression in profitability in 2023.
Dairy production and supply have been ample in 2022. While the U.S. experienced a drop in the number of milking cows early in 2022, herd size picked up in the second half and was up approximately 1% in September compared to 2021. The rebound in milking cow herd size combined with improved efficiency per cow has put total year-to-date U.S. milk production at an all-time high through October 2022. Meanwhile, U.S. stocks of American cheese in cold storage
hit an all-time high in July, at 860 million pounds. Butter supply has moderated somewhat since hitting peaks in 2021, but also remains elevated compared to recent history.
High supply has been well balanced with robust dairy product demand in 2022. Domestic use of cheese and butter supported milk processing throughout the year. Exports started the year off strong, particularly for nonfat dry milk products (up 26% from 2021), fresh cheeses (up 22% from
2021), and whey protein (up 62% from 2021). The USDA expects export demand to hold up in the fourth quarter of 2022, capping off what could be the strongest year in history for U.S. dairy exports. Global demand was aided by the economic recovery from COVID-19 lockdowns in 2020 and should help boost export sales in early 2023, despite some headwinds to regional economies around the world.
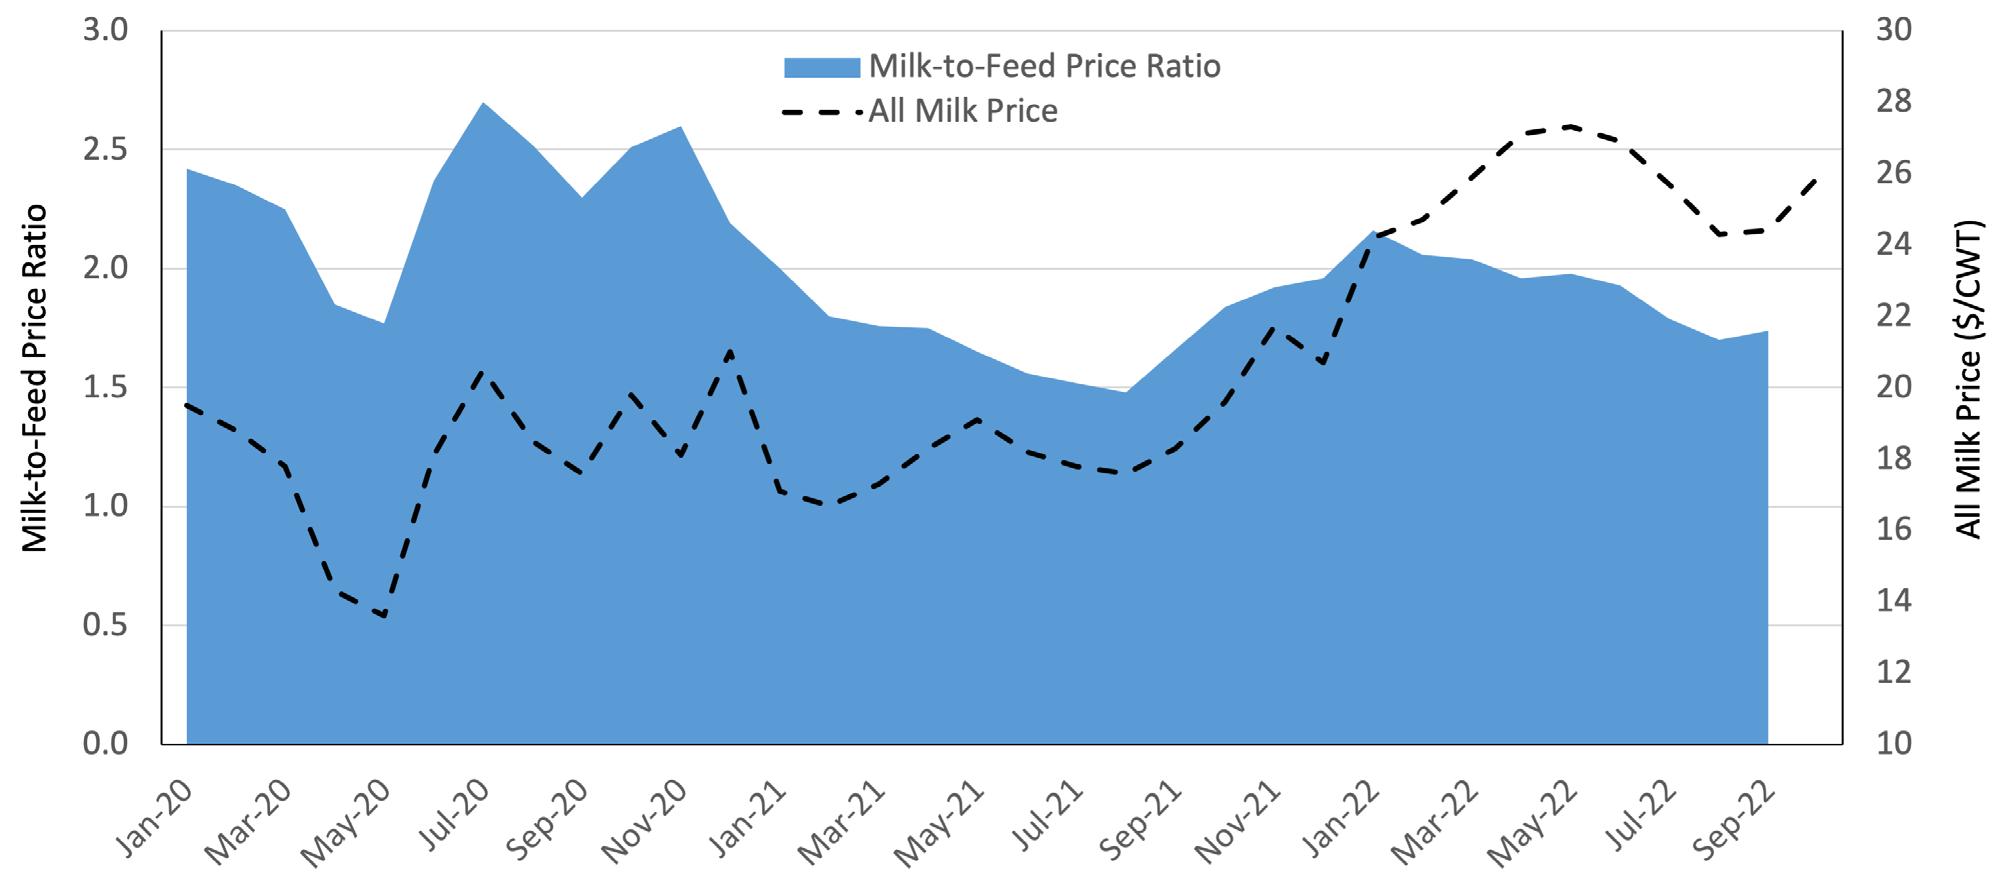
Strong demand outpaced strong supplies in U.S. dairy products, helping boost prices throughout the year. As Figure 15 highlights, the all-milk price, blended across classes, paid to dairy producers in 2022 has averaged approximately 33% higher than in 2021. Component prices for cheese, butter, and nonfat dry milk are the primary reason for the advance in milk prices. However, a pullback in nonfat dry milk prices in the third quarter of 2022 caused a milk price decline, and thus the USDA’s expected all-milk price average in 2023 is $22.60 per hundredweight, a 10% decline from 2022 levels.
The biggest threats facing dairy producers are increasing production costs and declining demand from China. The monthly average price paid for high-quality alfalfa hit an all-time high in October 2022, at $281 per ton. Eight of the top 10 most expensive months of prices paid since 1958 were in 2022, primarily due to a combination of high commodity prices and drought conditions. The milk-to-feed price ratio, a relative measure of the price of milk to the cost of feeding the cows that produce it, is hovering around the 3-year average and could fall to a low point if prices drop in 2023. “COVID Zero” policies in China continue to hurt economic activity in that country, and Chinese imports of nonfat dry milk slowed in the second half of 2022. Without a demand signal from China, there will be greater competition amongst exporting countries for nonfat dry milk products, which could, in turn, put downward pressure on U.S. milk prices. While 2022 was a good year for dairy producers, a few clouds remain on the horizon as the calendar flips to 2023.
21, 22, 23, 24
Cattle inventories declined in 2022 after multiple years of drought conditions and high feed costs. Demand for beef was strong in 2022, helping support cattle prices across the beef supply chain. The constrained supply is likely to help support cattle prices in 2023, giving cattle ranchers better prospects compared to the past few years.
Cattle producers continued to consolidate herds in 2022, driving the beef cow inventory to its lowest levels since 2015. USDA daily cattle slaughter throughput in 2022 was 3.3% higher on average compared to 2021 and was 5.1% higher than its three-year prepandemic average. Drought conditions in 2021 forced many cattle producers to reduce or liquidate herds, and while conditions in mountain states improved in the past year, they worsened in the Plains and upper Midwest throughout 2022. In late November 2022, approximately 68% of cattle inventory was within an area experiencing at least modest drought
conditions (see Figure 16). That compares to just 10% of cattle inventory in drought conditions in November 2019. Luckily for the cattle complex, demand for beef has held up in 2022. The USDA estimates that the per capita disappearance of beef hit a multi-year high in 2022, at 59.2 pounds per person. A combination of the strong economy and a recovery of business and personal travel helped push consumption throughout the year. Retail prices for beef spiked in 2022 as the meat case led all measures of food price inflation. Retail ground chuck prices were up 10% annually in August 2022, setting an all-time record high average
The combination of constrained supply and heated demand pushed prices for beef cattle steadily higher in 2022. Figure 17 shows the average price received by ranchers for cattle over 500 pounds between January 2020 and October 2022. From 2020 lows, cattle prices are up nearly 50%. The largest gains in cattle prices were experienced, when feedlot profitability levels flipped to positive in the early months of 2022, signaling improved demand for cattle through the beef supply chain. The USDA forecasts that these prices will hold in 2023, when the full effects of lower inventory start to restrict slaughter throughput.
The primary threats to cattle producers in 2023 will likely be consumer price fatigue and a slowing global economy. Consumers faced with two consecutive years of near-double-digit increases in beef prices have started to switch to lowerpriced proteins like pork, poultry, and fish in 2022. Beef and veal was the only protein category to experience a consumer price decline in 2022 as a result. Similarly, higher beef prices are likely to challenge global consumers, particularly in a slowing economy. Some of the recent gains in beef exports could be given back if conditions worsen more than expected. Despite
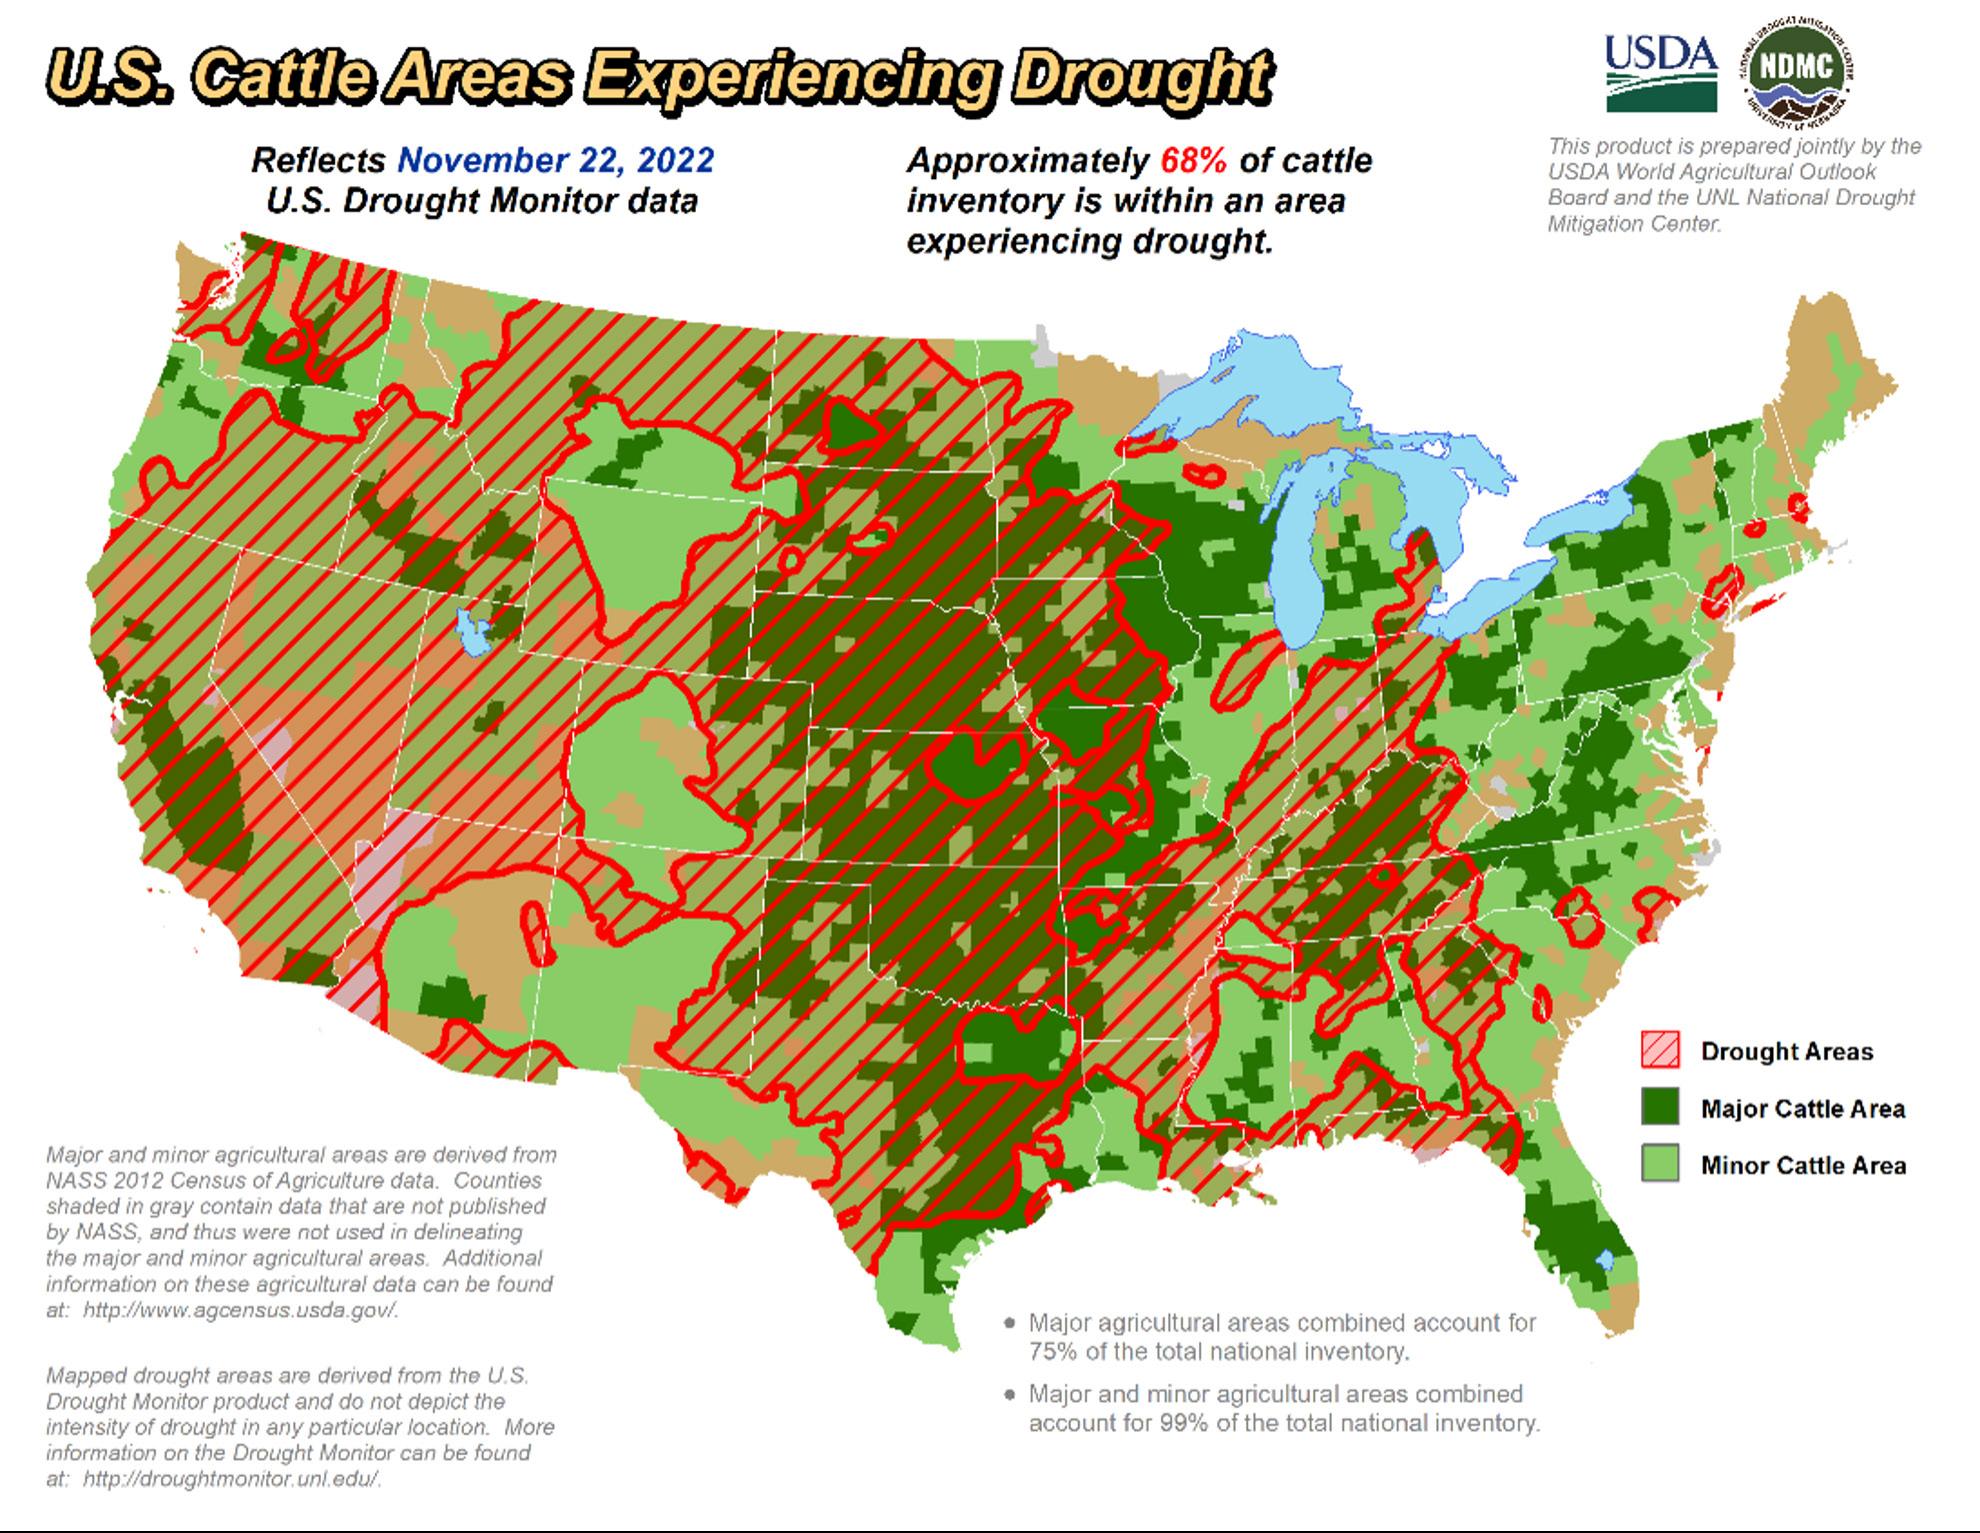
Figure 17: Cattle Prices and Feedlot Profitability, 2020-2022
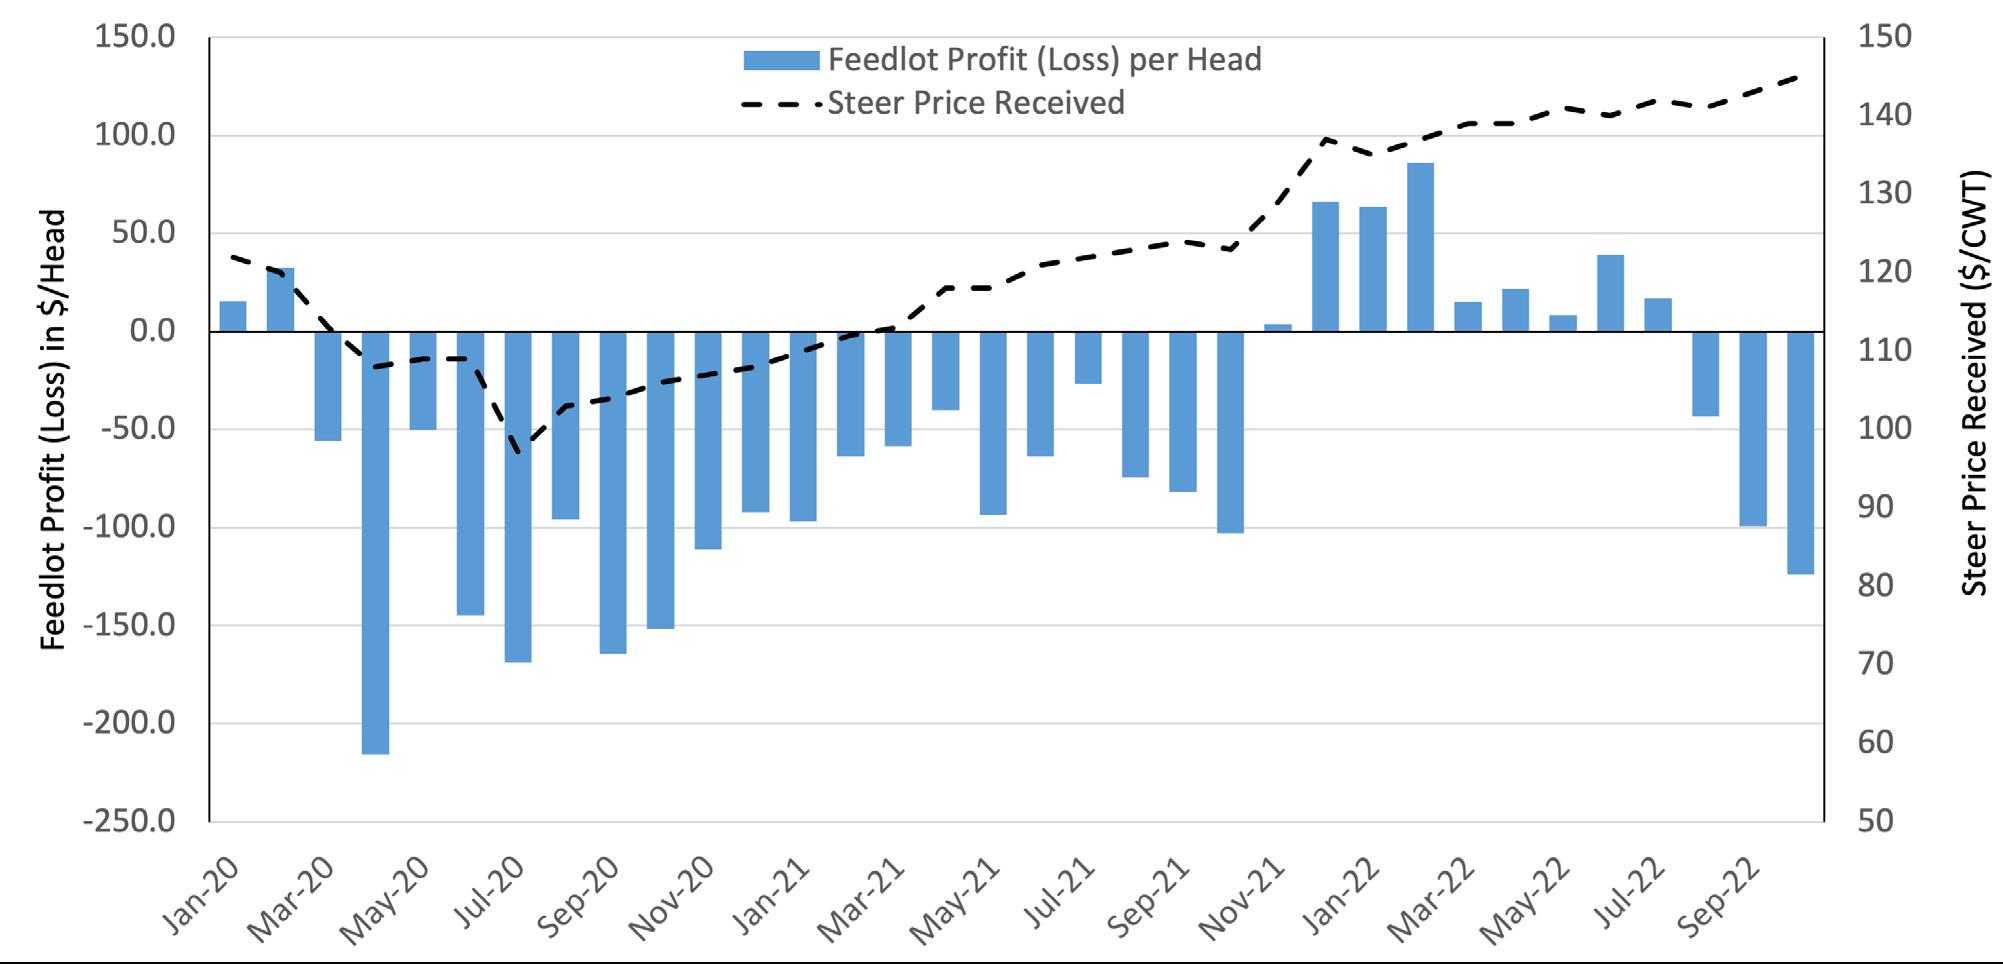
Source: USDA NASS; Iowa State Extension Estimated Cattle Returns
THE FEED - WINTER 2022-2023
25, 26, 27
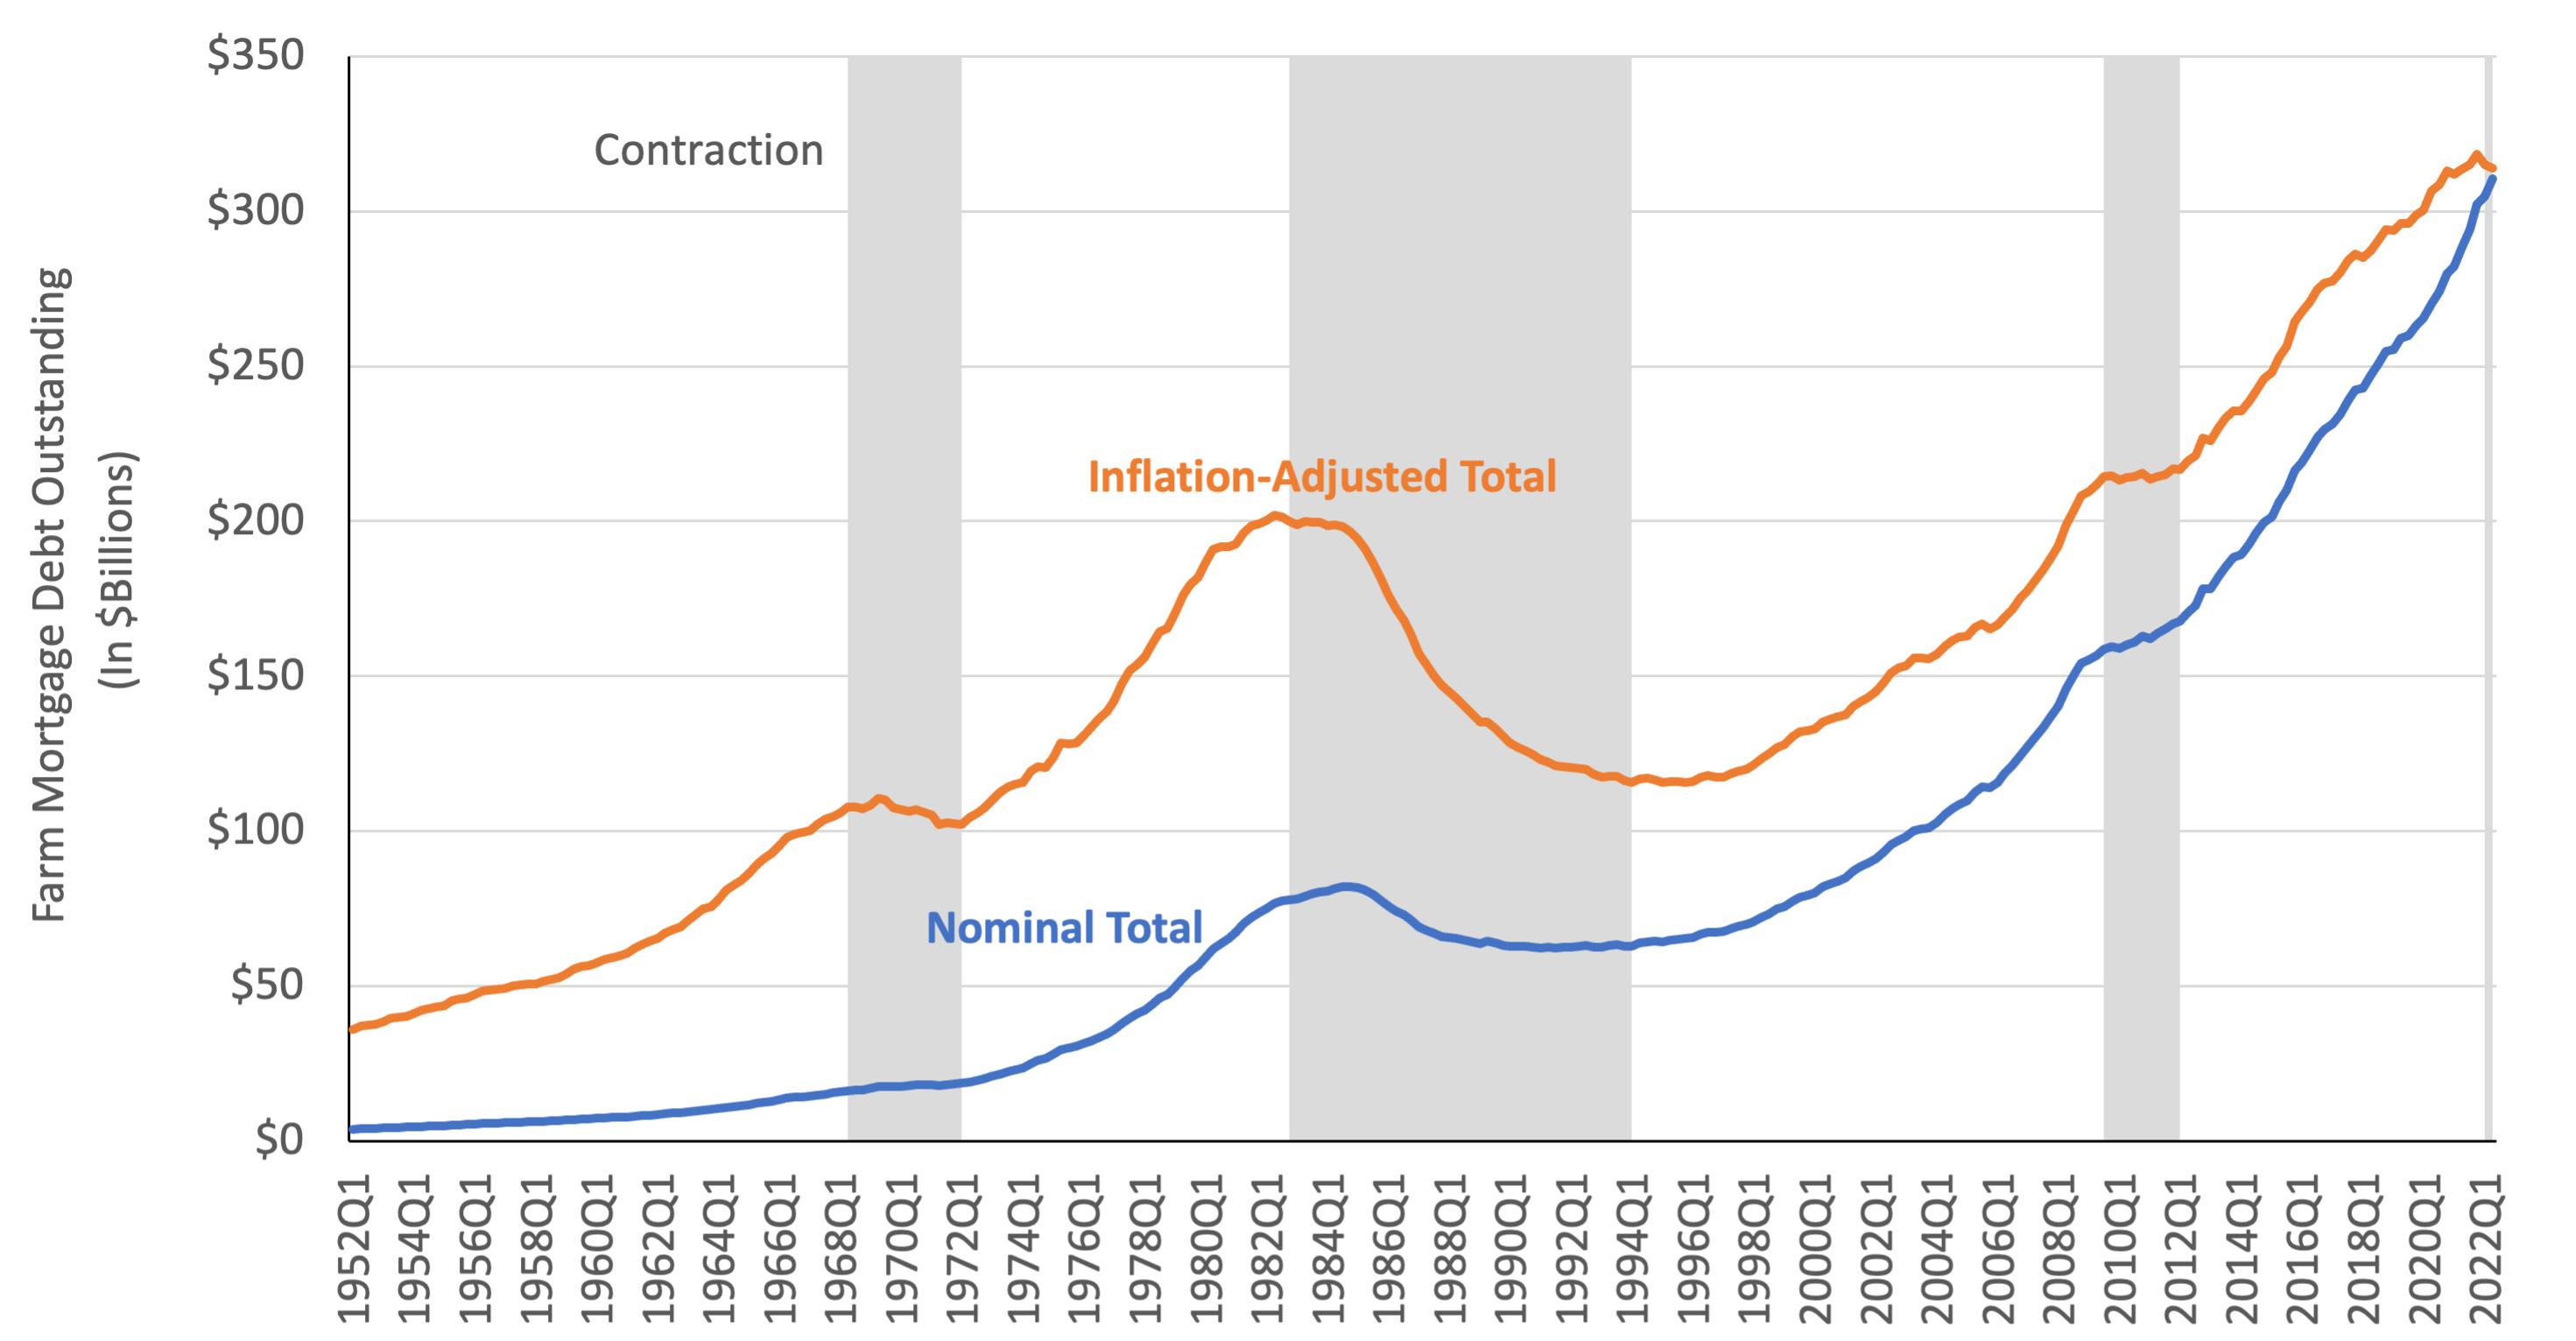
In economics and finance, researchers frequently talk about cycles. Business cycles, credit cycles, housing cycles—the adage, “What goes up must come down,” is apt for many historical patterns economists and researchers identify in asset and economic behavior. One such leverage cycle concept that has started to see more attention in recent years is one in which the amount of debt associated with an asset class ebbs and flows based on market conditions, interest rates, and asset values. While it might be a relatively small asset class in the grand scheme of trillion-dollar capital markets, farmland debt follows an identifiable cycle of expansion and contraction. The drivers of the three prior farmland debt cycle contractions can help put current market conditions into context and guide predictions of where we are likely to go.
Plotting the historical path of farmland debt and inflation-adjusted farmland debt helps to highlight the timing and trajectory of farm mortgage debt. Figure 18 totals up reported loans backed by farmland mortgages at the four largest historical providers of farmland debt: Farm Credit System institutions, commercial banks, insurance companies, and government programs. There have been three periods since 1960 when lenders pulled back and the inflationadjusted level of farmland mortgage debt fell. The most notable contraction was in the 1980s, when many borrowers and lenders struggled to manage rapidly rising interest rates during declining farm incomes. Two other contractions occurred in the history of the series; in the 1960s, when banks pulled back on lending after a contraction in the farm economy, and in the 2010s, when the global financial crisis contracted lending activity and international trade ground
Farm mortgage debt has experienced three contractionary periods in modern farm finance history. Farmland debt contractions generally coincide with falling farm incomes and rising real interest rates. The path of interest rates, inflation, and farm incomes will determine if overall farmland debt holds steady, continues to rise, or begins to fall.
to a halt. In all three periods, the decline in farmland debt corresponded to a decrease in farmland assets.
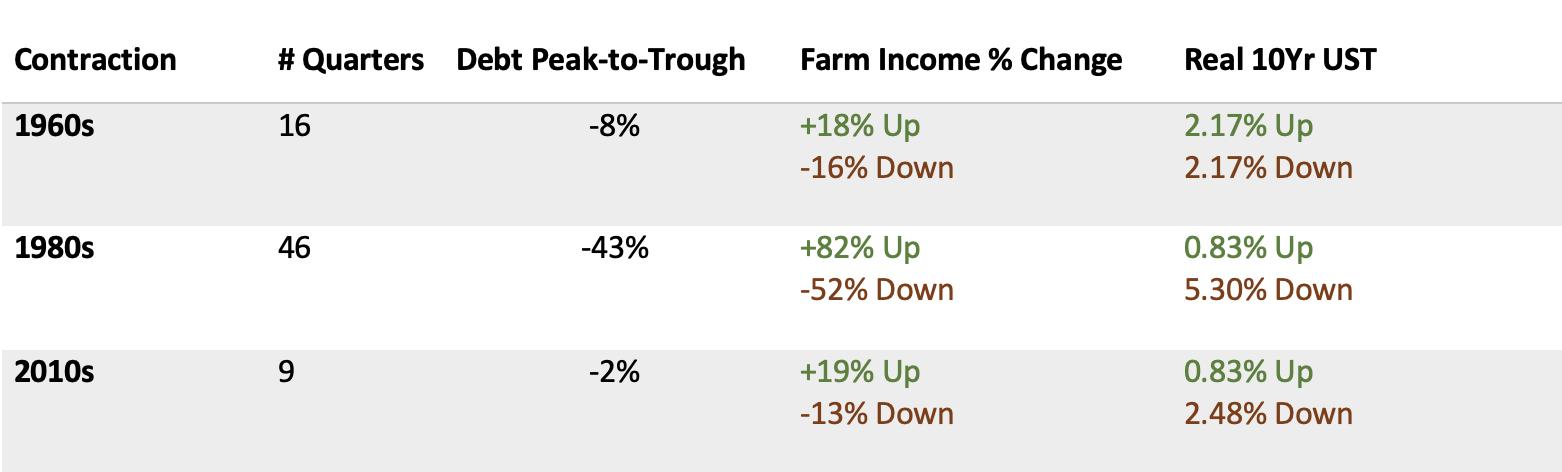
There is a common thread for each cyclical contraction in farmland debt: in the three years leading up to each cycle contraction, farm incomes ran up 18%, 82%, and 19%, respectively. In the years following the peak of each debt contraction, farm incomes fell 16%, 52%, and 13%, respectively. Real interest rates (defined as the rate on the 10-year U.S. Treasury bond minus consumer price inflation) were another contributing factor to the depth of the contraction.
Still, the relationship between interest rates and farm debt cycles has been weaker than the relationship between farm income and farm debt. In the 1960s, real interest rates were unchanged, yet farmland debt contracted 8%. In the 1980s and 2010s, a more recognizable pattern existed, in which a period of rapid increases in real rates followed a period of extremely low real rates. Figure 19 highlights the duration and related drivers of the three farmland debt contractions in modern farm financial history.
So, what does history indicate about farm debt levels in 2023? As detailed in other articles in this issue of The Feed, farm incomes have certainly seen a multi-year increase, which is a consistent signal for slowing farmland debt. Similarly, real interest rates were negative for much of 2021 and 2022, another consistent signal from two of the three historical contractions. Real interest rates are rising heading into 2023, which was a leading indicator of contraction in two of the three contractions. The biggest unknown is the trajectory of inflation and farm income in 2023 and 2024. Inflationary pressures did appear to ease in the third and fourth quarters of 2022, but some categories like services, transportation, and housing might remain elevated for some time. If inflation remains elevated, real interest rates are likely to moderate; but if inflation falls significantly, real interest rates could rise swiftly. Early indicators of components of farm income are generally positive, with revenues capable of holding steady and profits likely to erode slightly due to rising expenses. If farm incomes hold or increase, farmland debt is likely to hold or even advance; if farm incomes fall significantly, farmland debt could enter a fourth contractionary cycle.
THE FEED - WINTER 2022-2023

Jackson Takach, Chief Economist, is a Kentucky native whose strong ties to agriculture began while growing up in the small farming town of Scottsville. He has since dedicated a career to agricultural finance where he can combine his passion for rural America with his natural curiosity of the world and his strong (and perhaps unrealistic) desire to explain how we interact within it. He joined the Farmer Mac team in 2005, and has worked in the research, credit, and underwriting departments. Today, his focus at Farmer Mac currently includes quantitative analysis of credit, interest rate, and other marketbased risks, as well as monitoring conditions of the agricultural economy, operational information systems analysis, and statistical programming. He holds a Bachelor’s degree in economics from Centre College, a Master’s degree in agricultural economics from Purdue University, and a Master’s of Business Administration from Indiana University’s Kelley School of Business.
As Executive Vice President –Chief Business Officer, Zack leads the vision, development, and go-to-market strategy of the Farmer Mac brand. He also oversees the company’s Agribusiness activities, including the business development and marketing efforts for its foundational lines of business that provide agricultural lenders across the country with financial solutions and effective risk mitigation tools that allow farmers, ranchers, and agribusinesses access to flexible and affordable credit. In this role, he oversees the company’s expansive loan portfolio, partner and business development strategies, product innovation and standardization, and marketing and corporate communications.


Brian Brinch joined Farmer Mac in 2000 as a Financial Research Associate. Since then, he has held various roles within the company and currently serves as Senior Vice President – Rural Infrastructure, where he is the business unit head of the company’s rural infrastructure division. Brian continues to follow agricultural and rural utility industry trends and risks as he regularly contributes to the company’s stress testing and strategic planning processes. Brian received both his undergraduate degree in meteorology and his master’s in Agriculture and Applied Economics from Penn State University. He is a CFA Charterholder and FRM Certified.

The Feed is a quarterly economic outlook for current events and market conditions within agriculture.
The report is broad-based, covers multiple regions and commodities and incorporates data and analysis from numerous sources to present a mosaic of the leading industry information, with a focus on the latest information from the United States Department of Agriculture and their Economic Research Service.
There are several regularly included sections like weather and major industry segments, but the authors rotate through other industries and topics as they become relevant in the seasonal agricultural cycle. Where the report adds value to readers is through its unique synthesis of these multiple sources into a single succinct report.
We hope you’ve enjoyed this issue.
For media inquiries: Megan Pelaez Director – Marketing & Communications mpelaez@farmermac.com
For business inquiries: Patrick Kerrigan Vice President – Business Development pkerrigan@farmermac.com
The information and opinions or conclusions contained herein have been compiled or arrived at from the following sources and references:
1. USDA Economic Research Service, Farm Income and Wealth Statistics (https://www.ers.usda.gov/ data-products/farm-income-and-wealth-statistics/ )
2. USDA Economic Research Service, Farm Sector Financial Ratios (https://data.ers.usda.gov/reports. aspx?ID=17838)
3. USDA Economic Research Service, Net Cash Income (https://data.ers.usda.gov/reports.aspx?ID=17831
4. Board of Governors of the Federal Reserve System, Financial Accounts of the United States (https:// www.federalreserve.gov/releases/z1/ )
5. Federal Reserve Bank of St. Louis, FRED Database (https://fred.stlouisfed.org/ )
6. U.S. Bureau of Economic Analysis, Personal Consumption Expenditures Price Index (https://www. bea.gov/data/personal-consumption-expendituresprice-index)
7. Board of Governors of the Federal Reserve System (https://www.federalreserve.gov/monetarypolicy.htm)
8. USDA NASS, Land Values Summary Report (https://www.nass.usda.gov/Publications/ Todays_Reports/reports/land0822.pdf) (https:// downloads.usda.library.cornell.edu/usda-esmis/files/ h989r321c/7h14bn48r/4q77gp501/mkpr0821.pdf)
9. U.S. Bureau of Labor Statistics, Consumer Price Index (https://www.bls.gov/cpi/ )
10. Yale University, Robert Shiller Online House Price Data (http://www.econ.yale.edu//~shiller/data.htm)
11. National Drought Mitigation Center University of Nebraska-Lincoln, U.S. Drought Monitor (https:// droughtmonitor.unl.edu/CurrentMap.aspx)
12.
13.
National Weather Service, Climate Prediction Center, U.S. Seasonal Drought Outlook (https://www. cpc.ncep.noaa.gov/products/expert_assessment/ sdo_summary.php)
CME Group Agricultural Futures Prices (https:// www.cmegroup.com/market-data/delayed-quotes/ agricultural.html#)
14. USDA ERS Outlook Reports: Feed Grain, Oil Crops, and Wheat (https://www.ers.usda.gov/topics/farmeconomy/commodity-outlook/ers-outlook-reportsand-data/ )
15. USDA ERS Commodity Costs and Returns (https:// www.ers.usda.gov/data-products/commodity-costsand-returns/ )
16. USDA Agricultural Marketing Service, Grain Transport Cost Indicators (https://www.ams.usda. gov/services/transportation-analysis/gtr-datasets )
17. USDA NASS, Milk Production (https://downloads. usda.library.cornell.edu/usda-esmis/files/ h989r321c/7h14bn48r/4q77gp501/mkpr0821.pdf)
18. USDA, Foreign Agricultural Service, GATS Database (https://apps.fas.usda.gov/gats/default.aspx)
19. USDA NASS, QuickStats (https://quickstats.nass. usda.gov/ )
20. USDA Economic Research Service, Feed Grains Database (https://www.ers.usda.gov/data-products/ feed-grains-database/ )
21. USDA NASS, Cattle Inventory (https://usda. library.cornell.edu/concern/publications/ h702q636h?locale=en https://downloads. usda.library.cornell.edu/usda-esmis/files/ h989r321c/7h14bn48r/4q77gp501/mkpr0821.pdf)
22. USDA, Foreign Agricultural Service, GATS Database (https://apps.fas.usda.gov/gats/default.aspx)
23. Iowa State University, Extension and Outreach, Estimated Livestock Returns (https://www2.econ. iastate.edu/estimated-returns/ )
24. USDA Economic Research Service, Livestock, Dairy, and Poultry Outlook (https://www.ers.usda.gov/ publications/pub-details/?pubid=105248)
25. USDA ERS Farm Income and Wealth Statistics (https://www.ers.usda.gov/data-products/farmincome-and-wealth-statistics/ )
26. Board of Governors of the Federal Reserve System, Financial Accounts of the United States (https:// www.federalreserve.gov/releases/z1/ )
27. Federal Reserve Bank of St. Louis, FRED Database (https://fred.stlouisfed.org/ )

1999 K Street, N.W., Fourth Floor Washington, DC 20006
Phone: 800.879.3276
www farmermac com/thefeed

The Feed directly. The information and opinions contained herein have been compiled or arrived at from sources believed to be reliable, representation or warranty, express or implied, by Farmer Mac is made as to the accuracy, completeness, timeliness, or correctness of the information, opinions, or the sources from which they were derived. The information and opinions contained herein are here for general information purposes only and have been provided with the understanding that the authors and publishers are not herein engaged in rendering investment, legal, accounting, tax, or other professional advice or services. This publication may include “forward-looking statements,” which include all projections, forecasts, or expectations of future performance or results, as well as statements or expressions of opinions. No reliance should be placed on any forward-looking statements expressed in this publication. Farmer Mac specifically disclaims any liability for any errors, inaccuracies, or omissions in this publication and for any loss or damage, however arising, that may result from the use of or reliance by any person upon any information or opinions contained herein. Such information and opinions are subject to change at any time without notice, and nothing contained in this publication is intended as an o er or solicitation with respect to the purchase or sale of any security, including any Farmer Mac security. Unless stated otherwise, all views expressed herein represent Farmer Mac’s opinion. From time to time, The Feed features articles or reports from authors una iliated with Farmer Mac, and the views and opinions expressed in these articles or reports do not necessarily reflect those of Farmer Mac. This document may not be reproduced, distributed, or published, in whole or in part, for any purposes, without the prior written consent of Farmer Mac. All copyrights are reserved.


Ingredients - Cake
1 cup white sugar
⅔ cup pumpkin puree
3 large eggs
½ teaspoon ground cinnamon
¾ cup all-purpose flour
1 teaspoon baking soda
Ingredients - Filling
¼ teaspoon vanilla extract
2 tablespoons butter
1 cup powdered sugar
1 cup white sugar
Directions
Step 1: Preheat the oven to 375 degrees F (190 degrees C). Grease a 10x15-inch jelly roll pan.
Step 2: In a large mixing bowl, blend together sugar, pumpkin puree, eggs, and cinnamon.
Step 3:
In a separate bowl, mix flour and baking soda together. Add flour mixture to pumpkin mixture and blend until smooth. Spread evenly in prepared pan.
Step 4: Bake in preheated oven until cake springs back when lightly touched (15 to 25 minutes). Remove from oven and cool for 5 minutes.
Step 5:
Invert cake onto a cotton (not terry cloth) tea towel. Starting with one of the shorter ends, roll up cake in the towel, creating a spiral. Place seam-side down to cool (approximately 15 minutes).
Step 6: While the cake is cooling, make filling by beating cream cheese, powdered sugar, butter, and vanilla in a mixing bowl until smooth.
Step 7: When cake has completely cooled, unroll and remove towel. Spread filling over cake, all the way to the edges. Roll cake up again without the towel. Wrap with plastic wrap and refrigerate until ready to serve.
Step 8: To serve, sift powdered sugar over the top of the roll and slice into 10 equal portions
Consolidated Grain and Barge Co. (CGB) has expanded its grain handling operations to include both food and feed grade organic grains. According to the 2022 Organic Industry Survey, as offered through the Organic Trade Association, "Between 2020 and 2021, organic sales surpassed $63 billion, with $1.4 billion (2 percent) total growth over the year. Food sales, which comprise over 90 percent of organic sales, rose to $57.5 billion (roughly 2 percent growth), and non-food sales reached $6 billion in sales (7 percent growth)."
Matt Nidlinger, a member of CGB's Market Development team, is managing the startup Organic Grain business. This encompasses trading, accounting, execution, and risk management of organic feed and food grade opportunities within the organic space. Matt has been working for CGB for nearly 14 years and has extensive knowledge and experience in the agriculture industry, growing the organic endeavors for CGB at a rapid pace. "We have quickly grown from two locations to over fifteen handling organic products." Nidlinger says, "Our team is focused on growing a domestic supply chain, making it easier for organic producers to market their grains, and enabling end users to obtain organic products in an efficient manner."
CGB is leveraging more than 30 years of knowledge in handling "Identity Preserved", or IP, grains to connect organic producers throughout the Midwest with a more efficient supply chain. Current facilities accepting organic grains are in Illinois, Indiana, Iowa, and Missouri, and the team states they have plans to expand further.
Non-GMO Project Verified and USDA Organic Certified, CGB has the ability to service food and feed-grade users via truck or rail. Food and feedgrade commodities include yellow corn, white corn, soybeans, wheat, and oats.
For food-grade products, they are serving mills to grind high quality corn, wheat, and oats into ingredients for further processing. Within the feed market, they sell to feed mills that process corn, wheat, soybeans, and hominy into feed rations for dairy, chickens, and turkeys with the ability to ship high volumes at a competitive price.
The USDA National Organic Grain and Feedstuffs Report, released on November 16th, states that the Grower Freight on Board (FOB) Farm Gate Organic Grain has an average price for Yellow Corn at $11.72 Spot Transaction (a $2.44 increase over last year) and Soybeans average at $31.05 ($.47 more than 2021). Prices for White Corn, Wheat, and Oats are currently unavailable via the report.
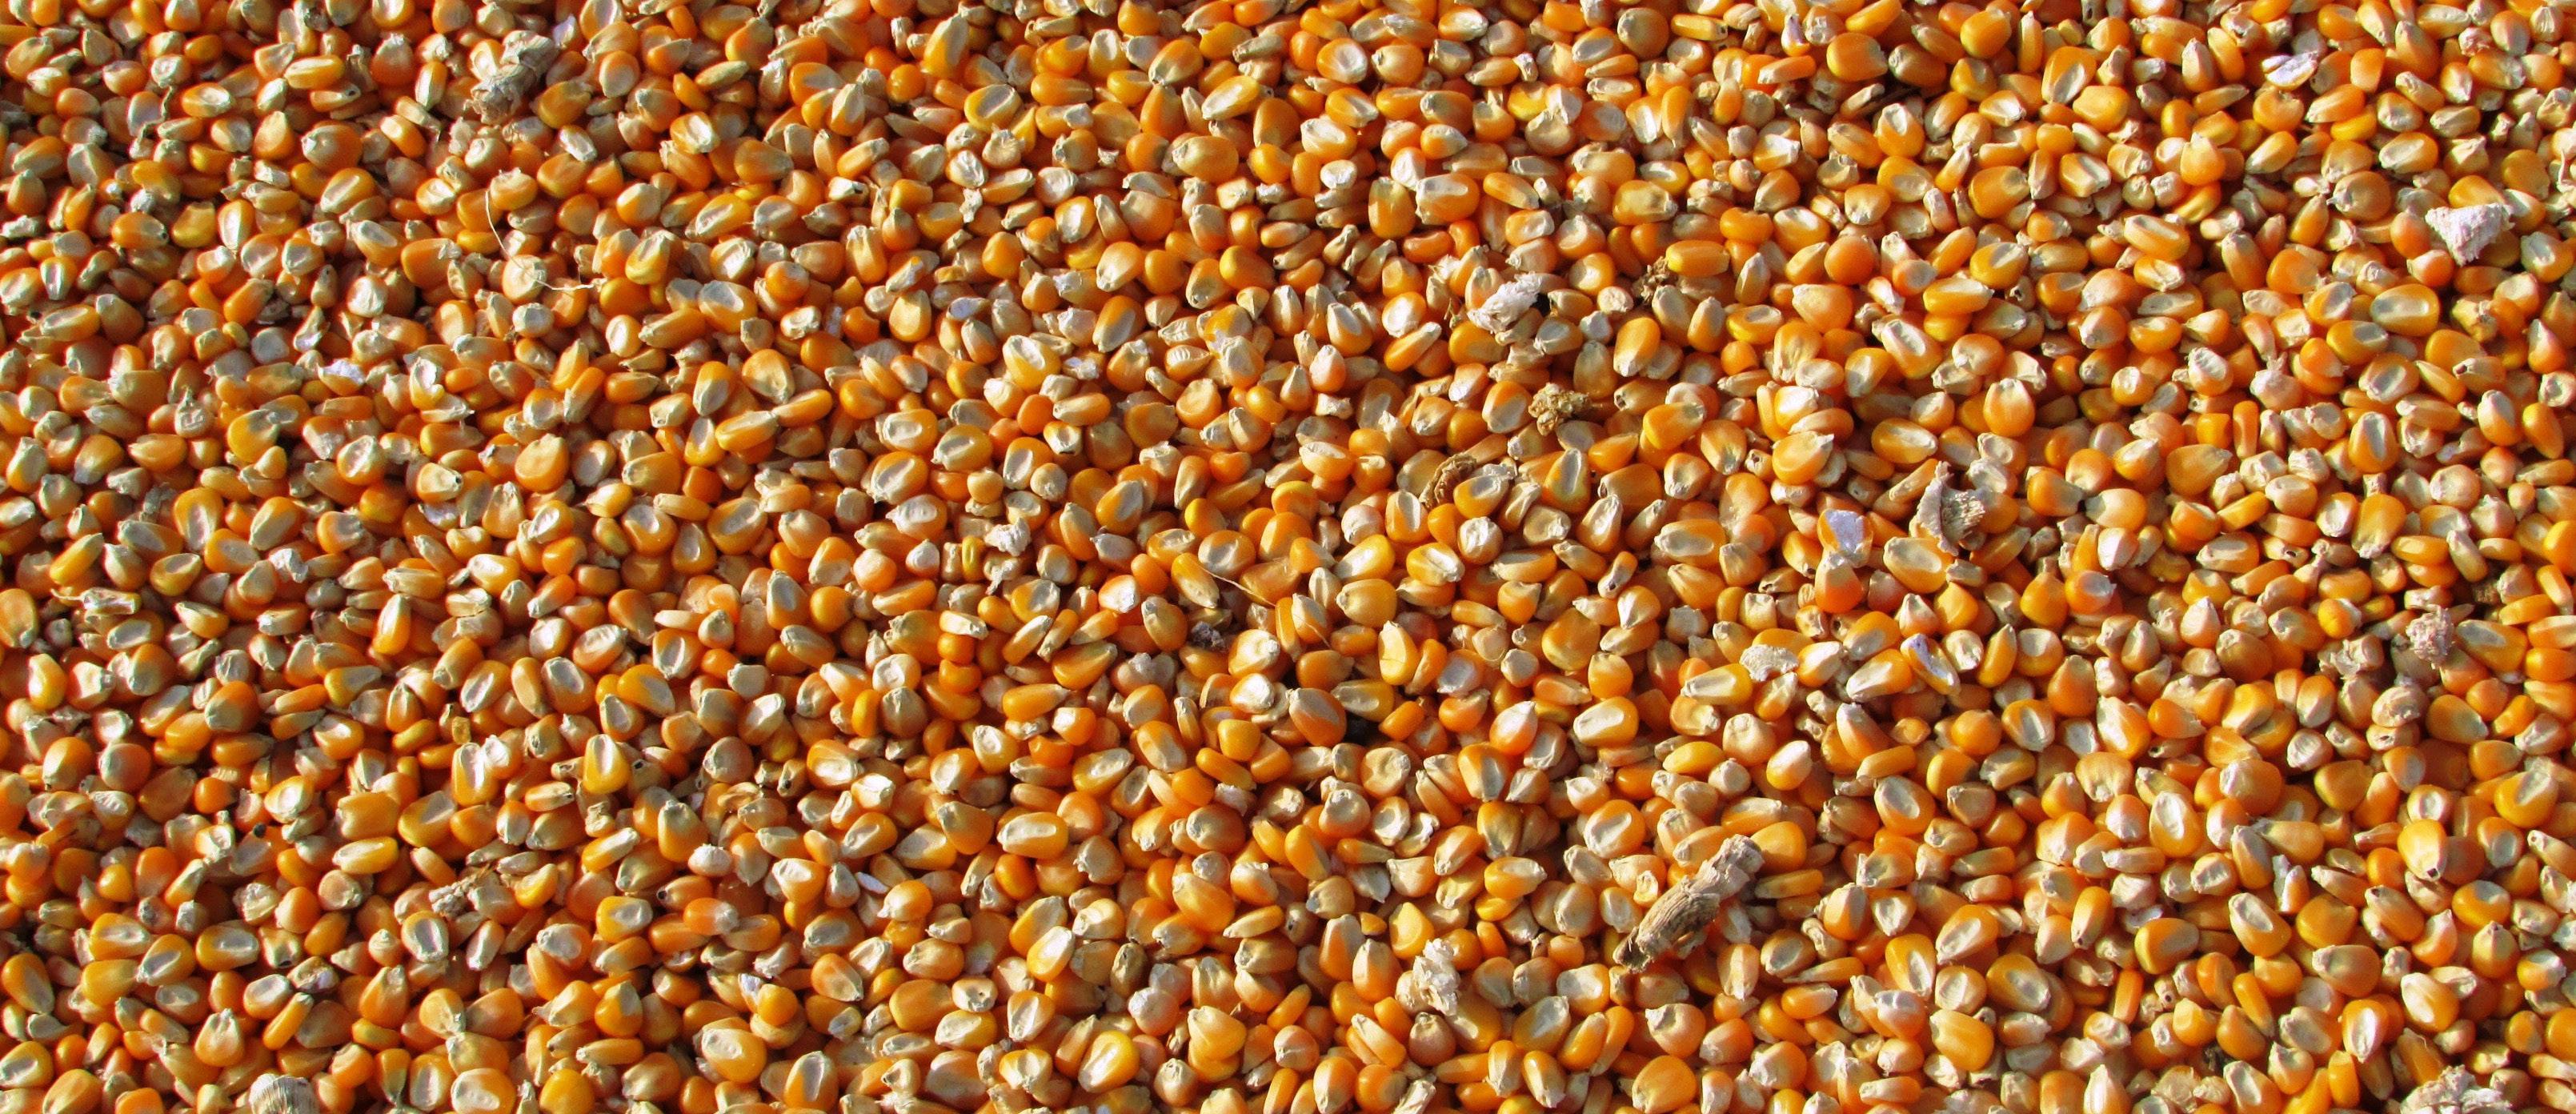
CGB's Market Development team even has resources available to help farmers learn more about transitioning their operations to organic production. Offering to work closely with farmers as they move through the process, the team provides services in financing and marketing, including marketing alternatives like flat price and storage.
To learn more about the programs and even request a bidsheet, visit https://www. cgborganicgrain.com/.
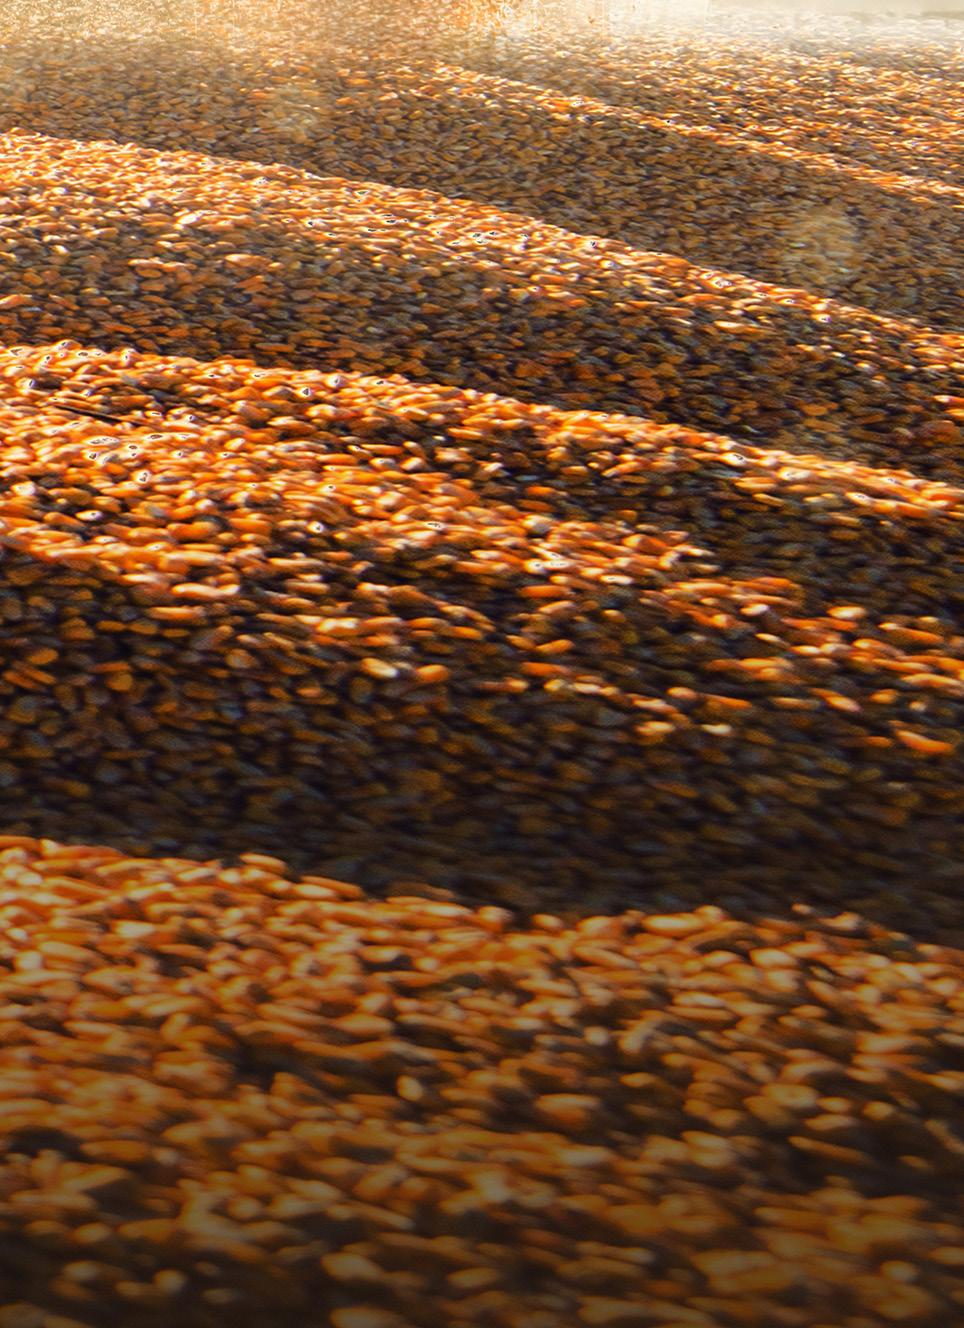
References:

Organic Industry Survey. (n.d.) Retrieved from https://ota.com/organic-market-overview/ organic-industry-survey
USDA National Organic Grain and Feedstuffs Report. November 16, 2022. https://www. ams.usda.gov/mnreports/lsbnof.pdf.
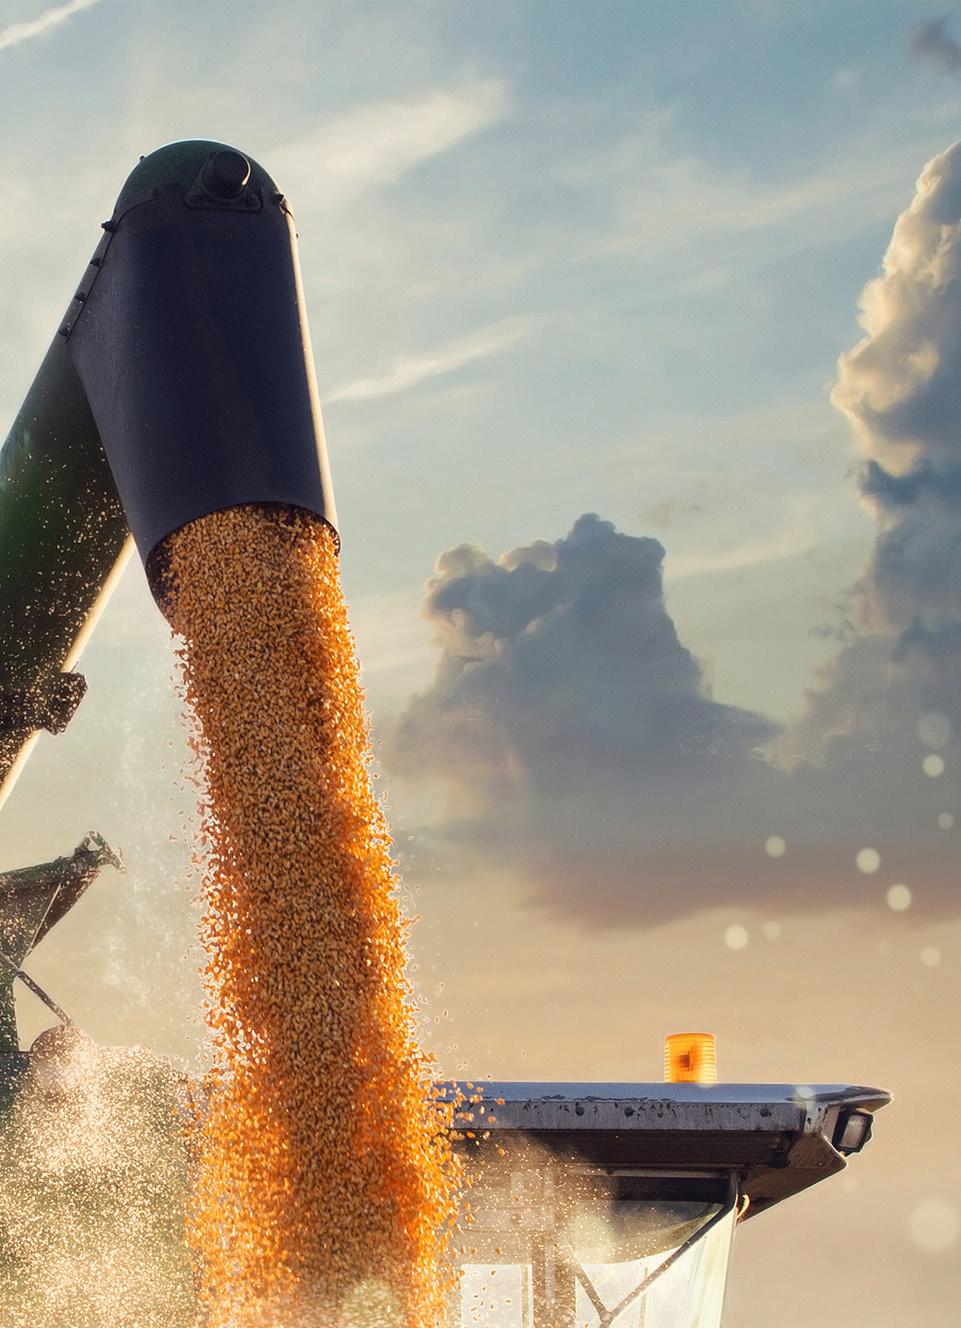

There can be numerous reasons for making transitions on a farming operation. High input costs may require enhancements to better protect cash flow. Diversification or vertical integration of production may be necessary for sustainable growth. You may want to pivot from conventional farming to organic crop production to join a niche market and grow profit margin. These are just a few examples we have seen in the market recently that could benefit from a unique financing structure to set the operation up for success through and beyond the transition.
An interest-only program can be a great fit for transitioning operations. An interest-only loan is exactly what it sounds like – instead of your payment having an amount that goes toward principal and a portion to interest, your entire payment applies to interest. Of course, this does not remove the responsibility to pay off the principal amount after the interest-only period is over. This type of financing does; however, provide many benefits that can include an increase in net cash flow, correction or enhancement of financial position, or access to financing for a new project that other lenders won’t fund due to the lack of historical production/ performance data.
The interest-only vehicle can fund the time needed for the transitional element of the business to become sustainable/profitable
and then be positioned to convert into a conventional, long-term, fixed loan product.
The most important consideration for interest-only financing during a transition, is the business plan itself. In order to maximize the benefits from this unique style of financing, there must be a well-organized, thought-out plan with specific actionable items, measures of success, and quantifiable projected results.
On the following three pages are a few examples of real-life producers and how interest-only financing benefits their transitioning operations.
As you read these, note the specific business plans they are implementing through the I/O period.
Loan Amount: $6,000,000
I/O for 3 years
In 2016, this 3rd generation dairy farmer saw an opportunity to expand their dairy facilities. Once expansion was completed in 2018, the dairy was then permitted to milk 1,600 head of cows with full capacity at 2,100 head on the farm. This loan will be used to refinance real estate and rebalance the operation’s financial position. Loan proceeds will also fund the purchase of 700 head of dairy cows to bring the dairy facility to capacity. Increasing the number of milk cows so that the dairy has higher milk production will allow the operation to take advantage of existing space and, therefore, efficiency.
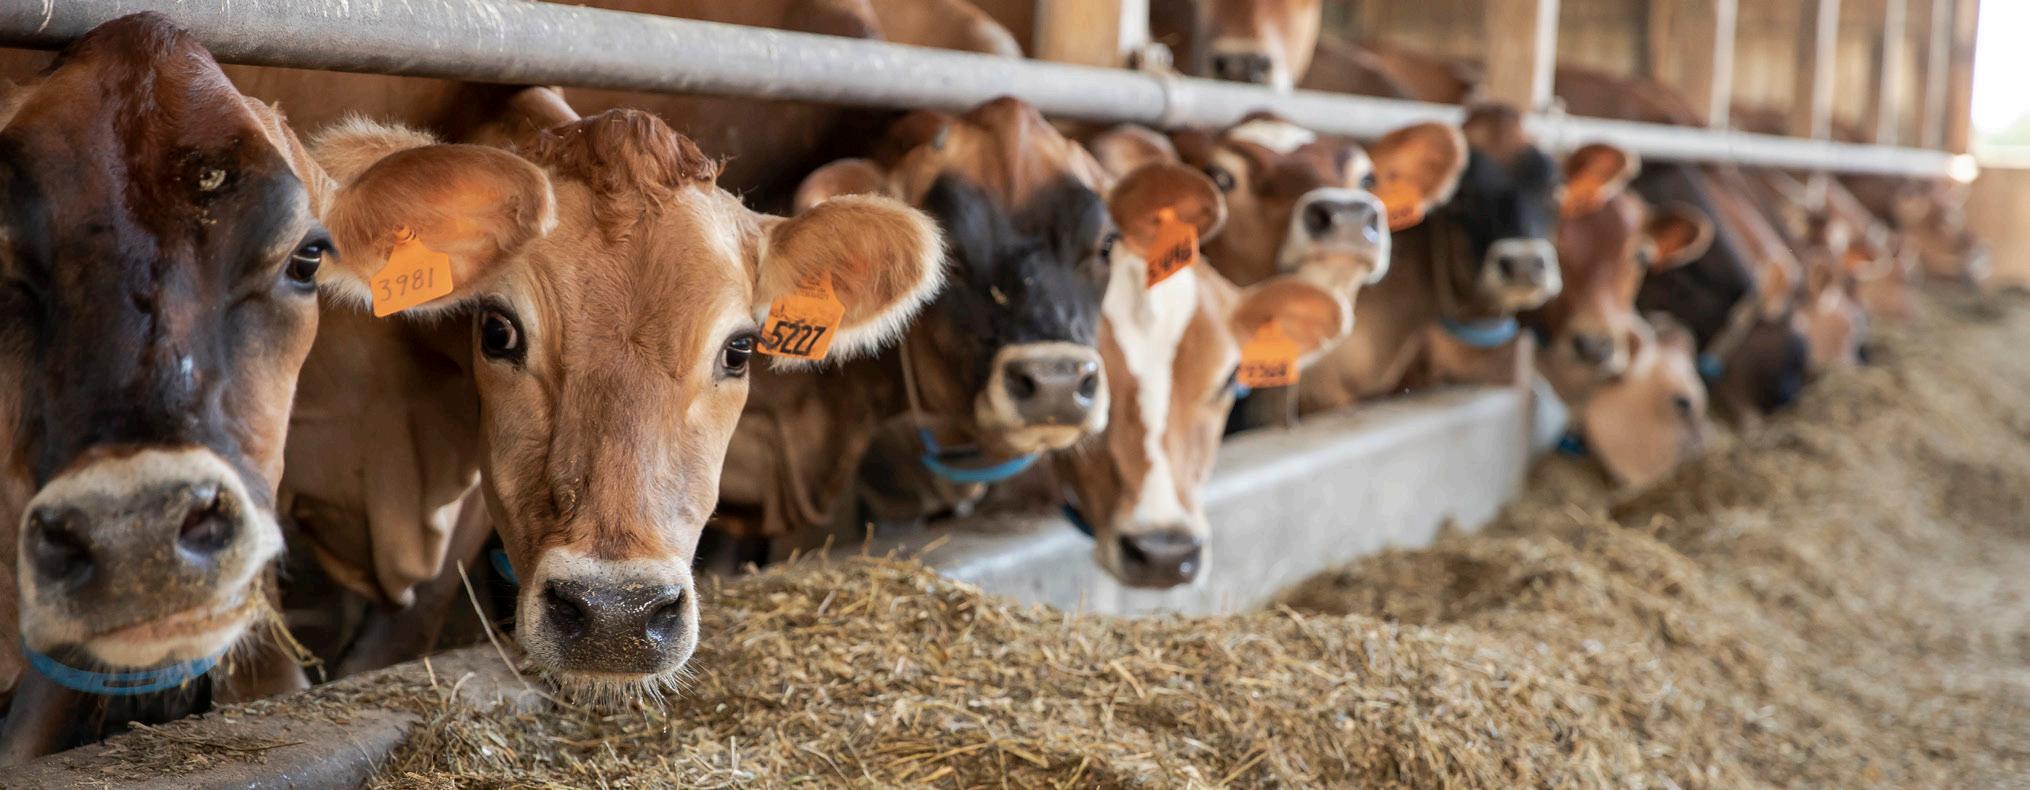
Combining the real estate loans and consolidating some of the chattel debt will better position the operation to apply payments and reduce debt left in place more quickly. The interest-only structure will increase interest expense on the increased debt, but will be offset by not requiring principal payment on the new debt until increased production takes place. The proposed increase in herd size will increase cash flow and better use the assets already in place.
Loan Amount: $700,000
I/O for 3 years
Farmer B currently has a combined 860 acres in crop production, with 360 of them organically certified ground under irrigation pivot. They also operate an organic grain processing facility with capacity for approximately 700,000 bushels of grain onsite. The grain facilities move grain for local producers as well as other agribusinesses.
Loan proceeds will be used to purchase 675 acres of cut over timber land that is eligible for organic farm production. The land will be cleared and developed into tillable acreage, incorporated into the existing organic farm production, and then run through the grain facility; increasing production as well as reducing risk associated with outside contracts.
It is estimated that it will take 12-18 months to clear the land. Interest-only terms of the loan will allow the amount of time needed to improve the collateral so that it can generate enough income to service its debt on a stand-alone basis, and also preserve cash throughout the process.
of Permanent Planting Loan Amount: $13,000,000
I/O for 5 years
With more than 30 years of experience, these individuals operate an almond and raisin grape ranch in the Central Valley of California. Over the last eight years, they have been implementing a plan to redevelop 420 acres of their land, transitioning a portion of their raisin grape production to conventional almonds. This strategy has been employed in order to diversify and promote strong net cash flows from farming operations. Raisin yields have remained strong over time and almond yields are increasing on an above average pace as the orchards gain in maturity.
The interest-only period will enhance cash flow while the raisin land is cleared and prepped for almond production. Loan proceeds will purchase potted, two-year old almond trees, fast-tracking time needed for full maturity production. At the end of the I/O period, the almond production will be sufficient to service debt on conventional financing.
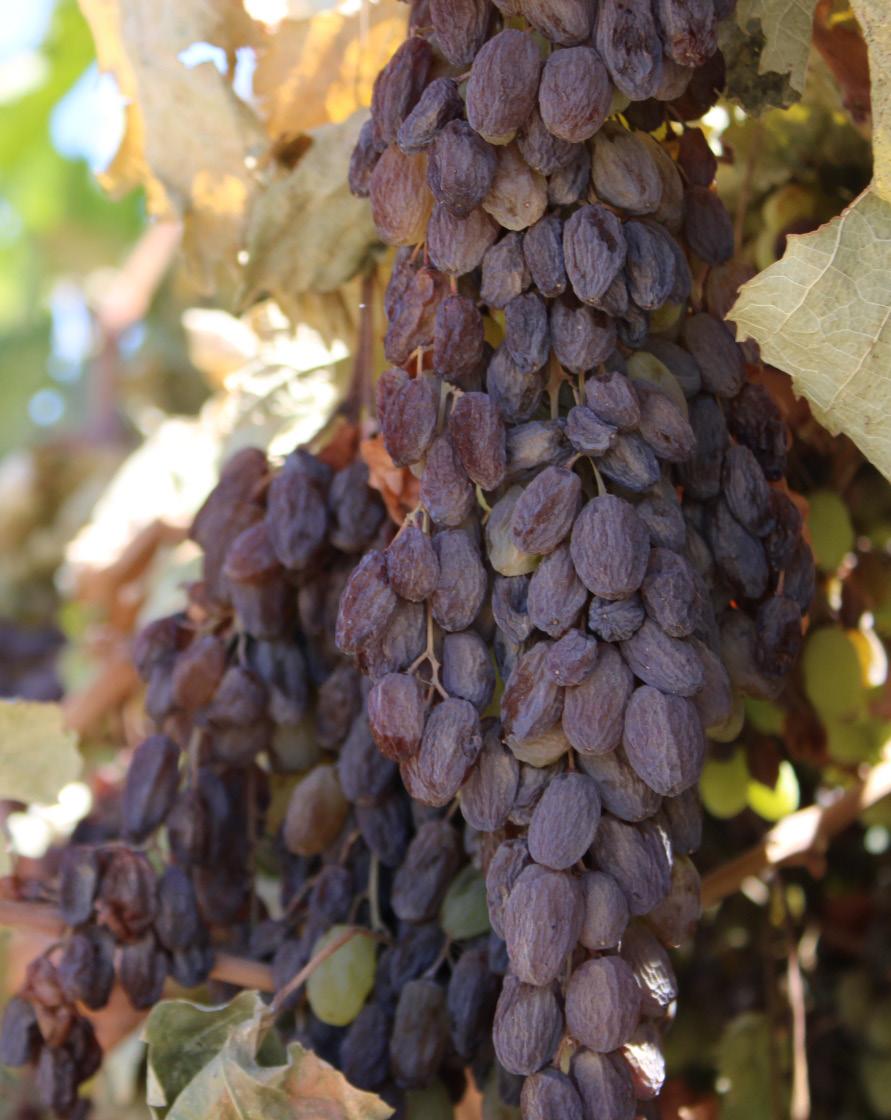
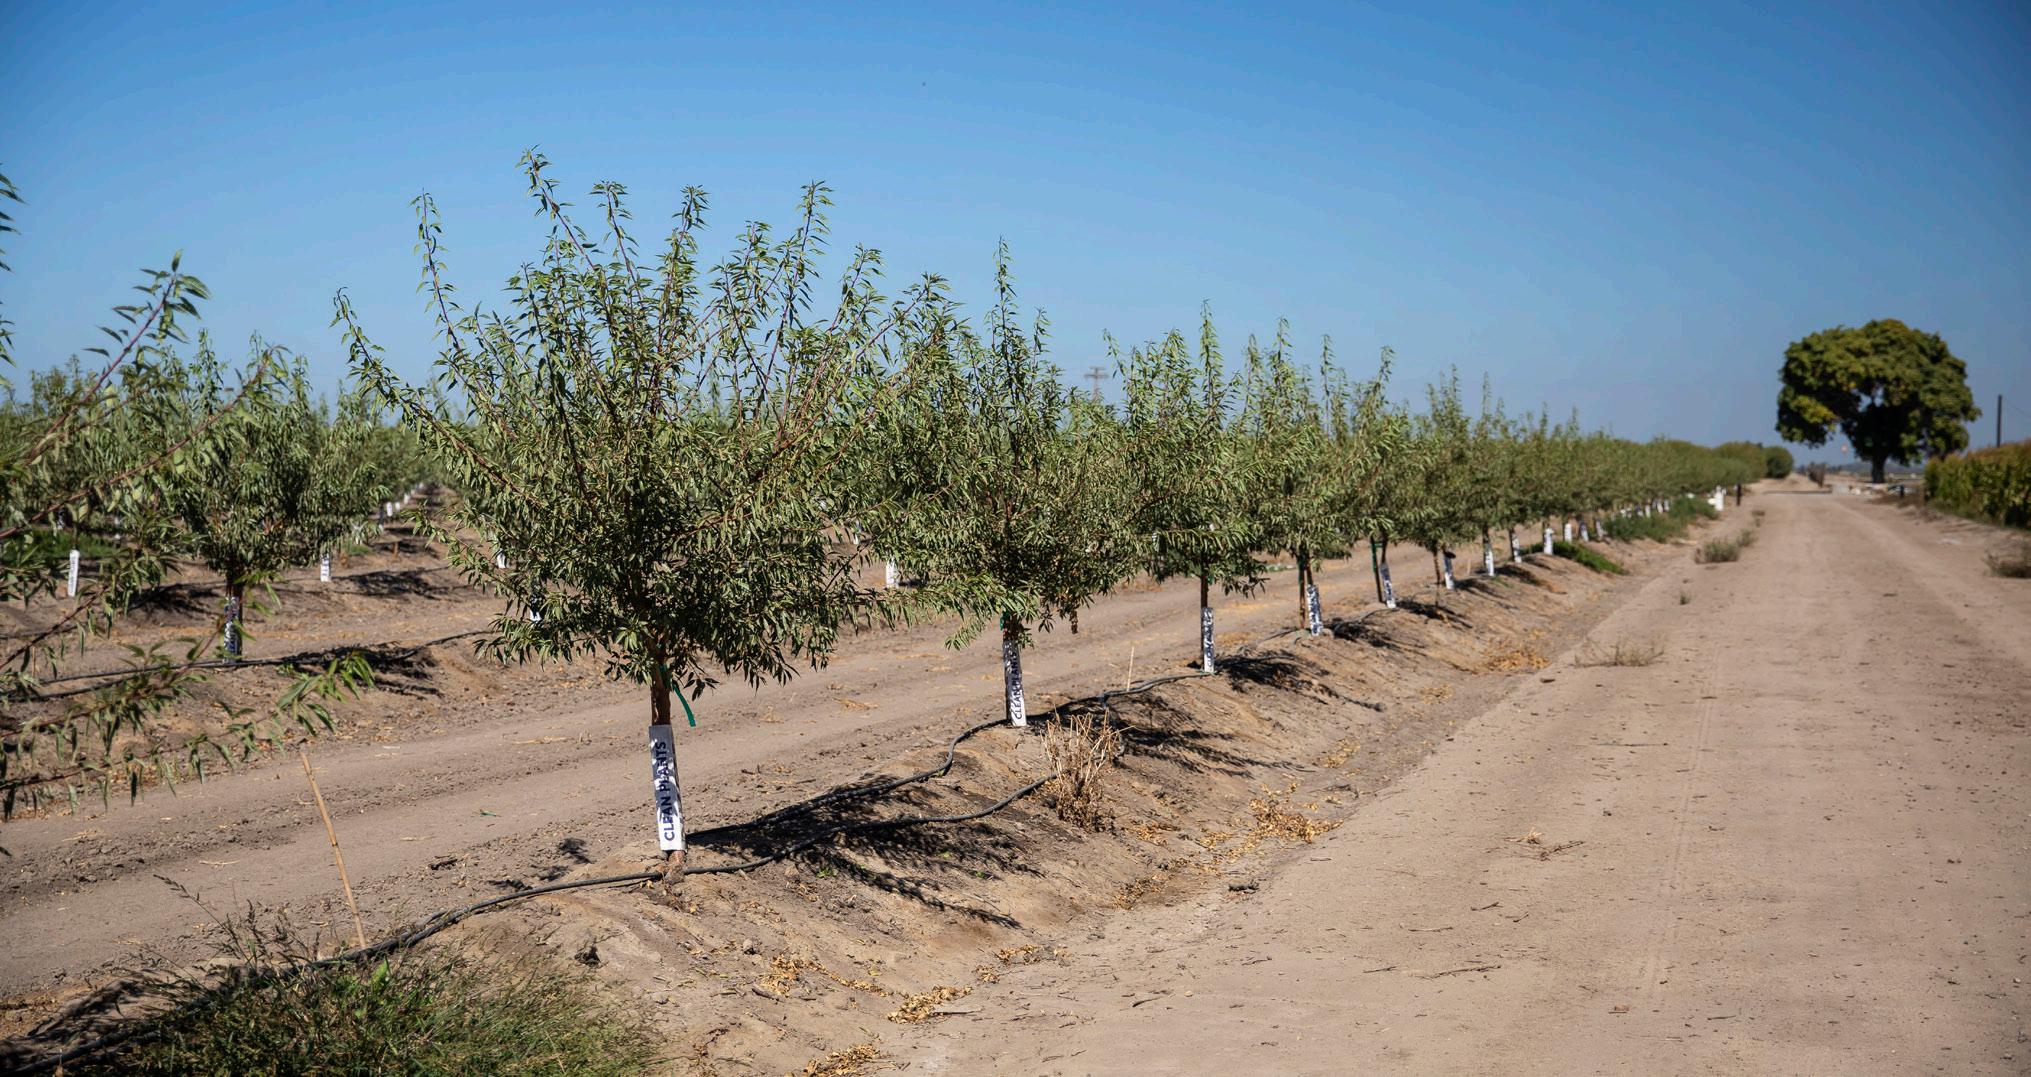
If you are approaching a transition for your operation and are considering interest-only financing, here is a list, summarizing some of the pros and cons to help you make a decision.
With an interest-only loan, your scheduled payments could be lower than that of a conventional loan that includes principal in every payment. Lower payments means more flexibility with how and where your business uses money.
If your operation’s transition is adding an element of business that you have no production history for, an interest-only period will give you the flexibility to grow that piece and prove its efficacy, and therefore, convert it into a long-term, fixed loan product once the I/O period is over.
When lenders are analyzing creditworthiness, they calculate a ratio that compares how much you have against how much you owe. With lower payments, you could, in theory, borrow more money than if you were utilizing conventional financing.
Especially with irregular income, as is the case with most farming operations due to market fluctuations, an interest-only loan can be a great method for keeping borrowing costs low.
As interest rates fluctuate, interest-only financing can provide the opportunity to “sit” on a short-term rate until they become more attractive. At that time, not only will you gain the benefits of converting to a long-term, fixed product, but you will also have gained the time for your transition to become profitable with production history.

If you are in the process of expanding your operation, depending on the type of asset you’re purchasing, the only equity that will be built during the interest-only period is purely based on appreciation value, if applicable. Since there is no reduction of principal with this loan structure, once you convert your financing into a conventional loan, you may be essentially beginning with the same dollar amount you initially financed.
Interest-Only financing is short-term (typically 3-5 years). That time period should be used to establish profitability for the transitional elements you developed. The goal is then to convert your financing to a conventional, long-term, fixed product.
Transitioning an operation can be a complex issue, but financing it should not be. Considering an interest-only loan product may be the key to success for your business. As always, talk with your AgriFinancial ag lending expert to discuss how an I/O program might work for you and your goals.
Visit www.cgb-agfi.com to get started.

"Our two daughters, Madison (11 yrs) and Hailey (10 yrs) have developed a love for agriculture and enjoy taking walks and wagon rides through the blueberry rows. We want our girls to have the experience of being raised on a family farming operation and as their parents, offer examples of hard work, dedication, and being advocates for agriculture." - An excerpt from their website www.critchleyfamilyfarms.com
Roots run deep in agriculture for the Critchley family, located in California's Central Valley. With grandfathers, on both sides, serving as leaders within the agricultural community, these third generation farmers are dedicated to growing their family operation through vertical integration.
Raising diverse crops, operating two cold storage facilities, and running trucking and logistics companies, Scott and Mandy Critchley are actively involved in agriculture alliances and organizations throughout the Golden State.
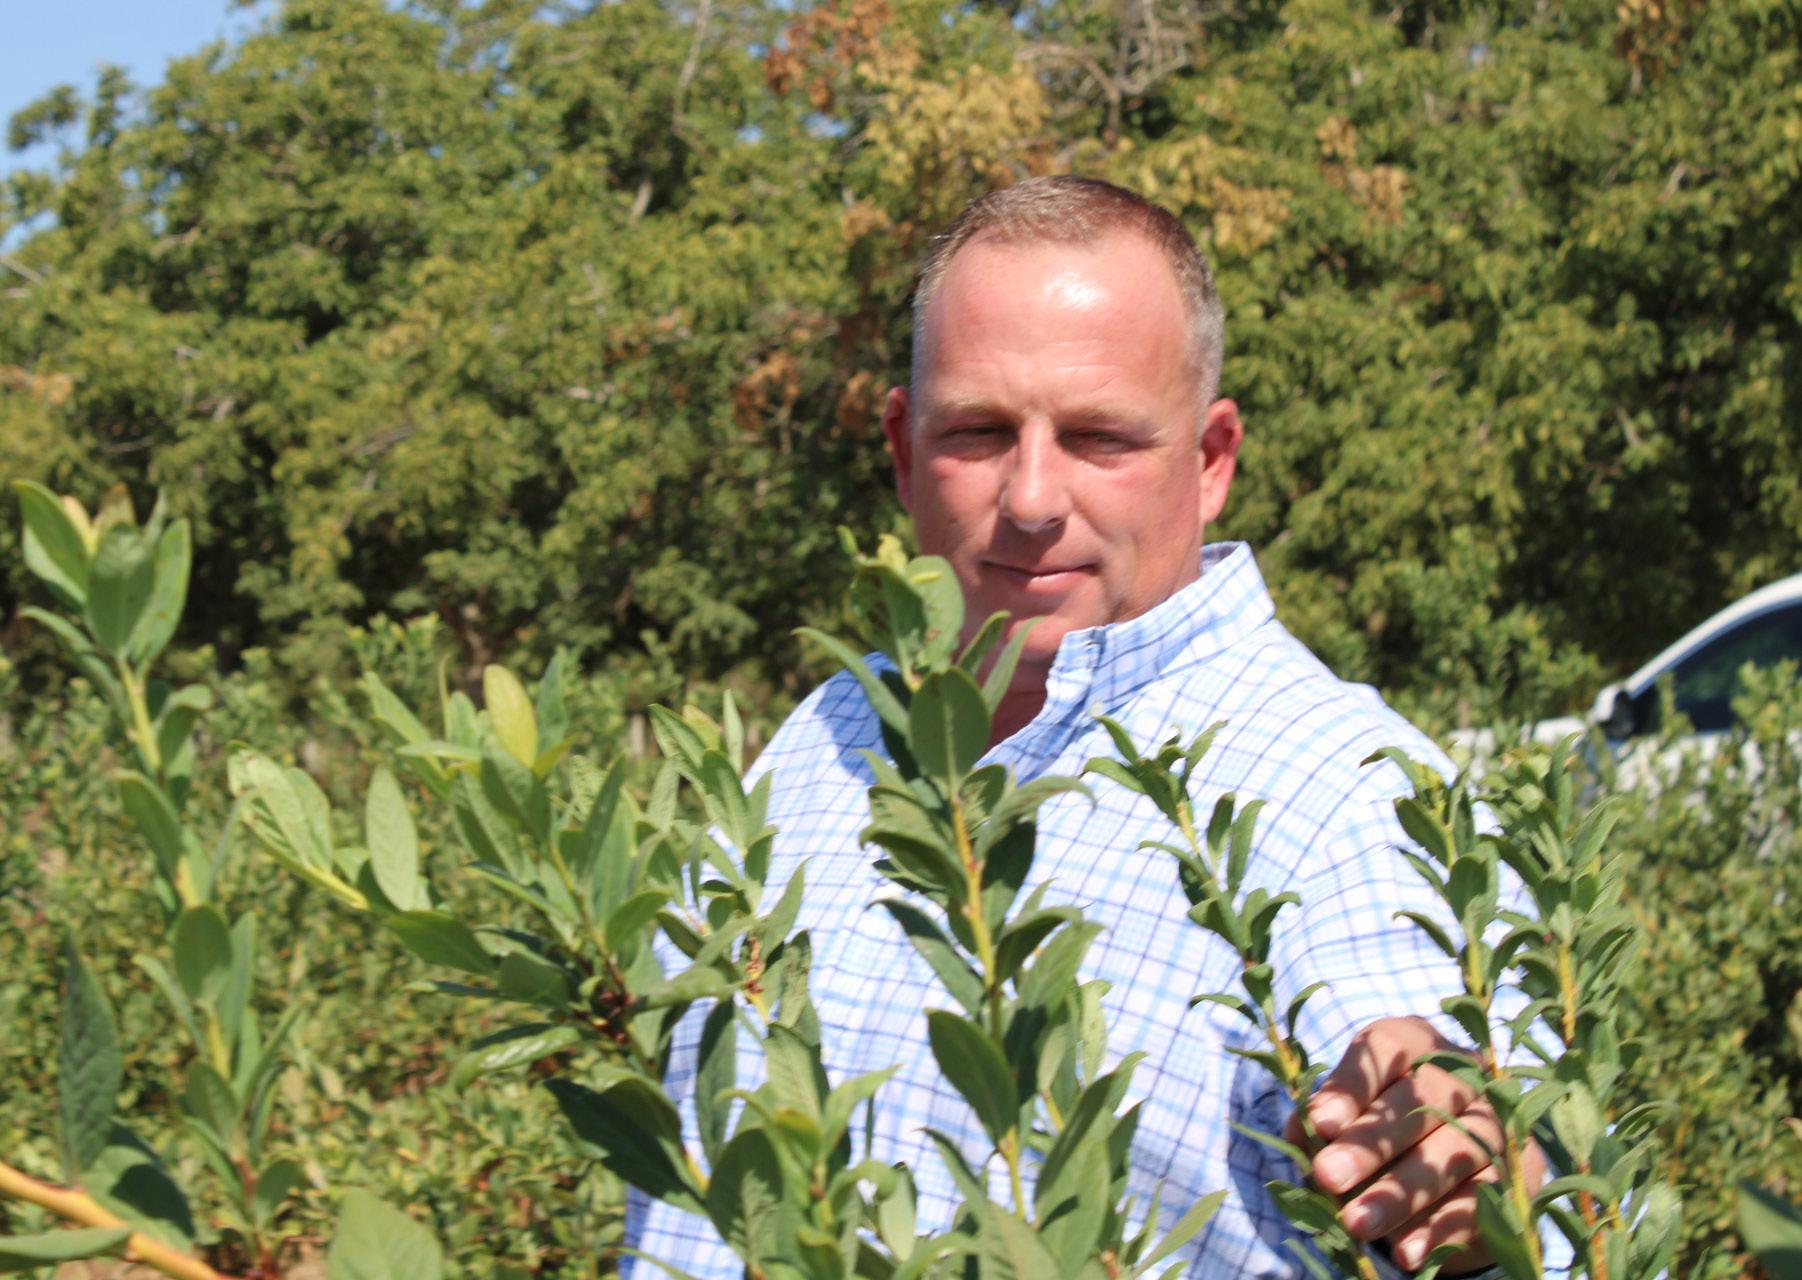
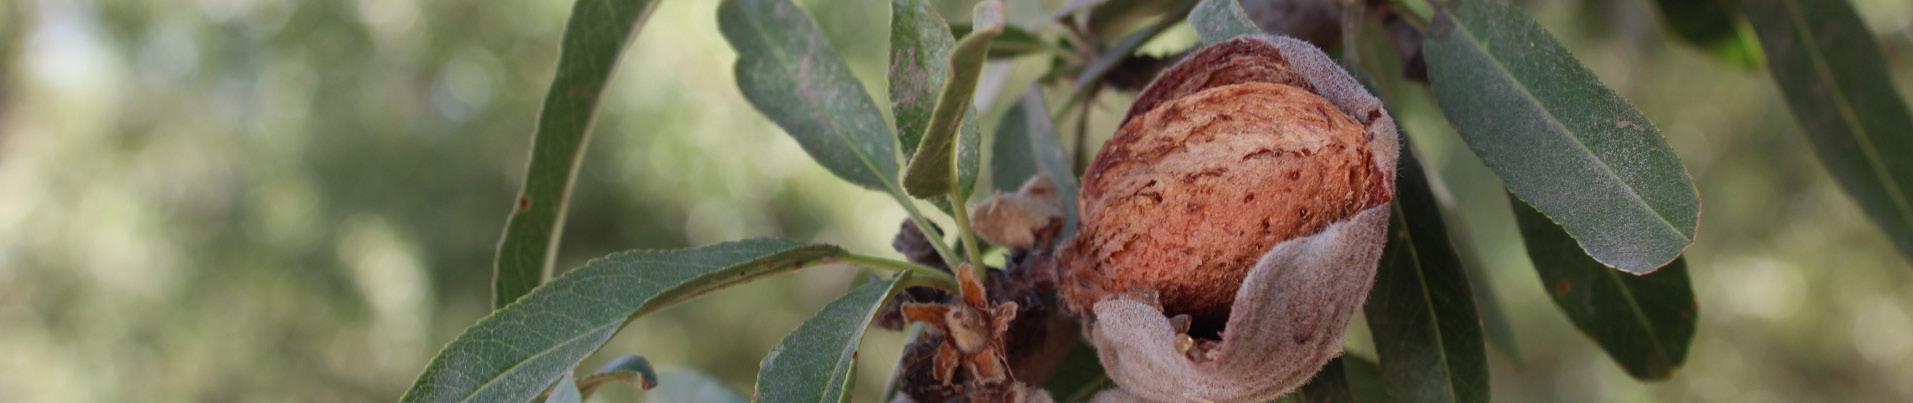
Get to know Scott, Mandy, Madison, and Hailey Critchley and why they say, no matter the season, their farm Tastes Like Summer.
Years farming: 25 years
Crops raised: Blueberries, Blackberries, Table Grapes and Almonds
Favorite Farm Memory:
I remember Scott driving an old tractor at our home ranch to remove the three foot tall weeds that were on the property. Every time I drive by the home ranch and look at the beautiful blueberry plants, I remember how it all looked when we first started. We are so fortunate to have so many great memories with our girls and our family.
*Producer featured with permission.When we receive a call or email from one of our customers/consumers letting us know they loved our product; asking where they can find more. Having conversations with our customers/ consumers about our family story and engaging with them on the importance of their food being grown locally by a third generation farming family. Many people don't realize or know the complexities of who or where their food comes from and we feel it is our obligation to be an advocate for the California Agricultural Industry.
Josh Ollenberger is a great Finance Manager and understands the business. AgFi is very easy to work with and is very knowledgeable. We appreciate and value our relationship with AgriFinancial.
We love what we do and farming is our passion. We continue to embrace producing more with less and strive for efficiencies on all levels with our farming practices; irrigation, technology, renewable energy, labor, plant genetics, and nutrition, etc.

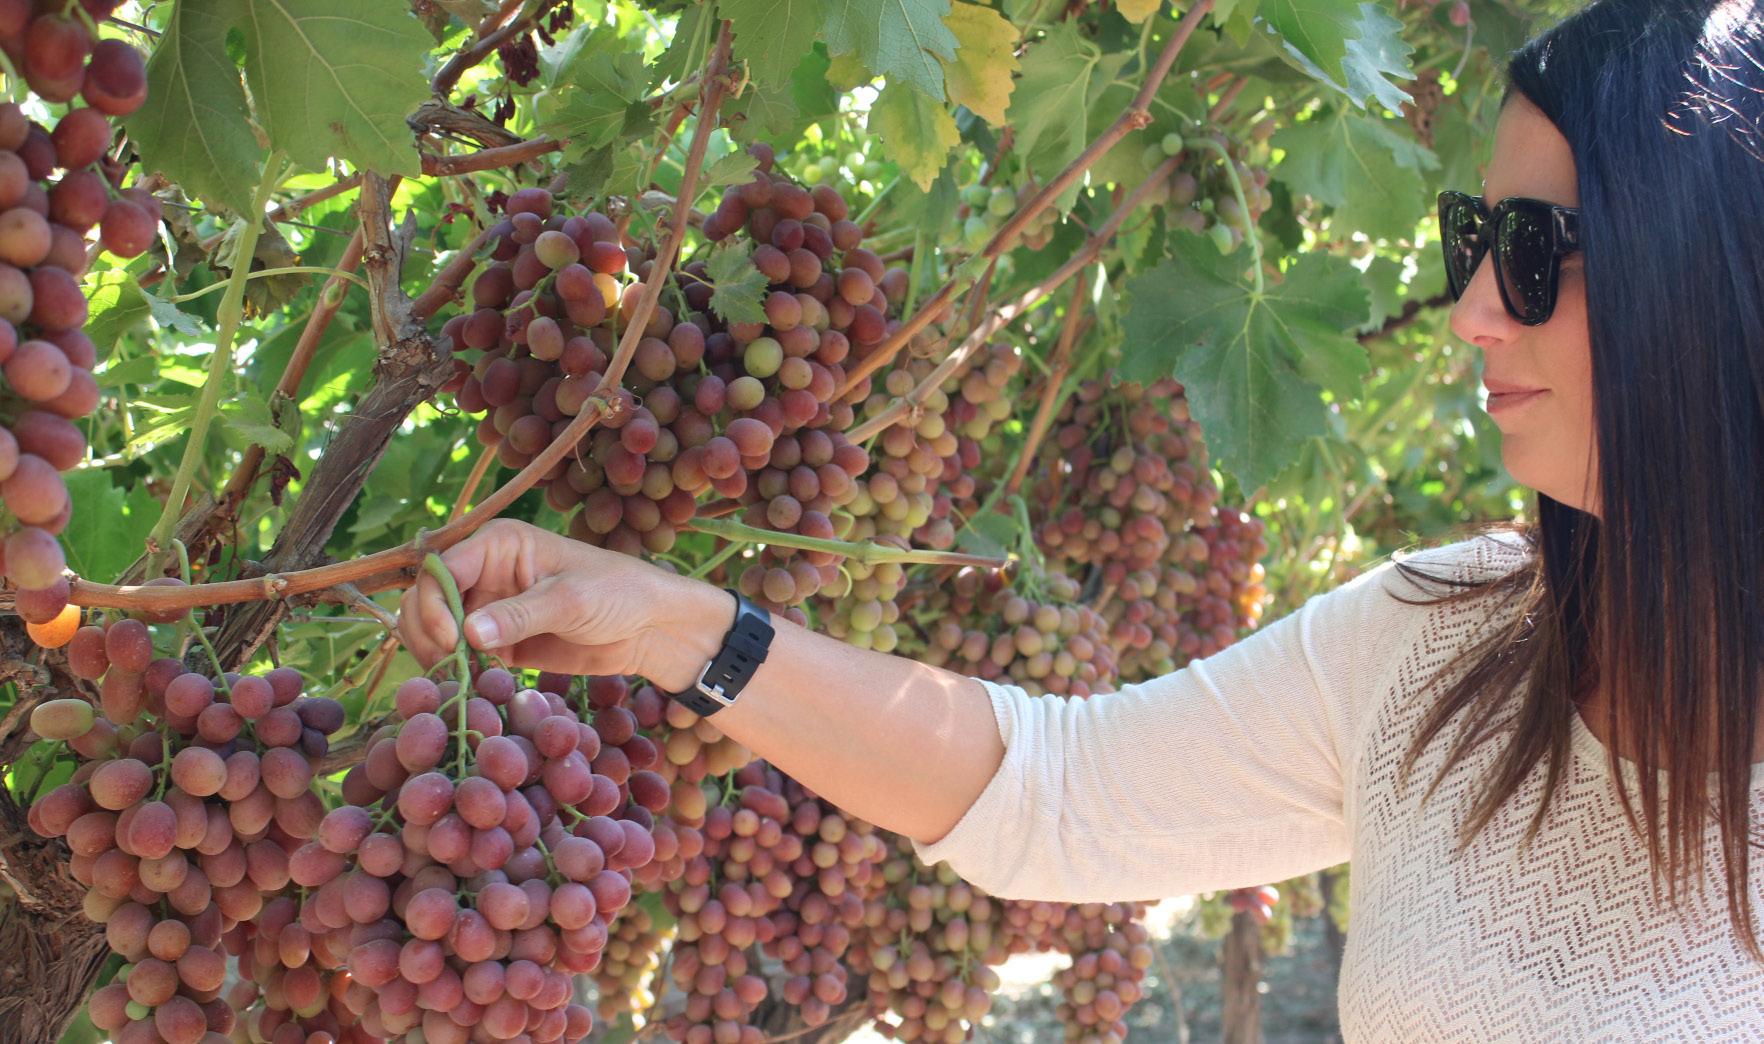
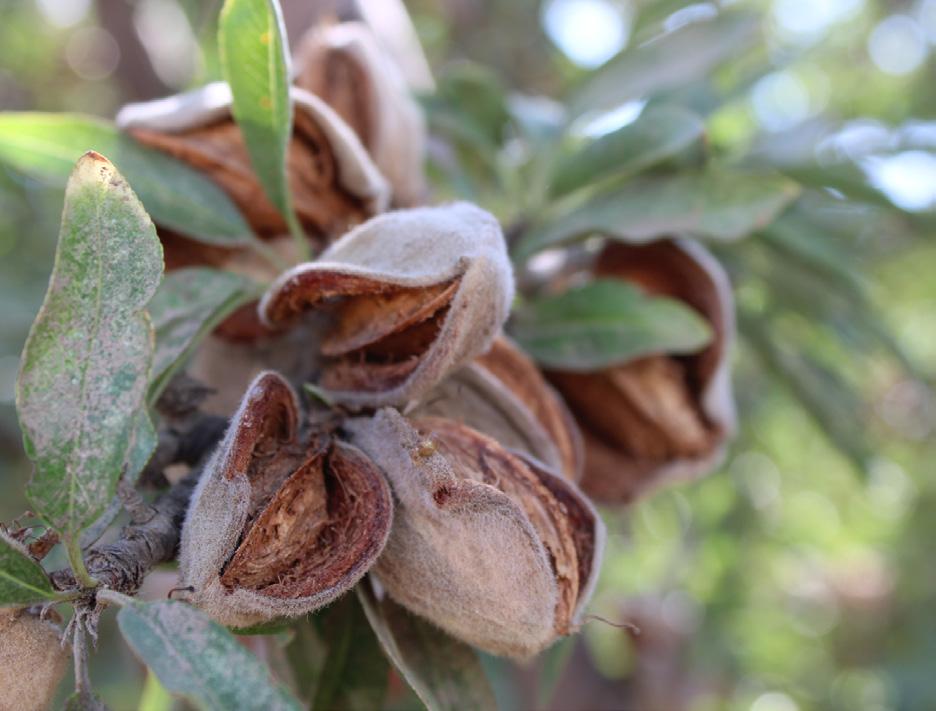

AgriFinancial is a premier agricultural lender, backed by decades of ag expertise and dedicated to understanding your longterm goals in the face of ever-changing markets.
As a subsidiary of CGB Enterprises, Inc. (an innovative and progressive leader in agriculture since 1969), AgFi takes a comprehensive approach to custom-tailored financial solutions.
Our sales officers are strategically located throughout the country to be able to meet customers on their farms, sit at the kitchen table, identify the producer's individual goals, and find the financial solution that works best for each unique operation.
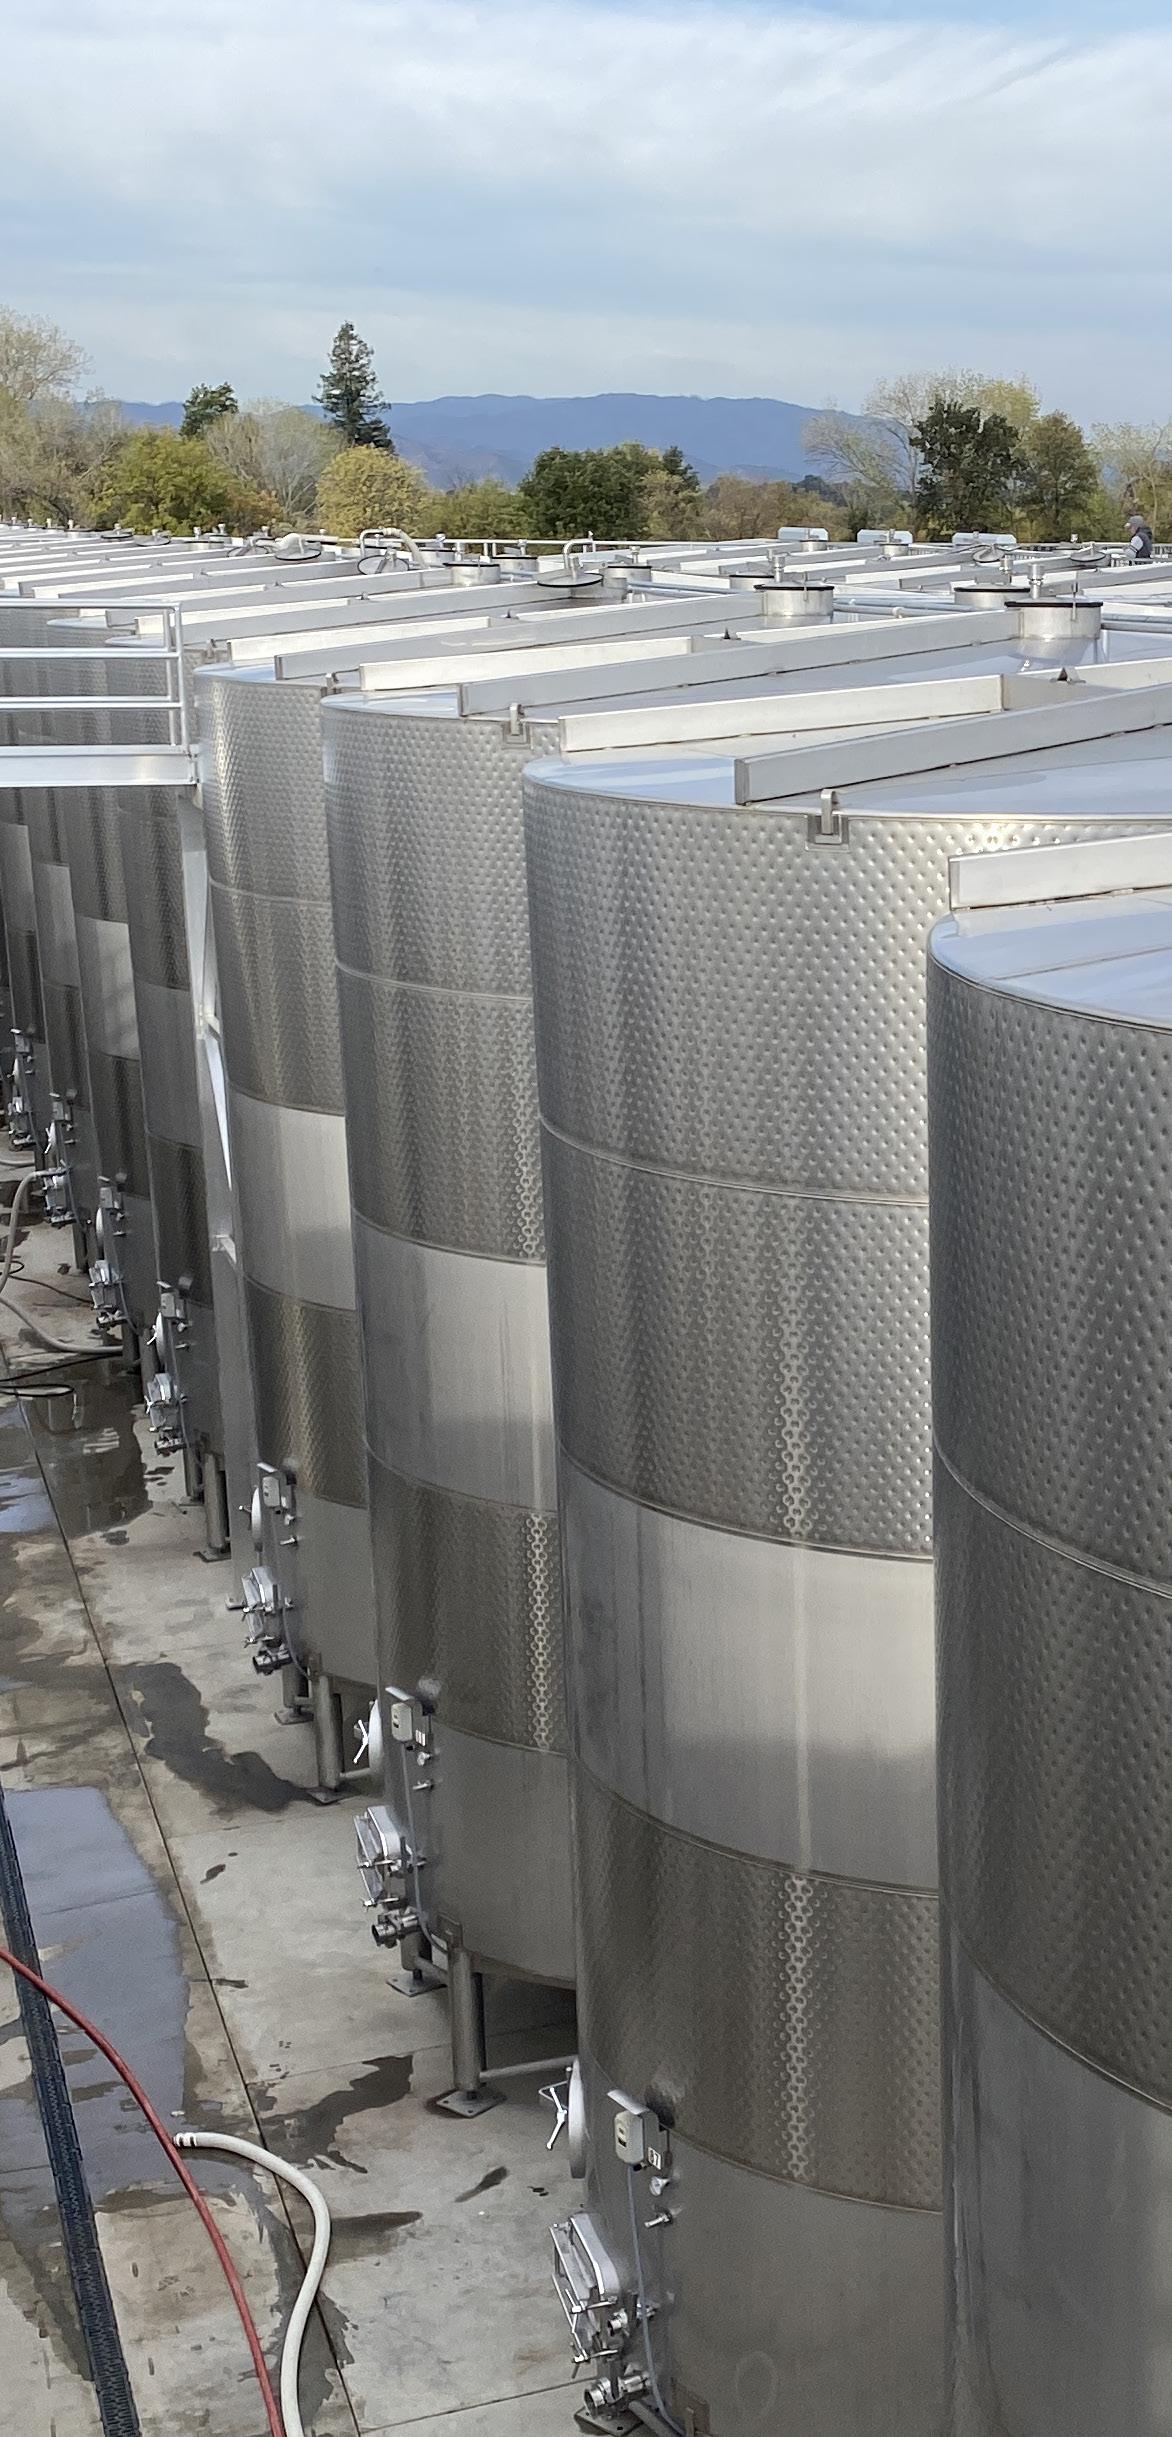
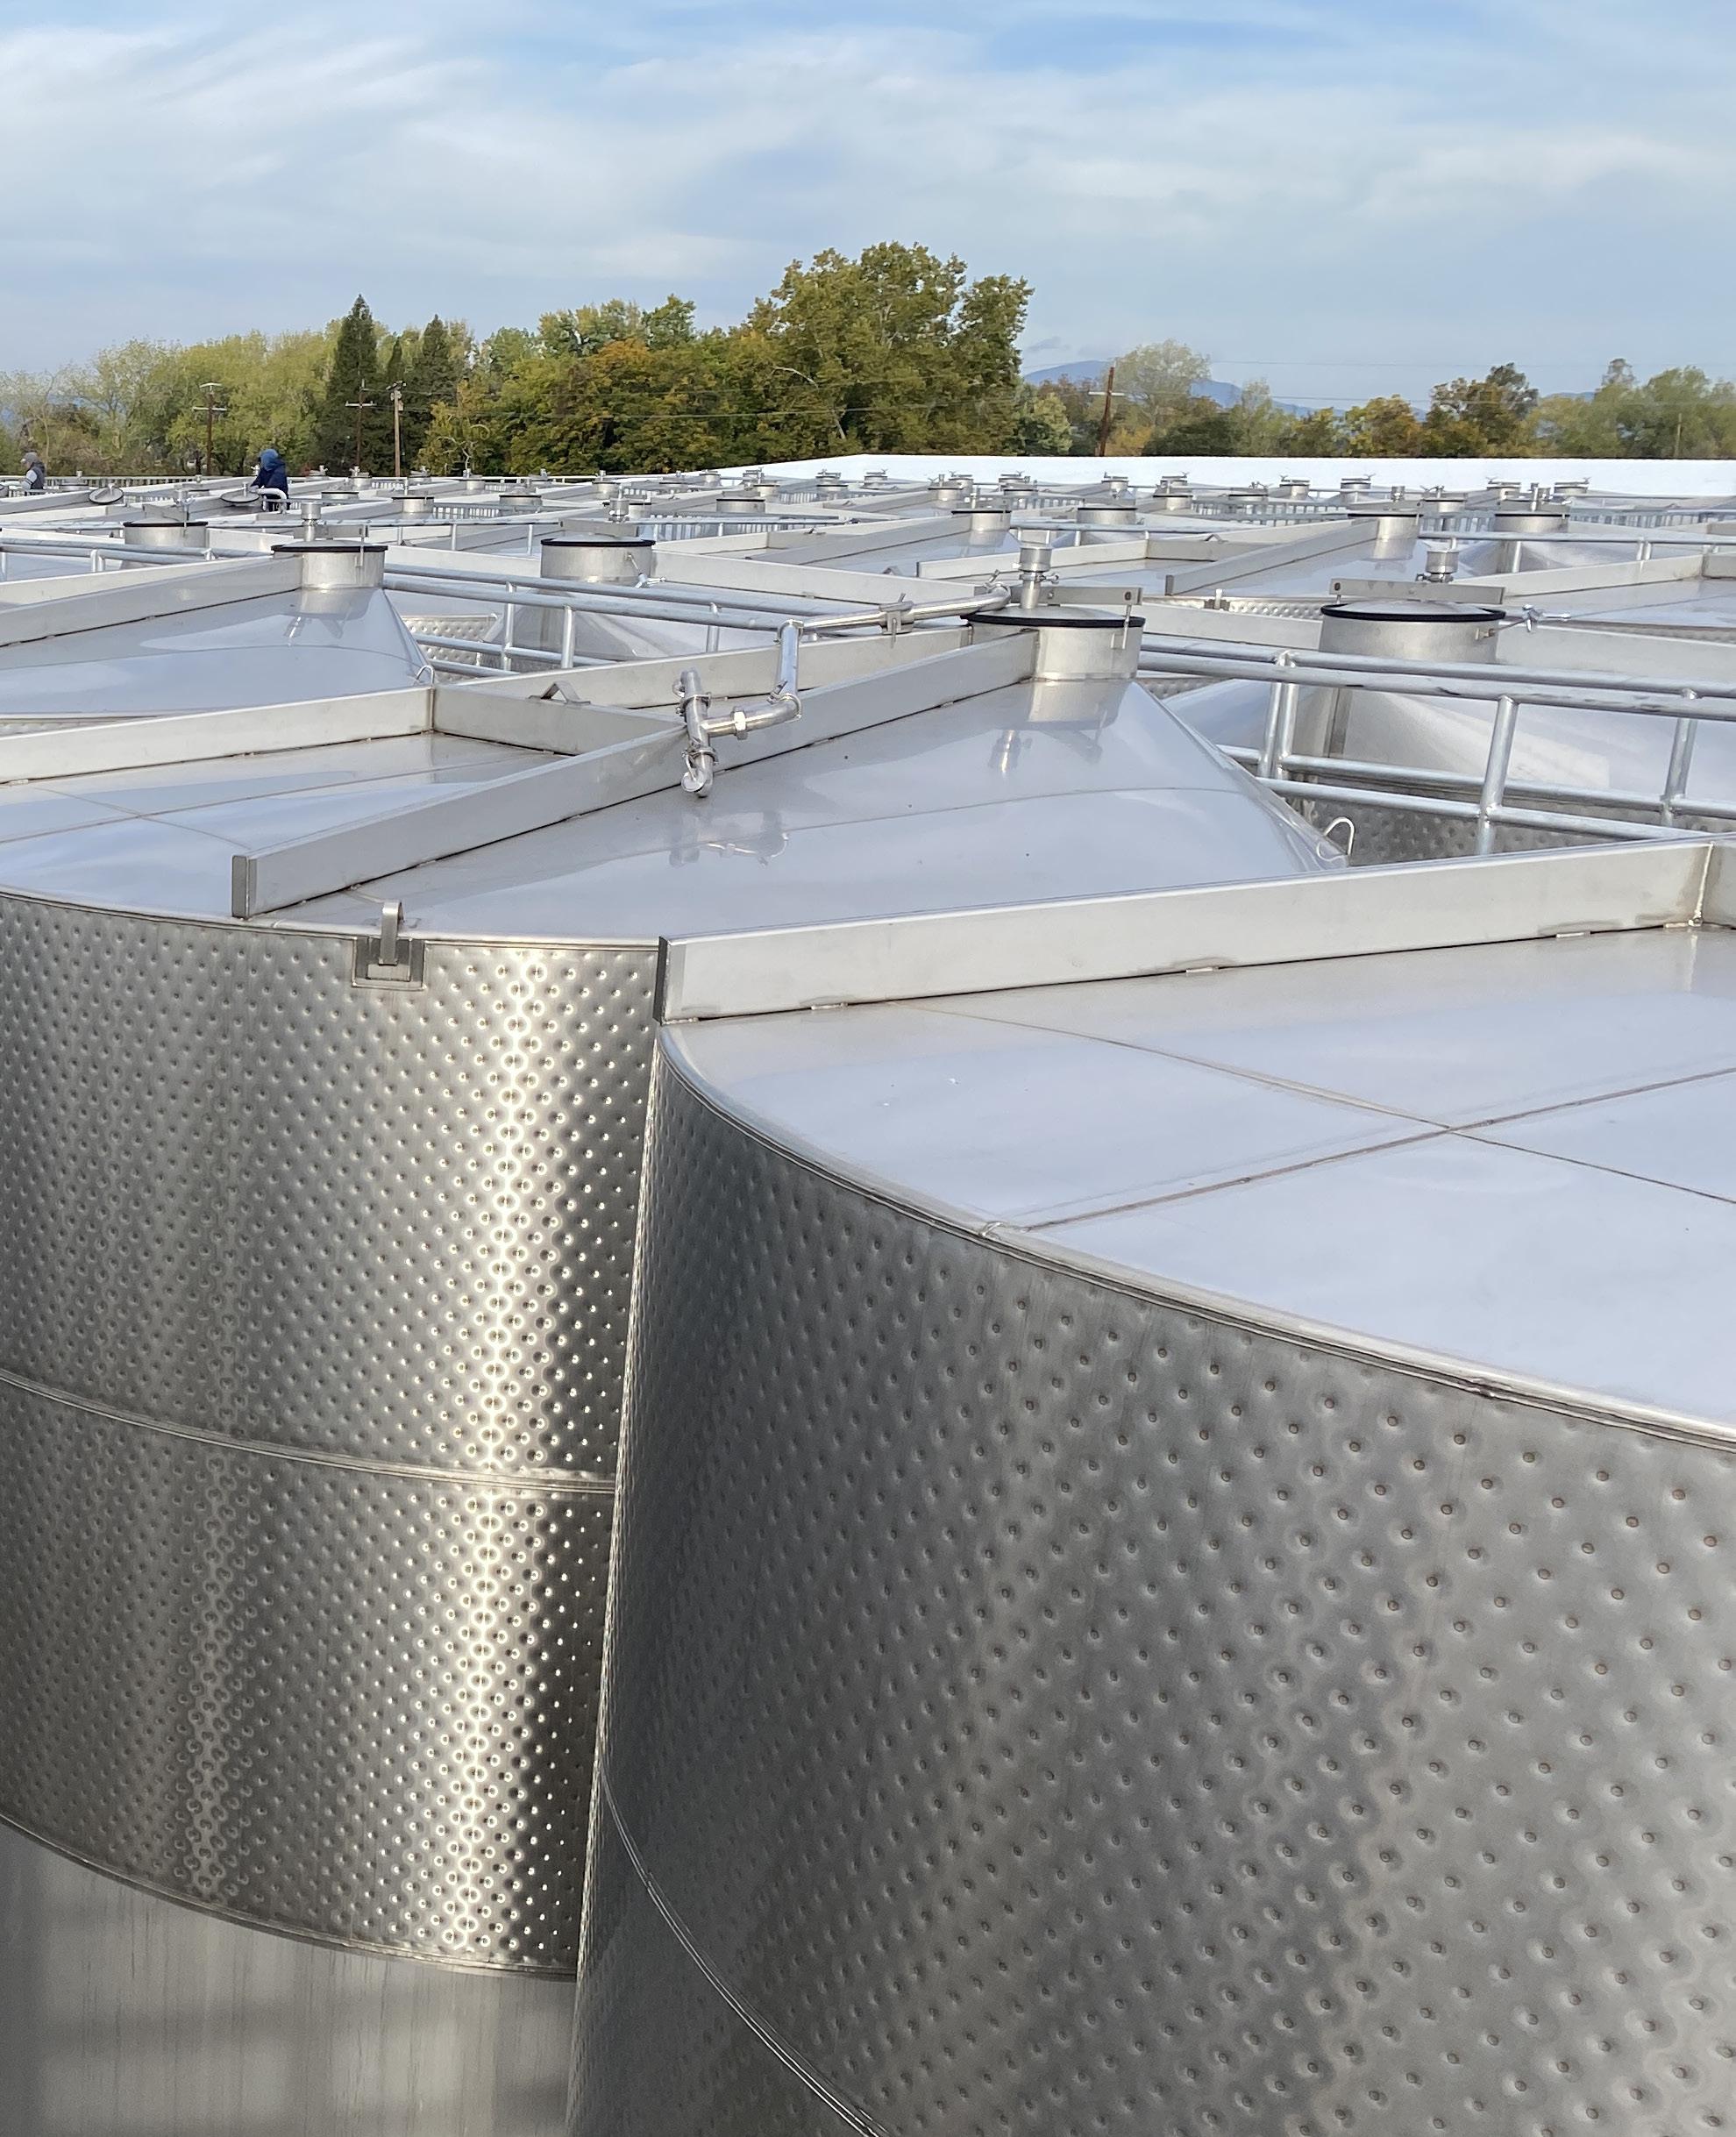
2209 River Rd. Louisville, KY 40206
Phone: 877.548.2622 FinanceInfo@cgb.com www.cgb-agfi.com
Issue No. 7
Trust Our Roots, to Grow Yours.
Seed, Feed and Field is a publication produced by CGB Agri Financial Services, Inc., (“AgriFinancial”). The information and opinions contained herein have been compiled or derived from sources believed to be reliable, but no representation or warranty, express or implied, by AgriFinancial is made as to the accuracy, completeness, timeliness, or correctness of the information, opinions, or the sources from which they were derived. This publication is provided on and with the condition that neither AgriFinancial nor anyone else is, by virtue of this publication or its contents, engaged in rendering investment, legal, accounting, tax, or other professional advice or services. This publication may include “forward-looking statements,” which include projections, forecasts, or expectations of future performance or results, as well as statements or expressions of opinion. No reliance should be placed on any forward-looking statements expressed in this publication. The content of this publication is for general information purposes only and is not to be relied upon or used for any particular purpose. AgriFinancial specifically disclaims any liability for any errors, inaccuracies, or omissions in this publication and for any loss or damage, however arising, that may result from the use of or reliance by any person upon any information or opinions contained herein. Such information and opinions are subject to change at any time without notice, and nothing contained in this publication is intended (nor shall it be construed) as an offer or solicitation with respect to the purchase or sale of any goods, services or securities, including, without limitation, the same by or of AgriFinancial. Seed, Feed and Field features publications, articles and/or reports from others unaffiliated with AgriFinancial, and the views and opinions expressed in these articles or reports do not necessarily reflect those of AgriFinancial. This document may not be reproduced, distributed, or published, in whole or in part, for any purposes, without the prior written consent of AgriFinancial. All copyrights are reserved.