

Evaluating OnFarm Storage: Return on the Investment Pg. 6 Pg. 10 Maximizing Offseason Farm Shop Time SEED, FEED AND FIELD Supporting American Agricultural Producers Edition Nine | Summer 2023
As many states ramp up preparations for harvest, with many southern states already in full swing, focus shifts toward commodity market conditions and assessing the best time to sell. Many times, this includes conversations evaluating on-farm storage needs.
“Once harvest season winds down, the offseason is a great time to tackle important work to prepare your farm shop for next season,” says Dan Nyberg, Sales Trainer for Morton Buildings.
10
Agricultural exports surged to a new record last year, boosted by developments abroad that lifted demand for U.S. annual crops. The long-term outlook for annual crop exports remains positive, but large harvests in South America could cause a pullback in exports in 2023. 16
As the most populated country in the world, India represents an increasingly attractive market for U.S. agricultural producers. Overcoming trade restrictions and different consumer preferences remain key hurdles to further growing the trade relationship.
Strong farm incomes help lift farmland values again in 2023. However, a higher interest rate environment, tightening profitability, and slower cash rents represent headwinds to further appreciation.
Sporadic summer rains across the Midwest prevented a repeat of 2012, but crop yields still may be impacted if precipitation remains scarce. Meanwhile, warm ocean temperatures raise the stakes for Southeastern states as hurricane season approaches.
Seed, Feed and Field is a publication from AgriFinancial, dedicated to supporting American agricultural producers. This quarterly resource features information on wide-ranging agricultural products raised throughout the U.S. Inside, you’ll find everything from financial tips and market data, to Farm Fresh Recipes and Farmer Features.
26
You will also find, as an insert and central element, The Feed by Farmer Mac, which is re-printed and included with Farmer Mac's permission as pages 14 through 55.
To subscribe to Seed, Feed and Field, or to access a digital download of this publication: www.cgb-agfi.com/seed-feed-field/
Rising production and newly bearing trees continue to pressure U.S. almond prices. A sharp rebound in prices remains elusive, but a pullback in new plantings and India’s recent removal of retaliatory tariffs should provide some support.
Strong exports and limited expansion in the dairy sector helped keep inventories in check over the last two years, resulting in relatively high profitability. Dairy prices have since cooled, but modest inventories and limited expansion in the sector may support prices.
For media inquiries: AgFiMarketing@cgb.com
To learn more about AgriFinancial: www.cgb-agfi.com Toll-free 877-548-2622
Amidst the broad success of U.S. agricultural exports, surging imports of fresh fruits and vegetables have helped tilt the U.S. from a net agricultural exporter to a net importer. The growth has led to both challenges and opportunities for U.S. produce farmers. 40
Export growth has allowed producers to expand their operations faster than domestic consumption alone would have justified. The path higher has not always been linear, but further increases in exports are likely as global incomes continue to rise.
A refreshing twist on peaches with a protein packed, full-of-flavor salad, perfect for the end of Summer.
After intense heat waves swept much of the country, Democratic lawmakers have introduced bills to direct the Occupational Safety and Health Administration to create an interim national heatsafety standard.

59
The bill’s impending passage always seems to bring with it a slight sense of anxiety from the agricultural community, anticipating possible significant changes to regulation, operation, and protection.
63
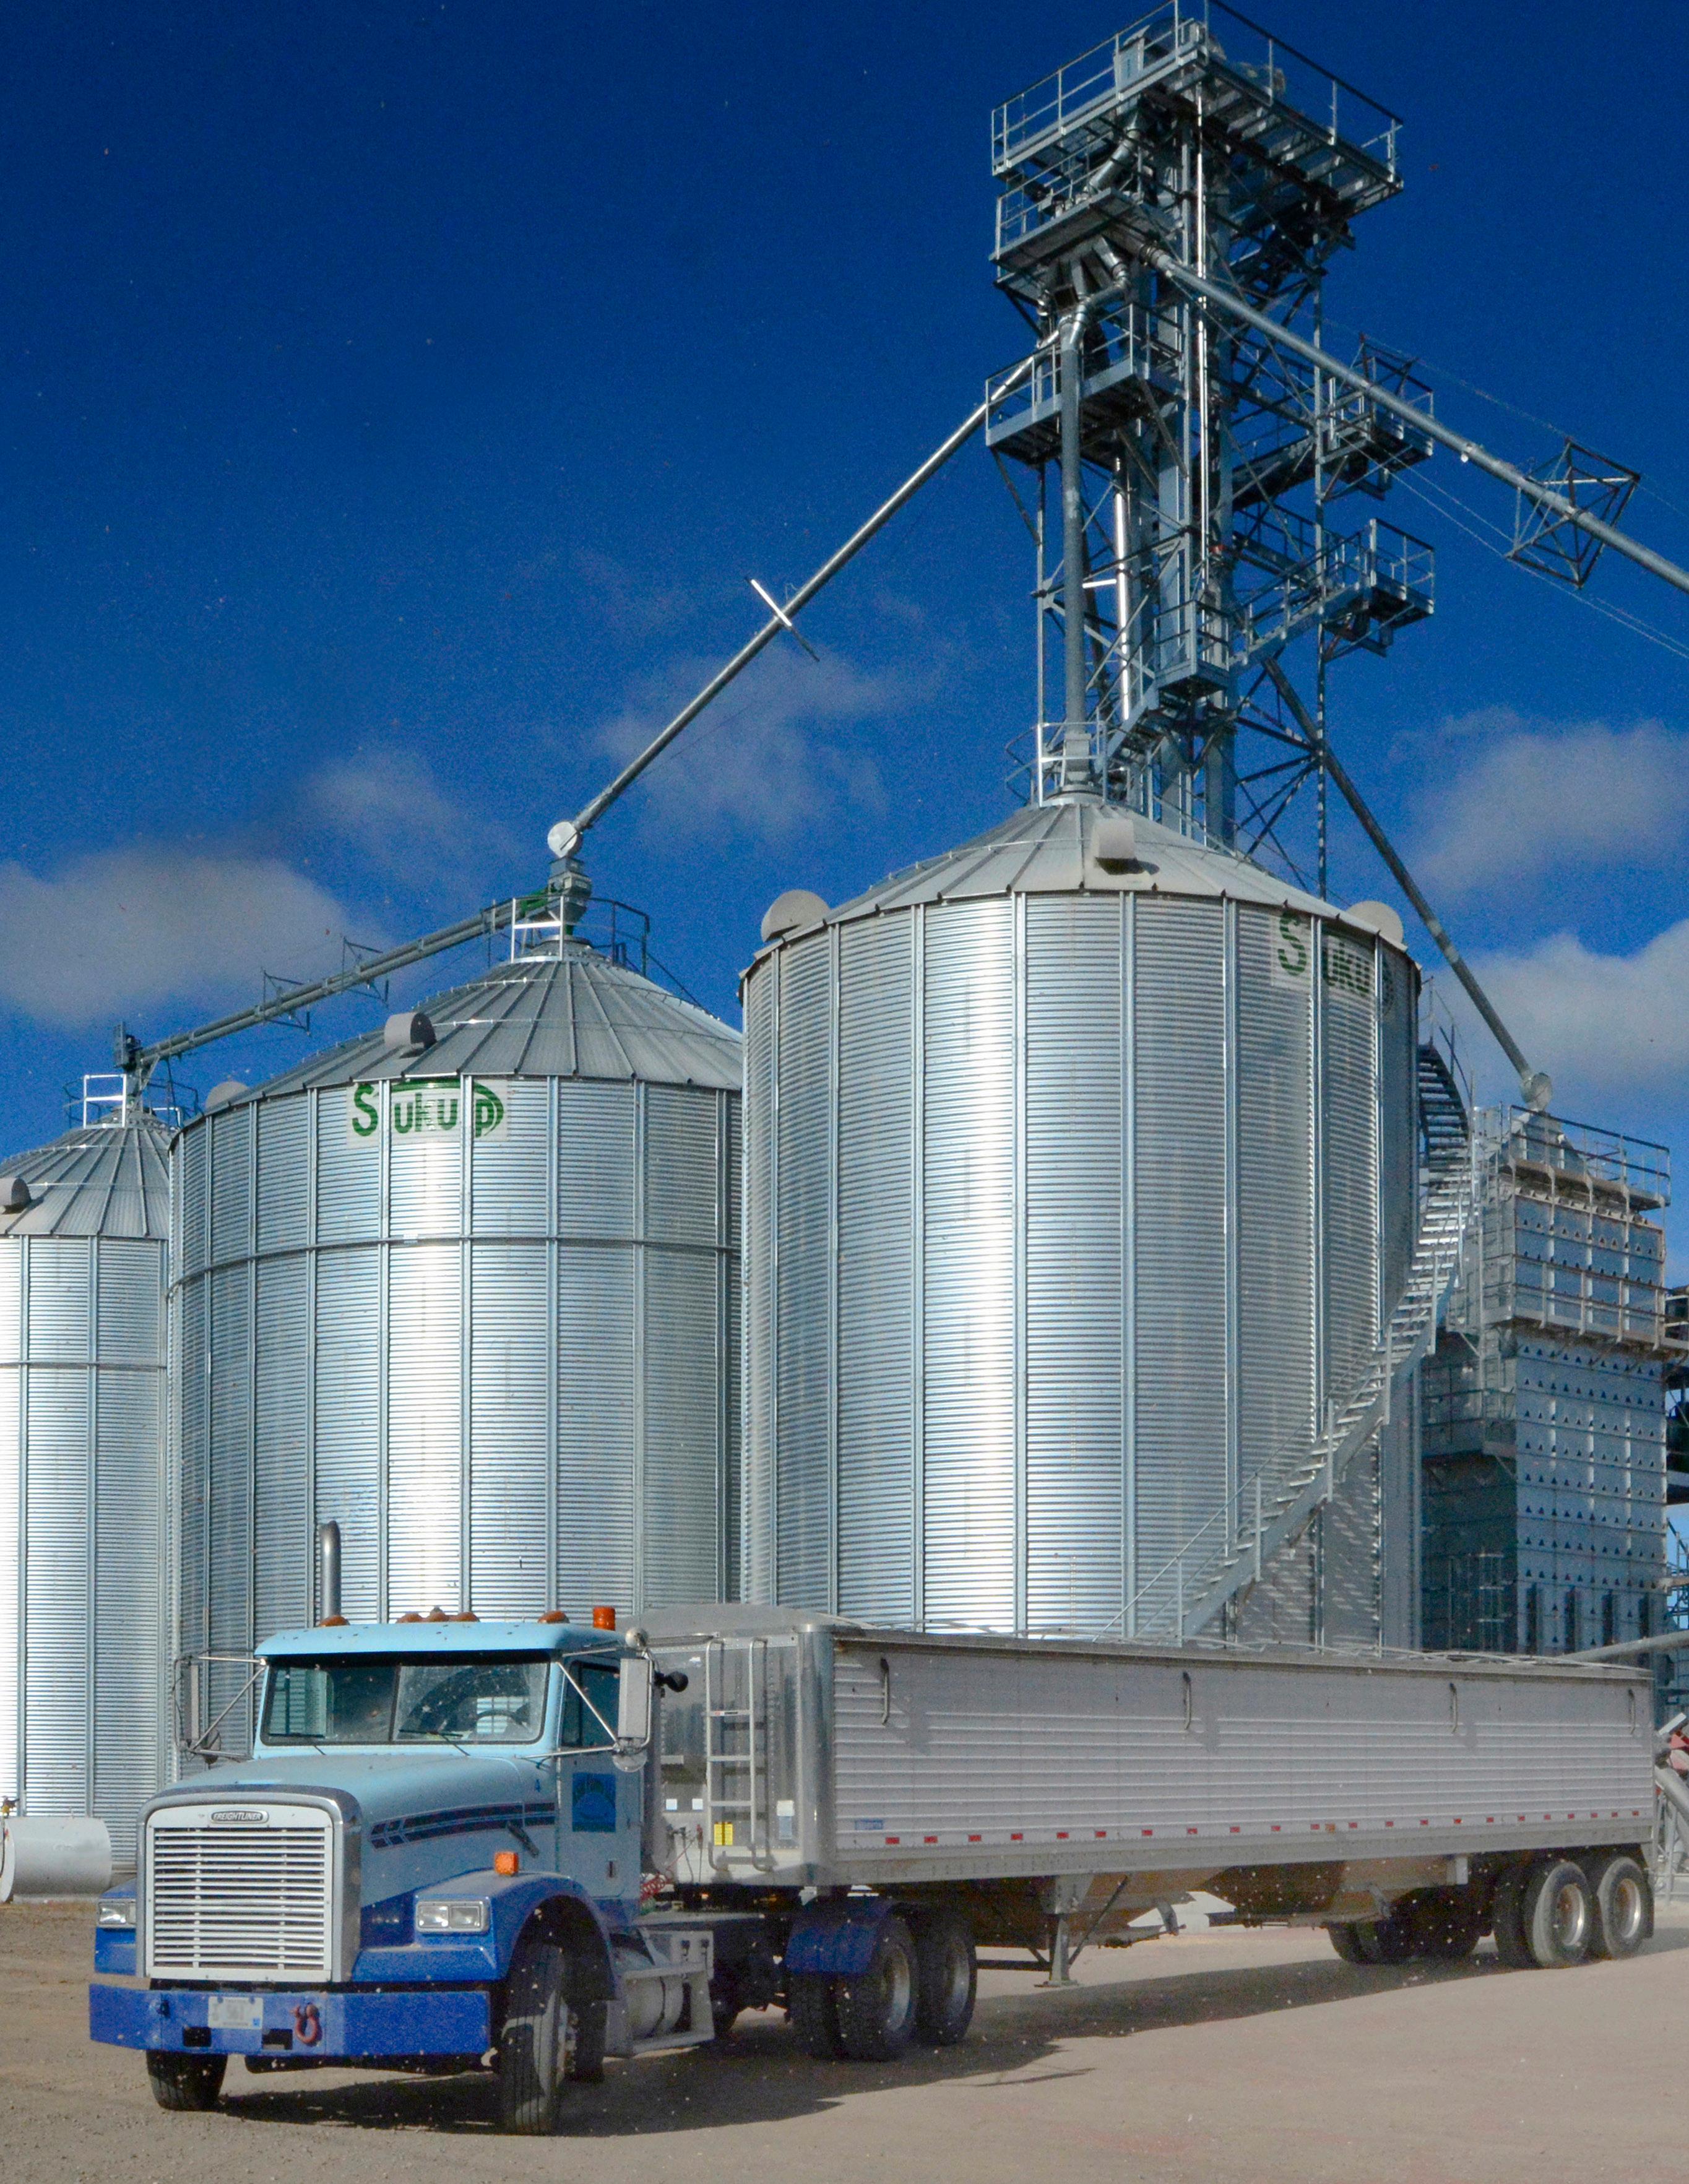
As many states ramp up preparations for harvest, with many southern states already in full swing, focus shifts toward commodity market conditions and assessing the best time to sell. Many times, this includes conversations evaluating onfarm storage needs.

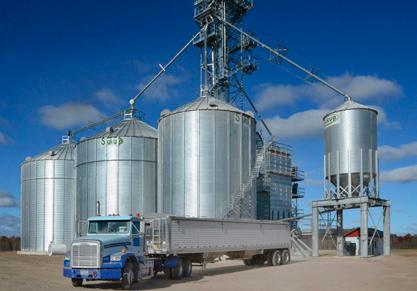
On-farm storage can help provide flexibility, convenience, and control while increasing profitability. While there are many variables that affect decisions regarding on-farm storage projects, the greatest, one could argue, is cost. But the cost of the overall construction and maintenance isn’t the only $$ that should be taken into consideration. Elevator/Co-Op charges and storing terms, hauling time and expenses, and the estimated price per bushel at harvest all factor into assessing whether adding or expanding grain storage is the right move for your operation.
AgriFinancial Kansas-based Sales Officer, Bre Beals, says that many of the conversations she’s having with local farmers surround when they’ll start making that investment back. “We’ll use an ROI (return-oninvestment) calculator to help determine how long it will take you to make your initial investment back. We can take the cost of the bin, what crops you’re going to be putting in the bin, if it’s a two-crop rotation or just a one-crop, and we’ll come up with a good estimate for you as far as how many years it will take to make your investment back.”
Beals, who has become known as ‘The Grain Girl’ in her area, has been running these calculations for the last several weeks for customers and says that while local farmers have found the information essential to their decision, they also want to know how their financing options break down.
“We can do a loan or lease, whatever fits your farm best, and we can finance 100% of the project,” Bre stated. She emphasized that it wasn’t just 100% financing, with no money down until construction is complete, but also 100% of the project. She continues, “You can add anything you need to make your project turn-key operational; augers, concrete, conveyors, pits, dryers, electrical, automation systems, anything to make it work for you.”
She also noted that she runs calculations for her customers that compare a loan versus a lease, versus paying cash. Beals says she works with producers to help them see the whole picture and how the numbers break down in each scenario to give them as much information as possible. She adds that no conversation is complete without mentioning taxes. While emphasizing that she’s not a tax specialist, she noted, “The lease is a true tax lease which allows you to write off the full amount of the payment, whereas on a loan, you’re only writing off the interest paid. This gives you a much larger deduction and speeds up the depreciation, making your money back much faster.”
She finished the interview by adding, “I’m not here to sell a bin. I’m also not here to just talk rate. I’m here to help the farmer make the best decision for their operation regardless of whether I’m included, or not.”


To connect with Bre, call her at 620-708-8721 or email Breanna.Beals@cgb.com.

Boston, MA (July 11, 2023) — Indigo Ag, the innovative leader and trusted partner in sustainable agriculture, announced a program with Consolidated Grain and Barge Co., a subsidiary of CGB Enterprises, Inc. and a leader in the grain and transportation industries, designed to quantify the environmental benefits of sustainably grown crops sourced by CGB.
Through its Market+ Source sustainable crop program, Indigo Ag will use its proprietary measurement, reporting, and verification (MRV) capabilities to help CGB quantify the emissions factor for the grain they purchase from farmers using more sustainable farming practices. These grains would be purchased at a premium and ultimately sold to CGB customers looking to decarbonize their value chains, including food and beverage companies, ingredient companies and regenerative and sustainable fuel producers.

Indigo’s proprietary MRV capabilities use the highest scientific standards to quantify environmental benefits for companies participating in the Market+ Source program.
“As corporations look to achieve their Scope 3 emissions targets, the ability to quantify the environmental impact of sustainable practices with a high degree of certainty is critically important,” said Ron Hovsepian, president and CEO of Indigo Ag. “We are excited to work with companies like CGB who are demonstrating leadership in the industry by committing to help farmers make more money through the adoption of sustainable practices while reducing emissions in the ag value chain.”
“At CGB we are driven to connect value-added solutions to our upstream farmer producers, while simultaneously meeting the evolving needs and quality characteristics of our downstream consumer,” said Eric Slater, President and CEO of CGB Enterprises, Inc. “Through our work with Indigo, we are excited to expand upon and connect value-added production practices at the farm level that would promote sustainability within the grain, feed, and food supply chains.”
More information on the Market+ Source program can be found on Indigo’s website.


The first step, he said, is getting the shop ready for winter weather. Nyberg’s recommendations include:
• Check the weather seals on your walk doors — see that the windows close and seal well.
• Consider adding to your attic insulation if it’s not up to acceptable levels.
• Give your heating system a checkup or call and have it serviced.
• On overhead doors, oil the rollers and torsion springs and double-check the weather seal around those doors.
• Check door rollers and latches on your sliding doors — you may benefit from oiling those rollers.
“The start of the offseason should also be used to take care of equipment maintenance needs, so machinery will be field-ready for spring,” Nyberg says.

“Begin by organizing your equipment so you can easily get to those pieces that you have scheduled for maintenance or upgrades.”
He suggests these additional steps:
• Clean all equipment prior to maintenance work. Start with a leaf blower or compressed air, and then use a pressure washer for caked on dirt and grease.
• Prioritize equipment maintenance by determining
“Once harvest season winds down, the offseason is a great time to tackle important work to prepare your farm shop for next season,” says Dan Nyberg, Sales Trainer for Morton Buildings.
which projects and specific equipment need work. Ensure that critical needs will be addressed first.
• Determine what parts will be needed. Finding parts for some older equipment could require some research and possibly additional shipping time, as many parts are taking longer to arrive.
• Shuffle your equipment after finishing harvest or repairs so your tillage tools are easy to get out next spring.
• Lubricate your equipment, coat any polished surfaces with rust inhibitor, check hydraulic hoses and replace those that are cracked and likely to fail.
Nyberg adds that having a well-organized shop environment will promote improved efficiency. He encourages these checks:
• Make sure your lighting is functional and sufficient.


• Clean and organize your workbench and tools.
• Inspect support equipment, such as compressors, welders and drill presses.

• Take inventory of your waste oil storage.
“Finally, be sure your shop is stocked with proper safety equipment to protect yourself, employees and the shop itself,” Nyberg says. This should include a fire extinguisher, safety glasses, face shield, hearing protection, first aid kit, exhaust fan and deicer.
For additional farm shop information, visit MortonBuildings.com.


Undoubtedly, international trade makes the world go round. Not only do strong trade relationships reduce costs, improve access to goods and services, and increase marketing opportunities, global economic interdependence can smooth political tensions and extend periods of peacetime. The World Bank estimates that international trade topped $32 trillion in merchandise and services in 2022, equivalent to the combined U.S., Japanese, and German economies. The recent COVID-19 pandemic and ongoing Russian-Ukraine war highlight global trading relationships’ critical role in keeping economies humming and people fed.
U.S. agriculture and rural economies have benefited tremendously from resilient trading relationships in the last 75 years. American farmers are exceptional suppliers of food and food products, using technology and ingenuity to decrease costs and increase supplies of nearly all agricultural products, from apples to zucchinis. Trade allows U.S. farmers, ranchers, and food producers to expand their markets, bringing new sources of demand and providing the safe, dependable, and affordable food products the world has come to depend on from our producers. The USDA forecasts that the U.S. farm, food, and fiber sectors will generate over $181 billion in export value, over one-third of total farm cash receipts for 2023.
Expansions of agricultural trade kicked off all three major expansions in the U.S. agricultural economy. In 1973, grain trade with the U.S.S.R. pushed inflation-adjusted agricultural exports by a massive 77%; that same year, inflation-adjusted net cash farm income levels rose by 48%, kicking off the 1970s agricultural super-cycle. From 2007 to 2012, U.S. agricultural exports jumped by 45%, driven by elevated grain prices and increasing trade with China; at the same time, inflation-adjusted net cash farm income increased by 62%, marking the second
major ag economy expansion in the last 50 years. Finally, U.S. ag trade expanded by 23% between 2019 and 2022, driven by global shortages and postpandemic global economic growth; at the same time, the inflation-adjusted net cash farm income increased by 57%. Clear and growing trading lines have a tight correlation with prosperity on the farm.
Participants in the U.S. agricultural sectors would be wise to monitor the health and trends in ag trade because while global trade can giveth, it can also taketh away. The collapse of the farm economy in the 1980s coincided with a dramatic pullback in corn and soybean trade with several European countries. The 2013-14 agricultural super-cycle unwinding coincided with a trade dispute between the U.S. and China from 2017 to 2019. The 2022 expansion cycle is also starting to cool, and it is no coincidence that through June 2023, U.S. ag exports are down 11% compared to the first half of 2022. Trade with Asian countries is down nearly 20% annually, and the strong U.S. dollar and decline in exports to China have turned the U.S. into a net food importer in 2022/2023 for only the second time in the last 55 years.
The selection of articles for our summer issue orbit the importance of global trade and bring to the forefront some challenges and opportunities for our dynamic food sector. We hope you enjoy reading them as much as we enjoyed writing them and that they provide you and yours stimulating conversations as we turn to the bountiful harvest this fall will bring.
Cheers to all,
Jackson Takach, CFA Chief Economist at Farmer MacAgricultural exports surged to a new record last year, boosted by developments abroad that lifted demand for U.S. annual crops. The robust export demand was welcomed by producers who benefitted from a corresponding increase in farm incomes. The long-term outlook for annual crop exports remains positive, but large harvests in South America could cause a pullback in exports in 2023.
The rebound in global inventories has proven a headwind for corn prices this year. After reaching their tightest level in a decade, global corn inventories are projected to jump 6% year over year in 2023, largely attributable to a surge in South America’s production. Specifically, total Brazilian production is projected to increase
by 14% annually as the harvest of the second corn crop nears completion. And while the U.S. continues to produce a far greater amount of corn, Brazil is soon expected to surpass the U.S. as the largest corn-exporting nation. Ample supply is not the only factor boosting demand for Brazilian corn, though. The price differential has also motivated countries to shift corn purchases to Brazil. The ratio between corn prices in the U.S. and Brazil increased rapidly over the past year, partially due to a strong U.S. dollar.
 1, 2, 3, 4, 5

Corn Price Ratio: Illinois-to-Brazil

Source: CME, Bloomberg
Increased export competition has not been the only headwind for U.S. corn prices this summer. Planted corn acreage also spiked in the U.S. this year and is expected to boost production significantly relative to last year. According to USDA projections released in June, U.S. corn acreage reached 94.1 million acres this year, the third highest level since 1944. The corn futures market did not expect such a large increase in planted acreage, which put immediate downward pressure on prices. However, greater planted acres relative to the March projection
reflect favorable spring weather and relatively high prices during planting compared to soybeans.
Despite the expected large corn crops in Brazil and the U.S., drought remains a significant price wildcard. Drought conditions across the central U.S. growing regions were the most severe since 2012 through mid-August. The drought a decade ago led to a sharp decline in production and fueled a surge in commodity prices and farm incomes for the following two years.
Source: USDA FAS PSD DataHowever, as of summer 2023, a complete repeat of 2012 is not expected. Adequate soil moisture leading into the growing season and sporadic summer rainfall provided a solid foundation to start the year. Plant genetics, including drought tolerance, have also greatly improved over the last decade. However, 15% of the U.S. corn crop was rated poor to very poor through mid-July. Since 2000, this proportion is second only to 2012, when 30% of the crop was rated this poorly. At a minimum, the possibility that drought could severely impact crop yields helped boost prices this summer and allowed farmers to hedge their crops at favorable margins.
record levels. More recently, though, export volumes to China have cooled. Through May, marketing year shipments of cotton and sorghum to China were 32% and 76% lower annually, respectively. Reduced production partially explains the drop. Cotton and sorghum producers faced severe drought conditions last year, weighing on yields and total output. Still, forward sales for cotton and sorghum to be harvested this year have been tepid, and prices have responded.
A pullback in export demand has also dented prices for other annual crops, such as cotton and sorghum. Most cotton and sorghum production is exported for clothes production and as feedstock, respectively. Both crops benefitted significantly from robust Chinese export demand in 2020 and 2021 that lifted prices to near or above previous

Despite the slowdown in China’s demand for some U.S. annual crops, soybean shipments remain robust. Soybean exports to China increased 12% through May and were exceptionally large this spring. Much of the strength in soybean demand has been attributable to the recovery in China’s domestic swine herd. China’s domestic pork production increased by 16% in 2022, boosting the demand for feed. The USDA projects that China will hold soybean imports relatively stable in 2023. This could reduce demand for U.S. exports if China sources soybeans from competing exporters such as Brazil. Still, the robust pace of U.S. exports this spring and reduced planted acreage could support prices into the fall.
Source: USDA Foreign Agricultural ServiceAcknowledging the short-term fluctuations in export demand and the resulting impact on prices, the long-term outlook for U.S. annual crop growers is positive. Exports of raw commodities such as wheat and corn have fluctuated, especially as they have faced increased competition from foreign producers. However, the total volume of annual crops exported has increased significantly over time after accounting for value-add products. Livestock, for example, consume a significant proportion of the annual crops grown in the U.S. annually. Exports of livestock products have nearly doubled over the past two decades, indirectly contributing to greater export demand for U.S. annual crops. Similarly, exports of processed annual crops,
including ethanol, soymeal, and distillers’ grains, have all risen substantially. In total, annual crop exports have increased significantly more than raw export volumes suggest.
Robust annual crop exports lifted commodity prices and farm incomes to historic levels in 2022. Some tailwinds have shifted to headwinds as export demand slows and competition in global markets increases. Still, the long-term outlook remains positive as rising global incomes and greater demand for protein lead to higher direct and indirect demand for U.S. annual crops. In the meantime, U.S. crop farmers are projected to realize substantial farm incomes again in 2023, albeit marginally lower than last year.

6, 7, 8, 9, 10
India has a growing population and economy, offering an increasingly attractive market for U.S. agricultural producers. The agricultural industry in India is the second largest in the world, and while it imports some food and agricultural products, it is not a top10 trading partner with the U.S. The high proportion of vegetarians limits immediate trade growth opportunities in the animal protein value chain, but long-term prospects for U.S. exports to India might improve if U.S. producers target Indian consumer preferences and economic conditions in the country continue to improve.
Simply put, India’s population and its economy are growing. According to data from the World Bank, India’s population topped 1.4 billion to end 2022, surpassing China for the first time to become the most populous country in the world. India’s Gross Domestic Product (GDP), a measure of a country’s total economic output, grew at a pace of 7% in 2022, capping a decade of more than 6% growth per year. While the Indian economy is approximately one-eighth the size of the U.S. economy, its economic growth has outpaced both the U.S. and China in recent years as it has become
the fifth-largest economy in the world. India’s GDP per capita, a relative measure of national income and wealth, remains low compared to developed economies, but that, too, is increasing. Indian GDP per capita has had positive growth every year since 1991, with the exception of 2020 due to the COVID-19 pandemic.
Researchers, policymakers, and food producers view strong growth in India as an opportunity to expand agricultural trade with the country. However, India presents a complex tapestry of cultural and economic conditions that muddy
the waters of market potential. In this article, we contextualize the Indian agricultural landscape, break down the composition of agricultural trade in India, and highlight some of the headwinds and tailwinds that could influence the future of U.S. ag trade with India.
A growing population and economy also have a growing appetite and, accordingly, agriculture is a major industry in India. According to data from the World Bank and the United Nations, agriculture, forestry, and fishing added $562 billion to the Indian economy in 2022, making it the second-largest agricultural producer behind China and more than two times the size of the U.S. ag sector. Agriculture represents roughly 17% of India’s GDP, significantly higher than China’s 7% or the U.S.’s 1%. Rice is the top product grown in India, with over $84 billion in annual production value. However, India’s dairy industry is also massive, with more than $90 billion annually in buffalo and cow’s milk production. That is more than double the size of the U.S. dairy industry output. India’s wheat production is also sizable at roughly four times the size of U.S. annual production. According to data from the United Nations, India ranks number one in the world
in agricultural value for 21 different crops and ag products, most notably bananas, chickpeas, milk, mangos, and papayas. India has a growing population, and policymakers intend to maintain a high level of food self-sufficiency through agricultural industry support and restrictions on agricultural imports.

Food production in India is robust, but the country does import a limited amount of food and agricultural products from around the world. Since 2020, India has averaged more than $40 billion in agricultural imports per year. In 2022, the U.S. exported more than $2.2 billion in agricultural products to India. Approximately half of the value of food and agricultural imports into India are in the form of vegetable oils (palm, soybean, and sunflower oil represented a combined 53% of average imports in 2020 and 2021). India buys a small amount of soybean oil from the U.S., but its primary import from U.S. farms is almonds. In 2022, the U.S. exported nearly $900 million in almonds to India, up 14% from 2021 and more than triple the value sold ten years earlier in 2012. While imports are an important part of India’s food diversity, growth in overall agricultural trade activity
Source: United Nations FAOSTAT Database; Author’s Calculations
India Agricultural Snapshotbetween the U.S. and India has been relatively small over the last 20 years. Between 2002 and 2022, the U.S. increased the value of agricultural exports by a massive $140 billion, only 1% of which came from growth in trade with India. For comparison, agricultural trade with China generated an increase of $36 billion in value, representing nearly 26% of the increase over that period. India has maintained a policy goal of food production self-sufficiency for approximately 50 years. According to data compiled
by The Economist, India maintains the fifth highest agricultural import tariff percentage in the world at 34% in 2022 (compared to a global average of 15%, 14% in China, and 5% in the U.S.) as a means of protectionism. Indeed, India has been challenged multiple times by the World Trade Organization in the last decade for violating agricultural subsidy and tariff rule limits.

 India’s Top Imported Food and Agriculture Products
Source: USDA FAS GATS Data 2020-2022
Source: United Nations FAOSTAT Data 2020-21
India’s Top Imported Food and Agriculture Products
Source: USDA FAS GATS Data 2020-2022
Source: United Nations FAOSTAT Data 2020-21
On the surface, India appears like a phenomenal growth opportunity for U.S. agricultural producers. Historically, higher incomes can lead to increases in protein consumption as well as higher-value food products like packaged goods, fresh fruits, and an increased variety of vegetables during all seasons. China is often cited as an example of this dietary evolution because income per capita increased by 300% between 2002 to 2022. U.S. farmers benefitted greatly from this. From 2002 to 2022, over 75% of the growth in U.S. ag exports to China was in the form of either livestock products and proteins or bulk commodities like soybeans and corn used to produce feed for the growing protein industries in China.

Digging a little deeper, there are some potential limitations to replicating the success of U.S. ag exports to China with India. One important difference between the countries is their cultural stance towards
meat. According to a 2021 Pew Research Center study, 81% of Indian adults limit meat consumption in some fashion, and 39% describe themselves as vegetarian. In many ways, the societal attitude towards meat consumption reflects religions practiced in India that have dietary laws or restrictions. According to the 2011 Census of India, nearly 80% of Indians practice Hinduism, in which cows are traditionally viewed as sacred animals.
Even if India reduced trade barriers towards meat imports, the strong relationship between food and religion in India makes comparisons to other countries’ income and protein consumption inappropriate. Examining global income and consumption data from the last two decades shows a $1,000 increase in per capita income generated a onekilogram per capita increase in meat consumption. However, in India, real incomes increased by 126% from 2002 to 2020, while per capita meat consumption only increased by 13%. For comparison, China’s income increased by 300% during that period

Source: FAOSTAT Database
while its meat consumption increased by 37%. This suggests U.S. protein producers should not expect a surge in export demand from India, even if trade barriers are reduced.
India also has economic and policy conditions that could limit trade opportunities with U.S. ag producers. Although overall economic activity is increasing, per capita incomes lag other developing countries like Brazil, Russia, China, and South Africa (fellow BRICS members), as well as regional groups like East Asia and the Pacific. The growing income inequality in India has resulted in more than 60% of the population living below the poverty line. The Economist ranked India 68th in the world in food security in 2022, roughly unchanged from their ranking in 2012. The relatively high level of agricultural import tariffs presents another barrier to U.S. markets, increasing the price of U.S. food and agricultural products relative to local producers.
While cultural and economic conditions make short-term inroads to India a challenge, there are many tailwinds for longer-term agricultural trade prospects. Agricultural production in India is already incredibly resource-intensive, making the next bushel of grain or gallon of milk that much
harder to produce. India may have to look to foreign markets to keep the affordability of food products manageable for their growing population. Policies around self-sufficiency are unlikely to change overnight, but as India’s economy grows, so too can ag imports in relation to GDP. Trade tensions with India have thawed in recent months, and India has eliminated some of their retaliatory tariffs against U.S. produce (see related article on the “Two Sides of the Fruit and Vegetable Coin”). Further progress on reducing import barriers will no doubt remain a priority as the U.S. agricultural sector looks to diversify export markets.
It may be unrealistic to expect a shift in consumer preferences toward animal proteins in India, but U.S. producers can still grow and market the products that sell well in India. Vegetable oils, tree nuts, dairy products, and other higher-value consumer goods that do not involve animal proteins are all exported to India today, albeit in modest quantities relative to the size of the population.
If the U.S. can slightly modify its ag exporting playbook, India shows tremendous promise as a growth market for many agricultural products in the years to come.

The USDA reported an average gain of 7.4% in average U.S. farm real estate in 2023, a slowdown from the 12.4% gain in 2022. Two years of low interest rates and record-setting farm income levels supported the increase in 2022. A higher interest rate environment, tightening profitability, and slower cash rents explain the slowing land value appreciation. However, a low supply of marketed land could be the balancing element that supports values into 2024.
The USDA’s National Agricultural Statistics Service (NASS) produces a report on statelevel and national average farm real estate values and cash rents each August. This report builds on an annual research initiative, the June Area Survey, in which more than 9,000 segments of land are statistically sampled, and the results are carefully tabulated to estimate the average value of different types of farmland across
each state. The August 2023 Land Values report showed a 7.4% increase in land values from June 2022 to June 2023, with an average value per acre of $4,080. The annual growth was led by advances in Northern Plains states like Kansas (16.3%), North Dakota (13.3%), and Nebraska (13.1%), but also in core Corn Belt states like Indiana (13.8%), Missouri (8.4%), and Ohio (8.3%). Southern states showed the lowest levels of appreciation in 2023, with recent
droughts and water availability likely contributing factors to values stalling out in those states.
Gains in 2023 follow significant increases in 2022 for predictable reasons. An extended period of low interest rates and strong farm profitability in 2021 and 2022 helped give real assets like farmland a lot of momentum heading into 2023. Farm incomes set records in 2022 and, following extensive government support program payments in 2020 and 2021, many farm operators had renewed working capital levels to fund asset purchases. Beyond well-capitalized farmers, low interest rates combined with elevated inflation in 2021 and 2022 pushed inflation-adjusted interest rates to all-time low negative levels. This fueled investments in real assets like farmland and other real estate. The combination of substantial profits and low interest rates has lagged effects on land values, and researchers from Iowa State University have estimated that it can take a decade or more for the full effects of interest rate policy to be capitalized into farmland values.
Despite this multi-year asset value momentum, elevated interest rates and falling commodity prices are starting to show their teeth in slowing land value appreciations. The 7.4% gain in farmland in 2023 is significantly lower than the 12.4% experienced in 2022. According to data from the Federal Reserve Bank of Kansas City, farm mortgage interest rates on fixed-rate mortgage loans topped 7.6% in mid-2023, the highest level since the end of 2007. Land sales and refinances slowed in the first half of 2023 as many farm operators and investors waited to see the trajectory of capital costs and commodity prices in the back half of the year. These forces created friction, but not a reversal, for land prices in 2023.
NASS also conducts an annual survey on statelevel farmland cash rental rates and releases the results each August in parallel with the farmland values report. Cash rent is often used as a measure of the cash flow the average farm could generate within a county or state, making it similar to a dividend or interest payment on a stock or a bond.
 Source: USDA NASS
Over time, cash rental rates and farmland values show a tremendous correlation, as rental rates’ economic drivers (i.e., high commodity prices) are also economically important to land values, particularly in grain-producing states. In 2023, more states saw higher land value appreciation than cash rent appreciation. These series move differently from year to year, but they are generally mean-reverting: meaning that when values and cash rents get out of line with one another, something adjusts to realign them over time. For the series to revert to mean from 2023, land values would have to hold and rents rise, or rents hold and land values slow down even further.

The combination of higher interest rates, tightening profitability, and slower appreciation to cash rents show there is building pressure on farmland values in 2023. However, land markets show resiliency heading into the back half of the year, and a low supply of marketable land could be the balancing factor that holds or advances land values in the near term.
Source: USDA NASS, Farmland Values, State Cash Rents; Author’s Calculations


15,
A geographic migration of drought conditions from the West Coast to the Western Plains has brought reprieve to some producers and challenges to others. Across the Midwest, sporadic summer rains prevented a repeat of 2012, but crops could experience lower yields if precipitation remains scarce. Meanwhile, warm ocean temperatures raise the stakes for Southeastern states as hurricane season approaches.
El Niño conditions developed in FebruaryMarch 2023 as water temperatures in the equatorial Pacific began to warm and reverse a multi-year La Niña event. The shift was accompanied by a much-needed spike in precipitation for the U.S. Southwest. Over the summer, sea surface temperature warming continued across the Pacific, further strengthening El Niño conditions. Projections show that the current El Niño will reach a moderate to strong magnitude by winter. Previous El Niño conditions have led to above-average precipitation for many Southwest states. Additional rainfall would undoubtedly be welcome in states such as Arizona, which continues to face cutbacks to water allocations from the Colorado River.
Typically, weather conditions are relatively quiet along the West Coast from summer through early fall. This year proved to be the one in one hundred exception. In August, Hurricane Hillary approached and eventually made landfall in Southern California as a tropical storm. This marked the first tropical storm to hit Southern California since 1939 and
many parts of the state received record rainfall in a matter of days. What would have been welcomed by farmers at other points during the year, the rainfall in August actually disrupted both planting and harvesting of several different crops. The damage is still being assessed but the focus is already on future storms to come. An enhanced southern storm track derived from El Niño could begin to develop later this fall and spread precipitation into California. If the magnitude of this El Niño increases significantly, it will likely be a major factor in weather across the United States from mid-fall into the winter.
Across the Midwest, a dip in the jet stream is anticipated to persist into the fall. This dip, or “trough,” was largely responsible for a mild summer generally devoid of extended heat waves in this region. Still, even without heatwaves, a lack of consistent rainfall across the Midwest has led to questions about what crop yields will be realized come harvest. If this trough is maintained in the fall, the result would likely be cooler than normal temperatures and drier than normal precipitation amounts. This trend toward drier-than-normal
conditions would likely amplify drought conditions that already exist in the region.


The summer of 2023 was brutally hot in the desert Southwest and southern Plains states. Over the course of the fall, the El Niño should gradually enhance a southern storm track which will weaken the “heat dome” jet stream ridge and eventually support cooling and wetter weather. This more active southern storm track is also likely to spread an area of greater than normal precipitation across the Southeast.
As California recently found out, hurricanes and other tropical weather systems provide a
significant wild card in terms of the precipitation outlook. Still, hurricanes are generally associated with Southeastern states, which is where Hurricane Idalia was initially projected to make landfall. Water temperatures in the Gulf of Mexico and the southern Atlantic Ocean are significantly warmer than normal this year, which could provide energy to intensify tropical systems. Through mid-July, the daily seawater temperature at several coastal tide stations reached their highest recorded levels, dating back to the 1990s. There is no guarantee that warm Gulf of Mexico waters will result in an active hurricane season, though the budding El Niño and other aspects of the jet stream pattern could provide a bit of a damper to the amount of tropical weather activity that would otherwise be expected given the sea surface temperatures.
County Average Temperature Anomaly Southern Heat Dome Hurricane Watch19, 20, 21, 22
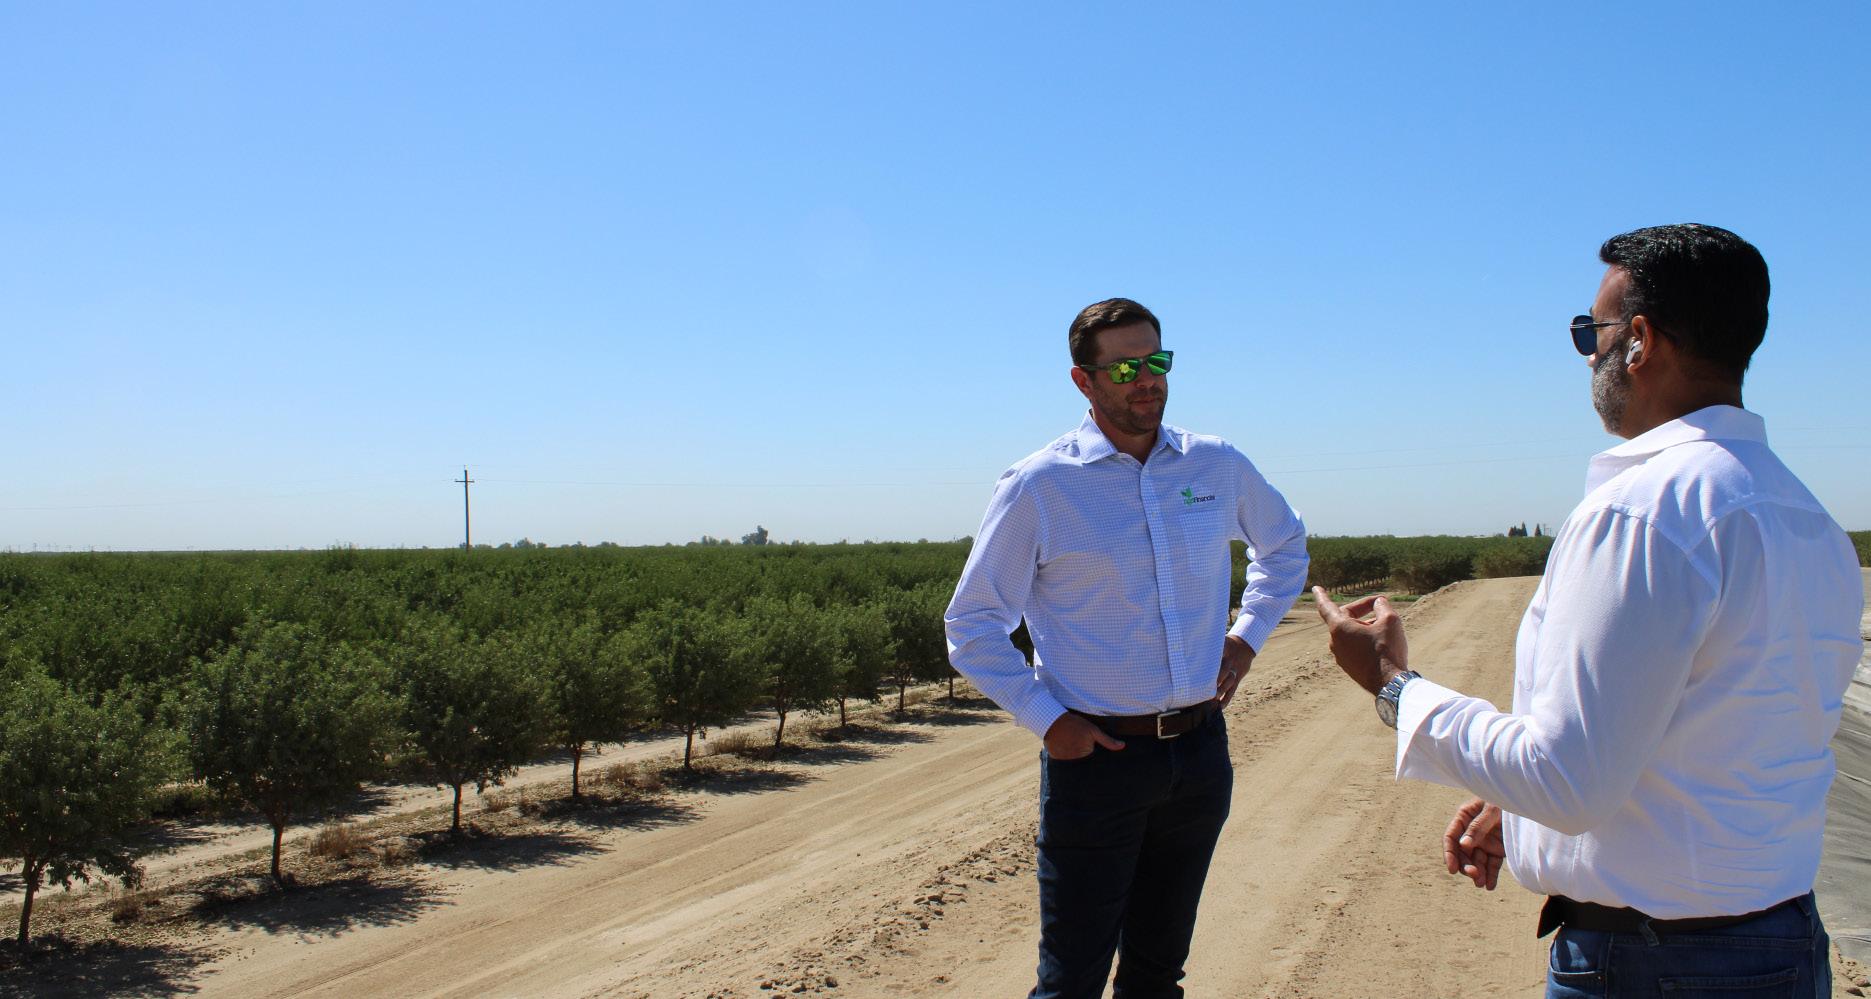
Thousands of newly bearing almond trees over the last decade have boosted U.S. production by hundreds of millions of pounds. Unfortunately, surging production and export challenges have led to a downward price trend. While a sharp rebound in prices remains elusive, the pullback in new plantings and India’s recent removal of retaliatory tariffs should provide some support.
more of these non-bearing acres grew and began to produce almonds, overall production expanded. Ample supplies allowed domestic and foreign buyers to purchase almonds at lower prices.
Almond growers welcomed record precipitation across the West Coast last winter that provided some relief to parched farmland and reservoirs. Unfortunately, a reprieve from one challenge has now highlighted another: an oversupply of almonds. As the epicenter of the global almond industry, the growth in U.S. almond production has been concentrated exclusively in California. From 2010 to 2020, U.S. almond production increased by 90% to over 3 billion pounds, all of which were grown in California.
Higher domestic consumption and greater export demand initially absorbed the increase in supply and fueled a run-up in prices through 2015. However, harvests continued to increase as producers sowed additional acreage to capitalize on the profitable crop. Non-bearing almond acres, a leading indicator of future almond crops, quadrupled between 2010 and 2020. As more and
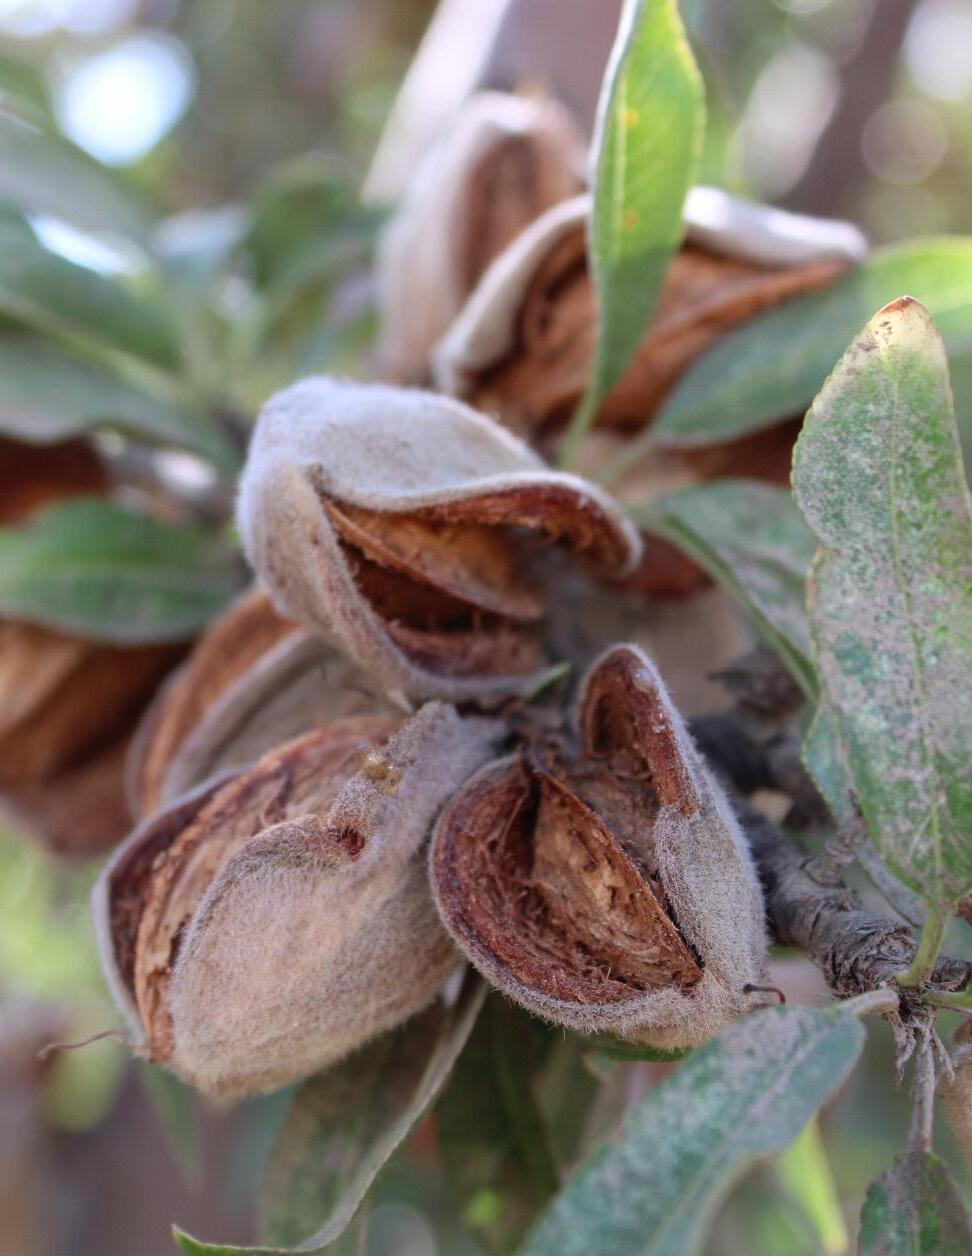
Indeed, the increase in almond production has not been a straight line higher. Despite a steady rise in bearing almond acres, total U.S. almond production has actually declined over the past two years. Almond production peaked above 3 billion pounds in 2020 before dipping in 2021 and again in 2022. These declines were partly due to the multiyear drought that led to water rationing. However, water will not likely be an issue in 2023, given the record snowpack across the U.S. Southwest and California’s 100% water allocation. Instead, storms, rainfall, and other inclement weather during the spring bloom impacted almond pollination this year. As a result, the USDA projects production will increase a modest 1% year-over-year in 2023 to 2.6 billion pounds. Favorable growing conditions this summer could boost the eventual harvest. However, the moderately larger crop may help limit the downward pressure on almond prices this year.
Exports have been integral to absorbing the growth in almond supply over the past decade. Approximately two-thirds of U.S. almond production is shipped abroad annually. Per capita consumption has increased in the U.S. as well, but not nearly at the pace that export volumes have grown. Given the proportion of production sold internationally, exports are closely watched as a bellwether in the industry.
A backlog of agricultural products at West Coast ports in 2021 and 2022 weighed heavily on domestic prices. On top of this, exports to India languished over the past several years due to retaliatory tariffs placed on numerous U.S. agricultural goods, including almonds. Fortunately, the congestion at West Coast ports has largely been resolved thanks in part to efforts from the USDA. In addition to resolving the port congestion, India announced the removal of retaliatory tariffs on almonds in June. The impact of reduced tariffs will likely take time to filter through to higher grower prices. The step is a positive development for the industry,
nonetheless. India is the largest export market for U.S. almonds, and per capita consumption continues to rise in the country. There are also macroeconomic tailwinds likely to boost global demand for almonds. A modestly weaker U.S. dollar has made U.S. almonds relatively more affordable globally, and almond shipments have benefited. Export volumes through July nearly matched last year’s exports despite the smaller crop produced this marketing year.
An important caveat to the rebound in export sales is that U.S. almonds have been priced to move. The average export price for almonds had dropped to $1.85 per pound by February, the lowest level since 2010. For context, almond export prices peaked above $4.00 per pound in 2015 and have decreased since then. Sharp price declines in 2016 and 2020 were followed by only moderate rebounds before prices continued moving lower. And while export prices do not fully reflect farmgate prices, they provide a timely reference point. The USDA currently projects that the 2022 almond crop will average $1.40 per pound to the producer, which would be the lowest price in over 20 years. The 20% reduction in India’s tariff rate this summer should
 U.S. Almond Production
Source: USDA NASS
U.S. Almond Production
Source: USDA NASS
Marketing Year Exports: August-May
Source: USDA Foreign Agricultural Service
Average Export Price
Source: USDA Foreign Agricultural Service
help boost the average export price, but the price movement will likely occur gradually.
Producers have responded to the constant pressure on profitability over the past several years. New almond acres planted in California totaled 11,160 in 2022, which is 10,000 fewer acres than in 2021. This marked the seventh consecutive year that new almond acres planted

declined relative to the year before. While the number of newly planted acres has dropped, total bearing acreage continues to increase as already-planted non-bearing trees are continuing to mature even as planters pump the brakes. Almond trees take approximately three to five years to reach full maturity and prime yields. This biological attribute can result in a significant lag between rising prices and producers delivering more almonds to market. Yet even when almond prices decline, producers are often reluctant to remove almond groves, given the significant

upfront costs and time required to establish orchards. A reluctance to pull almond trees and reduce supply can therefore prolong a period of oversupply in the almond market. Still, almond trees have a relatively finite life and begin to see yields drop 20 to 25 years after planting. Therefore, planted acreage from the late-1990s is likely prime to be removed during the current market environment and many producers have done so.

Low prices are not the only factor motivating a pullback in acreage. The Sustainable Groundwater Management Act (SGMA) led many producers to alter their planting decisions years ago in anticipation of reduced water availability. Drought conditions over the past several years likely accelerated these decisions as producers shifted acreage to less water-intensive or no crops.
The almond industry is no stranger to swings in profitability. Historically, a spike in prices has been followed by periods of tight margins, a common theme across the agricultural sector. Almond producers have increased production faster than global appetites have grown for the commodity, at least at the previous price levels. The resulting abundance of almonds may continue to weigh on farm profitability in the near term. The removal of retaliatory tariffs by India should lift prices moderately in the short term. Looking further ahead, though, the pullback in newly planted acreage will likely provide support for prices in the years to come.
 California Almond Acres Planted by Year
Source: USDA NASS
California Almond Acres Planted by Year
Source: USDA NASS
23, 24, 25, 26, 27, 28, 29
Strong exports and limited expansion in the dairy sector helped keep inventories in check over the last two years, resulting in relatively high profitability. Export demand has recently waned, though, leading to a significant price decline for some dairy components. Setting new milk price records for the second consecutive year is unlikely, but modest inventories and limited expansion in the sector are likely to support prices.
At face value, the U.S. dairy sector has benefitted from three consecutive years of solid profitability. Initial struggles to move milk during the pandemic were soon offset by large government purchases, substantial domestic displacement, and robust global demand. The all-milk price received hovered around the $20 per hundredweight mark for much of 2020 and 2021 before surging in 2022. The monthly all-milk
price peaked in May 2022 at $27.20, surpassing the previous record of $25.70 set in 2014. Milk prices have since trended lower, largely in tandem with other commodity prices, but remain well above the historical average.
Much of the strength in milk prices over the past several years has been attributable to solid export demand. Surging exports of whey, milk powders, and cheese helped lift U.S. dairy exports to record levels in 2022. Over $5.1 billion of whey and other dried milk powders were exported in 2022, an export value 43% higher than the previous high
Dairy Exports: 12-Month Rolling Sum

Source: USDA Foreign Agricultural Service

Source: USDA National Agricultural Statistics Service
in 2014. Fluid milk is generally cost-prohibitive to ship as it is over 85% water. Instead, fluid milk is typically first processed into cheese and other products to be sold abroad. These products are high in protein and used for everything from baking ingredients to animal feeds.
Greater global demand for dairy products has been a critical component of U.S. dairy sector profitability. Exports constitute approximately 20% of annual U.S. dairy production, and that proportion continues to grow. The burgeoning export market for whey has also been an excellent complement for U.S. cheese producers. Similar to cottonseed, whey was historically discarded as a useless byproduct. However, the development of markets for both of these byproducts has led to greater profitability for producers and processors.
Strong exports alongside stable production have helped prevent a significant build-up in U.S. dairy inventories. Whey benefitted significantly from export demand, and domestic inventories were 8% lower in May 2023 than the prior year.

Meanwhile, the rolling inventory of butter has dropped to pre-pandemic levels after spiking 27% between 2019 and 2021. Cheese constitutes the bulk of dairy cold storage inventories and has trended higher for the past 20 years. Still, cheese inventories are a far cry from the burdensome levels that sparked massive government purchases during the early-1980s. All told, strong exports have helped keep dairy inventories in check and provided a lift to dairy producer prices.
Beyond strong exports, dairy inventories remain subdued due to an overall moderation in dairy production. U.S. milk production was flat in 2022, with rolling 12-month milk production declining for the first time since 2010. This time, low prices did not motivate the decline in U.S. milk production. The average Class-III milk price from 2009 through 2010 was $14.41 per hundredweight (cwt) whereas it averaged $21.96 per cwt in 2022. Instead, milk producers faced sharply higher feed costs. The USDA’s milk-to-feed price ratio peaked at 2.13 in 2022, well below the 20-year average of 2.25 and the peak in 2009 at 2.42. This suggests
Source: USDA National Agricultural Statistics Service
dairy producers have not been able to capitalize on historic milk prices fully and partially explains the limited expansion in the sector.
Beyond high feed costs, expansion in the dairy sector has been limited due to the headwinds of higher financing and building costs. The Federal Reserve has tightened monetary policy drastically over the past year and appears committed to a higher interest rate environment until inflation remains subdued. As a result, financing costs have increased significantly within the agricultural space. The interest expense to finance a $1,000,000 dairy expansion increased 32% over the last year. Meanwhile, that same expenditure also pays for a more minor expansion today as the tight labor market and surging material prices have driven up the cost of building.
Slumping dairy prices have been a concern for dairy producers in 2023. Class-III milk futures
dipped below $14.00 per cwt in July for the first time since 2020. Still, there is reason for optimism. The USDA projects a limited increase in dairy production over the coming years. Total milk production is forecast to increase by 1% in 2023 and 2024, with much of the growth coming from more productive cows. Exports are also likely to continue benefitting from reduced production among competing exporters. Production is forecast to decline in New Zealand and the EU this year, both regions which compete directly with U.S. exports. These dynamics should prevent a buildup of dairy inventories and support prices. As a result, the USDA forecasts an all-milk price of $19.95 and $19.35 per cwt in 2023 and 2024, respectively. While lower than 2022, these prices would exceed historical averages and should help offset elevated feed costs.

Amidst the broad success of U.S. agricultural exports, surging imports of fresh fruits and vegetables have helped tilt the U.S. from a net agricultural exporter to a net importer. The U.S. agricultural sector has historically benefitted from expanded trade flows. However, embracing imports while also supporting domestic produce growers remains a delicate balance.
The U.S. agricultural sector ran a trade surplus for over 60 years leading up to 2020. Over that period, an expanding global middle class lifted demand for annual crops, livestock products, and many other U.S. agricultural products. Yet while U.S. agricultural exports continue to trend higher, imports have also grown substantially. Among the categories, imports of fresh fruits and vegetables have increased the fastest. The growth has been motivated by a combination of consumer preferences for greater fresh produce availability and lower production costs in other countries. Currency fluctuations also play a role as the sharp appreciation of the U.S. dollar from 2020
to 2022 made imports relatively more affordable. All in, the resulting difference between imports and exports has expanded rapidly over the past 20 years. Yet, while exports of fresh fruits and vegetables have grown slower than imports, foreign markets remain a critical source of demand for many U.S. produce growers.
The growth of fresh fruit and vegetable imports has varied across crops. Some produce imports reflect crops that are not well suited to be commercially produced in the U.S. For example, a small number of acres of bananas and avocados are grown today in a few southern states.
Source: USDA Foreign Agricultural Service
Source: USDA Agricultural Marketing Service
However, these crops are vastly more productive when grown in optimal climates such as Mexico, Guatemala, and elsewhere. As a result, banana import volumes are relatively steady throughout the year. Conversely, some commodities are imported in significant volumes from South America during the Northern Hemisphere winter. For other agricultural commodities, greater import

volumes reflect the cost of production difference between producers in the U.S. and elsewhere.
Differences in labor costs have contributed to a shift in where U.S. groceries originate. Tomatoes are one of the most labor-intensive crops grown in America. For comparison, harvesting one acre of tomatoes may require upwards of 20 person-hours.
 Vine Ripened Tomato Price: 12-month Trailing Average
For almonds or corn, harvesting one acre might take 1 hour or 5 minutes, respectively. Mechanized corn harvesters and almond shakers are clearly to credit for the difference. Still, the magnitude of the difference in labor requirements has spurred a shift in tomato production to areas with lower wages. As recently as the 1990s, U.S. tomato growers supplied over 80% of domestic consumption. Today, nearly three-quarters of tomatoes consumed in the U.S. originate in Mexico. A prevailing reason for the shift has been cheaper labor costs in Mexico. The average monthly salary for agricultural workers in Mexico was approximately $180 in Q1 2023. This was over ten times less than the minimum monthly salary of $1,901 for H2A workers.
The U.S. and Mexico have adopted measures to address concerns regarding the labor cost difference between the two countries. One mechanism was adopting a reference price in the 1996 Tomato Suspension Agreement. Reference prices act as a floor on Mexican tomato prices if they are exported to the U.S. and have been updated occasionally to better reflect market conditions. Higher reference prices enacted over time, including in 2019, have helped relieve pressure on domestic tomato prices. The trailing average tomato price dropped as much as 23% between 2010 and 2017 but has since started
Index: Import Volumes by Month
Source: USDA Agricultural Marketing Service
trending higher. Higher prices have helped domestic growers, but challenges remain. Production costs for many U.S. growers have increased faster than tomato prices in recent years, putting additional pressure on margins. Not all imports can be viewed through a lens of competition between foreign and domestic growers. For some fresh fruits and vegetables, imports have helped spur demand. For example, imports of blueberries from South America have skyrocketed over the last decade. Producers in Chile, Peru, and elsewhere have boosted production to ship primarily to the U.S. during the non-primary growing season in the Northern Hemisphere. Relative to imports of bananas, shipments of blueberries are much more volatile, spiking in winter before trailing off in the spring and summer. Consumers have greatly welcomed the increased availability of high-quality blueberries throughout the year. U.S. blueberry consumption approached one billion pounds in 2021, nearly nine times the volume consumed per capita in 2000. A greater ability to buy fresh products year-round likely played a role in shifting consumer preferences in favor of blueberries.

Domestic production and imports have both increased to supply the rising demand. U.S. blueberry production increased 23% from 2011 to 2021. While the increase is sizeable, imports have grown faster, surpassing domestic blueberry production by 2015. Even with the import surge, blueberry prices have remained remarkably robust. Farmgate blueberry prices increased the last four years and were 10% higher last year than the longterm average. The story is similar for raspberries. Greater domestic production has been more than offset by the 563% increase in raspberry imports since 2011. At the same time, farmgate raspberry prices have remained elevated after setting a new record in 2021.
Greater availability throughout the year is only one factor behind the increase in domestic consumption. The stability of retail prices has also increased as a result of imports. Historically, retail berry prices were significantly higher at the beginning and tail-end of the growing season in the Northern Hemisphere. Overlapping production with the Southern Hemisphere during these periods has reduced price volatility, and the final
marketing year average prices have increased over time due to strong retail demand. Looking ahead, blueberry and raspberry growers can find confidence in the long-term shift of consumer preferences. Fresh fruit consumption increased by 9% per capita over the last decade and continues to trend higher.
Trade flows go both ways, and many U.S. fruits and vegetables are exported in significantly higher quantities than they are imported. Apples are a prime example and may see a sizeable lift in export demand this year due to recent market developments. The U.S. exported 1.5 billion pounds of apples in 2022, or approximately 15% of total production. While significant, last year marked the fourth straight year of declining apple exports, which had previously peaked above 2.1 billion pounds. Several factors were behind the decline. One of the largest was India’s placement of retaliatory tariffs on U.S. apples in response to U.S. trade restrictions. The impact of the tariffs

was immense. India had grown into the secondlargest market for U.S. apple exports, importing 324 million pounds in 2018. By 2022, that volume declined 97% to under 9 million pounds, due mainly to retaliatory tariffs.
The outlook for apple exports has dramatically improved following India’s repeal of retaliatory tariffs. In June 2023, India agreed to lift retaliatory tariffs on numerous U.S. crops, including apples. The move was a significant positive breakthrough for apple growers. Export volumes to India will likely take time to return to pre-2019 levels. Still, additional demand from India will likely boost demand for U.S. apples and provide a lift to prices. Initial estimates suggest the 2023 apple crop will be the smallest since the 2012 growing season. The smaller crop and greater export demand may cause apple prices to continue their ascent and lift producer revenues.

Trade frictions may have disrupted U.S. apple shipments over the past several years, but exports remain a significant growth opportunity. Over the past decade, one positive development has been the continued introduction of newer, better-tasting apple varieties. Unlike some agricultural commodities, apple characteristics and quality can vary significantly across different
varieties. Historically, apples bred for durability during transportation often sacrificed on taste and other traits. An emphasis on addressing this discrepancy has resulted in numerous new varieties of apples introduced since 2010 that boast excellent taste traits while retaining a reasonable amount of transportation hardiness. The shift has reinvigorated domestic apple consumption, and consumers abroad may also develop a taste for these new apple varieties. An additional plus for U.S. growers is that the genetics behind these newer apple varieties are often protected, potentially limiting their replication abroad.
While fresh fruit and vegetable exports are projected to see a pullback in 2023, imports are expected to continue their growth trajectory. The growth of these imports has led to significant challenges for some domestic growers while creating opportunities for others. Overall, farmers that embrace and adapt to shifts in where produce is grown could be more likely to thrive in the long term.
Monthly Apple Export Volumes: 12-month Trailing Average Source: USDA Agricultural Marketing Service
U.S. livestock producers continue to capitalize on the rising global demand for protein. Export growth has allowed producers to expand their operations faster than domestic consumption alone would have justified. The path higher has not always been linear, but further increases in exports are likely as global incomes continue to rise. This bodes well for producers looking to continue growing their operations and the lenders who help finance them.
Pork producers in the U.S. pulled back on output in 2022 due to weaker prices and elevated input costs. While production dropped, pork exports remained robust and the momentum continued. Through May, U.S. pork exports were 13% higher by volume than in 2022, even in the face of a pullback in pork demand from China.
At first glance, a decline in pork exports to China may seem surprising. China was the number one export market for U.S. pork as recently as 2020, before shipments from the U.S. declined 28% and 20% annually in 2021 and 2022, respectively. But it hasn’t always been this way; in fact, the recent decline has primarily been a reversion to trendline growth.
A confluence of factors starting in 2018 had led to a sharp uptick in pork exports to China. First, an African Swine Fever (ASF) outbreak caused Chinese pork production to decline by 21%
and 15% in 2019 and 2020, respectively. As the largest pork-consuming country in the world, the outbreak led to a greater reliance on imports to backfill China’s pork supply. On top of the supply disruption, the U.S. and China agreed in January 2020 to a Phase One trade agreement that included lofty agricultural purchase commitments by China. The combined impact of reduced supplies and greater demand led to a surge in U.S. pork exports to China in 2020.
Pork exports to China have since trended lower following the conclusion of the trade agreement and containment of ASF. Domestic pork production in China surpassed 55 million metric tons (MMT) last year for the first time since 2015 as pork producers restocked the domestic herd. Despite the bump in supply, shipments of U.S. pork to China remain higher than pre-2018 levels and likely reflect long-term demand growth.
While exports to China have moderated, Mexico, South Korea, and numerous other countries continue to increase purchases of U.S. pork.
Source: USDA Foreign Agricultural Service
Chinese Pork Production
Source: USDA FAS Production, Supply and Distribution
Nearly 50 countries increased purchase volumes in 2022, providing support for prices during a period of profit margin compression. The favorable start to the year, combined with a modestly weaker dollar, suggests pork exports will remain strong in 2023.
U.S. beef exports set a record in 2022, surpassing the previous high-water mark from 2021. Exports increased 11% and 3% in 2022 by value and

volume, respectively. However, a shrinking U.S. beef cattle herd now represents a headwind to maintaining this momentum. The U.S. beef cattle herd experienced the largest contraction over the past year since the late 1980s: First, an intense drought across the Pacific Northwest caused a liquidation of cattle herds in Montana and Idaho. This was followed by drought conditions across the Southern Plains, which hindered pasture growth and reduced hay production. With limited hay availability and elevated feed costs, many producers chose to sell cows and reduce their herd size. After a temporary uptick, U.S. beef production is now forecast to decline 5% in 2023

due to fewer cattle. With less beef being produced and continued robust retail demand, exports are forecast to drop 11% by volume in 2023.
USDA economists expect global competitors to try to capitalize on declining U.S. beef exports this year. Brazil in particular competes heavily with the U.S. and continues to ship greater volumes of beef abroad. Brazilian beef exports are forecast to be twice as large as the U.S. this year despite Brazil producing 13% less beef. Historically,
there has been a significant difference in quality between Brazilian and U.S. beef. Brazilian beef is generally perceived as lower quality in international markets and has accordingly been cheaper. This lower price point helped fuel the growth in Brazil’s export volumes. Given the difference in quality, though, the U.S. is likely to recapture market share of the global beef trade when domestic beef production rebounds. Still, competition from Brazil is likely to grow.
The global rising popularity of chicken continues to benefit U.S. producers. Despite the old joke of complimenting food by saying it “tastes like chicken,” consumer palates have demonstrated a clear preference for the real thing. In 2016, poultry surpassed pork as the number one consumed meat globally per capita. This trend has continued as poultry expanded its lead in the years since. U.S. poultry producers both contributed to this trend and benefitted from it. By focusing on the efficiency
of poultry production, U.S. producers helped drive down the cost of producing poultry. In turn, this more affordable protein source has contributed to greater export demand. U.S. poultry exports neared $6 billion in 2022, 14% higher than the previous record. And while exports increased to most countries last year, export markets outside North America were the most significant drivers.
Before the signing of NAFTA in 1993, Japan held the title of the largest export destination for U.S. poultry products. NAFTA changed that dynamic, and exports to Mexico and Canada skyrocketed through the 1990s and 2000s. However, export
 Non-North American Demand Fueling Growth of U.S. Poultry Exports
Beef Exports by Country
Source: USDA Foreign Agricultural Service
Non-North American Demand Fueling Growth of U.S. Poultry Exports
Beef Exports by Country
Source: USDA Foreign Agricultural Service
volumes to Mexico and Canada have remained relatively flat for the past decade. This is mainly due to import quotas in these countries designed to protect domestic production. Indeed, Mexico’s domestic production has increased significantly, rising 36% between 2013 and 2022. Beyond greater domestic production, though, Mexico has increasingly looked to source poultry imports from countries outside the U.S. Chile and Brazil have increased exports to Mexico. In contrast, U.S. exports have stayed nearly flat.

Tepid demand growth from Mexico has not derailed the trajectory of U.S. poultry exports. Instead, growth has been fueled by a combination of smaller markets. Cuba, for example, has emerged as the fourth largest export destination for U.S. poultry products. Cuba imported 277 thousand metric tons of U.S. poultry last year, nearly quadrupling the 2003 import volume. Relative to last year, poultry exports started 2023 slow but have picked up momentum mid-year. The sector could benefit over the long term if successes like the increased exports to Cuba can be replicated in other markets.
 U.S. Poultry Exports Outside of North America


Jackson Takach, Chief Economist, is a Kentucky native whose strong ties to agriculture began while growing up in the small farming town of Scottsville. He has since dedicated a career to agricultural finance where he can combine his passion for rural America with his natural curiosity of the world and his strong (and perhaps unrealistic) desire to explain how we interact within it. He joined the Farmer Mac team in 2005, and has worked in the research, credit, and underwriting departments. Today, his focus at Farmer Mac currently includes quantitative analysis of credit, interest rate, and other marketbased risks, as well as monitoring conditions of the agricultural economy, operational information systems analysis, and statistical programming. He holds a Bachelor’s degree in economics from Centre College, a Master’s degree in agricultural economics from Purdue University, and a Master’s of Business Administration from Indiana University’s Kelley School of Business.
Blaine Nelson is the Senior Economist on the Strategy, Research, and Analytics team at Farmer Mac. In his role, he analyzes trends within America’s agricultural sector, with areas of focus including farmland values, commodity prices, interest rates, and agricultural sector profitability. He disseminates this information to borrowers and lenders to help keep them well-informed about the environment they operate in and to help guide their decisions. Blaine was raised on a commercial row crop and dairy farm in northern Minnesota and went on to earn a bachelor’s degree in Applied Economics from the University of Minnesota and a master’s degree in Agricultural and Applied Economics from the University of Illinois at Urbana-Champaign.
As Executive Vice President – Chief Business Officer, Zack leads the vision, development, and go-to-market strategy of the Farmer Mac brand. He also oversees the company’s Agribusiness activities, including the business development and marketing efforts for its foundational lines of business that provide agricultural lenders across the country with financial solutions and effective risk mitigation tools that allow farmers, ranchers, and agribusinesses access to flexible and affordable credit. In this role, he oversees the company’s expansive loan portfolio, partner and business development strategies, product innovation and standardization, and marketing and corporate communications.


Brian Brinch is Farmer Mac’s Senior Vice President – Enterprise Risk Officer and is responsible for the maintenance and continuous evolution of an enterprise-wide risk management framework that supports the strategic goals of the organization. He works closely with senior leaders across the organization and with the Board Risk Committee to build upon Farmer Mac’s existing strong and conservative culture of risk management, and helps set the vision and strategy for enterprise-wide risk management. Brian joined Farmer Mac in 2000, and most recently served as Senior Vice President of Rural Infrastructure, where he was responsible for the division’s business development and customer success strategy. Prior to that, he served as Vice President of Financial Planning and Analysis, where he led the development of the company’s strategic planning initiative and guided its financial projections and data analytics.
The Feed is a quarterly economic outlook for current events and market conditions within agriculture and rural infrastructure sectors.
The report is broad-based, covers multiple regions and commodities and incorporates data and analysis from numerous sources to present a mosaic of the leading industry information, with a focus on the latest information from the United States Department of Agriculture and their Economic Research Service.
There are several regularly included sections like weather and major industry segments, but the authors rotate through other industries and topics as they become relevant in the seasonal agricultural cycle. Where the report adds value to readers is through its unique synthesis of these multiple sources into a single succinct report.

We hope you’ve enjoyed this issue.
For media inquiries: Megan Pelaez
Director – Marketing & Communications mpelaez@farmermac.com
For business inquiries: Patrick Kerrigan
Development pkerrigan@farmermac.com
Vice President – BusinessThe information and opinions or conclusions contained herein have been compiled or arrived at from the following sources and references:
1. Global Agricultural Trade System, USDA Foreign Agricultural Service (https://apps.fas.usda.gov/GATS/ default.aspx)
2. July WASDE Report, USDA, July 2023. (https://www. usda.gov/oce/commodity/wasde)
3. Production, Supply, and Distribution, USDA Foreign Agricultural Service. (https://apps.fas.usda.gov/psdonline/ app/index.html#/app/advQuery)
4. June Acreage Report, USDA, June 2023. (https://usda. library.cornell.edu/concern/publications/j098zb09z)
5. Crop Progress, USDA, July 2023. (https://usda.library. cornell.edu/concern/publications/8336h188j)
6. Food and Agriculture Organization of the United Nations, FAOSTAT Database (https://www.fao.org/ faostat/en/#home)
7. The World Bank, World Bank Open Data (https://data. worldbank.org/)
8. USDA Foreign Agricultural Service Global Agricultural Trade System (https://apps.fas.usda.gov/ gats/default.aspx)
9. The Economist, Global Food Security Index (https:// impact.economist.com/sustainability/project/food-securityindex/)
10. Pew Research Center, Eight-in-ten Indians Limit Meat in their Diets (https://www.pewresearch.org/shortreads/2021/07/08/eight-in-ten-indians-limit-meat-in-their-dietsand-four-in-ten-consider-themselves-vegetarian/)
11. USDA NASS, Land Values Summary Report (https:// downloads.usda.library.cornell.edu/usda-esmis/files/ pn89d6567/9w033j15z/2v23xb225/land0823.pdf)
12. U.S. Bureau of Labor Statistics, Consumer Price Index (https://www.bls.gov/cpi/)
13. Federal Reserve Bank of Kansas City, Ag Credit Survey (https://www.kansascityfed.org/agriculture/ag-creditsurvey/)
14. Basha, A., Zhang, W., & Hart, C. (2021). The impacts of interest rate changes on US Midwest farmland values. Agricultural Finance Review, 81(5), 746-766.
15. U.S. Drought Monitor, National Drought Mitigation Center. (https://droughtmonitor.unl.edu/)
16. County Average Temperature Anomaly, National Centers for Environmental Information. (https://www. ncei.noaa.gov/access/monitoring/climate-at-a-glance/county/ mapping/110/tavg/202306/3/anomaly)
17. Water Temperature Table of the Eastern Gulf of Mexico, National Centers for Environmental Information. (https://www.ncei.noaa.gov/access/coastalwater-temperature-guide/egof.html)
18. June 2023 ENSO update: El Niño is here, National Oceanic and Atmospheric Administration. (https:// www.ncei.noaa.gov/access/monitoring/climate-at-a-glance/ county/mapping/110/tavg/202306/3/anomaly)
19. Global Agricultural Trade System, USDA Foreign Agricultural Service, (https://apps.fas.usda.gov/GATS/ default.aspx)
20. 2023 California Almond Objective Report, USDA National Agricultural Statistics Service, July 2023. (https://www.nass.usda.gov/Statistics_by_State/California/ Publications/Specialty_and_Other_Releases/Almond/ObjectiveMeasurement/2023almondOM.pdf)
21. June Almond Position Report, California Almonds. (https://www.almonds.com/tools-and-resources/crop-reports/ position-reports)
22. 2022 California Almond Acreage Report, USDA National Agricultural Statistics Service. (https://www. almonds.com/sites/default/files/2023-04/2022_NASS_Acreage. pdf)
23. Global Agricultural Trade System, USDA Foreign Agricultural Service, (https://apps.fas.usda.gov/GATS/ default.aspx)
24. European Union: Dairy and Products Semi-annual, USDA Foreign Agricultural Service, May 2023. (https:// www.fas.usda.gov/data/european-union-dairy-and-productssemi-annual-3)
25. New Zealand: Dairy and Products Annual, USDA Foreign Agricultural Service, November 2022. (https:// www.fas.usda.gov/data/new-zealand-dairy-and-productsannual-8)
26. Federal Reserve Ag Credit Survey Data, Federal Reserve Bank of Kansas City. (https://www.kansascityfed. org/agriculture/agfinance-updates)
27. July WASDE Report, USDA, July 2023. (https://www. usda.gov/oce/commodity/wasde)
28. Livestock, Dairy, and Poultry Outlook: July 2023, USDA Economic Research Service. (https://www.ers. usda.gov/publications/pub-details/?pubid=106950)
29. Feed Grains Database, USDA Economic Research Service. (https://www.ers.usda.gov/data-products/feedgrains-database/)
30. Global Agricultural Trade System, USDA Foreign Agricultural Service. (https://apps.fas.usda.gov/GATS/ default.aspx)
31. H-2A Adverse Effective Wages, U.S. Department of Labor. (https://flag.dol.gov/wage-data/adverse-effect-wagerates)
32. Workers in Farming Activities, Mexico Data, Gobierno de Mexico. (https://www.economia.gob. mx/datamexico/en/profile/occupation/trabajadores-enactividades-agricolas-y-ganaderas?employSelector1=salaryO ption)
33. QuickStats, USDA National Agricultural Statistics Service. (https://quickstats.nass.usda.gov/)
34. U.S. Agriculture Flirting with an Annual Trade Deficit, University of Kentucky. (https://agecon.ca.uky. edu/us-agriculture-flirting-annual-trade-deficit-%E2%80%93first-time-60-years)
35. Food Availability (Per Capita) Data System, USDA Economic Research Service. (https://www.ers.usda.gov/ data-products/food-availability-per-capita-data-system/)
36. Tomato Suspension Agreement, USDA Agricultural Marketing Service. (https://www.ams.usda.gov/services/sci/ fresh-products/tomato-suspension-agreement)
37. Global Agricultural Trade System, USDA Foreign Agricultural Service, (https://apps.fas.usda.gov/GATS/ default.aspx)
38. July WASDE Report, USDA, July 2023. (https://www. usda.gov/oce/commodity/wasde)
39. Livestock, Dairy, and Poultry Outlook: July 2023, USDA Economic Research Service. (https://www.ers. usda.gov/publications/pub-details/?pubid=106950)
40. Feed Grains Database, USDA Economic Research Service. (https://www.ers.usda.gov/data-products/feedgrains-database/)
41. Production, Supply, and Distribution, USDA Foreign Agricultural Service. (https://apps.fas.usda.gov/psdonline/ app/index.html#/app/advQuery)

• 5 tablespoons olive oil, divided
• 1 tablespoon balsamic vinegar
• 1 tablespoon chopped shallot
• 1 teaspoon Dijon mustard
• ½ teaspoon salt, or more to taste
• 4 peaches, halved and pitted
• 4 skinless, boneless chicken breast halves
• 8 cups baby arugula
1. Preheat an outdoor grill for medium-high heat and lightly oil the grate.
2. For the dressing: Whisk 4 tablespoons olive oil, balsamic vinegar, shallot, Dijon mustard, and 1/2 teaspoon salt together in a bowl until well mixed.
3. Brush 1 teaspoon olive oil onto cut-side of peaches.
4. Place peaches, cut-side down, onto grill and cook until heated through, about 4 minutes. Transfer peaches to a plate.
5. Brush remaining oil onto both sides of chicken breasts and season with salt.
6. Cook chicken on the preheated grill until no longer pink in the center, about 4 minutes per side. An instant-read thermometer inserted into the center should read at least 165 degrees F. Slice chicken into thin pieces and cut peaches into 1/2-inch thick pieces.

7. Toss arugula and dressing together in a bowl. Divide dressed arugula among plates; top with peaches and chicken.


By the time the sun rose over the Sutter Buttes, Leticia Hermosillo and the 22-woman work crew she supervises were knee-deep in a Colusa County squash field, separating male and female plants that farmer Mitchell Yerxa grows for seed.

As the day grew hotter, the women sipped water from bottles hanging at their waists. Hermosillo
stationed an orange cooler at the end of a row for refills. Next to the field stood a pair of porta potties and a line of trucks holding more drinking water. A shade trailer—a picnic table and awnings anchored to a flatbed trailer—offered an escape from the sun during breaks.
“That’s how we take care of ourselves and take care of each other,” Hermosillo said.
Every summer, caravans of shade and water line California’s fields, orchards and vineyards, providing heat relief for workers harvesting crops.
Compared to other states, “you definitely notice a difference,” said Angelina Ceja, vice president and chief education officer for Modesto-based AgSafe, which provides heat-safety training for farm labor contractors.
In 2005, following farmworker deaths in the Central Valley, California established the nation’s first heat-safety law for outdoor workers. Since then, California has tightened its Heat Illness Prevention Standard, which remains the most stringent of the few such state laws in effect.
The law includes requirements for shade, water and rest when the temperature rises above 80 degrees. It also mandates an acclimatization process for workers and a reliable line of communication between farms and local emergency services.
“The standards are pretty comprehensive,” said Kent Pinkerton, director of the Western Center for Agricultural Health and Safety and professor of pediatrics at the University of California, Davis, School of Medicine. “California has really taken the issue to heart to make sure that workers are protected.”
Now, after intense heat waves swept much of the country, Democratic lawmakers have introduced bills to direct the Occupational Safety and Health Administration to create an interim national heatsafety standard.
As rising temperatures prompt a push to enact workplace heat-safety laws, California farms offer a picture of what job sites may soon look like throughout the country and across industries.
“We’ve been doing this for a long time,” said Joe Del Bosque, who has farmed in the Central Valley since 1985. “We’re more aware—and we’re trying to make our employees more aware—of these dangers and how to protect themselves.”
During the summers, Del Bosque employs around 150 people to pick and pack melons on his Fresno County farm where the daily high temperature often reaches triple digits.
“The first thing we do is to start as early as possible,” he said. That’s typically around 6 a.m., as soon as it’s light enough to work, with the shift ending at 2:30 p.m. “By the hottest part of the day,” he said, “the workers have left.”
Bryan Little, director of labor affairs for the California Farm Bureau and chief operating officer of Farm Employers Labor Service, a Farm Bureau affiliate, said the logistics of heat-illness prevention for farmworkers requires careful preparation.
Farmers and crew leaders must have plans for keeping water coolers close to crews that move across fields, for transporting shade, water and other equipment on small dirt roads and for contacting emergency personnel in rural areas without reliable cellphone reception.

“There are so many logistical challenges you have to figure out when operating a farm,” Little said. “But in this case, if you mess it up, somebody could be seriously ill or worse. That elevates the level of priority.”
For melon harvest, Del Bosque employs someone to drive around the fields in a truck full of water
A water cooler sits in a Colusa County squash field to provide farm employees with refills, part of safeguards required to prevent heat-related illnesses.and ice. Old cotton trailers, once used to haul the crop to cotton gins, have been outfitted with benches and awnings to serve as mobile rest areas.
While farmers and labor contractors are responsible for equipment and logistics, preventing heat illness in the field also depends on crew supervisors maintaining a safe environment for workers.

“They’re the ones that are responsible for the work to get done, and they also have a huge responsibility to ensure the workers are safe,” said Ceja of AgSafe. “They play a key role.”
Each year, crew supervisors on Del Bosque’s farm complete a two-hour heat illness prevention course, and Del Bosque conducts a 30-minute training with field workers on how to recognize the symptoms of heat illness.
“You see a lot more focus on health and wellness and training and retraining,” said Yerxa, the Colusa County farmer. “It’s not just about having the shade trailers, but making sure that the crew leaders are aware everyone needs to have proper hydration or whatever it is in that moment.”
Last week, Hermosillo, the Colusa County crew leader, walked along the rows of squash, doublechecking the weather forecast on her phone and advising the crew to drink plenty of water and take breaks.
“The only person who knows how they feel is themselves,” she said. “It’s very important that they take care of themselves.”
When the temperature hits 95 degrees, the highest level of the state’s heat-safety standard goes into effect, with more frequent work breaks required.
“You just have to limit your expectations of what work can be done,” Yerxa said. When fast work is needed to save a crop from an untimely rain or unexpected heat wave, “maybe you bring in a larger crew to get through it rather than trying to get more out of each worker,” he said.
Hermosillo, who has worked in the fields of Colusa and Glenn counties for 48 years, said the introduction of California’s heat-safety law “definitely” created safer conditions for farmworkers, adding that the employers she has worked for have taken it seriously.
“The labor contractor is really specific on that,” she said.
Earlier this year, a study on California farmworker health and safety by the University of California at Merced Community and Labor Center found more than 85% of the roughly 1,500 farmworkers surveyed had received heat-illness training. The study also noted areas for improvement, as less than a third of workers could recognize the symptoms of heat-related illness, and nearly a quarter said their worksite rarely or never provided adequate shade during breaks.
For the safety measures to work, organizations such as AgSafe, FELS and the Western Center for Agricultural Health and Safety say farmers, crew leaders and field workers must all commit to them. They also warned that workers paid a piece-rate to harvest crops such as berries or grapes can sometimes be resistant to slowing down, resting and drinking enough water.
“They want to maximize the time they’re working,” Ceja said.
“Doing that in very hot weather,” Pinkerton said, “is going to put them at much higher risk of having
problems with heat exhaustion or heat stroke.”
Overall, there is evidence the efforts of California farmers to protect workers from heat have made a difference. A 2021 study by researchers at UC Los Angeles and Stanford University found that heatrelated injuries for outdoor workers in California fell by roughly a third since the state’s heat-safety law took effect.


“This is something that agriculture here can be proud of,” Del Bosque said. “I’m all for anything that keeps our farmworkers safe.”
(Caleb Hampton is an assistant editor of Ag Alert. He may be contacted at champton@cfbf.com.)
Reprinted with permission for use from the California Farm Bureau Federation.
Hampton, C. (2023) Farms focus on safety amid summer heat, Ag Alert. Available at: https:// www.agalert.com/california-ag-news/archives/ august-23-2023/farms-focus-on-safety-amidsummer-heat/ (Accessed: 01 September 2023).
Every five years, Congress passes the Farm Bill; legislation that addresses everything from crop insurance to nutrition. Items like conservation, forestry policy, and commodity support are also major components of the bill. Its impending passage always seems to bring with it a slight sense of anxiety from the agricultural community, anticipating possible significant changes to regulation, operation, and protection.
Hearings kicked off for the current Farm Bill in Michigan and Arkansas late last year. The current Farm Bill, signed into law in December 2018, will expire on September 30. Senate Minority Leader Mitch McConnell (R-KY) says Congress will deliver a farm bill, but not likely in September. He shared that Congress is running out of working days on the legislative calendar. Despite an earlier start to discussions, committee members have yet to produce a first draft.
So, what happens if the Farm Bill doesn’t get passed in time?
According to FarmBillLaw.org (FBLE), “Some programs would simply lose the funding to operate and effectively shut down. A few key programs would continue more or less as they do now. Others would revert back to outdated permanent law from 1938 and 1949 Farm Bills.” FBLE provides research and recommendations for the Farm Bill through its academic and clinical
program members. Harvard, Duke, and UCLA are a few of the listed members.
If reversion to the 1949 Agricultural Act happens, Successful Farming states that the law, “would boost crop subsidy rates to unaffordable levels, reintroduce planting controls for some crops, and eliminate federal support for soybeans. The price of milk could double.”
It all comes down to Congress taking action - even if that action is voting on an extension.
If the farm bill gets pushed to 2024, there’s a chance it could get tied up in the battle for Congressional control with it being a presidential election year.
What are the hot topics for this upcoming Farm Bill?

According to the most recent Agriculture Census in 2017, specialty crops account for 30% of total U.S. crop sales. This includes 222,000 farms and 350 types of crops. Specialty crop producers, specifically those growing organic, say they’re most interested in expanding the Environmental Quality Incentives Program, or EQIP.
Yolo County organic farmer Jim Durst (as interviewed by AgAlert) said he participates in “very few” federal programs, but he has used EQIP. He said the program has helped him with
cover cropping and installation of underground irrigation systems.
Farmers can receive up to $140,000 from EQIP for implementing conservation practices, including improving irrigation, creating pollinator habitats, and controlling erosion.
“Those (programs) are valuable because they’re long-term investments,” Durst said, adding he would like to see more farm bill dollars go toward helping organic farms go solar or purchase electric tractors and vehicles.
Another major discussion with each new farm bill is crop insurance, specifically ARC (Agriculture Risk Coverage) and PLC (Price Loss Coverage). These payment programs provide financial protections to farmers from substantial drops in crop prices or revenues. Legislation affecting the structure of these programs must be voted on right alongside SNAP (Supplemental Assistance Nutrition Program).
There are key individuals advocating that these two discussions should be split into two different pieces of legislation.
Congressman Austin Scott (R-GA) said recently in an interview with FarmProgress.com, “We can’t have an honest discussion on SNAP benefits and an honest discussion on production agriculture as long as the two are tied together. It becomes an emotional argument.”
While there are many more topics being discussed in regards to the 2023 Farm Bill, we will have to wait until more progress can be made from the committee. The Economic Research Service (ERS)

in the USDA provides many resources on recent research done for items impacted through this legislation. You can read more by visiting https:// www.ers.usda.gov/topics/farm-bill/2023-farm-bill/
References:
Lee, C. (2023) Organic Farmers Consider Wish List for 2023 farm bill, Ag Alert. Available at: https://www.agalert.com/california-agnews/archives/august-23-2023/organicfarmers-consider-wish-list-for-2023-farmbill/ (Accessed: 02 September 2023).
Hart, J. (2023) Split the farm bill, Farm Progress. Available at: https://www.farmprogress. com/farm-policy/split-farm-bill (Accessed: 02 September 2023).
The farm bill is important for specialty crop growers (no date) American Farm Bureau Federation. Available at: https://www.fb.org/focuson-agriculture/the-farm-bill-is-importantfor-specialty-crop-growers (Accessed: 02 September 2023).
Abbott, C. (2023) Farmers doubt there will be a farm bill this year - poll, Successful Farming. Available at: https://www.agriculture.com/ farmers-doubt-there-will-be-a-farm-billthis-year-poll-7568634 (Accessed: 02 September 2023).
What happens if there is no new farm bill by October 1? -- part Two (2018) Farm Bill Law Enterprise. Available at: https://www. farmbilllaw.org/2018/08/29/whathappens-if-there-is-no-new-farm-billby-october-1-part-two/ (Accessed: 02 September 2023).
AgriFinancial is a premier agricultural lender, backed by decades of ag expertise and dedicated to understanding your longterm goals in the face of ever-changing markets.
As a subsidiary of CGB Enterprises, Inc. (an innovative and progressive leader in agriculture since 1969), AgFi takes a comprehensive approach to custom-tailored financial solutions.
Our sales officers are strategically located throughout the country to be able to meet customers on their farms, sit at the kitchen table, identify the producer's individual goals, and find the financial solution that works best for each unique operation.
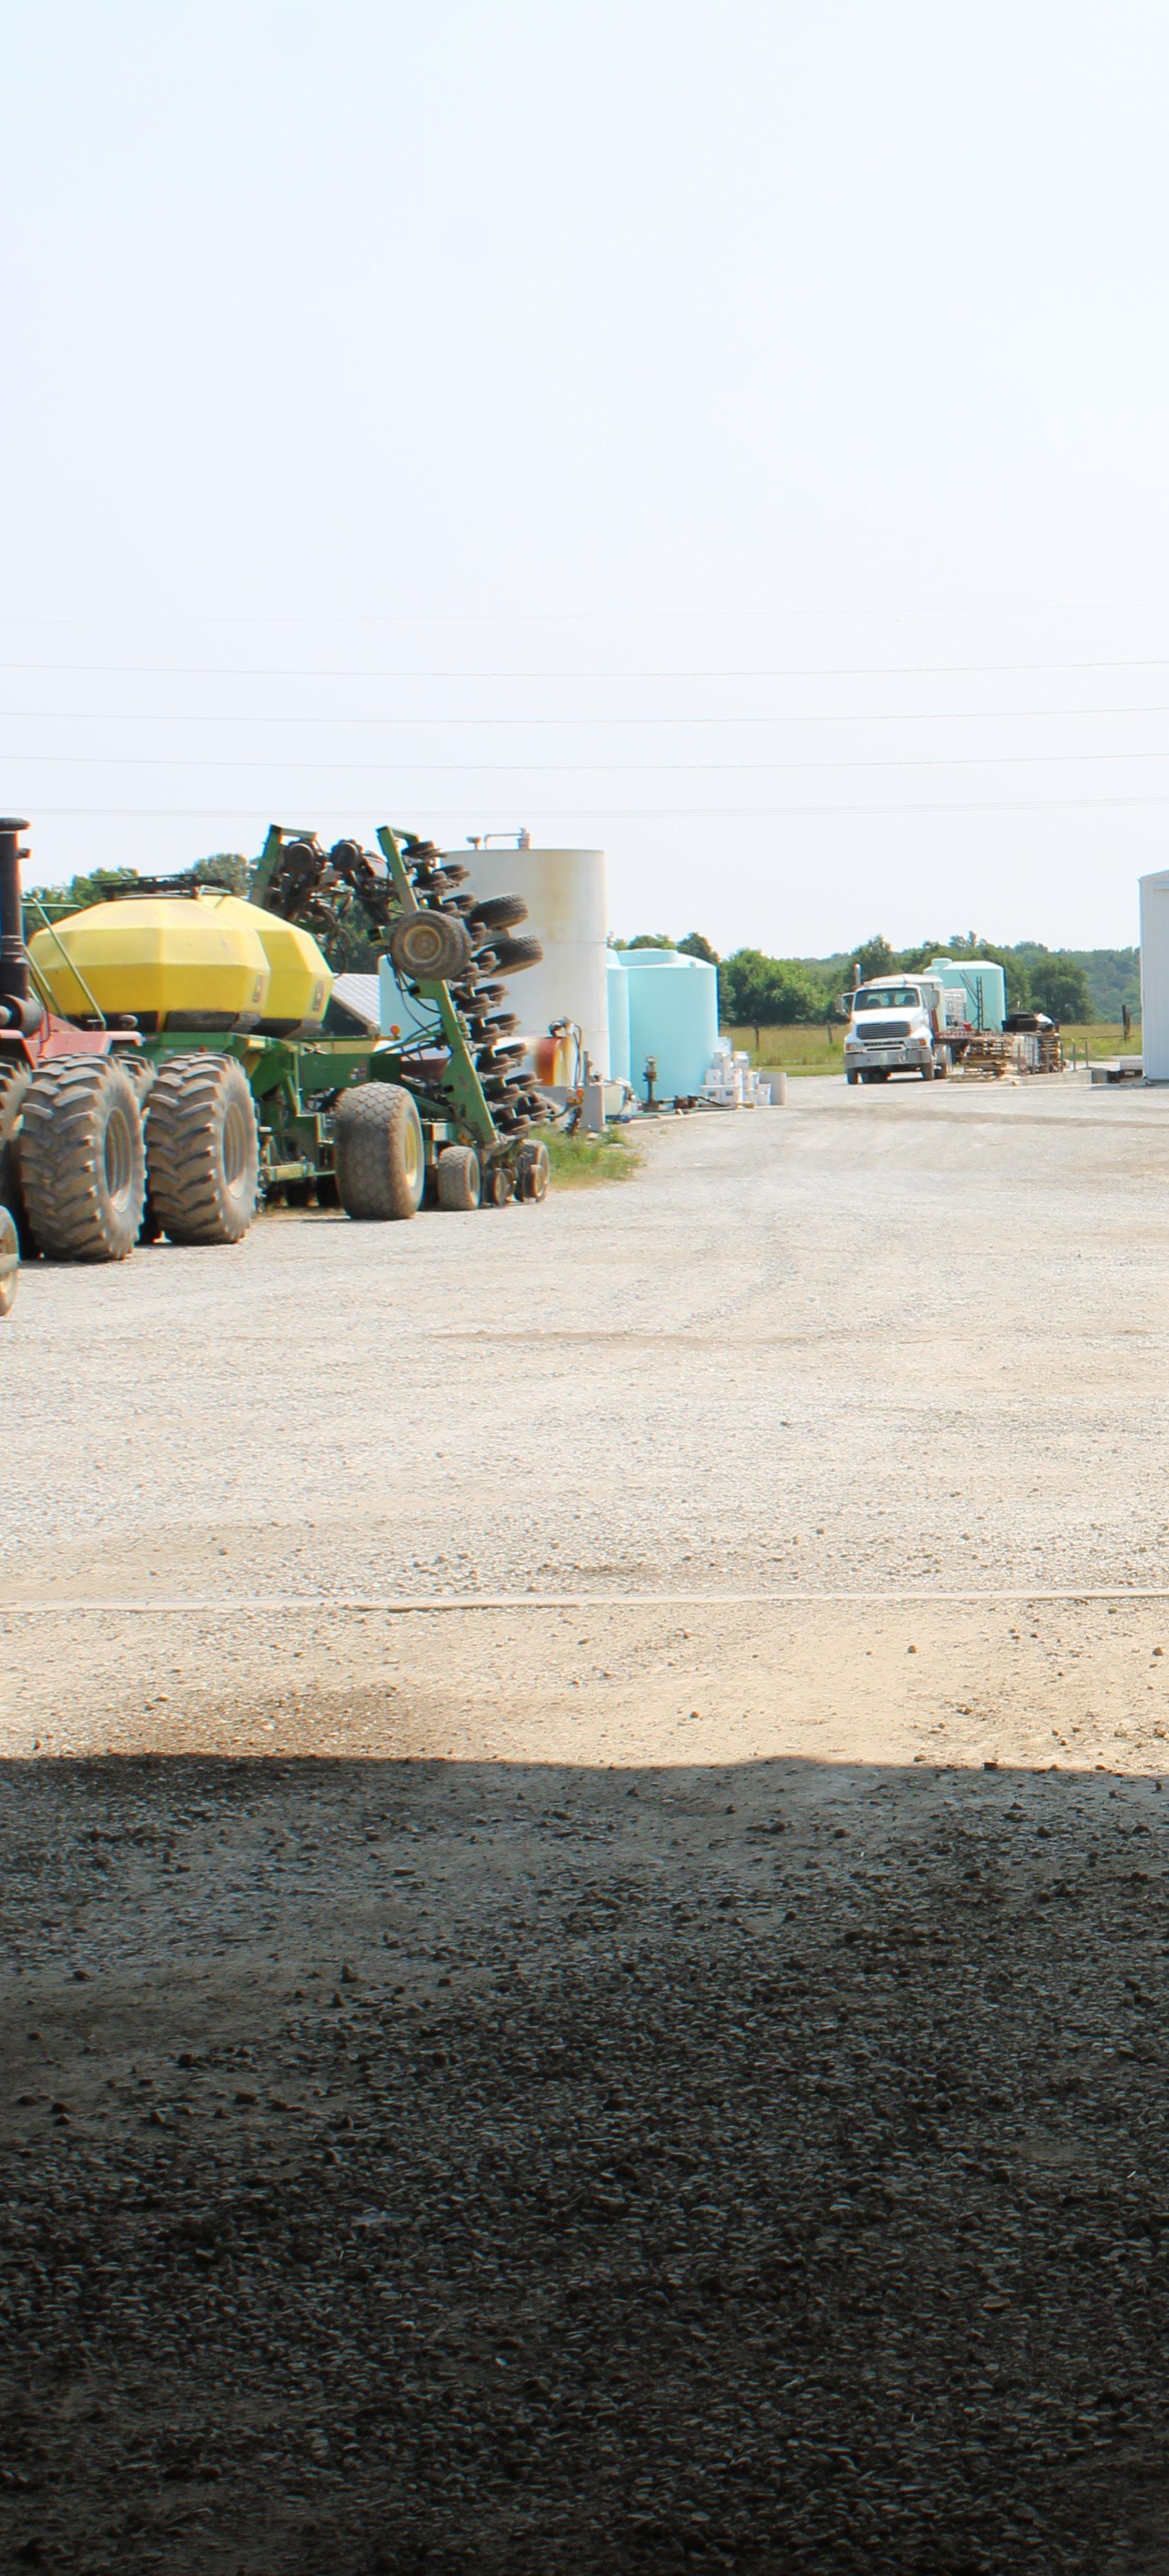
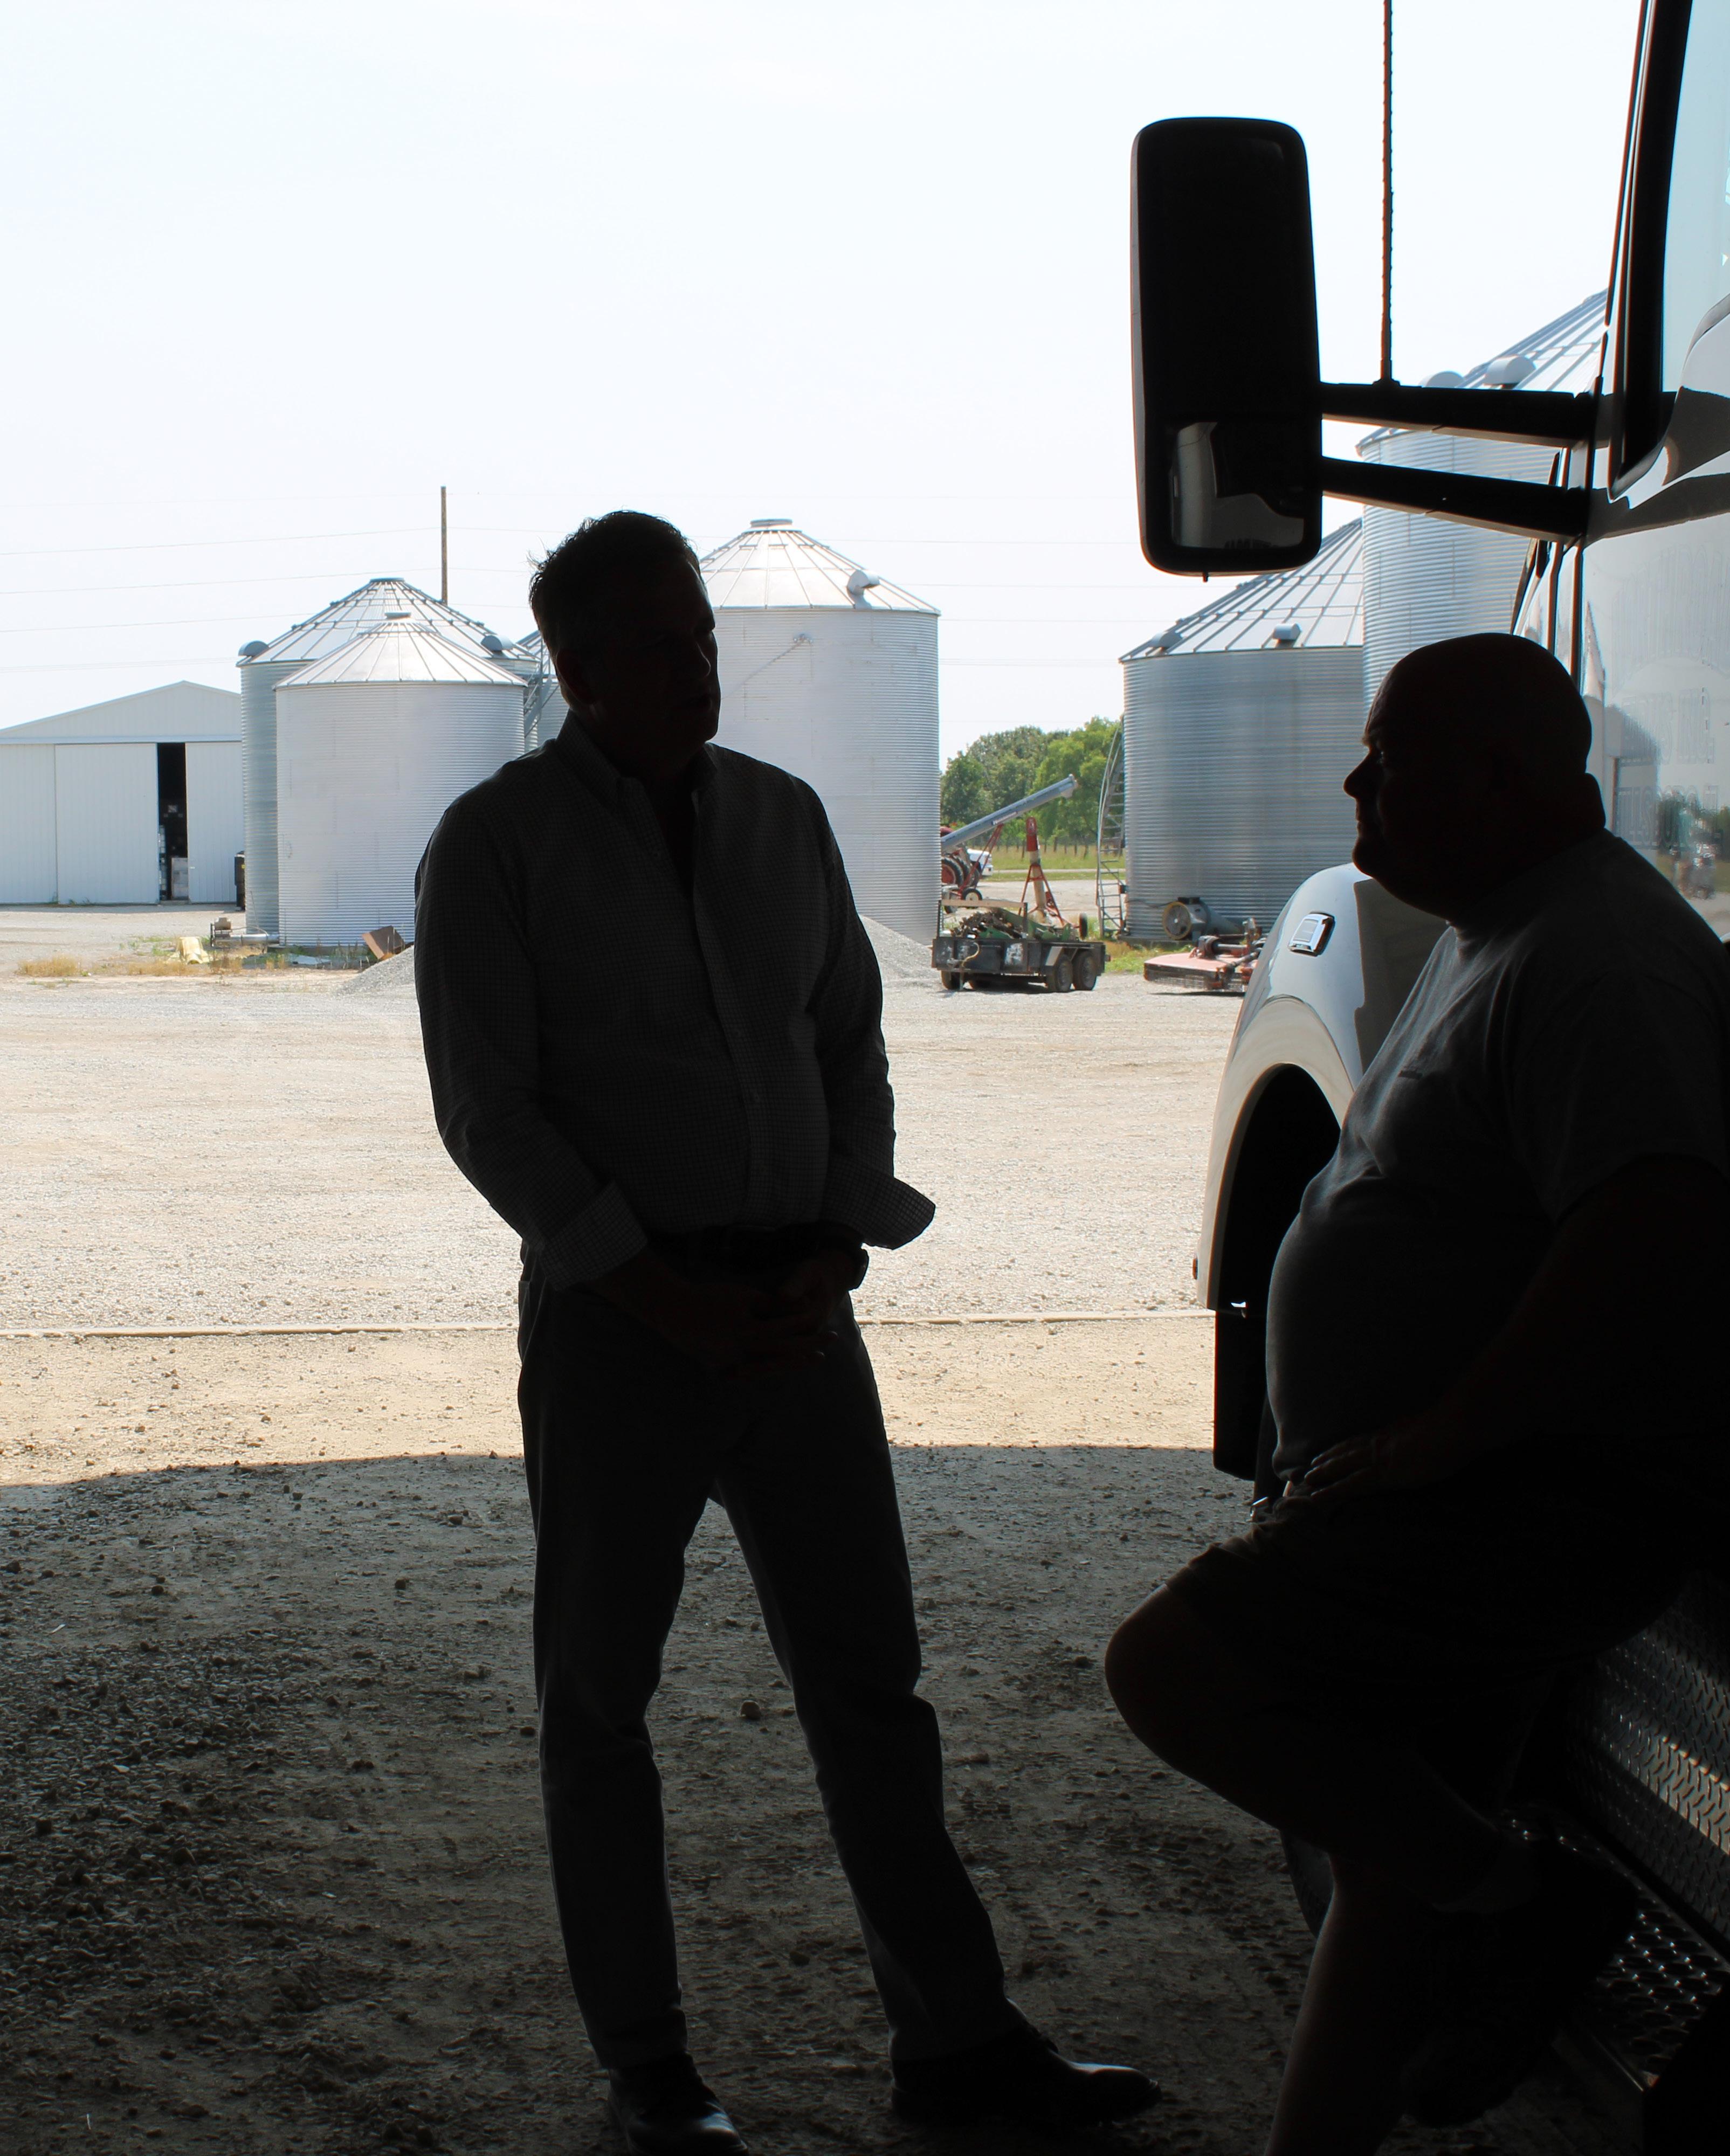
2209 River Rd. Louisville, KY 40206 Phone: 877.548.2622
FinanceInfo@cgb.com www.cgb-agfi.com

Issue No. 9
Trust Our Roots, to Grow Yours.
Seed, Feed and Field is a publication produced by CGB Agri Financial Services, Inc., (“AgriFinancial”). The information and opinions contained herein have been compiled or derived from sources believed to be reliable, but no representation or warranty, express or implied, by AgriFinancial is made as to the accuracy, completeness, timeliness, or correctness of the information, opinions, or the sources from which they were derived. This publication is provided on and with the condition that neither AgriFinancial nor anyone else is, by virtue of this publication or its contents, engaged in rendering investment, legal, accounting, tax, or other professional advice or services. This publication may include “forward-looking statements,” which include projections, forecasts, or expectations of future performance or results, as well as statements or expressions of opinion. No reliance should be placed on any forward-looking statements expressed in this publication. The content of this publication is for general information purposes only and is not to be relied upon or used for any particular purpose. AgriFinancial specifically disclaims any liability for any errors, inaccuracies, or omissions in this publication and for any loss or damage, however arising, that may result from the use of or reliance by any person upon any information or opinions contained herein. Such information and opinions are subject to change at any time without notice, and nothing contained in this publication is intended (nor shall it be construed) as an offer or solicitation with respect to the purchase or sale of any goods, services or securities, including, without limitation, the same by or of AgriFinancial. Seed, Feed and Field features publications, articles and/or reports from others unaffiliated with AgriFinancial, and the views and opinions expressed in these articles or reports do not necessarily reflect those of AgriFinancial. This document may not be reproduced, distributed, or published, in whole or in part, for any purposes, without the prior written consent of AgriFinancial. All copyrights are reserved.